
FISCAL YEAR 2021-2025 FIVE-YEAR FINANCIAL OUTLOOK
Kevin L. Faulconer
Mayor
Kris Michell Chief Operating Officer
Rolando Charvel Chief Financial Officer
Tracy McCraner Department of Finance Director and City Comptroller
Adrian Del Rio Assistant Director
Nicole Chalfant Financial Operations Manager
Vanessa Montenegro Principal Accountant
NOVEMBER 2019
Fiscal Year 2021-2025 Five-Year Financial Outlook
2 The City of San Diego | Department of Finance |
NOVEMBER 201
Disclaimer:
The City files its disclosure documents, including official statements, audited financial statements,
comprehensive annual financial reports, annual financial information, material event notices, and
voluntary disclosures with the Municipal Securities Rule Making Board’s Electronic Municipal Market
Access (“EMMA”) system. The Five-Year Financial Outlook is not filed on EMMA and investors should
not rely upon the Five-Year Financial Outlook to make any investment decisions. The City will provide
the Five-Year Financial Outlook to the rating agencies, its bond insurers and other interested parties,
and welcomes and encourages their careful review of this document. Readers are cautioned that the
numbers presented in this document are the City’s best estimate for the next five years based on facts
and factors currently known to the City and do not represent actual performance. No representation
is made by the City that, as of the date this document is read, there is not a material difference
between the City’s actual performance as of such date and the financial data presented in the Five-
Year Financial Outlook. Certain statements in this document constitute forward-looking statements
or statements which may be deemed or construed to be forward-looking statements. Forward-looking
statements involve, and are subject to known and unknown risks, uncertainties and other factors
which could cause the City's actual results, performance (financial or operating) or achievements to
differ materially from the future results, performance (financial or operating) or achievements
expressed or implied by such forward-looking statements. All forward-looking statements herein are
expressly qualified in their entirety by the abovementioned cautionary statement. The City disclaims
any obligation to update forward-looking statements contained in this document.
Fiscal Year 2021-2025 Five-Year Financial Outlook
3 The City of San Diego | Department of Finance |
TABLE OF CONTENTS
EXECUTIVE SUMMARY ...................................................................................... 5
Summary of Key Financial Data ........................................................................................................................ 5
Report Outline .................................................................................................................................................... 7
BASELINE PROJECTIONS .................................................................................. 9
Baseline General Fund Revenues..................................................................................................................... 9
Property Tax ........................................................................................................................................ 10
Sales Tax .............................................................................................................................................. 15
Transient Occupancy Tax (TOT) ........................................................................................................ 19
Franchise Fees ..................................................................................................................................... 21
Property Transfer Tax ........................................................................................................................ 23
Licenses and Permits ......................................................................................................................... 24
Cannabis Tax ....................................................................................................................................... 24
Fines, Forfeitures, and Penalties....................................................................................................... 25
Revenue from Money and Property ................................................................................................. 26
Revenue from Federal and Other Agencies .................................................................................... 26
Charges for Services ........................................................................................................................... 27
Other Revenue .................................................................................................................................... 28
Transfers-In ......................................................................................................................................... 28
Baseline General Fund Expenditures ............................................................................................................ 31
Salaries and Wages ............................................................................................................................. 32
Retirement Actuarially Determined Contribution (ADC) ............................................................... 33
Employee Flexible Benefits ............................................................................................................... 34
Other Post-Employment Benefits (OPEB) ........................................................................................ 35
Workers’ Compensation .................................................................................................................... 35
Supplemental Pension Savings Plan (SPSP) .................................................................................... 36
Other Fringe Benefits ......................................................................................................................... 37
Supplies ................................................................................................................................................ 38
Contracts .............................................................................................................................................. 38
Information Technology .................................................................................................................... 39
Energy and Utilities ............................................................................................................................. 40
Reserve Contributions ....................................................................................................................... 41
Other Expenditures ............................................................................................................................ 42
Charter Section 77.1 – Infrastructure Fund ..................................................................................... 42
CRITICAL STRATEGIC EXPENDITURES ........................................................... 45
Total Critical Strategic Expenditures .............................................................................................................. 45
City Clerk ............................................................................................................................................................ 46
City Treasurer ................................................................................................................................................... 46
Citywide Program Expenditures ..................................................................................................................... 47
Environmental Services ................................................................................................................................... 47
Fiscal Year 2021-2025 Five-Year Financial Outlook
4 The City of San Diego | Department of Finance |
Fire-Rescue ........................................................................................................................................................ 48
Fleet Operations ............................................................................................................................................... 49
Homeless Programs and Services .................................................................................................................. 50
Information Technology .................................................................................................................................. 51
Library ................................................................................................................................................................ 51
Parks and Recreation ....................................................................................................................................... 52
Performance and Analytics ............................................................................................................................. 52
Police .................................................................................................................................................................. 53
Real Estate Assets – Facilities Services .......................................................................................................... 54
Department of Sustainability .......................................................................................................................... 54
Transportation and Storm Water ................................................................................................................... 55
POTENTIAL MITIGATION ACTIONS ............................................................... 57
One-Time Resources ........................................................................................................................................ 57
Budget Reductions ........................................................................................................................................... 57
OTHER ASSUMPTIONS AND CONSIDERATIONS ........................................... 59
Ballot Measures ................................................................................................................................................ 59
MOUs and ADC ................................................................................................................................................. 59
Recession ........................................................................................................................................................... 59
CONCLUSION .................................................................................................. 61
Attachment 1: FY 2021-2025 Five-Year Financial Outlook ............................................................................. i
Attachment 2: One-Time Resources and Expenditures ............................................................................... iii
Attachment 3: New Facilities ............................................................................................................................. v
Fiscal Year 2021-2025 Five-Year Financial Outlook
5 The City of San Diego | Department of Finance |
EXECUTIVE SUMMARY The City of San Diego Fiscal Year 2021-2025 Five-Year Financial Outlook Report (Outlook) is a long-
range fiscal planning guide and serves as the framework for the development of the Fiscal Year (FY)
2021 Adopted Budget for the General Fund. The purpose of the Report is to address and prioritize the
City’s long-range needs as forecasted.
The Outlook focuses on baseline revenues and expenditures, including quantifying new costs that are
critical to accomplishing the City’s strategic goals over the next five-year period. These goals include:
• Provide high quality public service
• Work in partnership with all communities to achieve safe and livable neighborhoods
• Create and sustain a resilient and economically prosperous City with opportunity in every
community
The Outlook is a planning tool to assist in budget decisions related to the allocation of General Fund
resources required to meet the City’s strategic goals that are critical to core services; therefore, should
not be considered a budget. The Outlook does this by estimating baseline revenues and expenditures
for current service levels and then integrating critical strategic expenditure requests that are the
highest priority and reflect the shared goals of the City Council and the Mayor. The Outlook provides
the City Council, key stakeholders, and the public with information at the start of budget process to
facilitate a discussion regarding the coming year’s General Fund budget allocations. To the extent
projected expenditures exceed estimated revenues in any given year of the Outlook, the City will
address these shortfalls through mitigating actions as described in the Potential Mitigation Actions
section of the Report. As required by the City Charter, the Mayor will present a balanced budget for
the City Council’s consideration in April 2020. The decisions impacting the FY 2021 budget will likely
have an impact on the entire outlook period.
Summary of Key Financial Data Overall, the Outlook forecasts revenue growth to soften, increasing moderately over the upcoming
five years. Major General Fund revenues are anticipated to increase in each year of the Outlook;
however, the rate of growth decreases in the outer years of the Outlook. The Outlook also projects
increases in nearly all expenditure categories.
Based upon baseline projections, growth in ongoing revenues is anticipated to outpace growth in
ongoing expenditures during the outlook period; however, a short-term structural shortfall is
forecasted once the following key factors are accounted for:
• Moderate growth in revenue
• Projected growth in expenditures
• Reserve Contributions
• Critical Strategic Expenditures
Fiscal Year 2021-2025 Five-Year Financial Outlook
6 The City of San Diego | Department of Finance |
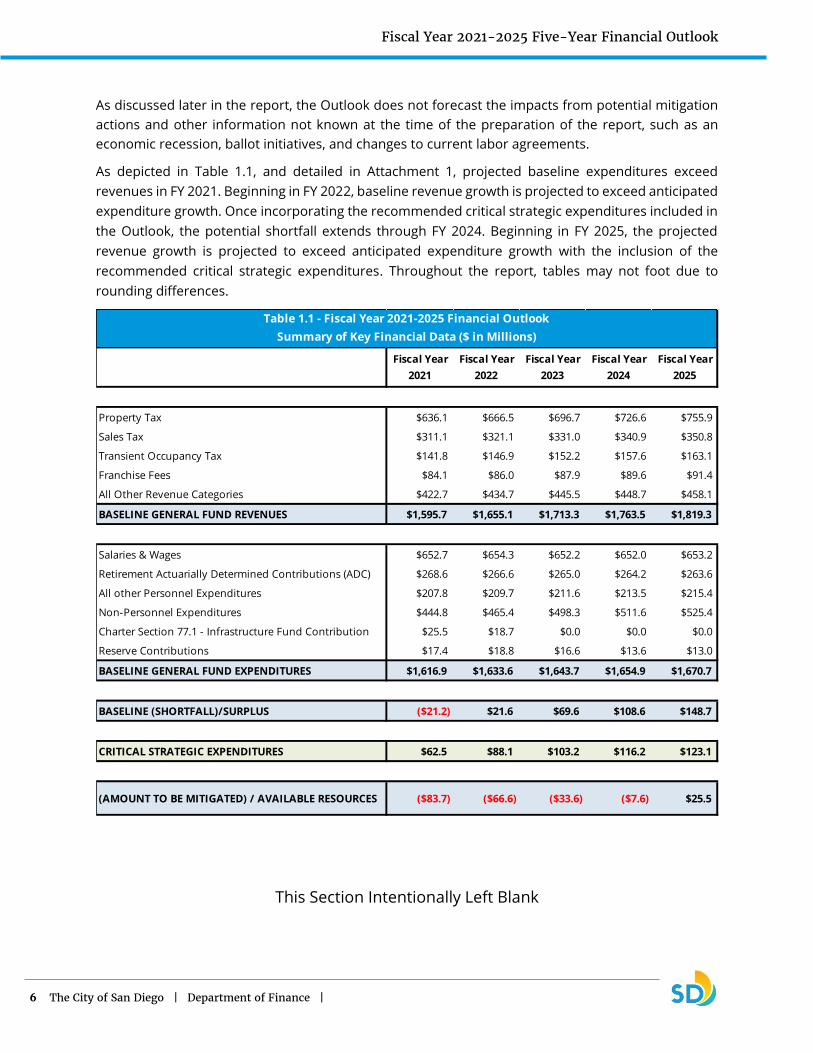
As discussed later in the report, the Outlook does not forecast the impacts from potential mitigation
actions and other information not known at the time of the preparation of the report, such as an
economic recession, ballot initiatives, and changes to current labor agreements.
As depicted in Table 1.1, and detailed in Attachment 1, projected baseline expenditures exceed
revenues in FY 2021. Beginning in FY 2022, baseline revenue growth is projected to exceed anticipated
expenditure growth. Once incorporating the recommended critical strategic expenditures included in
the Outlook, the potential shortfall extends through FY 2024. Beginning in FY 2025, the projected
revenue growth is projected to exceed anticipated expenditure growth with the inclusion of the
recommended critical strategic expenditures. Throughout the report, tables may not foot due to
rounding differences.
This Section Intentionally Left Blank
Property Tax $636.1 $666.5 $696.7 $726.6 $755.9
Sales Tax $311.1 $321.1 $331.0 $340.9 $350.8
Transient Occupancy Tax $141.8 $146.9 $152.2 $157.6 $163.1
Franchise Fees $84.1 $86.0 $87.9 $89.6 $91.4
All Other Revenue Categories $422.7 $434.7 $445.5 $448.7 $458.1
BASELINE GENERAL FUND REVENUES $1,595.7 $1,655.1 $1,713.3 $1,763.5 $1,819.3
Salaries & Wages $652.7 $654.3 $652.2 $652.0 $653.2
Retirement Actuarially Determined Contributions (ADC) $268.6 $266.6 $265.0 $264.2 $263.6
All other Personnel Expenditures $207.8 $209.7 $211.6 $213.5 $215.4
Non-Personnel Expenditures $444.8 $465.4 $498.3 $511.6 $525.4
Charter Section 77.1 - Infrastructure Fund Contribution $25.5 $18.7 $0.0 $0.0 $0.0
Reserve Contributions $17.4 $18.8 $16.6 $13.6 $13.0
BASELINE GENERAL FUND EXPENDITURES $1,616.9 $1,633.6 $1,643.7 $1,654.9 $1,670.7
BASELINE (SHORTFALL)/SURPLUS ($21.2) $21.6 $69.6 $108.6 $148.7
CRITICAL STRATEGIC EXPENDITURES $62.5 $88.1 $103.2 $116.2 $123.1
(AMOUNT TO BE MITIGATED) / AVAILABLE RESOURCES ($83.7) ($66.6) ($33.6) ($7.6) $25.5
Table 1.1 - Fiscal Year 2021-2025 Financial Outlook
Summary of Key Financial Data ($ in Millions)
Fiscal Year
2021
Fiscal Year
2022
Fiscal Year
2023
Fiscal Year
2024
Fiscal Year
2025
Fiscal Year 2021-2025 Five-Year Financial Outlook
7 The City of San Diego | Department of Finance |
Report Outline The Outlook includes a discussion on General Fund baseline projections for revenues and
expenditures, summarizes critical strategic expenditures, identifies potential options that could be
used to mitigate projected revenue shortfalls, and reviews other assumptions and considerations not
included in the projections used in this report.
The Baseline Projections section of the Outlook consists of the City’s projections for the next five years
for ongoing revenues and expenditures, as displayed in Table 1.1 – Fiscal Year 2021-2025 Financial
Outlook. The Baseline Projections section includes baseline revenue and expenditure growth, and
anticipated adjustments to the FY 2020 Adopted Budget necessary to support current service levels
provided by the City. Examples of anticipated adjustments in the baseline projections include the
removal of one-time resources and expenditures and other known adjustments included in the FY
2020 Adopted Budget.
Following the baseline projections discussion, the Critical Strategic Expenditures section quantifies
department requests that have been identified as necessary in meeting core service levels and the
City’s Strategic Plan. Examples of critical strategic expenditures include funding to support homeless
programs, streets and neighborhood improvements, Clean SD program, Public Safety, new facilities
and the Climate Action Plan. Requests that are currently accounted for in the baseline projections, not
fully developed, require additional prioritization, or not previously approved by the Mayor or City
Council were not considered critical strategic expenditures for this report. Examples include
inflationary and contractual increase requests, which are accounted for in baseline expenditure
projections, addition of personnel positions not associated with a critical strategic need, and new
programs or enhancements to services that may require additional analysis and research. Any
requests submitted for capital project costs, were not included in this report, as these requests are
accounted for in the Five-Year Capital Infrastructure Planning Outlook. All department submissions
considered in the development of the Outlook are provided to the Office of the Independent Budget
Analyst for evaluation in their report.
Potential mitigation actions are discussed to address the anticipated revenue shortfalls identified in
the report. Although no specific solution is quantified, general concepts are presented that could
mitigate the anticipated revenue shortfalls.
Lastly, there are risks and other unforeseen issues that would cause the revenues and expenditures
projected to materially deviate from the projections used in the preparation of this report. The Other
Assumptions and Considerations section of the report details the most significant items that could
impact the projections reflected in the Outlook at the time of the preparation of this report, of note is
the potential of an economic recession.
Per the City Charter, the Mayor will present a balanced budget for the City Council’s consideration in
April 2020.
This Section Intentionally Left Blank

Fiscal Year 2021-2025 Five-Year Financial Outlook
8 The City of San Diego | Department of Finance |
This Page Intentionally Left Blank
Fiscal Year 2021-2025 Five-Year Financial Outlook
9 The City of San Diego | Department of Finance |
BASELINE PROJECTIONS The Baseline Projections section describes forecasted General Fund changes based on growth
assumptions and anticipated adjustments to the FY 2020 Adopted Budget at the time of the
preparation of this report. This section provides forecasted growth rates for revenues, including an
overview of the revenue category, key economic trends, and a discussion of varying scenarios that
could impact the forecast for the major revenue categories. General Fund expenditures are reviewed
thereafter, including significant changes and growth assumptions within each expenditure category.
Unless otherwise noted, baseline projections assume growth based on the FY 2020 Adopted Budget
with one-time resources and expenditures removed. The one-time resources and expenditures that
have been removed from the baseline projections are detailed in Attachment 2: One-Time Resources
and Expenditures.
Baseline General Fund Revenues The U.S. economy never boomed or robustly bounced back from the Great Recession; rather the
economy has improved slowly and steadily since 2009. This recovery period has exceeded the average
duration and is now the longest economic expansion in American history exceeding 120 consecutive
months of economic growth. An economic recession, based on historical averages (approximately
every five years), could occur during this outlook period. However, predicting the timing or severity of
an economic downturn is not within the scope of the Outlook; nevertheless, it is an important risk
factor among others discussed in the Other Assumptions and Considerations section of this report.
It should be noted that in addition to growth rate percentages applied in each of the revenue
categories, other adjustments have been included based on significant known and anticipated events
that are detailed within each category. To assist in evaluating the potential variability to revenue
projections, a “High” and “Low” projection has been included for property tax, sales tax, and transient
occupancy tax (TOT). It is important to note that the “High” and “Low” projections provide a range of
possibilities within the current economic parameters, and do not account for a recession scenario.
The City’s four major revenue sources, property tax, sales tax, TOT, and franchise fees, represent 72.2
percent of the City’s General Fund FY 2020 Adopted Budget. As depicted in Figure 2.1, all four major
revenue sources are projected to increase through the outlook period; however, the annual rate of
growth is expected to decrease in the outer years. This overall expectation and projection for the City’s
revenues is based on actual trends and is consistent with information received from the City’s sales
tax consultant (Avenu Insights & Analytics), the San Diego Tourism Authority, Beacon Economics, the
UCLA Anderson Forecast, and the State of California’s Legislative Analyst’s Office Economic Outlook.
In addition to the major revenue projections, the baseline projections for the General Fund’s other
departmental revenue sources are based on various economic assumptions, known and anticipated
events, and historical trend analysis. Figure 2.1 below details the forecasted Outlook revenues as well
as recent actual revenues.
This Section Intentionally Left Blank

Fiscal Year 2021-2025 Five-Year Financial Outlook
10 The City of San Diego | Department of Finance |
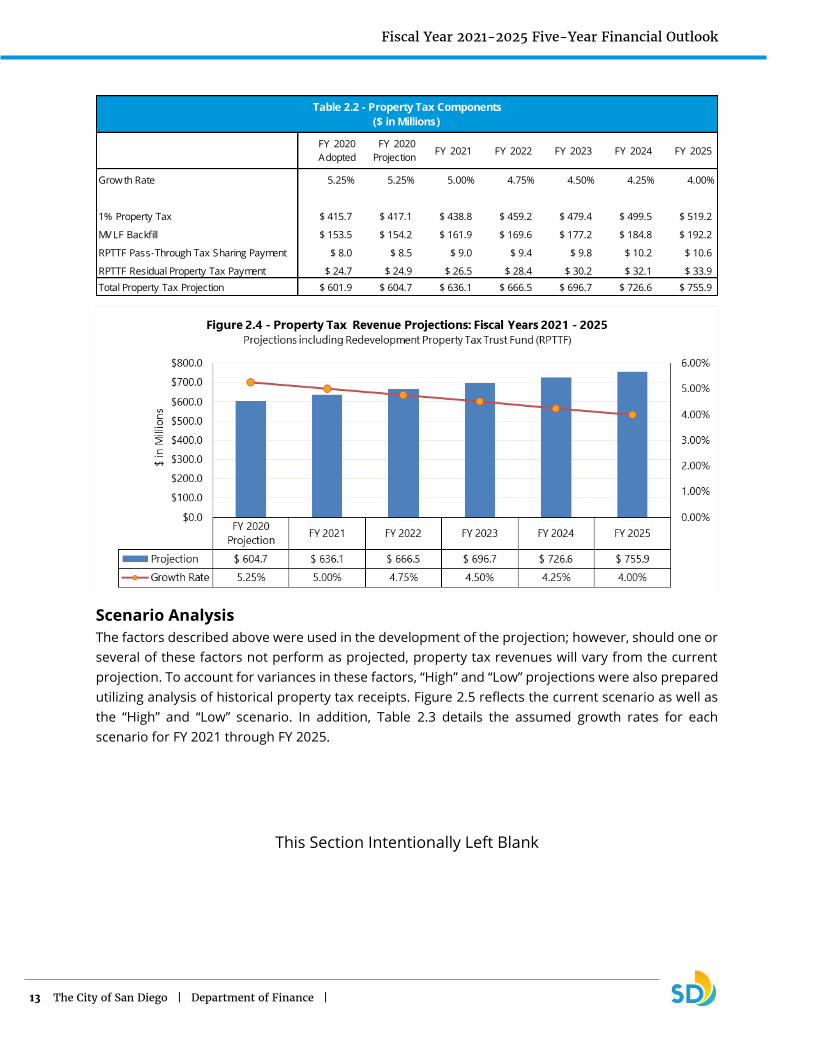
Property Tax Property tax is the City’s largest revenue source representing 38.9 percent of the General Fund FY
2020 Adopted Budget. The primary component of the property tax category is the 1.0 percent levy on
the assessed value of all real property within the City limits. The property tax category also includes
the Motor Vehicle License Fee (MVLF) backfill payment, which is a result of MVLF being reduced from
2.0 percent to 0.65 percent in 2005. Additionally, the category includes pass-through and residual
property tax payments due to the dissolution of Redevelopment Agencies (RDA) statewide.
Forecast
The following table shows the budget and year-end projection for FY 2020 and the forecast for FY 2021
through FY 2025 for revenue from property tax. The FY 2020 projection for the property tax category
of $604.7 million is a $2.8 million increase over the FY 2020 Adopted Budget and serves as the base
for the Outlook projections. Consistent with the FY 2020 First Quarter Budget Monitoring Report, the
FY 2020 Adopted Budget growth rate of 5.25 percent remains unchanged.
The forecast for property tax was determined using an analysis of the relationship of property tax to
assessed values and assessed valuation growth. These results were then adjusted based on the
assumptions and economic factors discussed below. Figure 2.2 represents the historical and projected
1.0 percent property tax amounts.
Growth Rate 5.25% 5.25% 5.00% 4.75% 4.50% 4.25% 4.00%
Projection $ 601.9 $ 604.7 $ 636.1 $ 666.5 $ 696.7 $ 726.6 $ 755.9
Table 2.1 - Property Tax Five-Year Forecast
($ in Millions)
FY 2020
Adopted
FY 2020
ProjectionFY 2021 FY 2022 FY 2023 FY 2024 FY 2025

Fiscal Year 2021-2025 Five-Year Financial Outlook
11 The City of San Diego | Department of Finance |
Economic Trends
The major economic drivers of property tax revenue are the California Consumer Price Index (CCPI),
home sales, home price, and foreclosures. The CCPI limits assessed valuation growth under
Proposition 13 which specifies that a property's value may increase at the rate of the CCPI but cannot
exceed 2.0 percent per year unless the property is improved or sold to establish a new assessed value.
In compliance with Revenue and Taxation Code section 51, the San Diego County Assessor’s Office
uses the October CCPI to assess property values under Proposition 13. However, at the time of
preparing this report, the October CCPI had not yet been released. The latest CCPI released by the
California Department of Finance (DOF) was 281.247 as of August 2019, a 2.7 percent increase from
the August 2018 CCPI of 273.844. Assuming the CCPI holds constant, the assessed valuation of
properties not improved or sold will increase by 2.0 percent for FY 2020, the maximum allowable
increase.
The City has experienced a modest positive growth in home prices, with an increase of 1.97 percent
in the median home price from August 2018 to August 2019. Despite the rise in home prices, the
growth in the number of home sales has slowed. Year-to-date home sales, as of August 2019, have
decreased by 2.3 percent compared to August 2018.
Based on property sales as of August 2019 and an approximate 2.7 percent increase in the CCPI, the
City’s estimated assessed valuation will see a positive increase for FY 2021.
• In addition to positive home price growth in the City, there are year-to-date declines in notices
of default and foreclosures of 4.6 and 6.2 percent, respectively, in the County of San Diego as
of September 2019.
• The Case-Shiller home price index as of August 2019 is 263.23, a 2.3 percent increase over the
August 2018 index of 257.32
The Case-Shiller graph depicted in Figure 2.3 displays the correlation of several economic factors
described above since 2009 and the resulting impact on the City’s assessed valuation. The graph
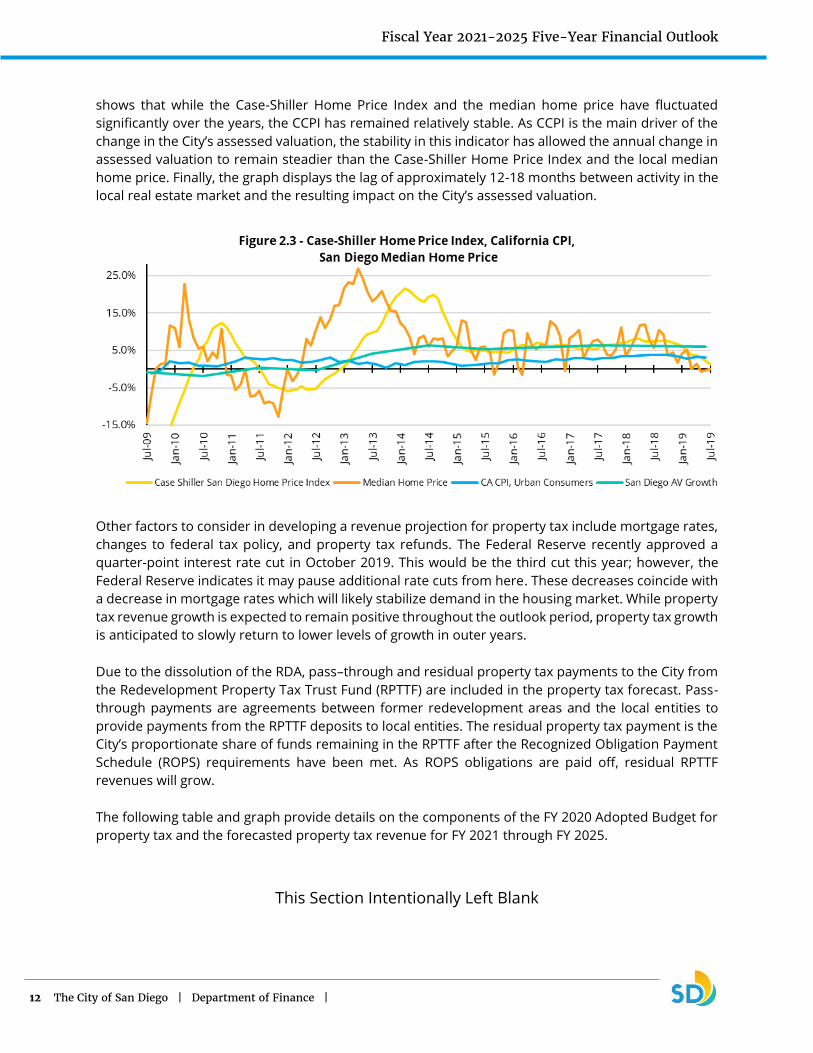
Fiscal Year 2021-2025 Five-Year Financial Outlook
12 The City of San Diego | Department of Finance |
shows that while the Case-Shiller Home Price Index and the median home price have fluctuated
significantly over the years, the CCPI has remained relatively stable. As CCPI is the main driver of the
change in the City’s assessed valuation, the stability in this indicator has allowed the annual change in
assessed valuation to remain steadier than the Case-Shiller Home Price Index and the local median
home price. Finally, the graph displays the lag of approximately 12-18 months between activity in the
local real estate market and the resulting impact on the City’s assessed valuation.
Other factors to consider in developing a revenue projection for property tax include mortgage rates,
changes to federal tax policy, and property tax refunds. The Federal Reserve recently approved a
quarter-point interest rate cut in October 2019. This would be the third cut this year; however, the
Federal Reserve indicates it may pause additional rate cuts from here. These decreases coincide with
a decrease in mortgage rates which will likely stabilize demand in the housing market. While property
tax revenue growth is expected to remain positive throughout the outlook period, property tax growth
is anticipated to slowly return to lower levels of growth in outer years.
Due to the dissolution of the RDA, pass–through and residual property tax payments to the City from
the Redevelopment Property Tax Trust Fund (RPTTF) are included in the property tax forecast. Pass-
through payments are agreements between former redevelopment areas and the local entities to
provide payments from the RPTTF deposits to local entities. The residual property tax payment is the
City’s proportionate share of funds remaining in the RPTTF after the Recognized Obligation Payment
Schedule (ROPS) requirements have been met. As ROPS obligations are paid off, residual RPTTF
revenues will grow.
The following table and graph provide details on the components of the FY 2020 Adopted Budget for
property tax and the forecasted property tax revenue for FY 2021 through FY 2025.
This Section Intentionally Left Blank
Fiscal Year 2021-2025 Five-Year Financial Outlook
13 The City of San Diego | Department of Finance |
Scenario Analysis
The factors described above were used in the development of the projection; however, should one or
several of these factors not perform as projected, property tax revenues will vary from the current
projection. To account for variances in these factors, “High” and “Low” projections were also prepared
utilizing analysis of historical property tax receipts. Figure 2.5 reflects the current scenario as well as
the “High” and “Low” scenario. In addition, Table 2.3 details the assumed growth rates for each
scenario for FY 2021 through FY 2025.
This Section Intentionally Left Blank
Growth Rate 5.25% 5.25% 5.00% 4.75% 4.50% 4.25% 4.00%
1% Property Tax $ 415.7 $ 417.1 $ 438.8 $ 459.2 $ 479.4 $ 499.5 $ 519.2
MVLF Backfill $ 153.5 $ 154.2 $ 161.9 $ 169.6 $ 177.2 $ 184.8 $ 192.2
RPTTF Pass-Through Tax Sharing Payment $ 8.0 $ 8.5 $ 9.0 $ 9.4 $ 9.8 $ 10.2 $ 10.6
RPTTF Residual Property Tax Payment $ 24.7 $ 24.9 $ 26.5 $ 28.4 $ 30.2 $ 32.1 $ 33.9
Total Property Tax Projection $ 601.9 $ 604.7 $ 636.1 $ 666.5 $ 696.7 $ 726.6 $ 755.9
Table 2.2 - Property Tax Components
($ in Millions)
FY 2020
Adopted
FY 2020
ProjectionFY 2021 FY 2022 FY 2023 FY 2024 FY 2025

Fiscal Year 2021-2025 Five-Year Financial Outlook
14 The City of San Diego | Department of Finance |
The “Low” scenario assumes that mortgage interest rates will increase rapidly over the next five years.
Increased mortgage rates raise the cost of home ownership, thereby slowing the number of home
sales and median home price growth. Further, contributing to the “Low” scenario is existing higher
prices changing home ownership behavior reducing turnover, and therefore reduced growth in
assessed valuation. Higher interest rates and lower turnover will result in lower annual assessed
valuation growth rates for FY 2021 through FY 2025 of 3.0 percent across all years. A “Low” scenario
would reduce property tax projections by $11.2 million in FY 2021 and a cumulative total of $127.4
million throughout the outlook period.
A “High” scenario is projected to exist should homes sales and valuations continue at the current
levels, with slightly restrained growth. In this scenario, interest rates would rise slowly over the next
several years, continuing high demand for housing and tightening inventory, further fueled by
continued growth in higher income labor markets. The projections in this scenario reflect higher levels
of growth similar to those seen in recent years, while slowing in later years. A “High” scenario would
increase property tax projections by $2.8 million in FY 2021 and a cumulative total of $48.0 million
throughout the outlook period.
Another factor that may influence the property tax forecast relates to the California Department of
Finance’s (DOF) review and denial or approval of enforceable obligations on the ROPS. If enforceable
obligations are denied, the ROPS payment will decrease and lead to an increase in the RPTTF residual
balance available for distribution to local entities. A decrease in enforceable obligations due to a denial
will increase the City’s RPTTF residual payment throughout all fiscal years of the Outlook. A significant
FY 2021 FY 2022 FY 2023 FY 2024 FY 2025
Current Growth Rate 5.00% 4.75% 4.50% 4.25% 4.00%
High Growth Rate 5.50% 5.25% 5.00% 4.75% 4.50%
Low Growth Rate 3.00% 3.00% 3.00% 3.00% 3.00%
Table 2.3 - Property Tax Five-Year Forecast: Growth Rate Scenarios

Fiscal Year 2021-2025 Five-Year Financial Outlook
15 The City of San Diego | Department of Finance |
variable in the ROPS enforceable obligations is the dollar amount and terms of the repayment of
various outstanding loan agreements.
Lastly, there are two outstanding legal challenges that may influence the property tax forecast for the
City. First, a dispute between the County of San Diego and various local entities regarding how the
RPTTF residual payments are calculated and distributed every six months. The trial court’s decision in
favor of the City and other local entities is currently on appeal, and an appellate court ruling is
anticipated to occur sometime in 2020. If the trial court’s decision is upheld, the City would be
compensated for any past underpayment of RPTTF residual amounts and would receive an increase
in RPTTF residual payments going forward throughout the outlook period.
The second dispute involves the San Diego County Office of Education and other school districts
against numerous city successor agencies including the City of San Diego Successor Agency regarding
the distribution of funds from the RPTTF to taxing entities. In the event of the school districts receiving
a favorable decision, this may result in an increased liability to the City.
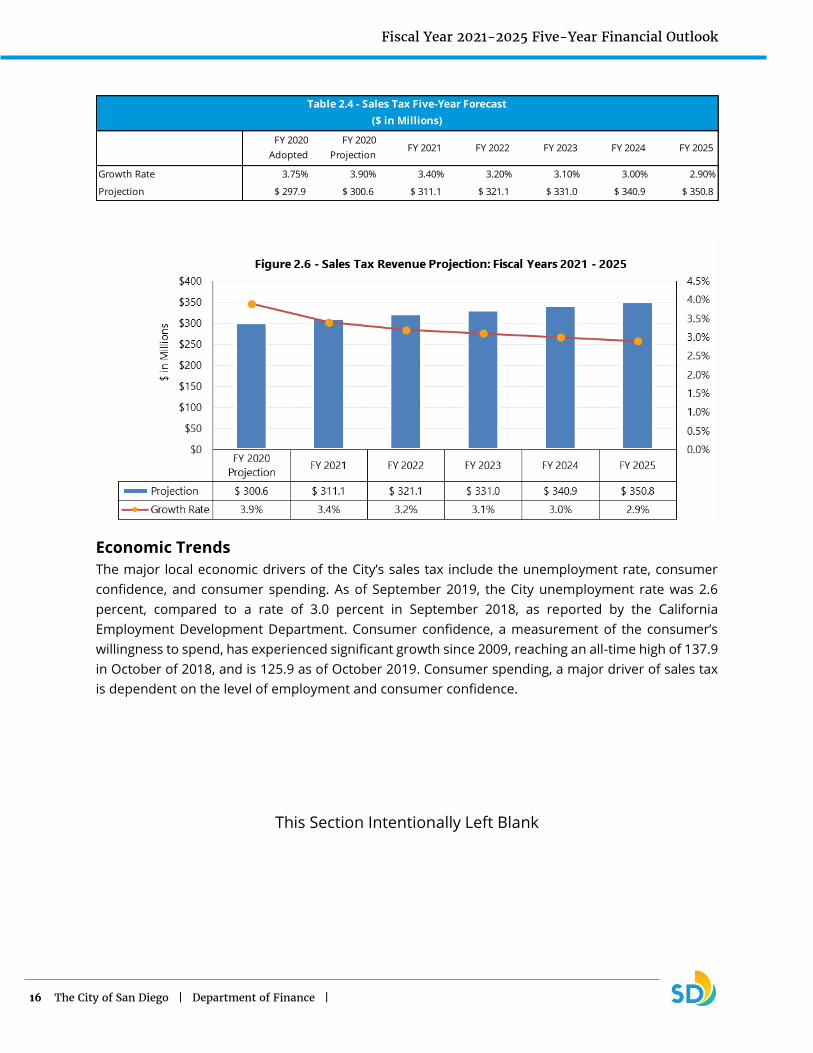
Sales Tax The City’s second largest revenue source is sales tax and represents 19.2 percent of the General Fund
FY 2020 Adopted Budget. Sales tax is collected at the point of sale, and remitted to the California
Department of Tax and Fee Administration, which allocates tax revenue owed to the City in monthly
payments. Sales tax revenue also includes online sales from out-of-state businesses that meet a
threshold in cumulative sales and delivers goods into California. The total citywide sales tax rate in
San Diego is 7.75 percent, of which the City receives 1.0 percent of all point of sale transactions within
the City.
Forecast
The following table displays the budget and year-end projection for FY 2020 as well as the forecast for
FY 2021 through FY 2025 for revenue from sales tax. As discussed in the FY 2020 First Quarter Budget
Monitoring Report, the FY 2020 projection for sales tax of $300.6 million includes a $2.8 million
increase over the FY 2020 Adopted Budget of $297.9 million due to the delayed distribution of sales
tax to the City as a result of complications with the California Department of Tax and Fee
Administration’s (CDTFA) new sales tax reporting software system. These adjustments are accounted
for in the baseline projections. Further, as discussed in the FY 2020 First Quarter Budget Monitoring
Report, the growth rate has been increased from 3.75 percent to 3.90 percent due to revised
projections from the City’s sales tax consultant, which reflect the most likely scenario.
This Section Intentionally Left Blank
Fiscal Year 2021-2025 Five-Year Financial Outlook
16 The City of San Diego | Department of Finance |
Economic Trends
The major local economic drivers of the City’s sales tax include the unemployment rate, consumer
confidence, and consumer spending. As of September 2019, the City unemployment rate was 2.6
percent, compared to a rate of 3.0 percent in September 2018, as reported by the California
Employment Development Department. Consumer confidence, a measurement of the consumer’s
willingness to spend, has experienced significant growth since 2009, reaching an all-time high of 137.9
in October of 2018, and is 125.9 as of October 2019. Consumer spending, a major driver of sales tax
is dependent on the level of employment and consumer confidence.
This Section Intentionally Left Blank
Growth Rate 3.75% 3.90% 3.40% 3.20% 3.10% 3.00% 2.90%
Projection $ 297.9 $ 300.6 $ 311.1 $ 321.1 $ 331.0 $ 340.9 $ 350.8
Table 2.4 - Sales Tax Five-Year Forecast
($ in Millions)
FY 2020
Adopted
FY 2020
ProjectionFY 2021 FY 2022 FY 2023 FY 2024 FY 2025

Fiscal Year 2021-2025 Five-Year Financial Outlook
17 The City of San Diego | Department of Finance |
Source: The Conference Board – Consumer Confidence Survey ®
While consumer confidence has consistently increased over the past several years, it is unclear how
long this sustained trend will continue. Furthermore, as consumers continue to shift from in-store to
online sales, the City receives a smaller portion of those sales tax revenues. Sales tax revenues from
online sales Countywide are distributed to the City through the county pool of funds at a current rate
of 0.48 percent compared to 1.0 percent for point of sales transactions within the City.
The forecast for sales tax reflects the relative stability in employment, anticipated revenue from out-
of-state online sales and consistent growth in consumer confidence. Therefore, sales tax revenue
continues with moderate strength in the near term while tapering off in the outer years due to the
uncertainty of sustained growth and stability. Retail sales in brick and mortar stores are expected to
remain relatively flat during the outlook period. This is expected to be offset partially by growth in the
county pool, reflecting the shift from brick and mortar to online sales.
The Sales Tax growth rate factors-in growth associated with the 2019 California legislation, (AB) 147,
that extends the criteria for determining taxable out-of-state online sales. Per the California
Department of Tax and Fee Administration (CDTFA), California will extend Sales and Use taxes to out-
of-state retailers engaged in business in California and require to be registered with CDTFA and collect
and remit sales tax. This includes any retailer that has total combined sales of property for delivery in
California that exceed $500,000 in the preceding 12 months. This decision is projected to increase
local sales tax revenues, and the potential impact is projected within the growth rates in the Outlook.
The food products category (including restaurants), and the transportation category (including fuel
and automobile sales) are also expected to lead the growth in the sales tax during the outlook period.
This forecast is consistent with recent reports from the City’s sales tax consultant, Avenu Insights &
Analytics. Beacon Economics and UCLA Anderson Forecast have also reported that California is
beginning to see a slight decrease in employment, but continues to outpace national growth in both
Fiscal Year 2021-2025 Five-Year Financial Outlook
18 The City of San Diego | Department of Finance |
payroll and employment rate growth primarily due to productivity gains. Additionally, housing
shortages will continue to constrain growth in California.
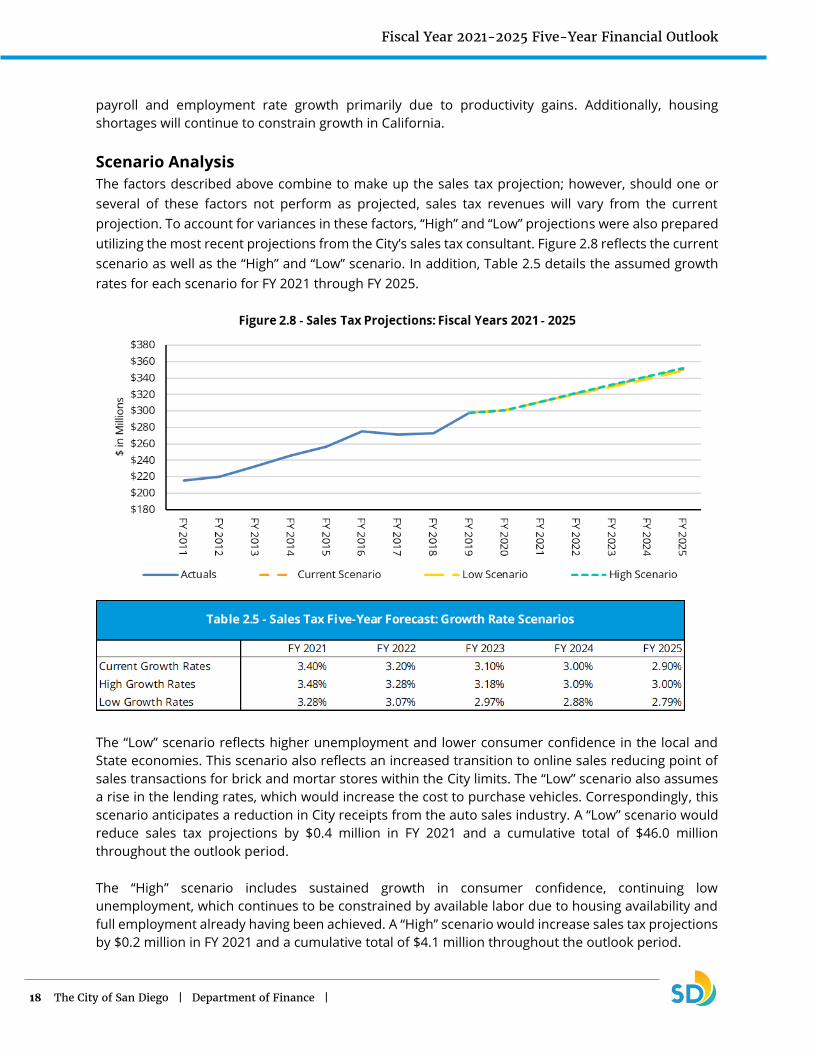
Scenario Analysis
The factors described above combine to make up the sales tax projection; however, should one or
several of these factors not perform as projected, sales tax revenues will vary from the current
projection. To account for variances in these factors, “High” and “Low” projections were also prepared
utilizing the most recent projections from the City’s sales tax consultant. Figure 2.8 reflects the current
scenario as well as the “High” and “Low” scenario. In addition, Table 2.5 details the assumed growth
rates for each scenario for FY 2021 through FY 2025.
The “Low” scenario reflects higher unemployment and lower consumer confidence in the local and
State economies. This scenario also reflects an increased transition to online sales reducing point of
sales transactions for brick and mortar stores within the City limits. The “Low” scenario also assumes
a rise in the lending rates, which would increase the cost to purchase vehicles. Correspondingly, this
scenario anticipates a reduction in City receipts from the auto sales industry. A “Low” scenario would
reduce sales tax projections by $0.4 million in FY 2021 and a cumulative total of $46.0 million
throughout the outlook period.
The “High” scenario includes sustained growth in consumer confidence, continuing low
unemployment, which continues to be constrained by available labor due to housing availability and
full employment already having been achieved. A “High” scenario would increase sales tax projections
by $0.2 million in FY 2021 and a cumulative total of $4.1 million throughout the outlook period.
Fiscal Year 2021-2025 Five-Year Financial Outlook
19 The City of San Diego | Department of Finance |
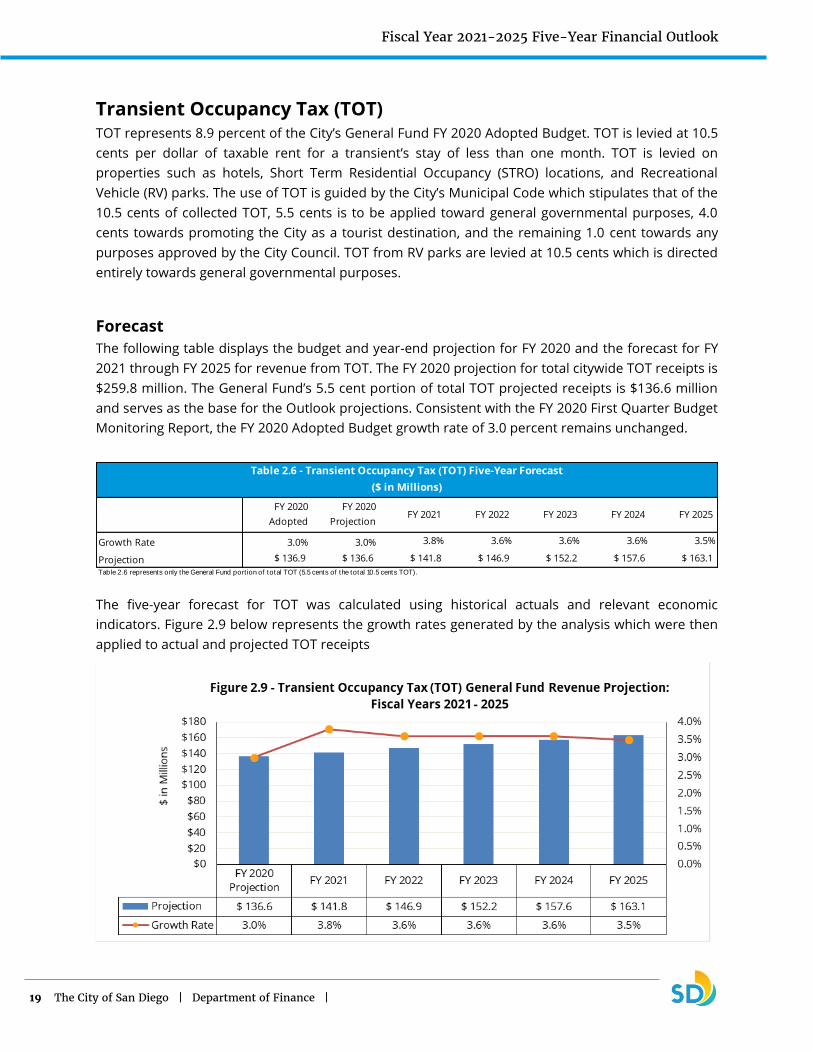
Transient Occupancy Tax (TOT) TOT represents 8.9 percent of the City’s General Fund FY 2020 Adopted Budget. TOT is levied at 10.5
cents per dollar of taxable rent for a transient’s stay of less than one month. TOT is levied on
properties such as hotels, Short Term Residential Occupancy (STRO) locations, and Recreational
Vehicle (RV) parks. The use of TOT is guided by the City’s Municipal Code which stipulates that of the
10.5 cents of collected TOT, 5.5 cents is to be applied toward general governmental purposes, 4.0
cents towards promoting the City as a tourist destination, and the remaining 1.0 cent towards any
purposes approved by the City Council. TOT from RV parks are levied at 10.5 cents which is directed
entirely towards general governmental purposes.
Forecast
The following table displays the budget and year-end projection for FY 2020 and the forecast for FY
2021 through FY 2025 for revenue from TOT. The FY 2020 projection for total citywide TOT receipts is
$259.8 million. The General Fund’s 5.5 cent portion of total TOT projected receipts is $136.6 million
and serves as the base for the Outlook projections. Consistent with the FY 2020 First Quarter Budget
Monitoring Report, the FY 2020 Adopted Budget growth rate of 3.0 percent remains unchanged.
The five-year forecast for TOT was calculated using historical actuals and relevant economic
indicators. Figure 2.9 below represents the growth rates generated by the analysis which were then
applied to actual and projected TOT receipts
Growth Rate 3.0% 3.0% 3.8% 3.6% 3.6% 3.6% 3.5%
Projection $ 136.9 $ 136.6 $ 141.8 $ 146.9 $ 152.2 $ 157.6 $ 163.1
Table 2.6 represents only the General Fund port ion of total TOT (5.5 cents of the total 10.5 cents TOT).
Table 2.6 - Transient Occupancy Tax (TOT) Five-Year Forecast
($ in Millions)
FY 2020
Adopted
FY 2020
ProjectionFY 2021 FY 2022 FY 2023 FY 2024 FY 2025
Fiscal Year 2021-2025 Five-Year Financial Outlook
20 The City of San Diego | Department of Finance |
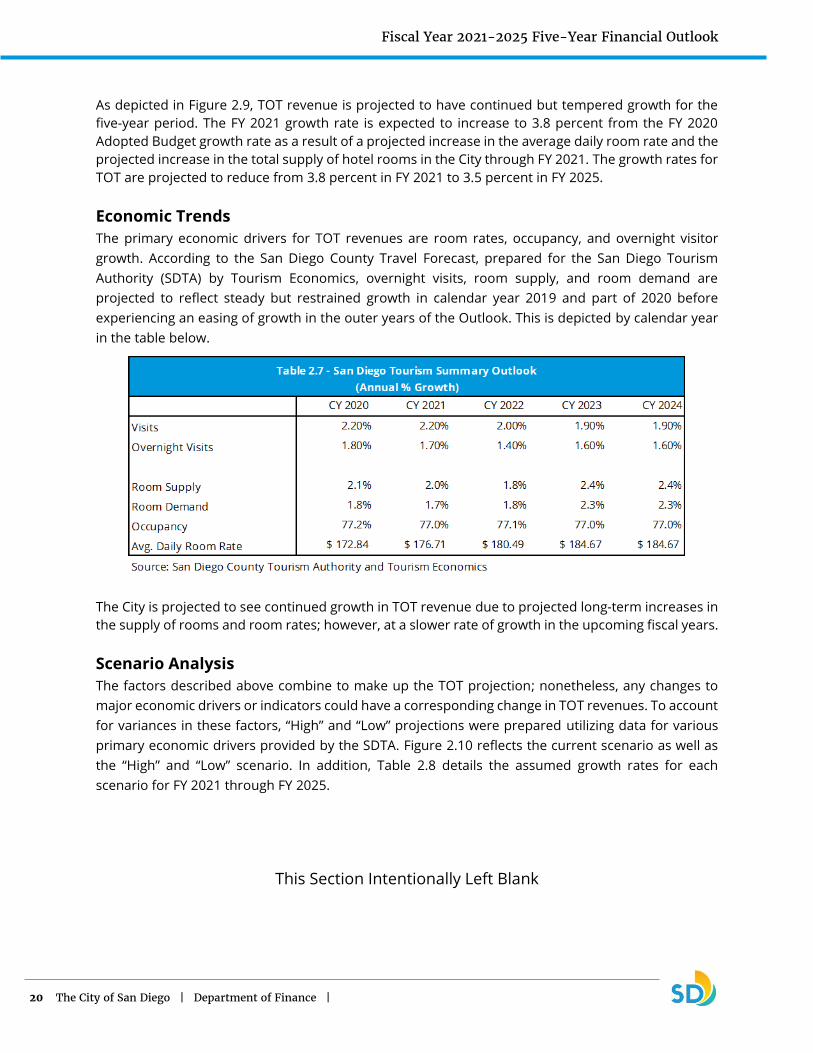
As depicted in Figure 2.9, TOT revenue is projected to have continued but tempered growth for the
five-year period. The FY 2021 growth rate is expected to increase to 3.8 percent from the FY 2020
Adopted Budget growth rate as a result of a projected increase in the average daily room rate and the
projected increase in the total supply of hotel rooms in the City through FY 2021. The growth rates for
TOT are projected to reduce from 3.8 percent in FY 2021 to 3.5 percent in FY 2025.
Economic Trends
The primary economic drivers for TOT revenues are room rates, occupancy, and overnight visitor
growth. According to the San Diego County Travel Forecast, prepared for the San Diego Tourism
Authority (SDTA) by Tourism Economics, overnight visits, room supply, and room demand are
projected to reflect steady but restrained growth in calendar year 2019 and part of 2020 before
experiencing an easing of growth in the outer years of the Outlook. This is depicted by calendar year
in the table below.
The City is projected to see continued growth in TOT revenue due to projected long-term increases in
the supply of rooms and room rates; however, at a slower rate of growth in the upcoming fiscal years.
Scenario Analysis
The factors described above combine to make up the TOT projection; nonetheless, any changes to
major economic drivers or indicators could have a corresponding change in TOT revenues. To account
for variances in these factors, “High” and “Low” projections were prepared utilizing data for various
primary economic drivers provided by the SDTA. Figure 2.10 reflects the current scenario as well as
the “High” and “Low” scenario. In addition, Table 2.8 details the assumed growth rates for each
scenario for FY 2021 through FY 2025.
This Section Intentionally Left Blank
Fiscal Year 2021-2025 Five-Year Financial Outlook
21 The City of San Diego | Department of Finance |
An analysis comparing historical TOT activity to hotel and visitor data (TOT Indicators) was prepared
to develop a model to be used in conjunction with the San Diego Tourism Authority’s forecast to
develop the current TOT forecast as well as a “High” and “Low” scenario.
The “Low” forecast looked at long-term TOT indicators which included periods of low or negative
growth and applied the averages over the long-term of each TOT indicator to the model to forecast
TOT growth rates. A “Low” scenario would reduce TOT projections by $1.0 million in FY 2021 and a
cumulative total of $14.5 million throughout the outlook period.
The “High” forecast assumed the continuation of activity similar to past five years which had sustained
strong growth in TOT revenues. The averages of each TOT indicator during this period were applied
to the model to generate the “High” growth rates. A “High” scenario would increase TOT projections
by $2.4 million in FY 2021 and a cumulative total of $38.9 million throughout the outlook period.
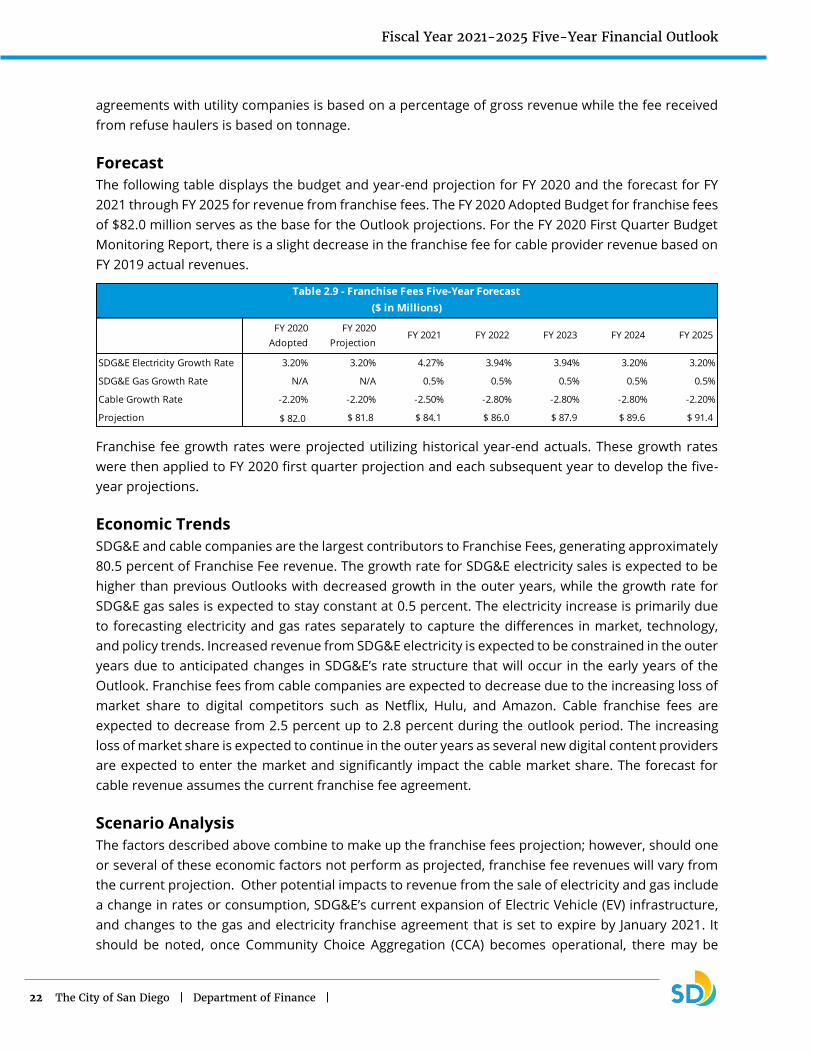
Franchise Fees Revenue from franchise fees makes up 5.3 percent of the City’s General Fund FY 2020 Adopted Budget.
Theses revenues are based on agreements with private utility companies in exchange for the use of
the City's rights-of-way.
Currently, San Diego Gas and Electric (SDG&E), Cox Communications, Spectrum (formerly Time
Warner Cable), and AT&T pay a franchise fee to the City. The City also collects franchise fees from
private refuse haulers that conduct business within the City limits. The fee received from the
FY 2021 FY 2022 FY 2023 FY 2024 FY 2025
Current Growth Rates 3.80% 3.60% 3.60% 3.60% 3.50%
High Growth Rates 5.53% 5.38% 5.24% 5.12% 5.01%
Low Growth Rates 3.07% 3.02% 2.97% 2.92% 2.88%
Table 2.8 - Transient Occupancy Tax (TOT) Five-Year Forecast: Growth Rate Scenarios
Fiscal Year 2021-2025 Five-Year Financial Outlook
22 The City of San Diego | Department of Finance |
agreements with utility companies is based on a percentage of gross revenue while the fee received
from refuse haulers is based on tonnage.
Forecast
The following table displays the budget and year-end projection for FY 2020 and the forecast for FY
2021 through FY 2025 for revenue from franchise fees. The FY 2020 Adopted Budget for franchise fees
of $82.0 million serves as the base for the Outlook projections. For the FY 2020 First Quarter Budget
Monitoring Report, there is a slight decrease in the franchise fee for cable provider revenue based on
FY 2019 actual revenues.
Franchise fee growth rates were projected utilizing historical year-end actuals. These growth rates
were then applied to FY 2020 first quarter projection and each subsequent year to develop the five-
year projections.
Economic Trends
SDG&E and cable companies are the largest contributors to Franchise Fees, generating approximately
80.5 percent of Franchise Fee revenue. The growth rate for SDG&E electricity sales is expected to be
higher than previous Outlooks with decreased growth in the outer years, while the growth rate for
SDG&E gas sales is expected to stay constant at 0.5 percent. The electricity increase is primarily due
to forecasting electricity and gas rates separately to capture the differences in market, technology,
and policy trends. Increased revenue from SDG&E electricity is expected to be constrained in the outer
years due to anticipated changes in SDG&E’s rate structure that will occur in the early years of the
Outlook. Franchise fees from cable companies are expected to decrease due to the increasing loss of
market share to digital competitors such as Netflix, Hulu, and Amazon. Cable franchise fees are
expected to decrease from 2.5 percent up to 2.8 percent during the outlook period. The increasing
loss of market share is expected to continue in the outer years as several new digital content providers
are expected to enter the market and significantly impact the cable market share. The forecast for
cable revenue assumes the current franchise fee agreement.
Scenario Analysis
The factors described above combine to make up the franchise fees projection; however, should one
or several of these economic factors not perform as projected, franchise fee revenues will vary from
the current projection. Other potential impacts to revenue from the sale of electricity and gas include
a change in rates or consumption, SDG&E’s current expansion of Electric Vehicle (EV) infrastructure,
and changes to the gas and electricity franchise agreement that is set to expire by January 2021. It
should be noted, once Community Choice Aggregation (CCA) becomes operational, there may be
SDG&E Electricity Growth Rate 3.20% 3.20% 4.27% 3.94% 3.94% 3.20% 3.20%
SDG&E Gas Growth Rate N/A N/A 0.5% 0.5% 0.5% 0.5% 0.5%
Cable Growth Rate -2.20% -2.20% -2.50% -2.80% -2.80% -2.80% -2.20%
Projection $ 82.0 $ 81.8 $ 84.1 $ 86.0 $ 87.9 $ 89.6 $ 91.4
Table 2.9 - Franchise Fees Five-Year Forecast
($ in Millions)
FY 2020
Adopted
FY 2020
ProjectionFY 2021 FY 2022 FY 2023 FY 2024 FY 2025

Fiscal Year 2021-2025 Five-Year Financial Outlook
23 The City of San Diego | Department of Finance |
potential impacts to franchise fee revenue, potential savings in City energy costs, or other impacts
that are unknown at this time. For cable revenue, variances in content ownership, media advertising,
subscription levels, and pricing may also impact franchise fee growth. It should be noted that
adequate data sets on these individual factors for all San Diego cable companies are not yet available
to City Staff. As a result, cable projections are based on historical actuals and overall fluctuations in
these factors.
Property Transfer Tax Property transfer tax is levied on the sale of real property. The County of San Diego collects $1.10 per
$1,000 of the sale price when any real property is sold, of which the City receives half, or $0.55 per
$1,000. Property Transfer Tax revenue is remitted to the City monthly and represents 0.7 percent of
the City’s General Fund FY 2020 Adopted Budget.
Forecast
The following table displays the FY 2020 Adopted Budget and the forecast for FY 2021 through FY 2025
for property transfer tax. The FY 2020 projection for property transfer tax is projected as budgeted in
the FY 2020 Adopted Budget and serves as the basis for the Outlook projections.
Property transfer tax estimates were developed using historical receipts and year-over-year trends.
No growth rate was projected as a result of inconsistent historical trends.
Economic Trends
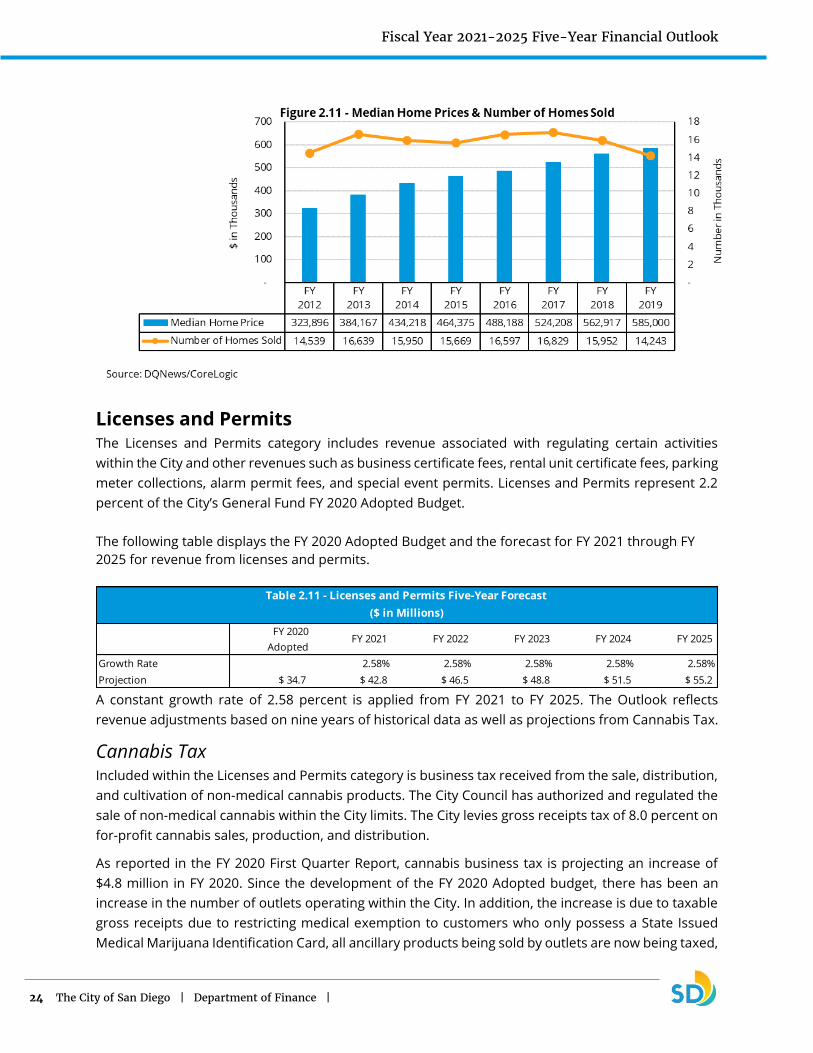
The major economic drivers for property transfer tax are volume of property sales and home prices.
Unlike the 1.0 percent property tax revenue, property transfer tax receipts reflect current economic
conditions without lag time. While the median home price has continued to grow over the past several
years, the growth in the number of home sales has decreased when comparing current year-to-date
data with the same time period last year. Figure 2.11 below illustrates the median home prices and
number of homes sold. Property Transfer Tax revenue is anticipated to remain flat for the outlook
period due to inconsistencies in historical receipts and unpredictable growth rates.
This Section Intentionally Left Blank
Growth Rate -2.2% 0.6% 0.0% 0.0% 0.0% 0.0% 0.0%
Projection $ 10.3 $ 10.9 $ 10.9 $ 10.9 $ 10.9 $ 10.9 $ 10.9
Table 2.10 - Property Transfer Tax Five-Year Forecast
($ in Millions)
FY 2020
Adopted
FY 2020
ProjectionFY 2021 FY 2022 FY 2023 FY 2024 FY 2025
Fiscal Year 2021-2025 Five-Year Financial Outlook
24 The City of San Diego | Department of Finance |
Licenses and Permits The Licenses and Permits category includes revenue associated with regulating certain activities
within the City and other revenues such as business certificate fees, rental unit certificate fees, parking
meter collections, alarm permit fees, and special event permits. Licenses and Permits represent 2.2
percent of the City’s General Fund FY 2020 Adopted Budget.
The following table displays the FY 2020 Adopted Budget and the forecast for FY 2021 through FY
2025 for revenue from licenses and permits.
A constant growth rate of 2.58 percent is applied from FY 2021 to FY 2025. The Outlook reflects
revenue adjustments based on nine years of historical data as well as projections from Cannabis Tax.
Cannabis Tax Included within the Licenses and Permits category is business tax received from the sale, distribution,
and cultivation of non-medical cannabis products. The City Council has authorized and regulated the
sale of non-medical cannabis within the City limits. The City levies gross receipts tax of 8.0 percent on
for-profit cannabis sales, production, and distribution.
As reported in the FY 2020 First Quarter Report, cannabis business tax is projecting an increase of
$4.8 million in FY 2020. Since the development of the FY 2020 Adopted budget, there has been an
increase in the number of outlets operating within the City. In addition, the increase is due to taxable
gross receipts due to restricting medical exemption to customers who only possess a State Issued
Medical Marijuana Identification Card, all ancillary products being sold by outlets are now being taxed,
Growth Rate 2.58% 2.58% 2.58% 2.58% 2.58%
Projection $ 34.7 $ 42.8 $ 46.5 $ 48.8 $ 51.5 $ 55.2
Table 2.11 - Licenses and Permits Five-Year Forecast
($ in Millions)
FY 2020
Adopted FY 2021 FY 2022 FY 2023 FY 2024 FY 2025

Fiscal Year 2021-2025 Five-Year Financial Outlook
25 The City of San Diego | Department of Finance |
and compliance efforts in registering business based outside our jurisdiction that conduct cannabis
business activities. To develop the Outlook projections, sales data from existing cannabis outlets from
June 2018 through July 2019 were used to develop an average of monthly taxable sales per outlet.
This figure was then scaled to the number of dispensaries projected in each fiscal year and the tax
rate of 8.0 percent applied. The projection for cultivation, manufacturing, and distribution of cannabis
was calculated following a similar methodology. As the industry matures, the City will continue to
monitor and update projections from all cannabis businesses.
Fines, Forfeitures, and Penalties The Fines, Forfeitures, and Penalties category includes revenue generated from the violation of laws
or regulations, such as California Vehicle Code violations, City parking and ordinance violations,
negligent impounds, collection referrals, and litigation awards. This revenue source represents
approximately 2.0 percent of the City’s General Fund FY 2020 Adopted Budget.
The following table displays the FY 2020 Adopted Budget and the forecast for FY 2021 through FY 2025
for revenue from fines, forfeitures, and penalties.
Revenue from fines, forfeitures, and penalties is projected to increase at a constant rate of 0.25
percent for FY 2021 through FY 2025 based on historical averages.
FY 2020
AdoptedFY 2021 FY 2022 FY 2023 FY 2024 FY 2025
Growth rate 0.25% 0.25% 0.25% 0.25% 0.25%
Projection $ 31.1 $ 31.2 $ 31.3 $ 31.3 $ 31.4 $ 31.5
Table 2.12 - Fines, Forfeitures and Penalties Five-Year Forecast
($ in Millions)
Fiscal Year 2021-2025 Five-Year Financial Outlook
26 The City of San Diego | Department of Finance |
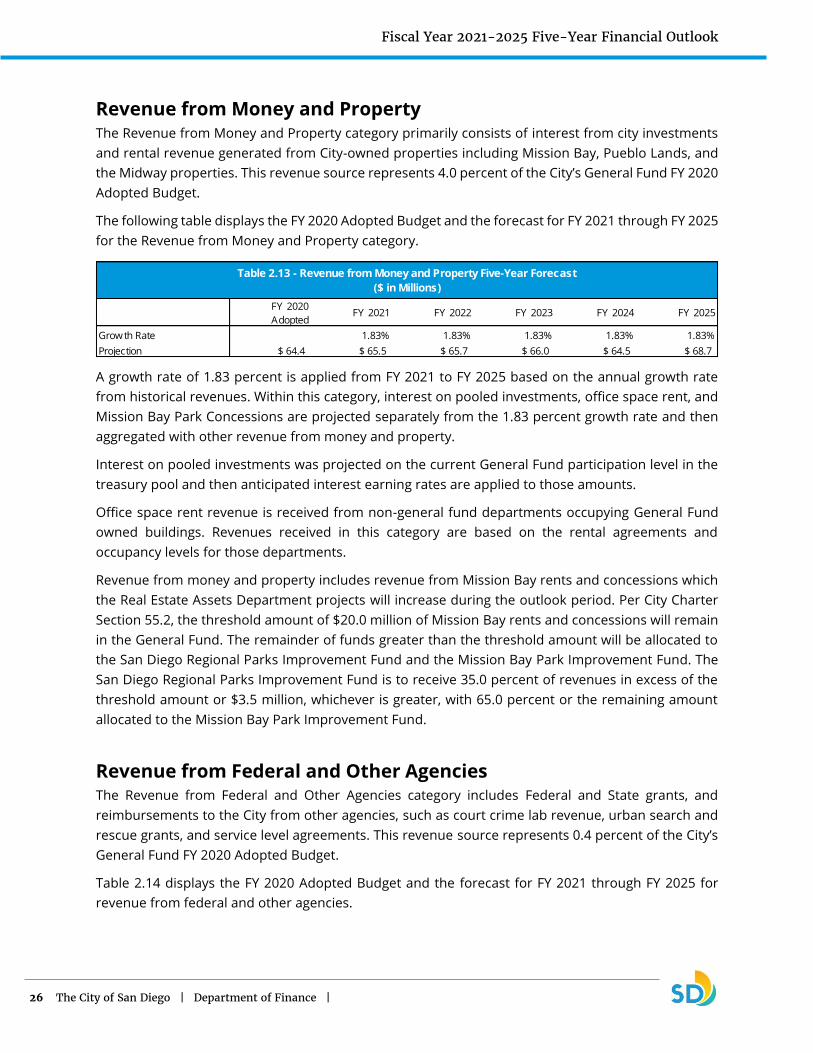
Revenue from Money and Property The Revenue from Money and Property category primarily consists of interest from city investments
and rental revenue generated from City-owned properties including Mission Bay, Pueblo Lands, and
the Midway properties. This revenue source represents 4.0 percent of the City’s General Fund FY 2020
Adopted Budget.
The following table displays the FY 2020 Adopted Budget and the forecast for FY 2021 through FY 2025
for the Revenue from Money and Property category.
A growth rate of 1.83 percent is applied from FY 2021 to FY 2025 based on the annual growth rate
from historical revenues. Within this category, interest on pooled investments, office space rent, and
Mission Bay Park Concessions are projected separately from the 1.83 percent growth rate and then
aggregated with other revenue from money and property.
Interest on pooled investments was projected on the current General Fund participation level in the
treasury pool and then anticipated interest earning rates are applied to those amounts.
Office space rent revenue is received from non-general fund departments occupying General Fund
owned buildings. Revenues received in this category are based on the rental agreements and
occupancy levels for those departments.
Revenue from money and property includes revenue from Mission Bay rents and concessions which
the Real Estate Assets Department projects will increase during the outlook period. Per City Charter
Section 55.2, the threshold amount of $20.0 million of Mission Bay rents and concessions will remain
in the General Fund. The remainder of funds greater than the threshold amount will be allocated to
the San Diego Regional Parks Improvement Fund and the Mission Bay Park Improvement Fund. The
San Diego Regional Parks Improvement Fund is to receive 35.0 percent of revenues in excess of the
threshold amount or $3.5 million, whichever is greater, with 65.0 percent or the remaining amount
allocated to the Mission Bay Park Improvement Fund.
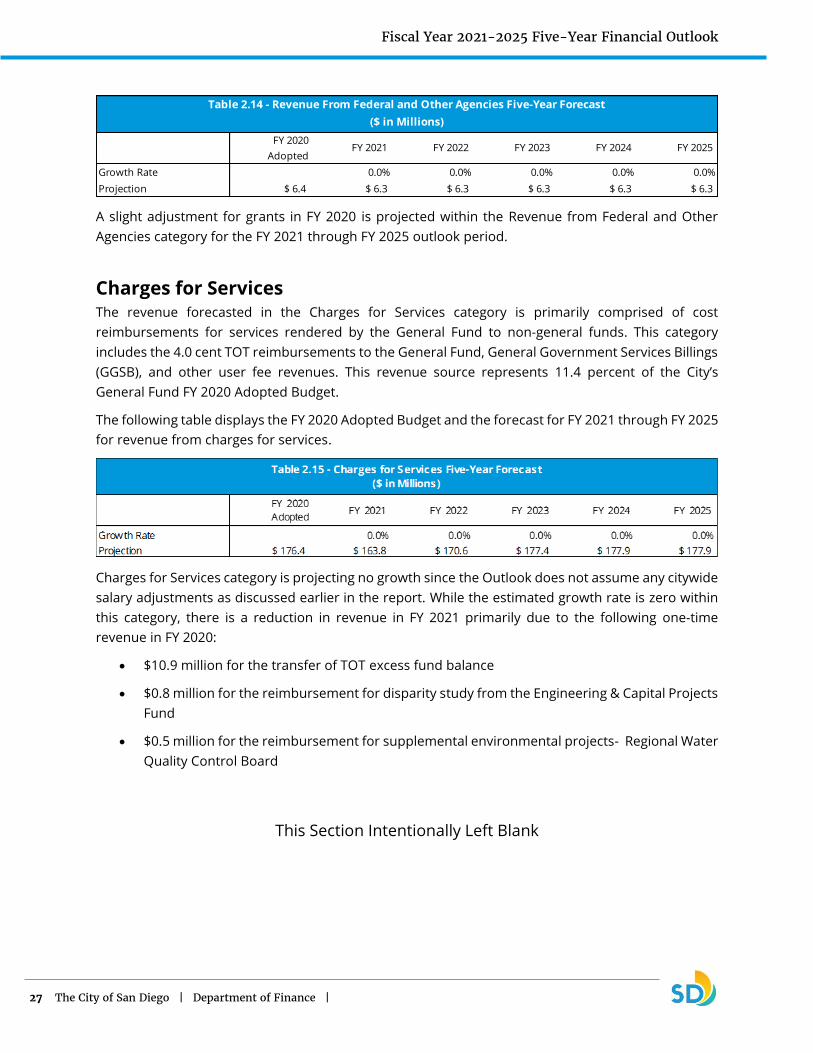
Revenue from Federal and Other Agencies The Revenue from Federal and Other Agencies category includes Federal and State grants, and
reimbursements to the City from other agencies, such as court crime lab revenue, urban search and
rescue grants, and service level agreements. This revenue source represents 0.4 percent of the City’s
General Fund FY 2020 Adopted Budget.
Table 2.14 displays the FY 2020 Adopted Budget and the forecast for FY 2021 through FY 2025 for
revenue from federal and other agencies.
FY 2020
AdoptedFY 2021 FY 2022 FY 2023 FY 2024 FY 2025
Growth Rate 1.83% 1.83% 1.83% 1.83% 1.83%
Projection $ 64.4 $ 65.5 $ 65.7 $ 66.0 $ 64.5 $ 68.7
Table 2.13 - Revenue from Money and Property Five-Year Forecast
($ in Millions)
Fiscal Year 2021-2025 Five-Year Financial Outlook
27 The City of San Diego | Department of Finance |
A slight adjustment for grants in FY 2020 is projected within the Revenue from Federal and Other
Agencies category for the FY 2021 through FY 2025 outlook period.
Charges for Services The revenue forecasted in the Charges for Services category is primarily comprised of cost
reimbursements for services rendered by the General Fund to non-general funds. This category
includes the 4.0 cent TOT reimbursements to the General Fund, General Government Services Billings
(GGSB), and other user fee revenues. This revenue source represents 11.4 percent of the City’s
General Fund FY 2020 Adopted Budget.
The following table displays the FY 2020 Adopted Budget and the forecast for FY 2021 through FY 2025
for revenue from charges for services.
Charges for Services category is projecting no growth since the Outlook does not assume any citywide
salary adjustments as discussed earlier in the report. While the estimated growth rate is zero within
this category, there is a reduction in revenue in FY 2021 primarily due to the following one-time
revenue in FY 2020:
• $10.9 million for the transfer of TOT excess fund balance
• $0.8 million for the reimbursement for disparity study from the Engineering & Capital Projects
Fund
• $0.5 million for the reimbursement for supplemental environmental projects- Regional Water
Quality Control Board
This Section Intentionally Left Blank
Growth Rate 0.0% 0.0% 0.0% 0.0% 0.0%
Projection $ 6.4 $ 6.3 $ 6.3 $ 6.3 $ 6.3 $ 6.3
Table 2.14 - Revenue From Federal and Other Agencies Five-Year Forecast
($ in Millions)
FY 2020
Adopted FY 2021 FY 2022 FY 2023 FY 2024 FY 2025
Fiscal Year 2021-2025 Five-Year Financial Outlook
28 The City of San Diego | Department of Finance |
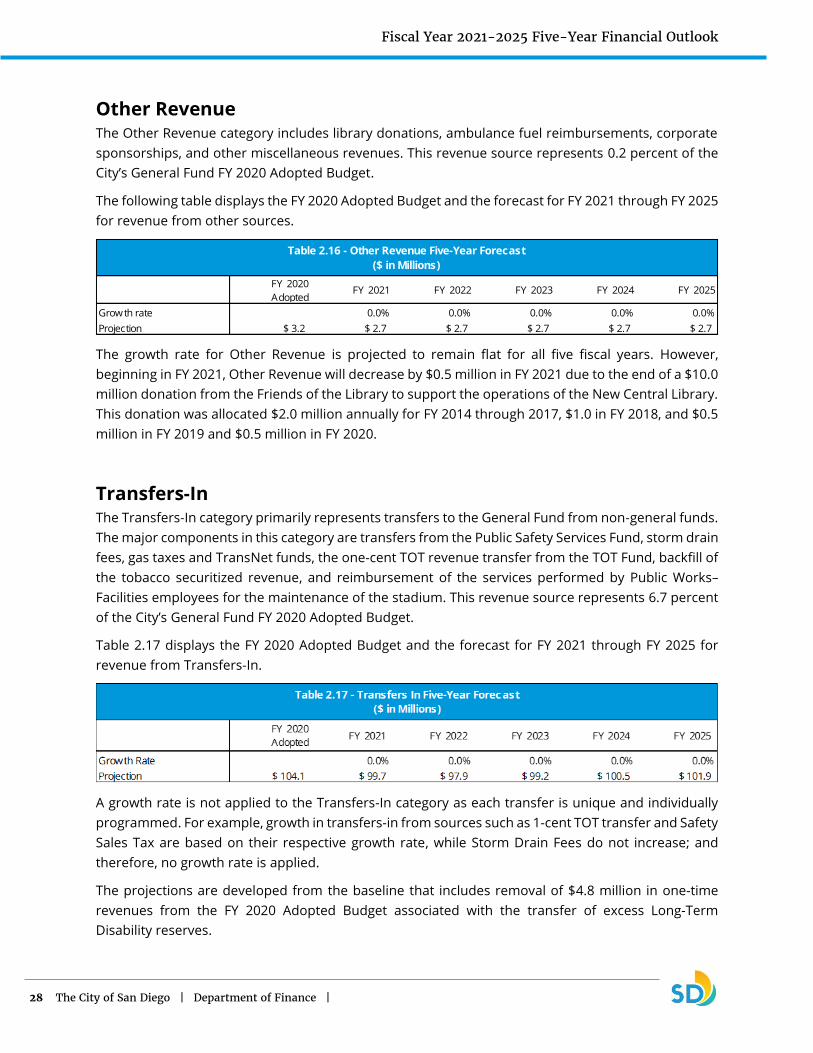
Other Revenue The Other Revenue category includes library donations, ambulance fuel reimbursements, corporate
sponsorships, and other miscellaneous revenues. This revenue source represents 0.2 percent of the
City’s General Fund FY 2020 Adopted Budget.
The following table displays the FY 2020 Adopted Budget and the forecast for FY 2021 through FY 2025
for revenue from other sources.
The growth rate for Other Revenue is projected to remain flat for all five fiscal years. However,
beginning in FY 2021, Other Revenue will decrease by $0.5 million in FY 2021 due to the end of a $10.0
million donation from the Friends of the Library to support the operations of the New Central Library.
This donation was allocated $2.0 million annually for FY 2014 through 2017, $1.0 in FY 2018, and $0.5
million in FY 2019 and $0.5 million in FY 2020.
Transfers-In The Transfers-In category primarily represents transfers to the General Fund from non-general funds.
The major components in this category are transfers from the Public Safety Services Fund, storm drain
fees, gas taxes and TransNet funds, the one-cent TOT revenue transfer from the TOT Fund, backfill of
the tobacco securitized revenue, and reimbursement of the services performed by Public Works–
Facilities employees for the maintenance of the stadium. This revenue source represents 6.7 percent
of the City’s General Fund FY 2020 Adopted Budget.
Table 2.17 displays the FY 2020 Adopted Budget and the forecast for FY 2021 through FY 2025 for
revenue from Transfers-In.
A growth rate is not applied to the Transfers-In category as each transfer is unique and individually
programmed. For example, growth in transfers-in from sources such as 1-cent TOT transfer and Safety
Sales Tax are based on their respective growth rate, while Storm Drain Fees do not increase; and
therefore, no growth rate is applied.
The projections are developed from the baseline that includes removal of $4.8 million in one-time
revenues from the FY 2020 Adopted Budget associated with the transfer of excess Long-Term
Disability reserves.
FY 2020
AdoptedFY 2021 FY 2022 FY 2023 FY 2024 FY 2025
Growth rate 0.0% 0.0% 0.0% 0.0% 0.0%
Projection $ 3.2 $ 2.7 $ 2.7 $ 2.7 $ 2.7 $ 2.7
Table 2.16 - Other Revenue Five-Year Forecast
($ in Millions)
Fiscal Year 2021-2025 Five-Year Financial Outlook
29 The City of San Diego | Department of Finance |
Safety sales tax reimbursements to the Police and Fire-Rescue Departments are projected to increase
consistent with sales tax revenue, as this revenue is a component of the citywide sales tax rate. Safety
sales tax revenue is derived from a half-cent sales tax resulting from the enactment of Proposition
172 in 1994. Annually, a certain amount of safety sales tax revenue is allocated to the Fire and
Lifeguard Facilities Fund for the payment of debt obligations associated with Fire and Lifeguard facility
improvements. The remaining revenue is distributed to the General Fund equally between the Police
and Fire-Rescue Departments’ budgets to support public safety needs.
This Section Intentionally Left Blank

Fiscal Year 2021-2025 Five-Year Financial Outlook
30 The City of San Diego | Department of Finance |
This Page Intentionally Left Blank

Fiscal Year 2021-2025 Five-Year Financial Outlook
31 The City of San Diego | Department of Finance |
Baseline General Fund Expenditures General Fund expenditures are comprised of both personnel and non-personnel expenditures
including debt service and other non-discretionary payments. Unless otherwise noted, baseline
projections assume growth based upon the FY 2020 Adopted Budget with the removal of one-time
expenditures. One-time expenditures that have been removed from the baseline projections are
detailed in Attachment 2: One-Time Resources and Expenditures.
Personnel expenditures represent 69.9 percent of the City’s General Fund FY 2020 Adopted Budget.
This section discusses the following key components of personnel expenses: Salaries and Wages; the
City’s annual pension payment or Actuarially Determined Contribution (ADC); flexible benefits, retiree
healthcare or Other Post-Employment Benefits (OPEB); workers’ compensation; Supplemental
Pension Savings Plan (SPSP); and other fringe benefits. Baseline personnel expenses are projected to
increase during the outlook period, primarily due to the inclusion of pensionable and non-pensionable
compensation increases resulting from agreements in previous fiscal years between the City and its
REOs.
Projections for ongoing non-personnel expenses are also included in the baseline projections and are
based on significant anticipated adjustments and historical trend analysis. Beyond inflationary
increases in supplies, contracts, and energy and utilities, the most significant non-personnel expenses
are for Information Technology (IT) fixed costs.
Figure 2.13 depicts the growth in Baseline Personnel and Non-Personnel Expenditures.
This Section Intentionally Left Blank
Fiscal Year 2021-2025 Five-Year Financial Outlook
32 The City of San Diego | Department of Finance |
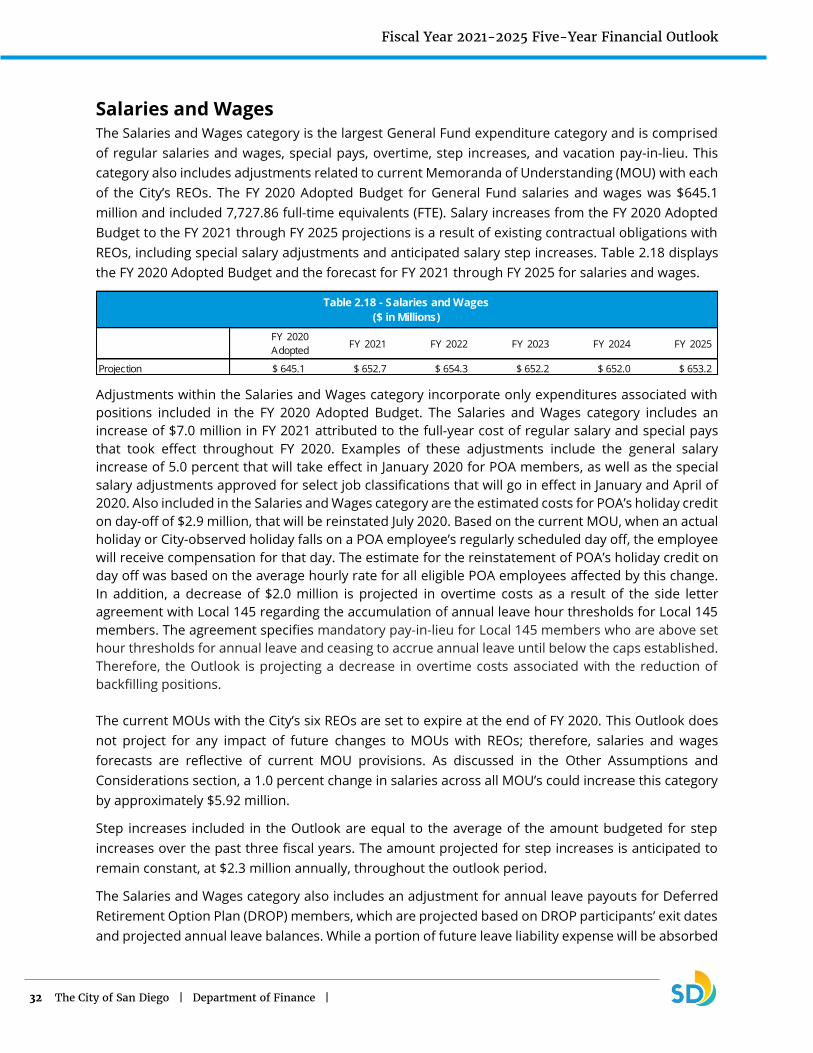
Salaries and Wages The Salaries and Wages category is the largest General Fund expenditure category and is comprised
of regular salaries and wages, special pays, overtime, step increases, and vacation pay-in-lieu. This
category also includes adjustments related to current Memoranda of Understanding (MOU) with each
of the City’s REOs. The FY 2020 Adopted Budget for General Fund salaries and wages was $645.1
million and included 7,727.86 full-time equivalents (FTE). Salary increases from the FY 2020 Adopted
Budget to the FY 2021 through FY 2025 projections is a result of existing contractual obligations with
REOs, including special salary adjustments and anticipated salary step increases. Table 2.18 displays
the FY 2020 Adopted Budget and the forecast for FY 2021 through FY 2025 for salaries and wages.
Adjustments within the Salaries and Wages category incorporate only expenditures associated with
positions included in the FY 2020 Adopted Budget. The Salaries and Wages category includes an
increase of $7.0 million in FY 2021 attributed to the full-year cost of regular salary and special pays
that took effect throughout FY 2020. Examples of these adjustments include the general salary
increase of 5.0 percent that will take effect in January 2020 for POA members, as well as the special
salary adjustments approved for select job classifications that will go in effect in January and April of
2020. Also included in the Salaries and Wages category are the estimated costs for POA’s holiday credit
on day-off of $2.9 million, that will be reinstated July 2020. Based on the current MOU, when an actual
holiday or City-observed holiday falls on a POA employee’s regularly scheduled day off, the employee
will receive compensation for that day. The estimate for the reinstatement of POA’s holiday credit on
day off was based on the average hourly rate for all eligible POA employees affected by this change.
In addition, a decrease of $2.0 million is projected in overtime costs as a result of the side letter
agreement with Local 145 regarding the accumulation of annual leave hour thresholds for Local 145
members. The agreement specifies mandatory pay-in-lieu for Local 145 members who are above set
hour thresholds for annual leave and ceasing to accrue annual leave until below the caps established.
Therefore, the Outlook is projecting a decrease in overtime costs associated with the reduction of
backfilling positions.
The current MOUs with the City’s six REOs are set to expire at the end of FY 2020. This Outlook does
not project for any impact of future changes to MOUs with REOs; therefore, salaries and wages
forecasts are reflective of current MOU provisions. As discussed in the Other Assumptions and
Considerations section, a 1.0 percent change in salaries across all MOU’s could increase this category
by approximately $5.92 million.
Step increases included in the Outlook are equal to the average of the amount budgeted for step
increases over the past three fiscal years. The amount projected for step increases is anticipated to
remain constant, at $2.3 million annually, throughout the outlook period.
The Salaries and Wages category also includes an adjustment for annual leave payouts for Deferred
Retirement Option Plan (DROP) members, which are projected based on DROP participants’ exit dates
and projected annual leave balances. While a portion of future leave liability expense will be absorbed
Projection $ 645.1 $ 652.7 $ 654.3 $ 652.2 $ 652.0 $ 653.2
Table 2.18 - Salaries and Wages
($ in Millions)
FY 2020
Adopted FY 2021 FY 2022 FY 2023 FY 2024 FY 2025
Fiscal Year 2021-2025 Five-Year Financial Outlook
33 The City of San Diego | Department of Finance |
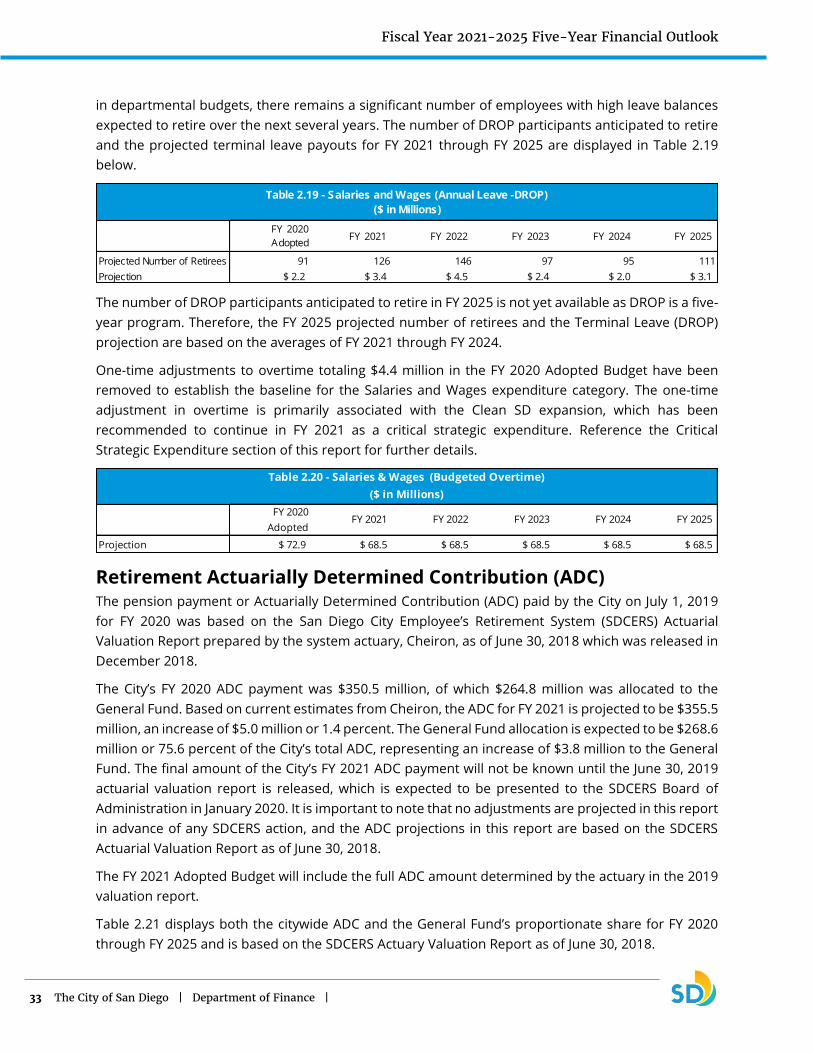
in departmental budgets, there remains a significant number of employees with high leave balances
expected to retire over the next several years. The number of DROP participants anticipated to retire
and the projected terminal leave payouts for FY 2021 through FY 2025 are displayed in Table 2.19
below.
The number of DROP participants anticipated to retire in FY 2025 is not yet available as DROP is a five-
year program. Therefore, the FY 2025 projected number of retirees and the Terminal Leave (DROP)
projection are based on the averages of FY 2021 through FY 2024.
One-time adjustments to overtime totaling $4.4 million in the FY 2020 Adopted Budget have been
removed to establish the baseline for the Salaries and Wages expenditure category. The one-time
adjustment in overtime is primarily associated with the Clean SD expansion, which has been
recommended to continue in FY 2021 as a critical strategic expenditure. Reference the Critical
Strategic Expenditure section of this report for further details.
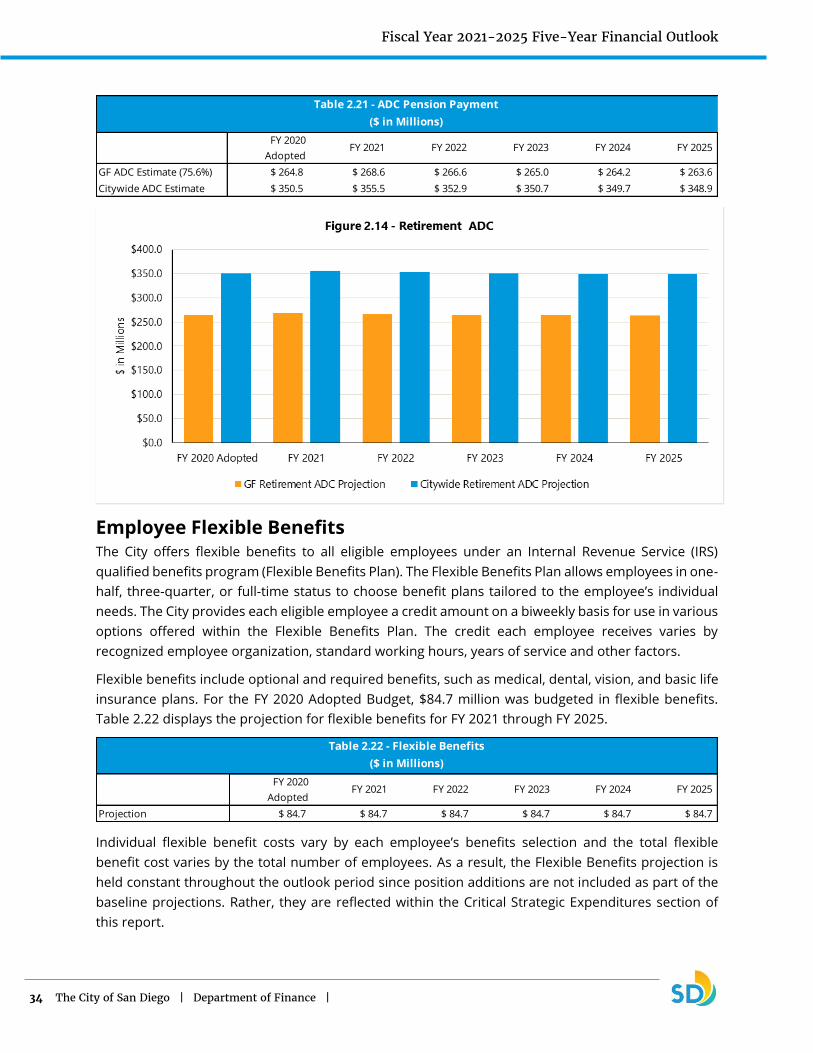
Retirement Actuarially Determined Contribution (ADC) The pension payment or Actuarially Determined Contribution (ADC) paid by the City on July 1, 2019
for FY 2020 was based on the San Diego City Employee’s Retirement System (SDCERS) Actuarial
Valuation Report prepared by the system actuary, Cheiron, as of June 30, 2018 which was released in
December 2018.
The City’s FY 2020 ADC payment was $350.5 million, of which $264.8 million was allocated to the
General Fund. Based on current estimates from Cheiron, the ADC for FY 2021 is projected to be $355.5
million, an increase of $5.0 million or 1.4 percent. The General Fund allocation is expected to be $268.6
million or 75.6 percent of the City’s total ADC, representing an increase of $3.8 million to the General
Fund. The final amount of the City’s FY 2021 ADC payment will not be known until the June 30, 2019
actuarial valuation report is released, which is expected to be presented to the SDCERS Board of
Administration in January 2020. It is important to note that no adjustments are projected in this report
in advance of any SDCERS action, and the ADC projections in this report are based on the SDCERS
Actuarial Valuation Report as of June 30, 2018.
The FY 2021 Adopted Budget will include the full ADC amount determined by the actuary in the 2019
valuation report.
Table 2.21 displays both the citywide ADC and the General Fund’s proportionate share for FY 2020
through FY 2025 and is based on the SDCERS Actuary Valuation Report as of June 30, 2018.
Projected Number of Retirees 91 126 146 97 95 111
Projection $ 2.2 $ 3.4 $ 4.5 $ 2.4 $ 2.0 $ 3.1
Table 2.19 - Salaries and Wages (Annual Leave -DROP)
($ in Millions)
FY 2020
Adopted FY 2021 FY 2022 FY 2023 FY 2024 FY 2025
Projection $ 72.9 $ 68.5 $ 68.5 $ 68.5 $ 68.5 $ 68.5
Table 2.20 - Salaries & Wages (Budgeted Overtime)
($ in Millions)
FY 2020
Adopted FY 2021 FY 2022 FY 2023 FY 2024 FY 2025
Fiscal Year 2021-2025 Five-Year Financial Outlook
34 The City of San Diego | Department of Finance |
Employee Flexible Benefits The City offers flexible benefits to all eligible employees under an Internal Revenue Service (IRS)
qualified benefits program (Flexible Benefits Plan). The Flexible Benefits Plan allows employees in one-
half, three-quarter, or full-time status to choose benefit plans tailored to the employee’s individual
needs. The City provides each eligible employee a credit amount on a biweekly basis for use in various
options offered within the Flexible Benefits Plan. The credit each employee receives varies by
recognized employee organization, standard working hours, years of service and other factors.
Flexible benefits include optional and required benefits, such as medical, dental, vision, and basic life
insurance plans. For the FY 2020 Adopted Budget, $84.7 million was budgeted in flexible benefits.
Table 2.22 displays the projection for flexible benefits for FY 2021 through FY 2025.
Individual flexible benefit costs vary by each employee’s benefits selection and the total flexible
benefit cost varies by the total number of employees. As a result, the Flexible Benefits projection is
held constant throughout the outlook period since position additions are not included as part of the
baseline projections. Rather, they are reflected within the Critical Strategic Expenditures section of
this report.
FY 2020
Adopted FY 2021 FY 2022 FY 2023 FY 2024 FY 2025
GF ADC Estimate (75.6%) $ 264.8 $ 268.6 $ 266.6 $ 265.0 $ 264.2 $ 263.6
Citywide ADC Estimate $ 350.5 $ 355.5 $ 352.9 $ 350.7 $ 349.7 $ 348.9
Table 2.21 - ADC Pension Payment
($ in Millions)
Projection $ 84.7 $ 84.7 $ 84.7 $ 84.7 $ 84.7 $ 84.7
Table 2.22 - Flexible Benefits
($ in Millions)
FY 2020
Adopted FY 2021 FY 2022 FY 2023 FY 2024 FY 2025
Fiscal Year 2021-2025 Five-Year Financial Outlook
35 The City of San Diego | Department of Finance |
Other Post-Employment Benefits (OPEB) Other Post-Employment Benefits (OPEB) represent the cost of retiree healthcare. The OPEB Unfunded
Actuarial Accrued Liability (UAAL) as of June 30, 2018 was approximately $467.7 million and the annual
required contribution was determined to be $43.4 million.
In FY 2012, the City entered a 15-year memorandum of understanding with each of the Recognized
Employee Organizations regarding reforms to the retiree healthcare benefit for health-eligible
employees (Healthcare MOU). The Healthcare MOU sets the City's OPEB contribution at $57.8 million
for FY 2013 through FY 2015, with annual increases of up to 2.5 percent based on actuarial valuations.
The City also has a trust with the California Employers’ Retiree Benefit Trust (CERBT) from which it
draws annually to cover the full cost of other post-employment benefits. The following table displays
both the citywide OPEB projection and the General Fund’s proportionate share for FY 2021 through
FY 2025.
The FY 2020 Adopted Budget included $42.3 million for the General Fund portion of OPEB. The
General Fund portion is determined by the percentage of FTE positions budgeted within the General
Fund versus non-general funds. The General Fund’s proportionate share of the OPEB payment is
projected to increase by 2.5 percent based on the Healthcare MOU agreement.
Workers’ Compensation State workers' compensation laws ensure that employees who are injured or disabled on the job are
provided with monetary compensation. These laws are intended to reduce litigation and to provide
benefits for workers (and dependents) who suffer work-related injuries or illnesses. State workers'
compensation statutes establish the framework of laws for the City.
The City’s workers’ compensation expenses are comprised of two components. Operating expenses
are the first component, which covers the costs of current medical expenses and claims. The second
component covers contributions to the Workers’ Compensation Reserve. Table 2.24 displays the
General Fund’s projected share of 84.6 percent of Workers’ Compensation expenses.
FY 2020
Adopted FY 2021 FY 2022 FY 2023 FY 2024 FY 2025
Growth Rate 2.5% 2.5% 2.5% 2.5% 2.5%
GF OPEB Projection (64.7%) $ 42.3 $ 43.4 $ 44.5 $ 45.6 $ 46.7 $ 47.9
Citywide OPEB Projection $ 65.4 $ 67.0 $ 68.7 $ 70.4 $ 72.2 $ 74.0
Table 2.23 - Other Post Employment Benefits (OPEB)
($ in Millions)
Operating $ 26.5 $ 28.4 $ 29.1 $ 29.9 $ 30.7 $ 31.4
Reserves $ - $ 0.1 $ 0.7 $ 0.7 $ 0.7 $ 0.8
Total $ 26.5 $ 28.5 $ 29.8 $ 30.6 $ 31.4 $ 32.2
Table 2.24 - Workers' Compensation
($ in Millions)
FY 2020
Adopted FY 2021 FY 2022 FY 2023 FY 2024 FY 2025
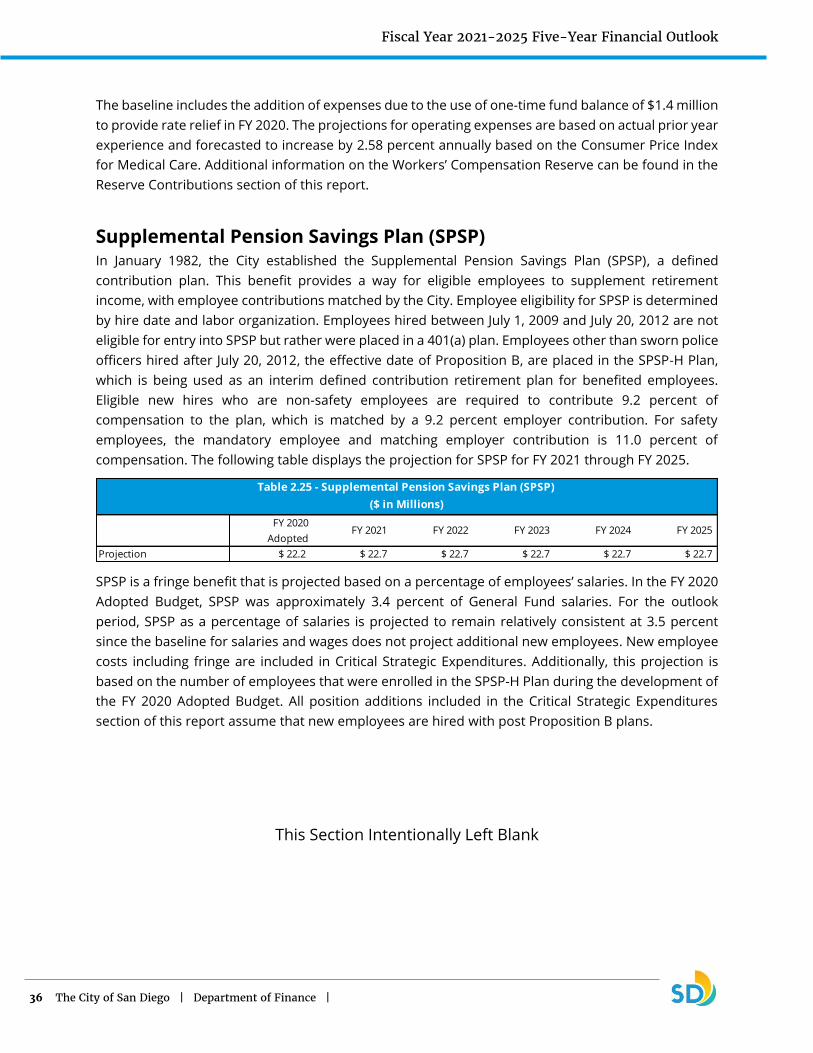
Fiscal Year 2021-2025 Five-Year Financial Outlook
36 The City of San Diego | Department of Finance |
The baseline includes the addition of expenses due to the use of one-time fund balance of $1.4 million
to provide rate relief in FY 2020. The projections for operating expenses are based on actual prior year
experience and forecasted to increase by 2.58 percent annually based on the Consumer Price Index
for Medical Care. Additional information on the Workers’ Compensation Reserve can be found in the
Reserve Contributions section of this report.
Supplemental Pension Savings Plan (SPSP) In January 1982, the City established the Supplemental Pension Savings Plan (SPSP), a defined
contribution plan. This benefit provides a way for eligible employees to supplement retirement
income, with employee contributions matched by the City. Employee eligibility for SPSP is determined
by hire date and labor organization. Employees hired between July 1, 2009 and July 20, 2012 are not
eligible for entry into SPSP but rather were placed in a 401(a) plan. Employees other than sworn police
officers hired after July 20, 2012, the effective date of Proposition B, are placed in the SPSP-H Plan,
which is being used as an interim defined contribution retirement plan for benefited employees.
Eligible new hires who are non-safety employees are required to contribute 9.2 percent of
compensation to the plan, which is matched by a 9.2 percent employer contribution. For safety
employees, the mandatory employee and matching employer contribution is 11.0 percent of
compensation. The following table displays the projection for SPSP for FY 2021 through FY 2025.
SPSP is a fringe benefit that is projected based on a percentage of employees’ salaries. In the FY 2020
Adopted Budget, SPSP was approximately 3.4 percent of General Fund salaries. For the outlook
period, SPSP as a percentage of salaries is projected to remain relatively consistent at 3.5 percent
since the baseline for salaries and wages does not project additional new employees. New employee
costs including fringe are included in Critical Strategic Expenditures. Additionally, this projection is
based on the number of employees that were enrolled in the SPSP-H Plan during the development of
the FY 2020 Adopted Budget. All position additions included in the Critical Strategic Expenditures
section of this report assume that new employees are hired with post Proposition B plans.
This Section Intentionally Left Blank
Projection $ 22.2 $ 22.7 $ 22.7 $ 22.7 $ 22.7 $ 22.7
Table 2.25 - Supplemental Pension Savings Plan (SPSP)
($ in Millions)
FY 2020
Adopted FY 2021 FY 2022 FY 2023 FY 2024 FY 2025

Fiscal Year 2021-2025 Five-Year Financial Outlook
37 The City of San Diego | Department of Finance |
Other Fringe Benefits The Other Fringe Benefits category is comprised of Long-Term Disability, Medicare, Retiree Medical
Trust, 401(a) plan contributions, Retirement DROP contributions, Employee Offset Savings, Risk
Management Administration, and Unemployment Insurance expenditures. Table 2.26 displays the
projection for Other Fringe Benefits.
The baseline includes the addition of Long-term Disability expenses due to the use of one-time fund
balance of $2.7 million to provide rate relief in FY 2020. Other Fringe Benefits are projected based on
a percentage of employees’ salaries. In the FY 2020 Adopted Budget, Other Fringe Benefits were
approximately 4.1 percent of General Fund salaries. For the outlook period, that percentage is
projected to be consistent at 4.4 percent. Slight increases during the outlook period are a result of
salary increases included within the Salaries and Wages category.
This Section Intentionally Left Blank
Projection $ 26.3 $ 28.7 $ 28.7 $ 28.7 $ 28.7 $ 28.7
Table 2.26- Other Fringe Benefits
($ in Millions)
FY 2020
Adopted FY 2021 FY 2022 FY 2023 FY 2024 FY 2025

Fiscal Year 2021-2025 Five-Year Financial Outlook
38 The City of San Diego | Department of Finance |
Supplies The Supplies category includes costs for office supplies, books, tools, uniforms, safety supplies, and
building and electrical materials. Table 2.27 displays projections for the Supplies category.
The FY 2020 Adopted Budget includes one-time expenditures of $0.7 million associated with supplies
for the Fire-Rescue Department’s staffing model and relief pool, which includes the addition of two
fire academies approved in FY 2020. The one-time expenditures are removed from the baseline and
partially offset with an additional $3.0 million in expenditures previously supported by one-time use
of infrastructure funds for right-of-way operations and maintenance in FY 2020. Additionally, a 4.6
percent increase has been applied based on historical average increases in the Supplies category over
the past several years.
Contracts Contracts are a non-personnel expense category that includes the cost of professional consultant
fees, insurance, refuse disposal fees, fleet vehicle usage and assignment fees, rental expenses, and
other contractual expenses. Table 2.28 displays the projections for the Contracts category.
An annual growth rate of 3.9 percent is applied based on a historical analysis. Adjustments are made
to the baseline for known and anticipated events including known public liability insurance costs, and
pre-programed Parks Master Plan wind down. The FY 2020 Adopted Budget included $11.3 million in
one-time expenditures within the Contracts category. The following summarizes the majority of one-
time expenditures that have been removed from the baseline projections:
• $2.7 million in expenditures to expand the Clean SD program
• $2.2 million to support the City’s contractual agreement with the San Diego Humane
Society for animal services
• $1.5 million for community projects, programs, and services (CPPS) which are calculated
based on savings from the prior year budget
• $1.0 million for consultant costs associated with the San Diego Gas and Electric (SDG&E)
negotiations. SDG&E currently operates under a 50-year City franchise agreement that is
set to expire by January 2021
Growth Rate 4.6% 4.6% 4.6% 4.6% 4.6%
Projection $ 27.3 $ 30.9 $ 32.3 $ 33.8 $ 35.4 $ 36.7
Table 2.27 - Supplies
($ in millions)
FY 2020
Adopted FY 2021 FY 2022 FY 2023 FY 2024 FY 2025
Growth Rate 3.9% 3.9% 3.9% 3.9% 3.9%
Projection $ 246.9 $ 247.9 $ 256.8 $ 267.8 $ 279.3 $ 291.6
Table 2.28 - Contracts
($ in Millions)
FY 2020
Adopted FY 2021 FY 2022 FY 2023 FY 2024 FY 2025

Fiscal Year 2021-2025 Five-Year Financial Outlook
39 The City of San Diego | Department of Finance |
• $0.80 million for a citywide disparity study. This analysis is done with the intent of
identifying any gaps in an agency’s contracting with traditionally underrepresented groups
and includes recommendations on how to remedy those gaps
• $0.70 million in additional moving expenses associated with the 101 Ash Street building
• $0.50 million in additional one-time vehicle purchases for the support of Parks and
Recreation new facilities
• $0.45 million in net expenses for citywide election costs
This is offset with an additional $2.6 million for public liability claims/non-claims included as a one-
time use of Public Liability Reserves in FY 2020. This one-time adjustment has been added back to the
baseline projection to be accounted for in outlying years.
Information Technology The Information Technology category includes both discretionary expenses and non-discretionary
allocations to General Fund departments. The Information Technology category includes the costs
related to hardware and software maintenance, help desk support, and other information technology
(IT) services. Table 2.29 displays the projections for the Information Technology category.
Base IT costs are inflated by the California Consumer Price Index. An adjustment to the FY 2020
Adopted Budget for one-time miscellaneous IT costs of $0.8 million serves as the baseline for this
category.
The FY 2021 forecast has an increase of $7.9 million associated with non-discretionary IT costs which
include desktop support, networks bandwidth, data-centers, cyber security, cloud transformation, and
applications. These costs are independently forecasted from base IT costs, since these costs include
planned transition and end-of-life equipment replacement which changes from year to year. These
estimates are developed assuming that City will maintain the core levels of IT security and services.
This Section Intentionally Left Blank
Growth Rate 20.2% 2.5% -0.7% 0.3% -1.2%
Projection $ 39.1 $ 47.0 $ 48.1 $ 47.8 $ 47.9 $ 47.4
Table 2.29 - Information Technology
($ in Millions)
FY 2020
Adopted FY 2021 FY 2022 FY 2023 FY 2024 FY 2025
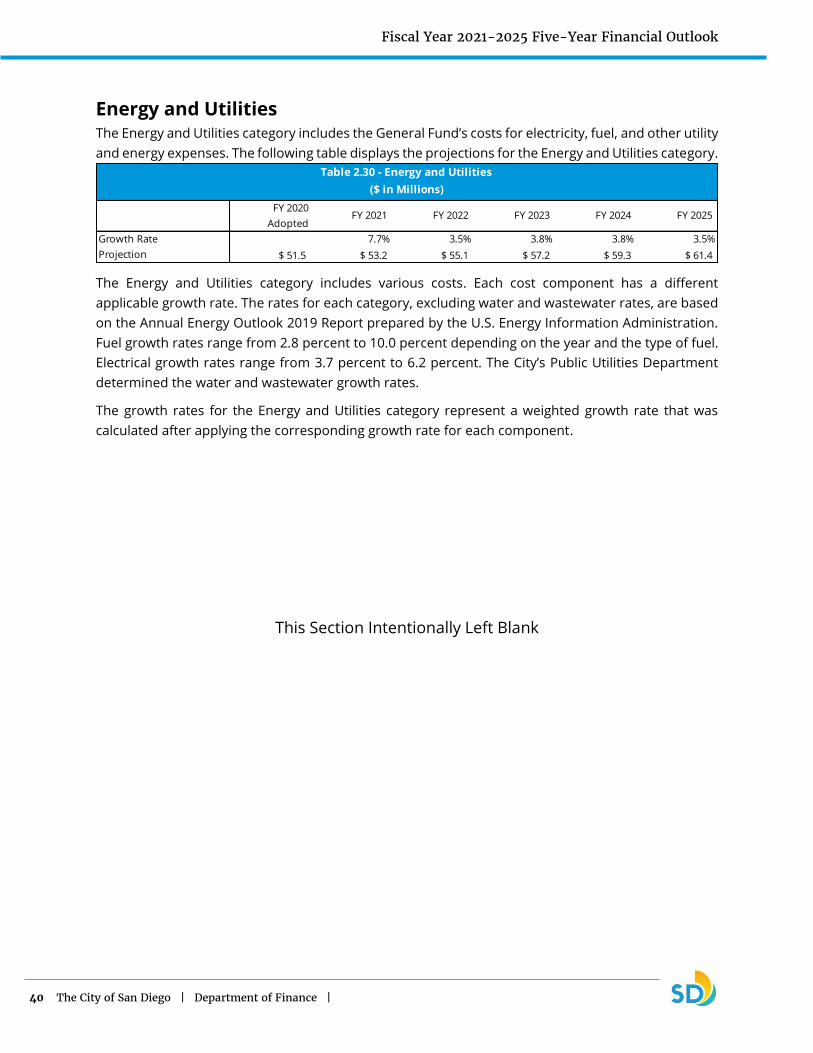
Fiscal Year 2021-2025 Five-Year Financial Outlook
40 The City of San Diego | Department of Finance |
Energy and Utilities The Energy and Utilities category includes the General Fund’s costs for electricity, fuel, and other utility
and energy expenses. The following table displays the projections for the Energy and Utilities category.
The Energy and Utilities category includes various costs. Each cost component has a different
applicable growth rate. The rates for each category, excluding water and wastewater rates, are based
on the Annual Energy Outlook 2019 Report prepared by the U.S. Energy Information Administration.
Fuel growth rates range from 2.8 percent to 10.0 percent depending on the year and the type of fuel.
Electrical growth rates range from 3.7 percent to 6.2 percent. The City’s Public Utilities Department
determined the water and wastewater growth rates.
The growth rates for the Energy and Utilities category represent a weighted growth rate that was
calculated after applying the corresponding growth rate for each component.
This Section Intentionally Left Blank
Growth Rate 7.7% 3.5% 3.8% 3.8% 3.5%
Projection $ 51.5 $ 53.2 $ 55.1 $ 57.2 $ 59.3 $ 61.4
Table 2.30 - Energy and Utilities
($ in Millions)
FY 2020
Adopted FY 2021 FY 2022 FY 2023 FY 2024 FY 2025

Fiscal Year 2021-2025 Five-Year Financial Outlook
41 The City of San Diego | Department of Finance |
Reserve Contributions The City’s Reserve Fund Policy requires that reserve funds are maintained at certain levels. The City’s
Reserves include the General Fund Reserve (Emergency Reserve and Stability Reserve), Pension
Payment Stabilization Reserve, Public Liability Fund Reserve, Long-Term Disability Fund Reserve, and
Workers’ Compensation Fund Reserve. The City also maintains other reserves for various enterprise
funds which are not included in this report. The Outlook includes annual contributions that fully fund
the General Fund reserves to their targeted levels in the City’s Reserve Policy.
Table 2.31 details the FY 2020 projected reserve balance in the funds, the percentage targets, and
contribution forecasted to maintain the City’s reserve funds.
The General Fund Reserve annual contributions reflect the required amount to reach the policy target
levels and meet overall target level of 16.7 percent by FY 2025.
The Pension Payment Stabilization Reserve contributions reflect the current replenishment plan. The
target level of 8.0 percent will be met by FY 2023.
Public Liability Reserve is anticipated to be at the target level of 50.0 percent of outstanding claims
and no additional contributions are anticipated in the outlook period.
The Long-Term Disability Fund exceeds its target level of 100.0 percent of outstanding claims. No
additional contributions to the Long-Term Disability Fund are anticipated in the outlook period.
FY 2020
Proj.
Fiscal Year
2021
Fiscal Year
2022
Fiscal Year
2023
Fiscal Year
2024
Fiscal Year
2025
General Fund Target (%) 15.50% 15.75% 16.00% 16.25% 16.50% 16.70%
General Fund Reserve Level ($) $ 205.7 $ 218.5 $ 231.8 $ 243.2 $ 255.9 $ 268.1
General Fund Contribution Amount $ 11.9 $ 12.8 $ 13.3 $ 11.5 $ 12.7 $ 12.2
Pension Stability Target (%) 8.0% 8.0% 8.0% 8.0% 8.0% 8.0%
Pension Stability Reserve Target ($) $ 26.6 $ 27.4 $ 28.2 $ 28.2 $ 28.1 $ 28.0
Pension Stability Reserve Level Projection ($) $ 10.6 $ 16.5 $ 22.6 $ 28.2 $ 28.1 $ 28.0
Pension Stability Contribution Amount $ 10.6 $ 5.8 $ 6.1 $ 5.7 $ - $ -
Pension Stability Contribution Amount (GF) $ 4.3 $ 4.5 $ 4.7 $ 4.3 $ - $ -
Public Liability Target (%) 50.0% 50.0% 50.0% 50.0% 50.0% 50.0%
Public Liability Reserve Level Goal ($) $ 32.1 $ 32.1 $ 32.1 $ 32.1 $ 32.1 $ 32.1
Public Liability Reserve Level Projection ($) $ 32.1 $ 32.1 $ 32.1 $ 32.1 $ 32.1 $ 32.1
Public Liability Contribution Amount - - - - - -
Long-Term Disability Fund Target (%) 100.0% 100.0% 100.0% 100.0% 100.0% 100.0%
Long-Term Disability Fund Reserve Target($) $ 3.9 $ 3.9 $ 3.9 $ 3.9 $ 3.9 $ 3.9
Long-Term Disability Fund Reserve Level Projection ($) $ 3.9 $ 3.9 $ 3.9 $ 3.9 $ 3.9 $ 3.9
Long-Term Disability Contribution Amount - - - - - -
Workers' Compensation Target (%) 12.0% 12.0% 12.0% 12.0% 12.0% 12.0%
Workers' Compensation Reserve Target ($) $ 31.9 $ 32.4 $ 33.2 $ 34.0 $ 34.9 $ 35.8
Workers' Compensation Reserve Level Projection ($) $ 32.2 $ 32.4 $ 33.2 $ 34.0 $ 34.9 $ 35.8
Workers' Compensation Contribution Amount $ - $ 0.2 $ 0.8 $ 0.9 $ 0.9 $ 0.9
Workers' Compensation Contribution Amount (GF) $ - $ 0.1 $ 0.7 $ 0.7 $ 0.7 $ 0.8
Table 2.31 - Reserve Target Levels
($ in Millions)
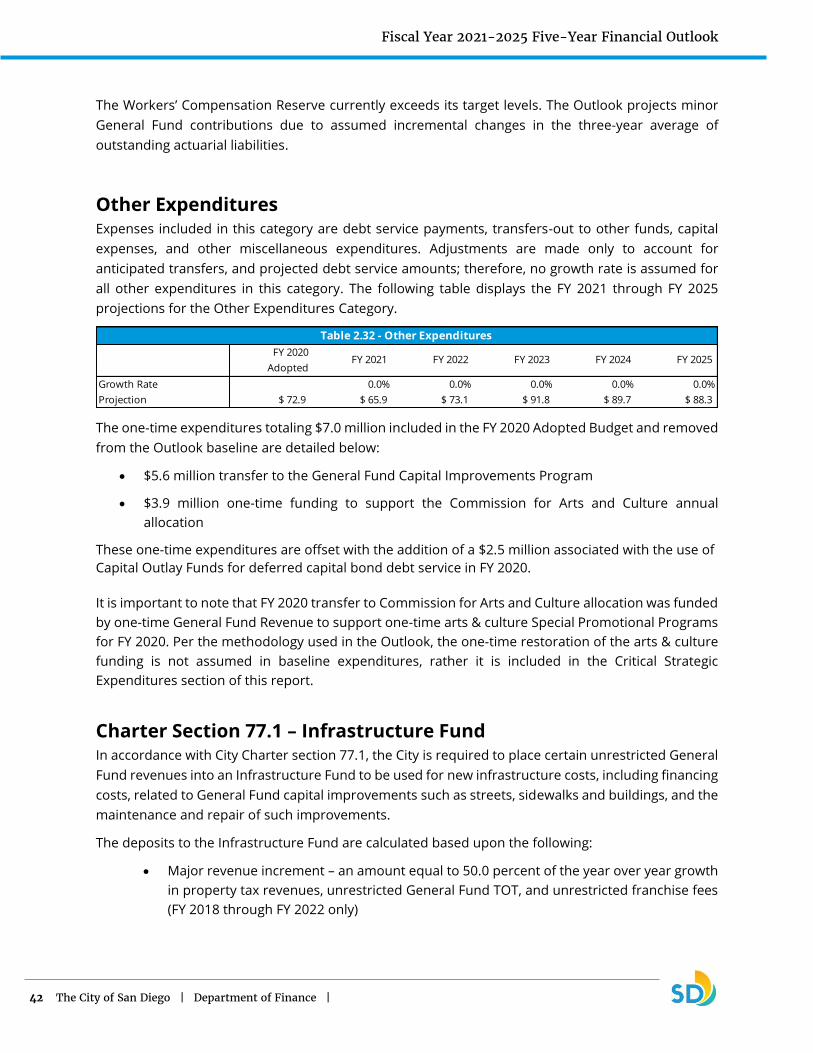
Fiscal Year 2021-2025 Five-Year Financial Outlook
42 The City of San Diego | Department of Finance |
The Workers’ Compensation Reserve currently exceeds its target levels. The Outlook projects minor
General Fund contributions due to assumed incremental changes in the three-year average of
outstanding actuarial liabilities.
Other Expenditures Expenses included in this category are debt service payments, transfers-out to other funds, capital
expenses, and other miscellaneous expenditures. Adjustments are made only to account for
anticipated transfers, and projected debt service amounts; therefore, no growth rate is assumed for
all other expenditures in this category. The following table displays the FY 2021 through FY 2025
projections for the Other Expenditures Category.
The one-time expenditures totaling $7.0 million included in the FY 2020 Adopted Budget and removed
from the Outlook baseline are detailed below:
• $5.6 million transfer to the General Fund Capital Improvements Program
• $3.9 million one-time funding to support the Commission for Arts and Culture annual
allocation
These one-time expenditures are offset with the addition of a $2.5 million associated with the use of
Capital Outlay Funds for deferred capital bond debt service in FY 2020.
It is important to note that FY 2020 transfer to Commission for Arts and Culture allocation was funded
by one-time General Fund Revenue to support one-time arts & culture Special Promotional Programs
for FY 2020. Per the methodology used in the Outlook, the one-time restoration of the arts & culture
funding is not assumed in baseline expenditures, rather it is included in the Critical Strategic
Expenditures section of this report.
Charter Section 77.1 – Infrastructure Fund In accordance with City Charter section 77.1, the City is required to place certain unrestricted General
Fund revenues into an Infrastructure Fund to be used for new infrastructure costs, including financing
costs, related to General Fund capital improvements such as streets, sidewalks and buildings, and the
maintenance and repair of such improvements.
The deposits to the Infrastructure Fund are calculated based upon the following:
• Major revenue increment – an amount equal to 50.0 percent of the year over year growth
in property tax revenues, unrestricted General Fund TOT, and unrestricted franchise fees
(FY 2018 through FY 2022 only)
Growth Rate 0.0% 0.0% 0.0% 0.0% 0.0%
Projection $ 72.9 $ 65.9 $ 73.1 $ 91.8 $ 89.7 $ 88.3
Table 2.32 - Other Expenditures
FY 2020
Adopted FY 2021 FY 2022 FY 2023 FY 2024 FY 2025
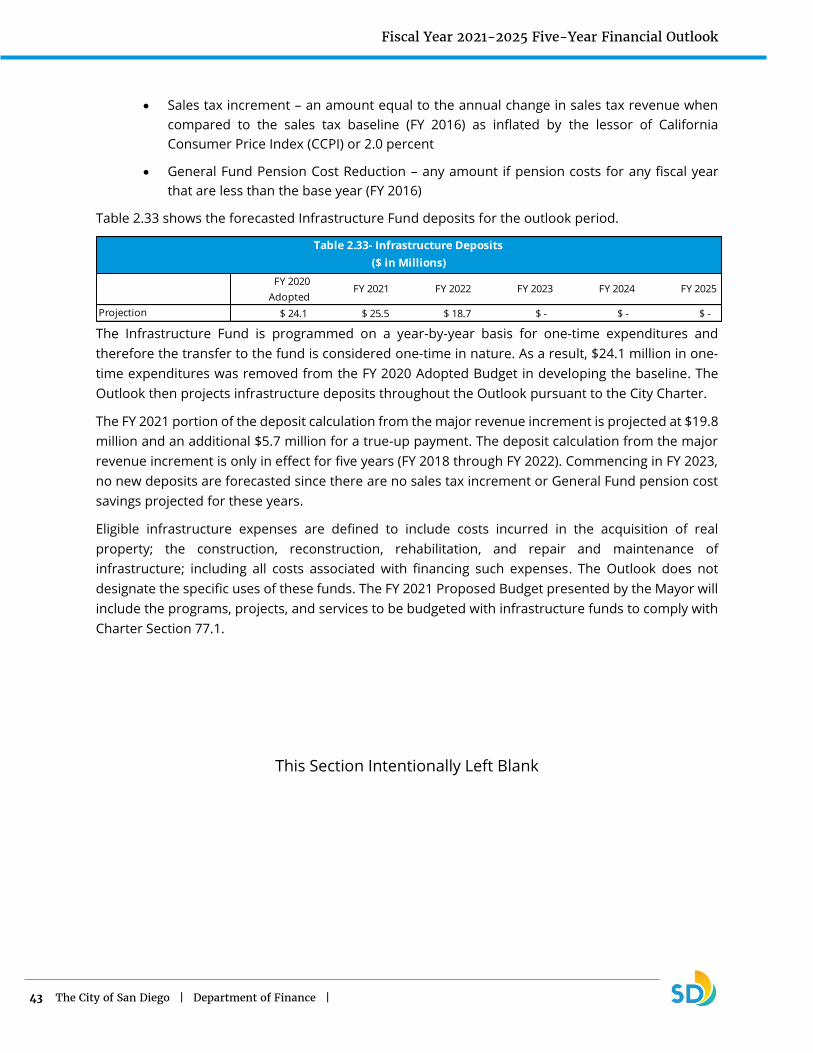
Fiscal Year 2021-2025 Five-Year Financial Outlook
43 The City of San Diego | Department of Finance |
• Sales tax increment – an amount equal to the annual change in sales tax revenue when
compared to the sales tax baseline (FY 2016) as inflated by the lessor of California
Consumer Price Index (CCPI) or 2.0 percent
• General Fund Pension Cost Reduction – any amount if pension costs for any fiscal year
that are less than the base year (FY 2016)
Table 2.33 shows the forecasted Infrastructure Fund deposits for the outlook period.
The Infrastructure Fund is programmed on a year-by-year basis for one-time expenditures and
therefore the transfer to the fund is considered one-time in nature. As a result, $24.1 million in one-
time expenditures was removed from the FY 2020 Adopted Budget in developing the baseline. The
Outlook then projects infrastructure deposits throughout the Outlook pursuant to the City Charter.
The FY 2021 portion of the deposit calculation from the major revenue increment is projected at $19.8
million and an additional $5.7 million for a true-up payment. The deposit calculation from the major
revenue increment is only in effect for five years (FY 2018 through FY 2022). Commencing in FY 2023,
no new deposits are forecasted since there are no sales tax increment or General Fund pension cost
savings projected for these years.
Eligible infrastructure expenses are defined to include costs incurred in the acquisition of real
property; the construction, reconstruction, rehabilitation, and repair and maintenance of
infrastructure; including all costs associated with financing such expenses. The Outlook does not
designate the specific uses of these funds. The FY 2021 Proposed Budget presented by the Mayor will
include the programs, projects, and services to be budgeted with infrastructure funds to comply with
Charter Section 77.1.
This Section Intentionally Left Blank
Projection $ 24.1 $ 25.5 $ 18.7 $ - $ - $ -
Table 2.33- Infrastructure Deposits
($ in Millions)
FY 2020
Adopted FY 2021 FY 2022 FY 2023 FY 2024 FY 2025
Fiscal Year 2021-2025 Five-Year Financial Outlook
44 The City of San Diego | Department of Finance |
This Page Intentionally Left Blank

Fiscal Year 2021-2025 Five-Year Financial Outlook
45 The City of San Diego | Department of Finance |
CRITICAL STRATEGIC EXPENDITURES The Outlook identifies future potential critical needs for the City that are supported by the General
Fund. Such critical needs encompass several issues such as critical operational funding necessary for
meeting core service levels and are consistent with the City’s Strategic Plan. Critical strategic
expenditures requests are of the highest priority and reflect the shared goals of the City Council and
the Mayor. Requests that are already accounted for in the baseline projections, not fully developed,
require additional prioritization, or not previously approved by the Mayor or City Council were not
considered critical strategic expenditures for this report. Examples include inflationary and
contractual increase requests, which are accounted for in baseline expenditure projections, personnel
additions not associated with a critical strategic need, and new programs or enhancements to services
that may require additional analysis and research. Any requests submitted for capital project costs,
have also not been included in this report, as these requests are accounted for in the Five-Year Capital
Infrastructure Planning Outlook. Departments were asked to only submit requests that meet these
stringent criteria for inclusion in the Outlook. All department submissions considered in the
development of the Outlook are provided to the Office of the Independent Budget Analyst for
evaluation in their report.
The Outlook is a planning tool to assist in budget decisions and the allocation of General Fund
resources required to meet the City’s strategic goals that are critical to core services. The purpose of
this section is the identification of future known needs, that are consistent with strategic initiatives
supported by the Mayor and the City Council and to provide estimated fiscal impacts of those
initiatives.
Total Critical Strategic Expenditures
The table above summarizes the total critical strategic expenditures including costs associated with
citywide initiatives and departmental specific critical strategic expenditures.
This Section Intentionally Left Blank
Request FTE/Rev/Exp FY 2021 FY2022 FY 2023 FY2024 FY 2025
Dept. Total FTE 161.32 247.82 292.32 326.32 372.32
Dept. Total Revenue 5,387,790 3,091,588 5,263,588 2,746,588 2,746,588
Dept. Total Expense 67,893,441 91,216,459 108,449,748 118,938,143 125,892,794
Total Critical Strategic
Expenditures
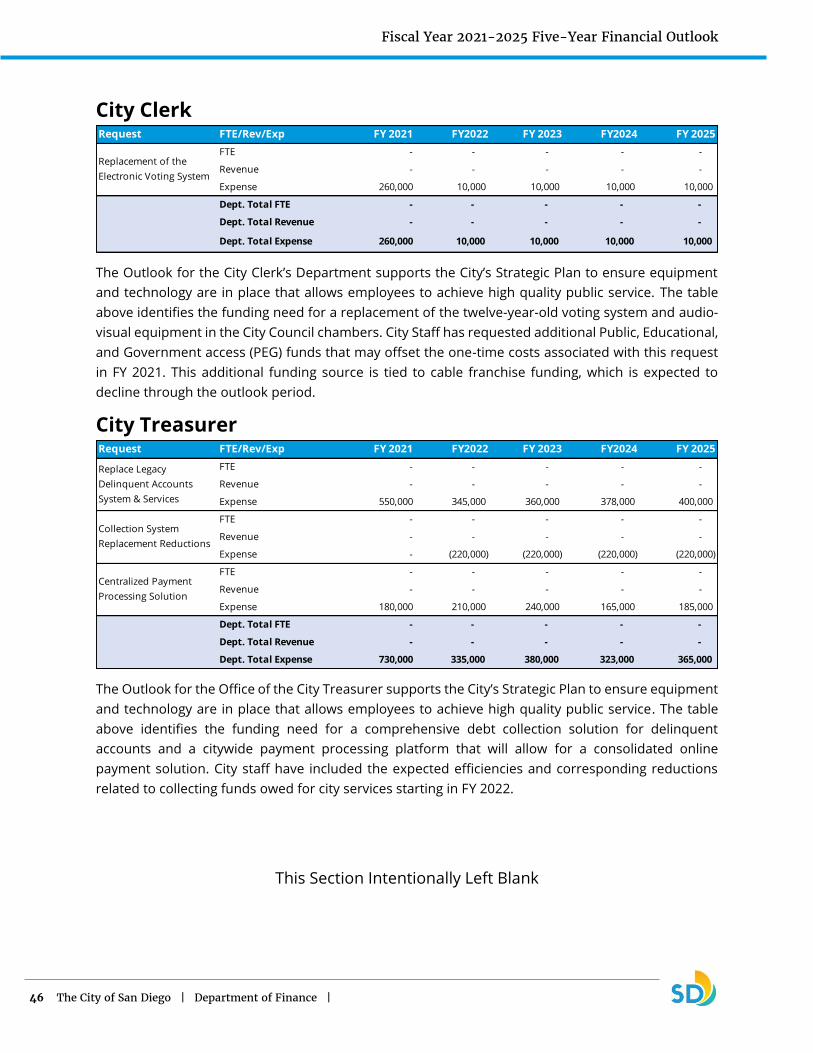
Fiscal Year 2021-2025 Five-Year Financial Outlook
46 The City of San Diego | Department of Finance |
City Clerk
The Outlook for the City Clerk’s Department supports the City’s Strategic Plan to ensure equipment
and technology are in place that allows employees to achieve high quality public service. The table
above identifies the funding need for a replacement of the twelve-year-old voting system and audio-
visual equipment in the City Council chambers. City Staff has requested additional Public, Educational,
and Government access (PEG) funds that may offset the one-time costs associated with this request
in FY 2021. This additional funding source is tied to cable franchise funding, which is expected to
decline through the outlook period.
City Treasurer
The Outlook for the Office of the City Treasurer supports the City’s Strategic Plan to ensure equipment
and technology are in place that allows employees to achieve high quality public service. The table
above identifies the funding need for a comprehensive debt collection solution for delinquent
accounts and a citywide payment processing platform that will allow for a consolidated online
payment solution. City staff have included the expected efficiencies and corresponding reductions
related to collecting funds owed for city services starting in FY 2022.
This Section Intentionally Left Blank
Request FTE/Rev/Exp FY 2021 FY2022 FY 2023 FY2024 FY 2025
FTE - - - - -
Revenue - - - - -
Expense 260,000 10,000 10,000 10,000 10,000
Dept. Total FTE - - - - -
Dept. Total Revenue - - - - -
Dept. Total Expense 260,000 10,000 10,000 10,000 10,000
Replacement of the
Electronic Voting System
Request FTE/Rev/Exp FY 2021 FY2022 FY 2023 FY2024 FY 2025
FTE - - - - -
Revenue - - - - -
Expense 550,000 345,000 360,000 378,000 400,000
FTE - - - - -
Revenue - - - - -
Expense - (220,000) (220,000) (220,000) (220,000)
FTE - - - - -
Revenue - - - - -
Expense 180,000 210,000 240,000 165,000 185,000
Dept. Total FTE - - - - -
Dept. Total Revenue - - - - -
Dept. Total Expense 730,000 335,000 380,000 323,000 365,000
Replace Legacy
Delinquent Accounts
System & Services
Collection System
Replacement Reductions
Centralized Payment
Processing Solution

Fiscal Year 2021-2025 Five-Year Financial Outlook
47 The City of San Diego | Department of Finance |
Citywide Program Expenditures
The Outlook for the citywide program expenditures identifies critical funding for General Fund
financing for capital projects.
The table above includes debt service costs for $270.0 million in new financing for ongoing General
Fund capital improvements program in FY 2022 through FY 2025. The borrowing amounts and debt
service cost projections above assumes a long-term bond issuance in FY 2022 of $88.5 million to pay
down/refund the commercial paper notes approved in FY 2018 which are expected to be issued in FY
2019. The bond issuance in FY 2025 has been increased by $4.5 million to provide for the capital
financing need.
The timing of each of these bond issuances and a cost-effective financing mechanism (commercial
paper or long-term bonds) will be further evaluated based on cash needs and market conditions.
In addition, the citywide program expenditures include the transfer to the Transient Occupancy Tax
(TOT) Fund of $3.9 million for the continued funding to support the Commission for Arts and Culture
annual allocation. The funding supports the arts, culture and community festivals programming within
the City.
Environmental Services
The Outlook for the City’s Environmental Services Department supports the City’s Strategic Plan by
fostering safe and livable neighborhoods that improve quality of life. The table above identifies the
funding need for continued support of Environmental Services portion of CleanSD enhancements.
This Section Intentionally Left Blank
Request FTE/Rev/Exp FY 2021 FY2022 FY 2023 FY2024 FY 2025
FTE - - - - -
Revenue - - - - -
Expense - 7,165,633 13,416,266 13,061,266 13,416,266
FTE - - - - -
Revenue - - - - -
Expense 3,949,600 3,949,600 3,949,600 3,949,600 3,949,600
Dept. Total FTE - - - - -
Dept. Total Revenue - - - - -
Dept. Total Expense 3,949,600 11,115,233 17,365,866 17,010,866 17,365,866
Commercial Paper
Expense & Long Term
Borrowing Costs
Restoration of Comission
for Arts & Culture
Funding
Request FTE/Rev/Exp FY 2021 FY2022 FY 2023 FY2024 FY 2025
FTE 3.00 3.00 3.00 3.00 3.00
Revenue - - - - -
Expense 2,900,611 2,900,611 2,900,611 2,900,611 2,900,611
Dept. Total FTE 3.00 3.00 3.00 3.00 3.00
Dept. Total Revenue - - - - -
Dept. Total Expense 2,900,611 2,900,611 2,900,611 2,900,611 2,900,611
Support for CleanSD
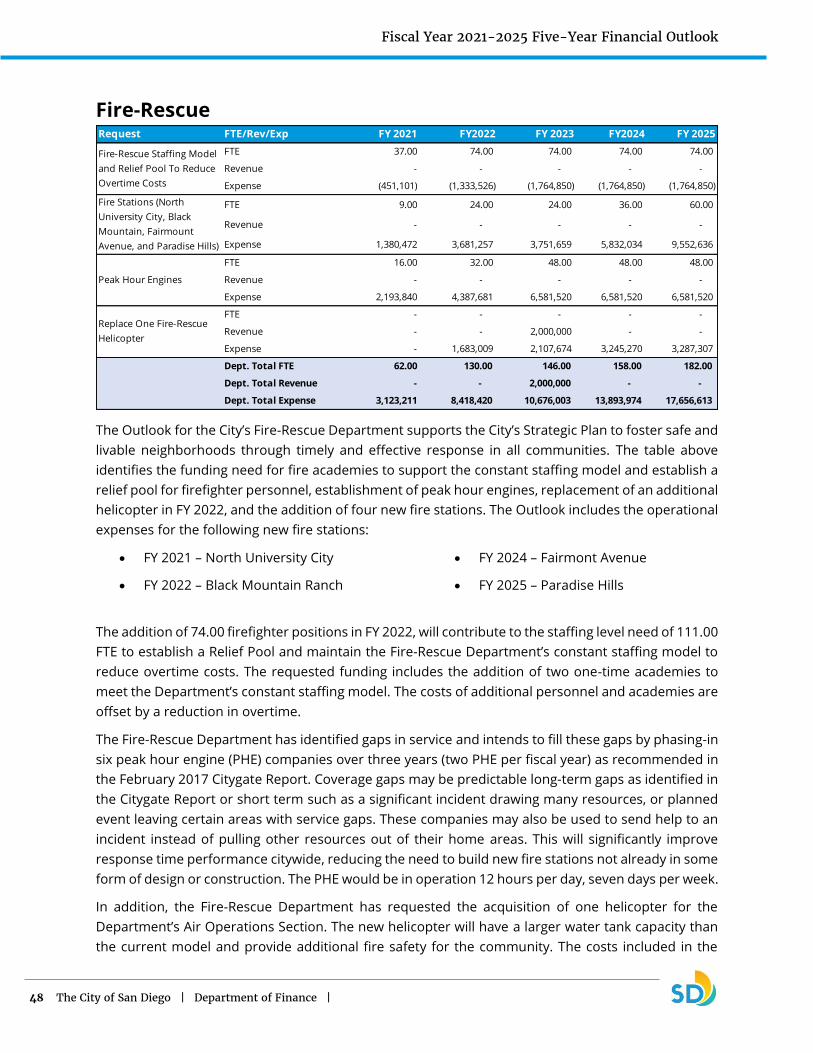
Fiscal Year 2021-2025 Five-Year Financial Outlook
48 The City of San Diego | Department of Finance |
Fire-Rescue
The Outlook for the City’s Fire-Rescue Department supports the City’s Strategic Plan to foster safe and
livable neighborhoods through timely and effective response in all communities. The table above
identifies the funding need for fire academies to support the constant staffing model and establish a
relief pool for firefighter personnel, establishment of peak hour engines, replacement of an additional
helicopter in FY 2022, and the addition of four new fire stations. The Outlook includes the operational
expenses for the following new fire stations:
• FY 2021 – North University City
• FY 2022 – Black Mountain Ranch
• FY 2024 – Fairmont Avenue
• FY 2025 – Paradise Hills
The addition of 74.00 firefighter positions in FY 2022, will contribute to the staffing level need of 111.00
FTE to establish a Relief Pool and maintain the Fire-Rescue Department’s constant staffing model to
reduce overtime costs. The requested funding includes the addition of two one-time academies to
meet the Department’s constant staffing model. The costs of additional personnel and academies are
offset by a reduction in overtime.
The Fire-Rescue Department has identified gaps in service and intends to fill these gaps by phasing-in
six peak hour engine (PHE) companies over three years (two PHE per fiscal year) as recommended in
the February 2017 Citygate Report. Coverage gaps may be predictable long-term gaps as identified in
the Citygate Report or short term such as a significant incident drawing many resources, or planned
event leaving certain areas with service gaps. These companies may also be used to send help to an
incident instead of pulling other resources out of their home areas. This will significantly improve
response time performance citywide, reducing the need to build new fire stations not already in some
form of design or construction. The PHE would be in operation 12 hours per day, seven days per week.
In addition, the Fire-Rescue Department has requested the acquisition of one helicopter for the
Department’s Air Operations Section. The new helicopter will have a larger water tank capacity than
the current model and provide additional fire safety for the community. The costs included in the
Request FTE/Rev/Exp FY 2021 FY2022 FY 2023 FY2024 FY 2025
FTE 37.00 74.00 74.00 74.00 74.00
Revenue - - - - -
Expense (451,101) (1,333,526) (1,764,850) (1,764,850) (1,764,850)
FTE 9.00 24.00 24.00 36.00 60.00
Revenue - - - - -
Expense 1,380,472 3,681,257 3,751,659 5,832,034 9,552,636
FTE 16.00 32.00 48.00 48.00 48.00
Revenue - - - - -
Expense 2,193,840 4,387,681 6,581,520 6,581,520 6,581,520
FTE - - - - -
Revenue - - 2,000,000 - -
Expense - 1,683,009 2,107,674 3,245,270 3,287,307
Dept. Total FTE 62.00 130.00 146.00 158.00 182.00
Dept. Total Revenue - - 2,000,000 - -
Dept. Total Expense 3,123,211 8,418,420 10,676,003 13,893,974 17,656,613
Fire-Rescue Staffing Model
and Relief Pool To Reduce
Overtime Costs
Fire Stations (North
University City, Black
Mountain, Fairmount
Avenue, and Paradise Hills)
Peak Hour Engines
Replace One Fire-Rescue
Helicopter
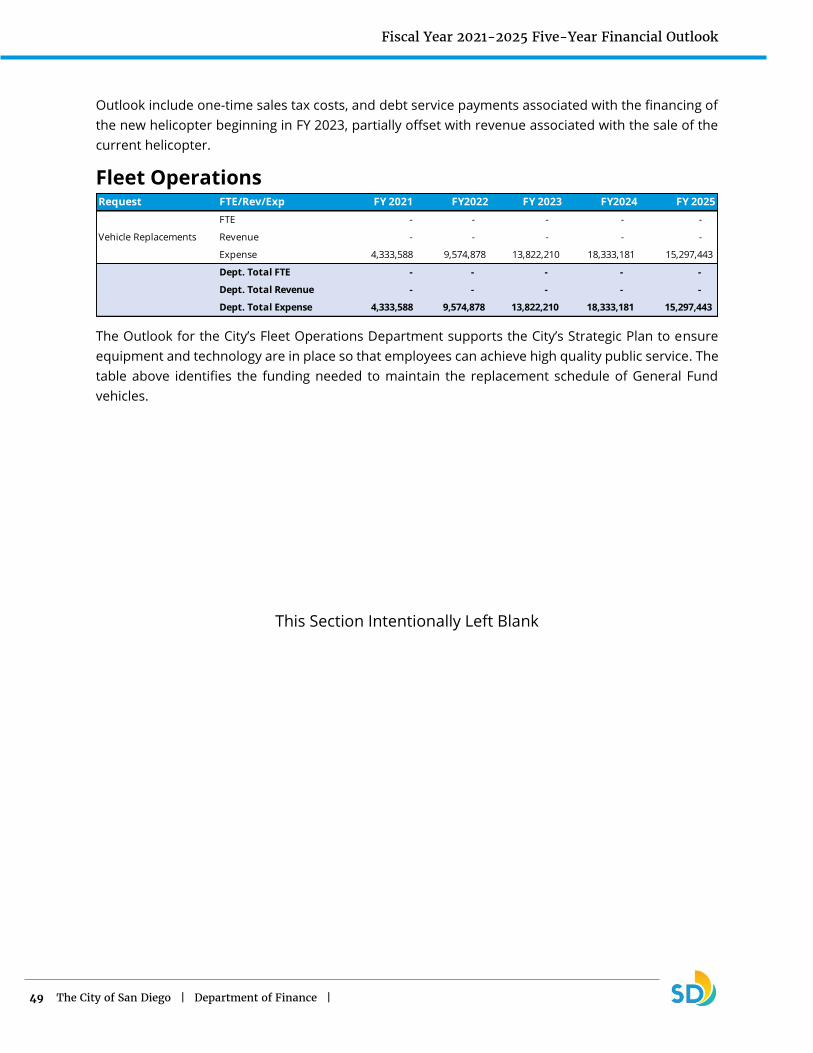
Fiscal Year 2021-2025 Five-Year Financial Outlook
49 The City of San Diego | Department of Finance |
Outlook include one-time sales tax costs, and debt service payments associated with the financing of
the new helicopter beginning in FY 2023, partially offset with revenue associated with the sale of the
current helicopter.
Fleet Operations
The Outlook for the City’s Fleet Operations Department supports the City’s Strategic Plan to ensure
equipment and technology are in place so that employees can achieve high quality public service. The
table above identifies the funding needed to maintain the replacement schedule of General Fund
vehicles.
This Section Intentionally Left Blank
Request FTE/Rev/Exp FY 2021 FY2022 FY 2023 FY2024 FY 2025
FTE - - - - -
Revenue - - - - -
Expense 4,333,588 9,574,878 13,822,210 18,333,181 15,297,443
Dept. Total FTE - - - - -
Dept. Total Revenue - - - - -
Dept. Total Expense 4,333,588 9,574,878 13,822,210 18,333,181 15,297,443
Vehicle Replacements
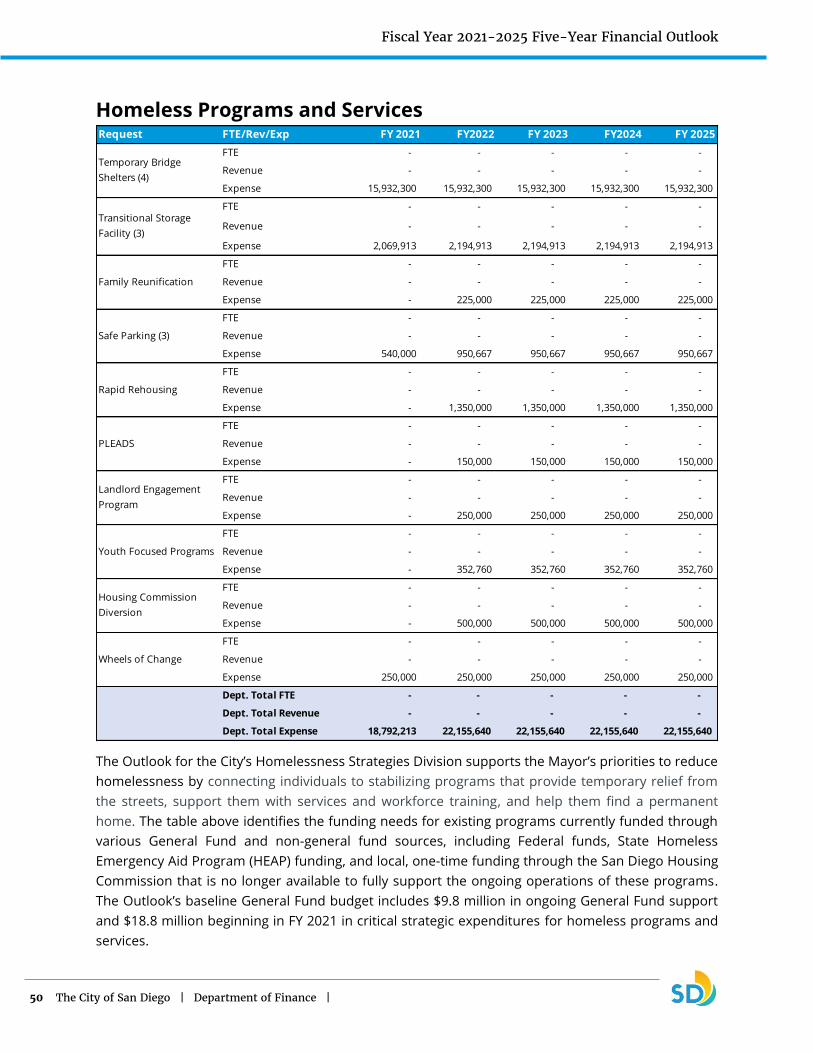
Fiscal Year 2021-2025 Five-Year Financial Outlook
50 The City of San Diego | Department of Finance |
Homeless Programs and Services
The Outlook for the City’s Homelessness Strategies Division supports the Mayor’s priorities to reduce
homelessness by connecting individuals to stabilizing programs that provide temporary relief from
the streets, support them with services and workforce training, and help them find a permanent
home. The table above identifies the funding needs for existing programs currently funded through
various General Fund and non-general fund sources, including Federal funds, State Homeless
Emergency Aid Program (HEAP) funding, and local, one-time funding through the San Diego Housing
Commission that is no longer available to fully support the ongoing operations of these programs.
The Outlook’s baseline General Fund budget includes $9.8 million in ongoing General Fund support
and $18.8 million beginning in FY 2021 in critical strategic expenditures for homeless programs and
services.
Request FTE/Rev/Exp FY 2021 FY2022 FY 2023 FY2024 FY 2025
FTE - - - - -
Revenue - - - - -
Expense 15,932,300 15,932,300 15,932,300 15,932,300 15,932,300
FTE - - - - -
Revenue - - - - -
Expense 2,069,913 2,194,913 2,194,913 2,194,913 2,194,913
FTE - - - - -
Revenue - - - - -
Expense - 225,000 225,000 225,000 225,000
FTE - - - - -
Revenue - - - - -
Expense 540,000 950,667 950,667 950,667 950,667
FTE - - - - -
Revenue - - - - -
Expense - 1,350,000 1,350,000 1,350,000 1,350,000
FTE - - - - -
Revenue - - - - -
Expense - 150,000 150,000 150,000 150,000
FTE - - - - -
Revenue - - - - -
Expense - 250,000 250,000 250,000 250,000
FTE - - - - -
Revenue - - - - -
Expense - 352,760 352,760 352,760 352,760
FTE - - - - -
Revenue - - - - -
Expense - 500,000 500,000 500,000 500,000
FTE - - - - -
Revenue - - - - -
Expense 250,000 250,000 250,000 250,000 250,000
Dept. Total FTE - - - - -
Dept. Total Revenue - - - - -
Dept. Total Expense 18,792,213 22,155,640 22,155,640 22,155,640 22,155,640
PLEADS
Temporary Bridge
Shelters (4)
Transitional Storage
Facility (3)
Family Reunification
Safe Parking (3)
Rapid Rehousing
Housing Commission
Diversion
Wheels of Change
Landlord Engagement
Program
Youth Focused Programs

Fiscal Year 2021-2025 Five-Year Financial Outlook
51 The City of San Diego | Department of Finance |
The Outlook contains funding needs for four temporary bridge shelters operated by Veterans Village,
Alpha Project and Father Joe’s Villages, three transitional storage facilities located in Council Districts
3, 8, and 9, three safe parking lots located in Districts 6 and 7, and other various programs currently
administered by the San Diego Housing Commission. Due to the State’s Homeless Emergency Aid
Program (HEAP) funding ending in FY 2021, the funding needs increase in FY 2022 through FY 2025.
Information Technology
The Outlook for the City’s Department of Information Technology (IT) supports the City’s Strategic Plan
through equipment and technology that allow employees to provide high-quality public service. The
table above identifies the funding need associated with the General Fund portion of critical public
safety equipment, which includes the public safety radio replacement project and citywide software,
hardware, and maintenance costs managed by the Department of IT.
Library
The Outlook for the City’s Library Department supports the City’s Strategic Plan to foster services that
improve the quality of life in all neighborhoods. The table identifies the funding need for security staff
at various library branches and the staffing and operating costs for the new Pacific Highlands branch
library, which is the only fully funded library scheduled to go online in the outlook period.
Request FTE/Rev/Exp FY 2021 FY2022 FY 2023 FY2024 FY 2025
FTE - - - - -
Revenue - - - - -
Expense 260,400 1,302,000 1,736,000 2,170,000 2,170,000
FTE - - - - -
Revenue - - - - -
Expense 529,200 1,400,000 980,000 1,400,000 1,400,000
FTE - - - - -
Revenue - - - - -
Expense - - - - 3,780,000
FTE - - - - -
Revenue - - - - -
Expense 2,300,000 4,600,000 4,600,000 4,600,000 4,600,000
Dept. Total FTE - - - - -
Dept. Total Revenue - - - - -
Dept. Total Expense 3,089,600 7,302,000 7,316,000 8,170,000 11,950,000
Public Safety Radio Site
Updates, Licensing, and
Support Contract
Enterprise Asset
Management Phase II
Implement of SAP Upgrade
with HANA Suite
Public Safety Radio
Replacement Project
Request FTE/Rev/Exp FY 2021 FY2022 FY 2023 FY2024 FY 2025
FTE - - - - -
Revenue - - - - -
Expense 457,000 457,000 457,000 457,000 457,000
FTE 2.00 9.50 9.50 9.50 9.50
Revenue - - - - -
Expense 206,600 427,173 854,347 854,347 854,347
Dept. Total FTE 2.00 9.50 9.50 9.50 9.50
Dept. Total Revenue - - - - -
Dept. Total Expense 663,600 884,173 1,311,347 1,311,347 1,311,347
Support for Additional
Security Guards
Pacific Highlands Ranch
Branch Library
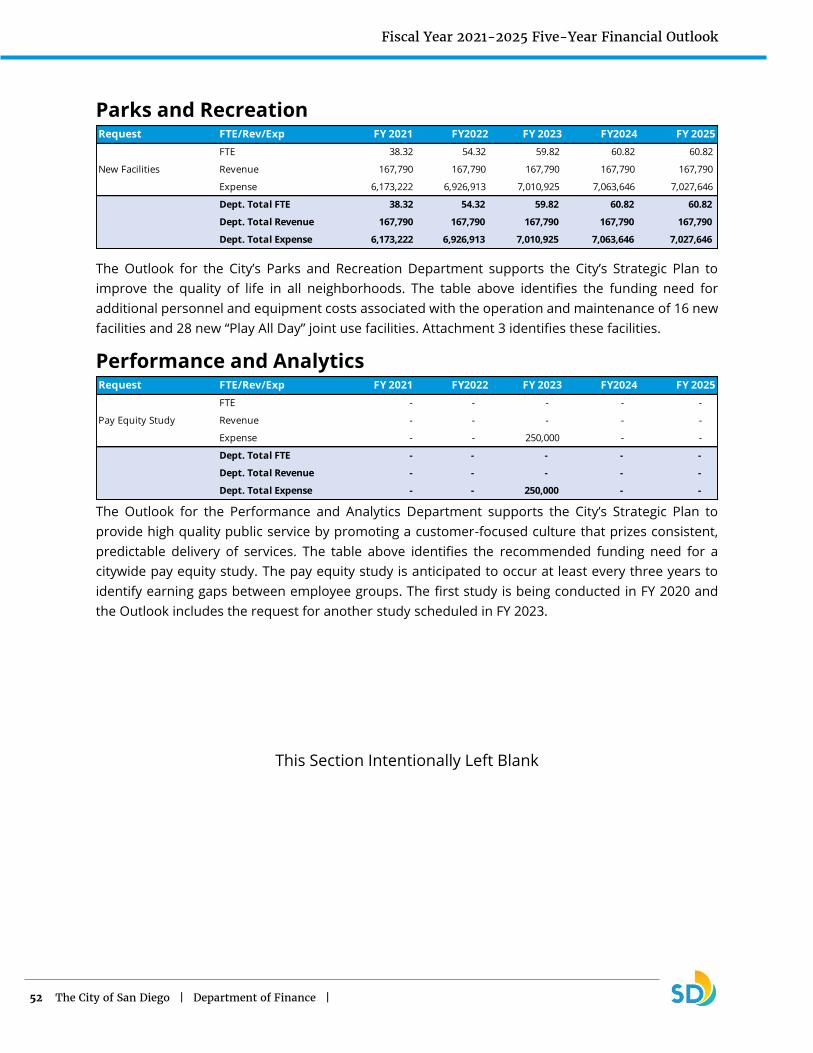
Fiscal Year 2021-2025 Five-Year Financial Outlook
52 The City of San Diego | Department of Finance |
Parks and Recreation
The Outlook for the City’s Parks and Recreation Department supports the City’s Strategic Plan to
improve the quality of life in all neighborhoods. The table above identifies the funding need for
additional personnel and equipment costs associated with the operation and maintenance of 16 new
facilities and 28 new “Play All Day” joint use facilities. Attachment 3 identifies these facilities.
Performance and Analytics
The Outlook for the Performance and Analytics Department supports the City’s Strategic Plan to
provide high quality public service by promoting a customer-focused culture that prizes consistent,
predictable delivery of services. The table above identifies the recommended funding need for a
citywide pay equity study. The pay equity study is anticipated to occur at least every three years to
identify earning gaps between employee groups. The first study is being conducted in FY 2020 and
the Outlook includes the request for another study scheduled in FY 2023.
This Section Intentionally Left Blank
Request FTE/Rev/Exp FY 2021 FY2022 FY 2023 FY2024 FY 2025
FTE 38.32 54.32 59.82 60.82 60.82
Revenue 167,790 167,790 167,790 167,790 167,790
Expense 6,173,222 6,926,913 7,010,925 7,063,646 7,027,646
Dept. Total FTE 38.32 54.32 59.82 60.82 60.82
Dept. Total Revenue 167,790 167,790 167,790 167,790 167,790
Dept. Total Expense 6,173,222 6,926,913 7,010,925 7,063,646 7,027,646
New Facilities
Request FTE/Rev/Exp FY 2021 FY2022 FY 2023 FY2024 FY 2025
FTE - - - - -
Revenue - - - - -
Expense - - 250,000 - -
Dept. Total FTE - - - - -
Dept. Total Revenue - - - - -
Dept. Total Expense - - 250,000 - -
Pay Equity Study
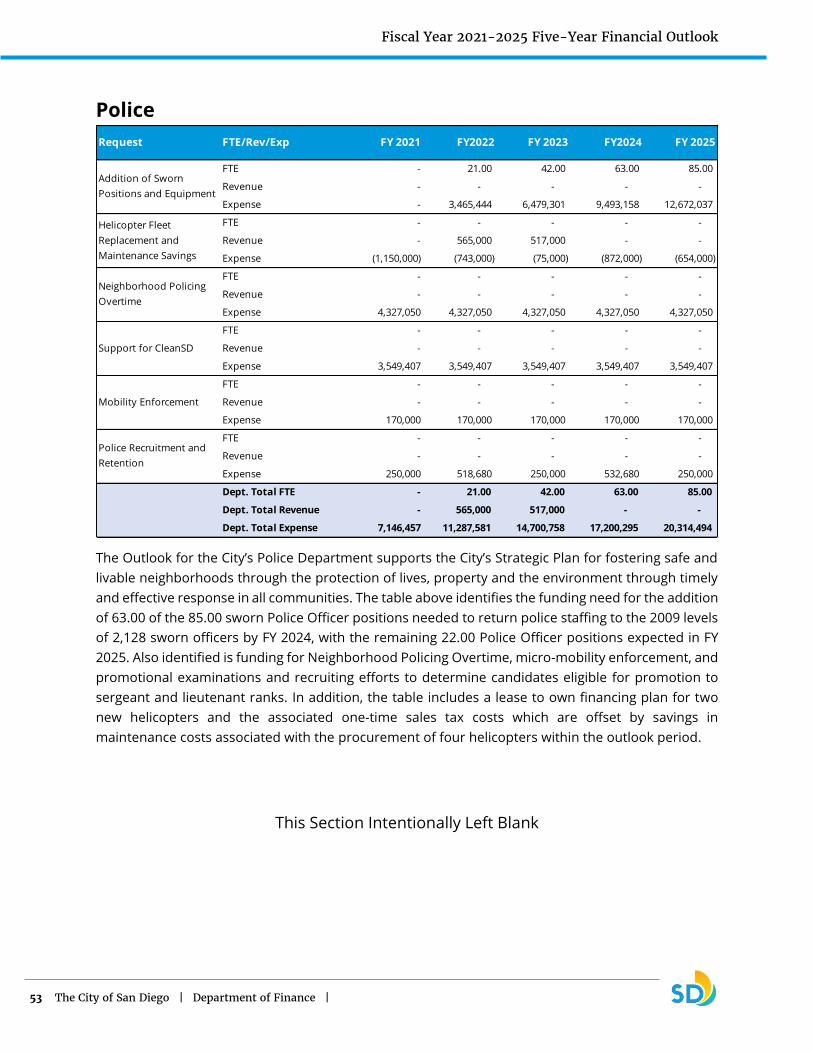
Fiscal Year 2021-2025 Five-Year Financial Outlook
53 The City of San Diego | Department of Finance |
Police
The Outlook for the City’s Police Department supports the City’s Strategic Plan for fostering safe and
livable neighborhoods through the protection of lives, property and the environment through timely
and effective response in all communities. The table above identifies the funding need for the addition
of 63.00 of the 85.00 sworn Police Officer positions needed to return police staffing to the 2009 levels
of 2,128 sworn officers by FY 2024, with the remaining 22.00 Police Officer positions expected in FY
2025. Also identified is funding for Neighborhood Policing Overtime, micro-mobility enforcement, and
promotional examinations and recruiting efforts to determine candidates eligible for promotion to
sergeant and lieutenant ranks. In addition, the table includes a lease to own financing plan for two
new helicopters and the associated one-time sales tax costs which are offset by savings in
maintenance costs associated with the procurement of four helicopters within the outlook period.
This Section Intentionally Left Blank
Request FTE/Rev/Exp FY 2021 FY2022 FY 2023 FY2024 FY 2025
FTE - 21.00 42.00 63.00 85.00
Revenue - - - - -
Expense - 3,465,444 6,479,301 9,493,158 12,672,037
FTE - - - - -
Revenue - 565,000 517,000 - -
Expense (1,150,000) (743,000) (75,000) (872,000) (654,000)
FTE - - - - -
Revenue - - - - -
Expense 4,327,050 4,327,050 4,327,050 4,327,050 4,327,050
FTE - - - - -
Revenue - - - - -
Expense 3,549,407 3,549,407 3,549,407 3,549,407 3,549,407
FTE - - - - -
Revenue - - - - -
Expense 170,000 170,000 170,000 170,000 170,000
FTE - - - - -
Revenue - - - - -
Expense 250,000 518,680 250,000 532,680 250,000
Dept. Total FTE - 21.00 42.00 63.00 85.00
Dept. Total Revenue - 565,000 517,000 - -
Dept. Total Expense 7,146,457 11,287,581 14,700,758 17,200,295 20,314,494
Addition of Sworn
Positions and Equipment
Helicopter Fleet
Replacement and
Maintenance Savings
Neighborhood Policing
Overtime
Support for CleanSD
Mobility Enforcement
Police Recruitment and
Retention
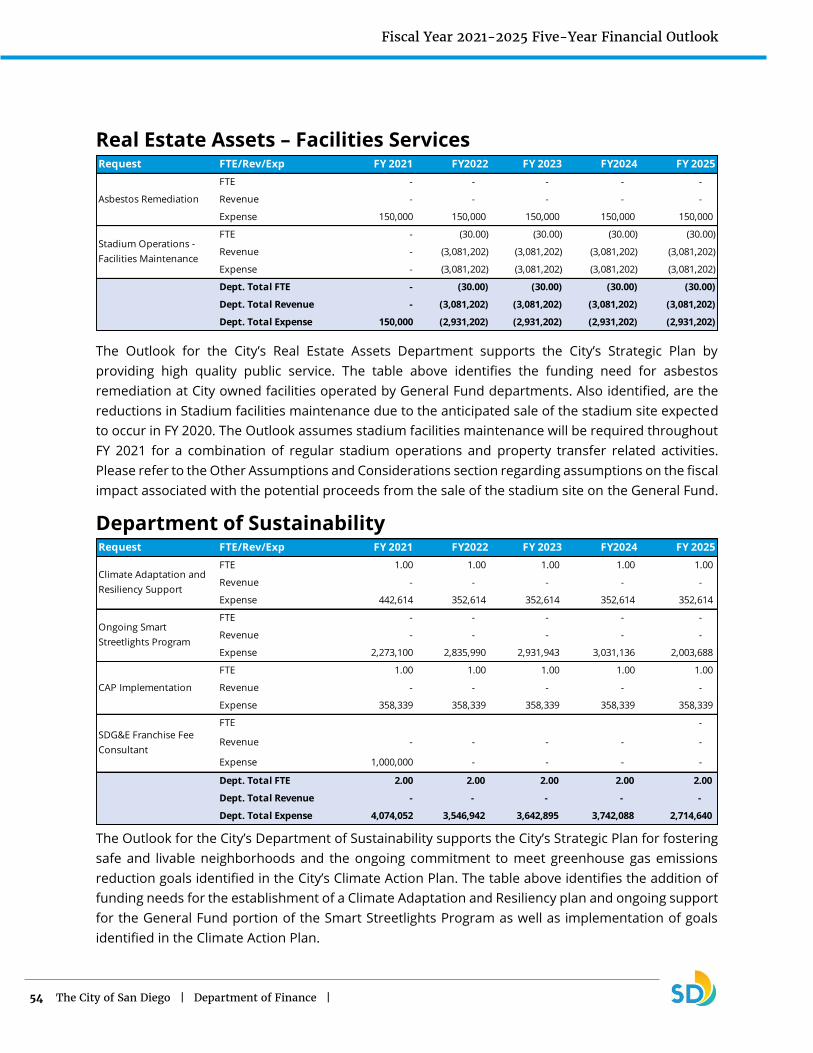
Fiscal Year 2021-2025 Five-Year Financial Outlook
54 The City of San Diego | Department of Finance |
Real Estate Assets – Facilities Services
The Outlook for the City’s Real Estate Assets Department supports the City’s Strategic Plan by
providing high quality public service. The table above identifies the funding need for asbestos
remediation at City owned facilities operated by General Fund departments. Also identified, are the
reductions in Stadium facilities maintenance due to the anticipated sale of the stadium site expected
to occur in FY 2020. The Outlook assumes stadium facilities maintenance will be required throughout
FY 2021 for a combination of regular stadium operations and property transfer related activities.
Please refer to the Other Assumptions and Considerations section regarding assumptions on the fiscal
impact associated with the potential proceeds from the sale of the stadium site on the General Fund.
Department of Sustainability
The Outlook for the City’s Department of Sustainability supports the City’s Strategic Plan for fostering
safe and livable neighborhoods and the ongoing commitment to meet greenhouse gas emissions
reduction goals identified in the City’s Climate Action Plan. The table above identifies the addition of
funding needs for the establishment of a Climate Adaptation and Resiliency plan and ongoing support
for the General Fund portion of the Smart Streetlights Program as well as implementation of goals
identified in the Climate Action Plan.
Request FTE/Rev/Exp FY 2021 FY2022 FY 2023 FY2024 FY 2025
FTE - - - - -
Revenue - - - - -
Expense 150,000 150,000 150,000 150,000 150,000
FTE - (30.00) (30.00) (30.00) (30.00)
Revenue - (3,081,202) (3,081,202) (3,081,202) (3,081,202)
Expense - (3,081,202) (3,081,202) (3,081,202) (3,081,202)
Dept. Total FTE - (30.00) (30.00) (30.00) (30.00)
Dept. Total Revenue - (3,081,202) (3,081,202) (3,081,202) (3,081,202)
Dept. Total Expense 150,000 (2,931,202) (2,931,202) (2,931,202) (2,931,202)
Asbestos Remediation
Stadium Operations -
Facilities Maintenance
Request FTE/Rev/Exp FY 2021 FY2022 FY 2023 FY2024 FY 2025
FTE 1.00 1.00 1.00 1.00 1.00
Revenue - - - - -
Expense 442,614 352,614 352,614 352,614 352,614
FTE - - - - -
Revenue - - - - -
Expense 2,273,100 2,835,990 2,931,943 3,031,136 2,003,688
FTE 1.00 1.00 1.00 1.00 1.00
Revenue - - - - -
Expense 358,339 358,339 358,339 358,339 358,339
FTE -
Revenue - - - - -
Expense 1,000,000 - - - -
Dept. Total FTE 2.00 2.00 2.00 2.00 2.00
Dept. Total Revenue - - - - -
Dept. Total Expense 4,074,052 3,546,942 3,642,895 3,742,088 2,714,640
CAP Implementation
Climate Adaptation and
Resiliency Support
Ongoing Smart
Streetlights Program
SDG&E Franchise Fee
Consultant

Fiscal Year 2021-2025 Five-Year Financial Outlook
55 The City of San Diego | Department of Finance |
Also identified in the table is funding related to support the renewal of the San Diego Gas and Electric
(SDG&E) franchise fee agreement. SDG&E currently operates under a 50-year City franchise that was
granted in 1970. The agreement is set to expire in 2020 and the city anticipates the need to retain
outside consultants to prepare for and advise the City during these negotiations and evaluate the
City’s energy distributor.
Transportation and Storm Water
The Outlook for the City’s Transportation and Storm Water Department supports the City’s Strategic
Plan in achieving safe and livable neighborhoods and investing in quality infrastructure by performing
the services summarized in the table above. The identified funding need allows for faster mitigation
of damaged sidewalks via additional asphalt ramping, concrete replacement crews and slicing
contract support. Additionally, support for an in-house storm drain pipe repair team, as identified in
the June 2018 Audit, is included. The table also identifies the addition of engineering and support staff
to maintain the City’s street pavement Overall Condition Index (OCI) rating. Lastly, the table includes
the expected General Fund portion of revenue related to the additional positions.
Furthermore, the Outlook includes funding for additional posted street sweeping routes to comply
with the Storm Water Permit issued by the Regional Water Quality Control Board. The CIP needs for
storm water flood risk management and water quality improvement projects have been identified
and will be discussed in the Five-Year Capital Infrastructure Planning Outlook scheduled to be released
in January 2020.
This Section Intentionally Left Blank
Request FTE/Rev/Exp FY 2021 FY2022 FY 2023 FY2024 FY 2025
FTE 21.00 23.00 23.00 23.00 23.00
Revenue 730,000 730,000 730,000 730,000 730,000
Expense 4,368,900 2,898,359 2,898,359 2,898,359 2,898,359
FTE 24.00 24.00 24.00 24.00 24.00
Revenue 3,750,000 3,750,000 3,750,000 3,750,000 3,750,000
Expense 7,035,084 5,735,084 5,735,084 5,735,084 5,735,084
FTE 7.00 7.00 7.00 7.00 7.00
Revenue 540,000 540,000 540,000 540,000 540,000
Expense 870,877 675,975 675,975 675,975 675,975
FTE 2.00 4.00 6.00 6.00 6.00
Revenue 200,000 420,000 640,000 640,000 640,000
Expense 232,426 380,852 529,278 445,278 445,278
Dept. Total FTE 54.00 58.00 60.00 60.00 60.00
Dept. Total Revenue 5,220,000 5,440,000 5,660,000 5,660,000 5,660,000
Dept. Total Expense 12,507,287 9,690,270 9,838,696 9,754,696 9,754,696
Sidewalk Repair and
Replacement Team
Support
Pipe Repair Team
Support
Support for Achieving
Street Resurfacing Goals
Street Sweeping Team
Support

Fiscal Year 2021-2025 Five-Year Financial Outlook
56 The City of San Diego | Department of Finance |
This Page Intentionally Left Blank

Fiscal Year 2021-2025 Five-Year Financial Outlook
57 The City of San Diego | Department of Finance |
POTENTIAL MITIGATION ACTIONS The Outlook has identified the potential need to identify additional sources of funds as a result of the
growth in ongoing expenditures outpacing the growth in ongoing revenues. The Mayor will present a
balanced FY 2021 budget in April 2020 to the City Council. If the projected revenues and sources of
funds do not improve, several mitigation actions, including budget reductions, will need to be
considered. The following section presents potential measures to address the potential need for
additional resources in FY 2021.
One-Time Resources Any available resources that are one-time in nature are only available for one-time purposes.
• The Homeless Housing, Assistance and Prevention (HHAP) Program was approved by
Governor Gavin Newsom on July 31, 2019. The HHAP Program grant is a one-time grant
that provides the City with funds to support, expand and/or develop initiatives for
homelessness. The total funding the City will receive is estimated at $20.0 million in FY
2020; however, final allocations are still pending finalization by the Department of Housing
and Urban Development. All or a portion of these funds may be used to offset current
and/or future homeless programs, which are listed in the Critical Strategic Initiatives
section of this report. The guidelines and direction on how to allocate the funding within
the City is still pending.
• In the FY 2020 First Quarter Budget Monitoring Report, the FY 2020 ending fund balance
(excess equity) is projected to be $22.1 million. This will be updated during the FY 2020
Mid-Year Budget Monitoring Report once the audit of the FY 2019 financial statements is
complete and will include updated FY 2020 projections. These funds could be used in
either FY 2020 or in future fiscal years to fund one-time expenditures.
Budget Reductions To address the projected revenue shortfall, General Fund departments will be requested to submit
budget reduction proposals. Any budget reduction proposals submitted for consideration are only
proposals subject to careful evaluation. All potential solutions to mitigate the projected revenue
shortfall will be carefully considered to ensure the overall impact to the services provided is minimized
and that the City continues to provide the high level of service that is expected.
This Section Intentionally Left Blank
Fiscal Year 2021-2025 Five-Year Financial Outlook
58 The City of San Diego | Department of Finance |
This Page Intentionally Left Blank

Fiscal Year 2021-2025 Five-Year Financial Outlook
59 The City of San Diego | Department of Finance |
OTHER ASSUMPTIONS AND CONSIDERATIONS The Outlook was developed based on information available and known at the time of the preparation
of the report. Projections were developed using reasonable assumptions; however, risks to the
projections include events that may be expected to occur during the outlook period whose outcomes
are unpredictable. Previous sections of the report have discussed any assumptions that may result in
a specific risk to the revenue and expenditure category projection. This section details other known
assumptions.
Ballot Measures Measure G, regarding the sale of the stadium site to San Diego State University (SDSU), was approved
by the voters in November 2018. The fiscal impact associated with the potential proceeds of the sale
of the stadium site on the General Fund has not been reflected in the Outlook due to the pending
negotiations and use of the proceeds at the time of the preparation of this report.
The Outlook does not assume the approval of any other proposed ballot measures and the associated
potential fiscal impacts to the General Fund.
MOUs and ADC As previously discussed in the Salaries and Wages category section of this report, the current MOUs
with the six REOs are set to expire at the end of FY 2020. Since over 69.9 percent of expenditures in
the FY 2020 Adopted Budget are related to wages and fringe benefits, small changes in MOU
provisions can have large impacts on City expenditures. For example, a 1.0 percent change in salaries
across all MOU’s could increase this category by approximately $5.92 million. The City is currently in
negotiations will all REOs regarding the current MOUs and changes to MOUs provision; therefore, the
associated fiscal impact is not known at this time, and as a result are not included in the Outlook
projections.
In addition, there are many factors that can alter the Actuarially Determined Contribution (ADC)
payment made by the City to the San Diego City Employees’ Retirement System (SDCERS). Fluctuations
in the market can impact employer contributions; as well as unanticipated increases in salaries can
also alter the total ADC payment each fiscal year. The Outlook Report does not contain any projections
related to potential changes to actuarial assumptions that could result in significant impacts to the
ADC payment.
Recession The impact of a future economic recession has not been incorporated into this Outlook. In each fiscal
year of the Outlook, growth is projected from its prior year. Based on historical examples of a
recession, the City’s Major Revenues, (Property Tax, Sales Tax, TOT, and Franchise Fees) could be
significantly impacted. Prior recessions have impacted the City’s aggregated Major Revenues by -1.0
percent to -4.9 percent. For example, a 1.0 percent decrease across all major revenues could reduce
revenues by approximately $10.8 million. A recession affects each revenue source differently.
Changes to Property Taxes are likely to lag since current revenue is based on prior calendar year
valuations. Property Taxes are also less variable due to the amount of base assessed valuations that
Fiscal Year 2021-2025 Five-Year Financial Outlook
60 The City of San Diego | Department of Finance |
are below market value. However, small percentage changes to property tax growth can equate to
large swings in taxes. Sales tax and TOT are based on consumer’s discretionary funds; which are more
quickly and erratically impacted by a recession. The Department of Finance will continue to monitor
major revenue projections and economic indicators throughout the fiscal year and report any
fluctuations in revenue.
This Section Intentionally Left Blank

Fiscal Year 2021-2025 Five-Year Financial Outlook
61 The City of San Diego | Department of Finance |
CONCLUSION The Outlook guides long-range fiscal planning by focusing on baseline revenues and expenditures,
including quantifying new costs that are critical to accomplishing the City’s strategic goals and reflect
the Mayor and City Council’s shared priorities over the next five-year period.
Based upon baseline projections, growth in ongoing expenditures is anticipated to outpace growth in
ongoing revenues in FY 2021. Beginning in FY 2022, revenue growth is projected to exceed anticipated
expenditure growth. A structural shortfall is forecasted based on the following key factors:
• Moderate growth in revenue
• Projected growth in expenditures
• Reserve Contributions
• Critical Strategic Expenditures
The Outlook provides the City Council, key stakeholders, and the public with information at the start
of the budget process to facilitate a discussion regarding the coming year’s General Fund budget
allocations.
Per the City Charter, the Mayor will present a balanced budget for the City Council’s consideration in
April 2020.
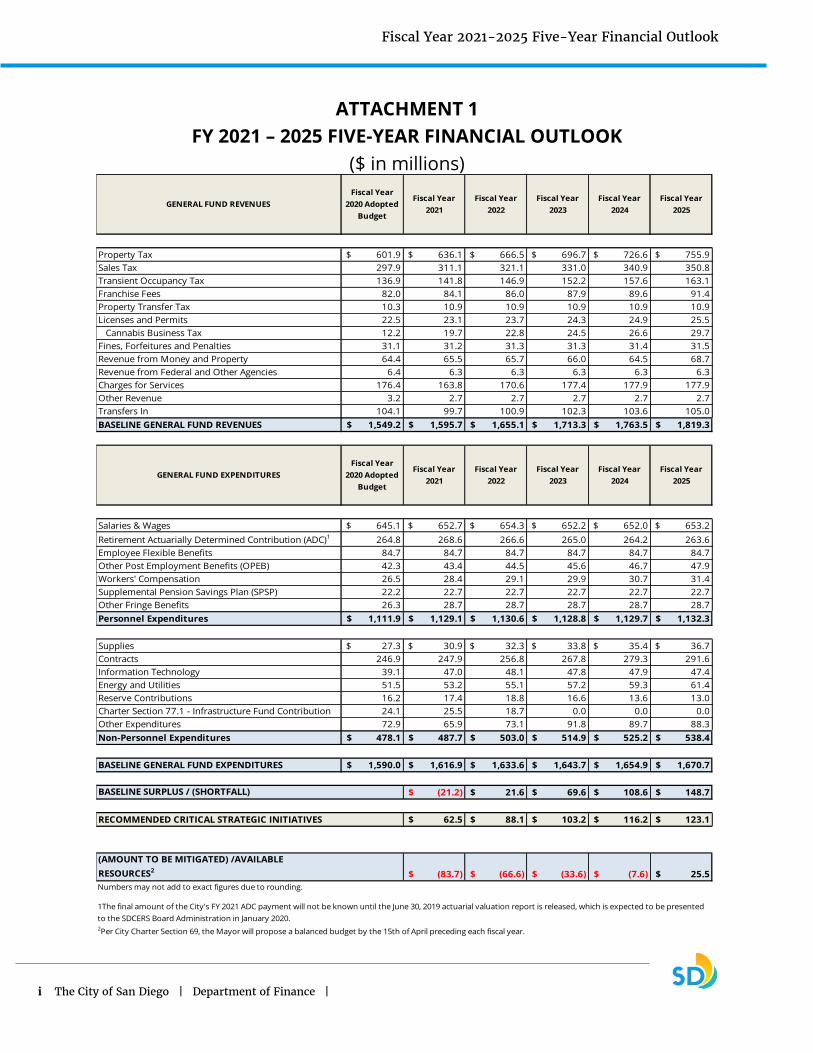
Fiscal Year 2021-2025 Five-Year Financial Outlook
i The City of San Diego | Department of Finance |
ATTACHMENT 1
FY 2021 – 2025 FIVE-YEAR FINANCIAL OUTLOOK
($ in millions)
GENERAL FUND REVENUES
Fiscal Year
2020 Adopted
Budget
Fiscal Year
2021
Fiscal Year
2022
Fiscal Year
2023
Fiscal Year
2024
Fiscal Year
2025
Property Tax 601.9$ 636.1$ 666.5$ 696.7$ 726.6$ 755.9$
Sales Tax 297.9 311.1 321.1 331.0 340.9 350.8
Transient Occupancy Tax 136.9 141.8 146.9 152.2 157.6 163.1
Franchise Fees 82.0 84.1 86.0 87.9 89.6 91.4
Property Transfer Tax 10.3 10.9 10.9 10.9 10.9 10.9
Licenses and Permits 22.5 23.1 23.7 24.3 24.9 25.5
Cannabis Business Tax 12.2 19.7 22.8 24.5 26.6 29.7
Fines, Forfeitures and Penalties 31.1 31.2 31.3 31.3 31.4 31.5
Revenue from Money and Property 64.4 65.5 65.7 66.0 64.5 68.7
Revenue from Federal and Other Agencies 6.4 6.3 6.3 6.3 6.3 6.3
Charges for Services 176.4 163.8 170.6 177.4 177.9 177.9
Other Revenue 3.2 2.7 2.7 2.7 2.7 2.7
Transfers In 104.1 99.7 100.9 102.3 103.6 105.0
BASELINE GENERAL FUND REVENUES 1,549.2$ 1,595.7$ 1,655.1$ 1,713.3$ 1,763.5$ 1,819.3$
GENERAL FUND EXPENDITURES
Fiscal Year
2020 Adopted
Budget
Fiscal Year
2021
Fiscal Year
2022
Fiscal Year
2023
Fiscal Year
2024
Fiscal Year
2025
Salaries & Wages 645.1$ 652.7$ 654.3$ 652.2$ 652.0$ 653.2$
Retirement Actuarially Determined Contribution (ADC)1 264.8 268.6 266.6 265.0 264.2 263.6
Employee Flexible Benefits 84.7 84.7 84.7 84.7 84.7 84.7
Other Post Employment Benefits (OPEB) 42.3 43.4 44.5 45.6 46.7 47.9
Workers' Compensation 26.5 28.4 29.1 29.9 30.7 31.4
Supplemental Pension Savings Plan (SPSP) 22.2 22.7 22.7 22.7 22.7 22.7
Other Fringe Benefits 26.3 28.7 28.7 28.7 28.7 28.7
Personnel Expenditures 1,111.9$ 1,129.1$ 1,130.6$ 1,128.8$ 1,129.7$ 1,132.3$
Supplies 27.3$ 30.9$ 32.3$ 33.8$ 35.4$ 36.7$
Contracts 246.9 247.9 256.8 267.8 279.3 291.6
Information Technology 39.1 47.0 48.1 47.8 47.9 47.4
Energy and Utilities 51.5 53.2 55.1 57.2 59.3 61.4
Reserve Contributions 16.2 17.4 18.8 16.6 13.6 13.0
Charter Section 77.1 - Infrastructure Fund Contribution 24.1 25.5 18.7 0.0 0.0 0.0
Other Expenditures 72.9 65.9 73.1 91.8 89.7 88.3
Non-Personnel Expenditures 478.1$ 487.7$ 503.0$ 514.9$ 525.2$ 538.4$
BASELINE GENERAL FUND EXPENDITURES 1,590.0$ 1,616.9$ 1,633.6$ 1,643.7$ 1,654.9$ 1,670.7$
BASELINE SURPLUS / (SHORTFALL) (21.2)$ 21.6$ 69.6$ 108.6$ 148.7$
RECOMMENDED CRITICAL STRATEGIC INITIATIVES 62.5$ 88.1$ 103.2$ 116.2$ 123.1$
(AMOUNT TO BE MITIGATED) /AVAILABLE
RESOURCES2(83.7)$ (66.6)$ (33.6)$ (7.6)$ 25.5$
2Per City Charter Section 69, the Mayor will propose a balanced budget by the 15th of April preceding each fiscal year.
Numbers may not add to exact figures due to rounding.
1The final amount of the City's FY 2021 ADC payment will not be known until the June 30, 2019 actuarial valuation report is released, which is expected to be presented
to the SDCERS Board Administration in January 2020.

Fiscal Year 2021-2025 Five-Year Financial Outlook
ii The City of San Diego | Department of Finance |
This Page Intentionally Left Blank
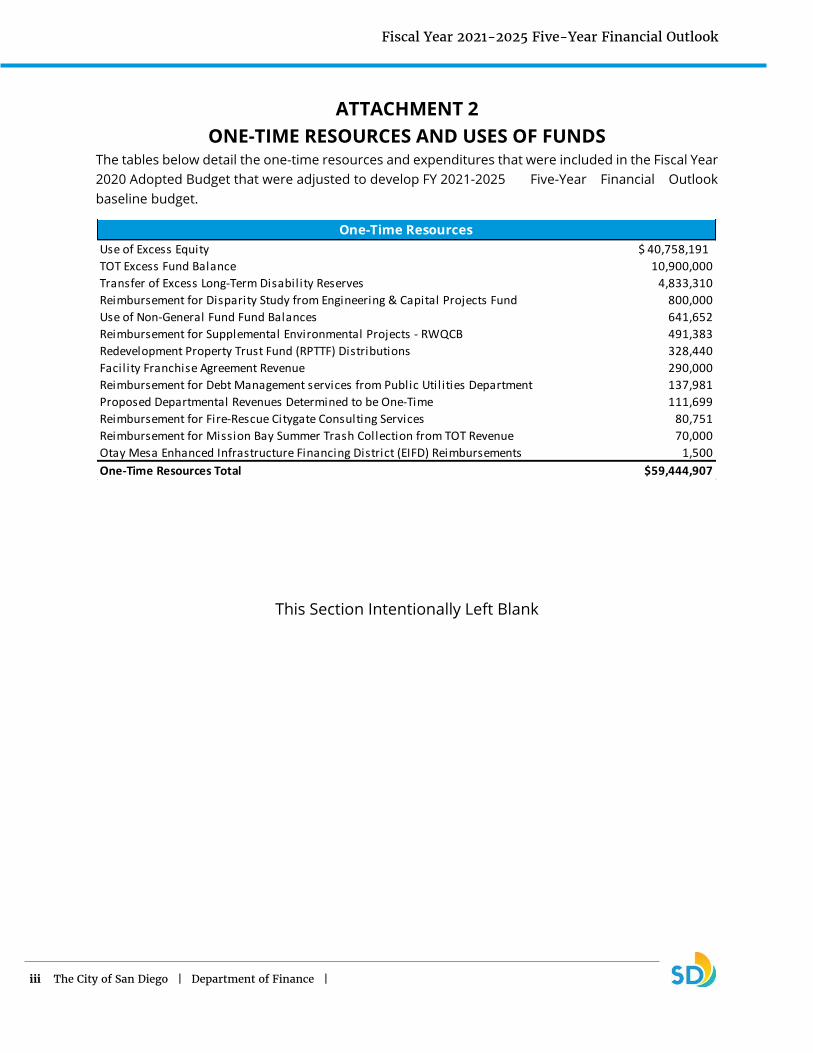
Fiscal Year 2021-2025 Five-Year Financial Outlook
iii The City of San Diego | Department of Finance |
ATTACHMENT 2
ONE-TIME RESOURCES AND USES OF FUNDS The tables below detail the one-time resources and expenditures that were included in the Fiscal Year
2020 Adopted Budget that were adjusted to develop FY 2021-2025 Five-Year Financial Outlook
baseline budget.
This Section Intentionally Left Blank
Use of Excess Equity 40,758,191$
TOT Excess Fund Balance 10,900,000
Transfer of Excess Long-Term Disability Reserves 4,833,310
Reimbursement for Disparity Study from Engineering & Capital Projects Fund 800,000
Use of Non-General Fund Fund Balances 641,652
Reimbursement for Supplemental Environmental Projects - RWQCB 491,383
Redevelopment Property Trust Fund (RPTTF) Distributions 328,440
Facility Franchise Agreement Revenue 290,000
Reimbursement for Debt Management services from Public Utilities Department 137,981
Proposed Departmental Revenues Determined to be One-Time 111,699
Reimbursement for Fire-Rescue Citygate Consulting Services 80,751
Reimbursement for Mission Bay Summer Trash Collection from TOT Revenue 70,000
Otay Mesa Enhanced Infrastructure Financing District (EIFD) Reimbursements 1,500
One-Time Resources Total $59,444,907
One-Time Resources
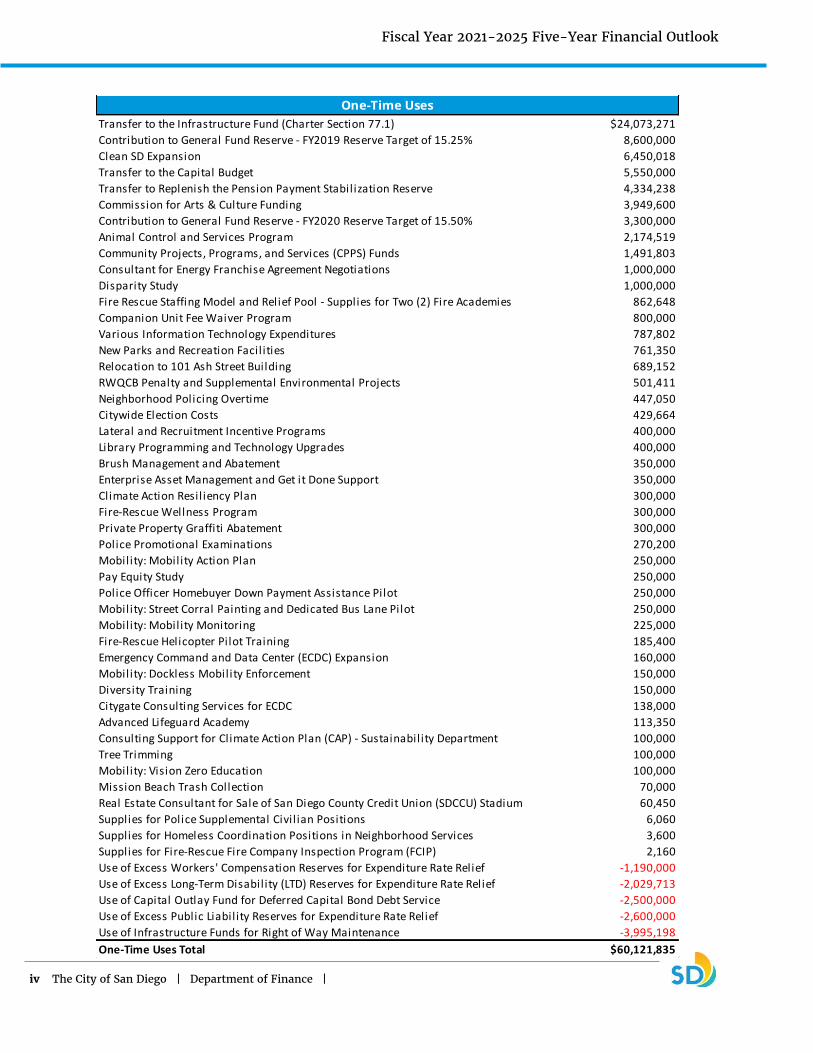
Fiscal Year 2021-2025 Five-Year Financial Outlook
iv The City of San Diego | Department of Finance |
Transfer to the Infrastructure Fund (Charter Section 77.1) $24,073,271
Contribution to General Fund Reserve - FY2019 Reserve Target of 15.25% 8,600,000
Clean SD Expansion 6,450,018
Transfer to the Capital Budget 5,550,000
Transfer to Replenish the Pension Payment Stabilization Reserve 4,334,238
Commission for Arts & Culture Funding 3,949,600
Contribution to General Fund Reserve - FY2020 Reserve Target of 15.50% 3,300,000
Animal Control and Services Program 2,174,519
Community Projects, Programs, and Services (CPPS) Funds 1,491,803
Consultant for Energy Franchise Agreement Negotiations 1,000,000
Disparity Study 1,000,000
Fire Rescue Staffing Model and Relief Pool - Supplies for Two (2) Fire Academies 862,648
Companion Unit Fee Waiver Program 800,000
Various Information Technology Expenditures 787,802
New Parks and Recreation Facil ities 761,350
Relocation to 101 Ash Street Building 689,152
RWQCB Penalty and Supplemental Environmental Projects 501,411
Neighborhood Policing Overtime 447,050
Citywide Election Costs 429,664
Lateral and Recruitment Incentive Programs 400,000
Library Programming and Technology Upgrades 400,000
Brush Management and Abatement 350,000
Enterprise Asset Management and Get it Done Support 350,000
Climate Action Resil iency Plan 300,000
Fire-Rescue Wellness Program 300,000
Private Property Graffiti Abatement 300,000
Police Promotional Examinations 270,200
Mobility: Mobility Action Plan 250,000
Pay Equity Study 250,000
Police Officer Homebuyer Down Payment Assistance Pilot 250,000
Mobility: Street Corral Painting and Dedicated Bus Lane Pilot 250,000
Mobility: Mobility Monitoring 225,000
Fire-Rescue Helicopter Pilot Training 185,400
Emergency Command and Data Center (ECDC) Expansion 160,000
Mobility: Dockless Mobility Enforcement 150,000
Diversity Training 150,000
Citygate Consulting Services for ECDC 138,000
Advanced Lifeguard Academy 113,350
Consulting Support for Climate Action Plan (CAP) - Sustainability Department 100,000
Tree Trimming 100,000
Mobility: Vision Zero Education 100,000
Mission Beach Trash Collection 70,000
Real Estate Consultant for Sale of San Diego County Credit Union (SDCCU) Stadium 60,450
Supplies for Police Supplemental Civil ian Positions 6,060
Supplies for Homeless Coordination Positions in Neighborhood Services 3,600
Supplies for Fire-Rescue Fire Company Inspection Program (FCIP) 2,160
Use of Excess Workers' Compensation Reserves for Expenditure Rate Relief -1,190,000
Use of Excess Long-Term Disability (LTD) Reserves for Expenditure Rate Relief -2,029,713
Use of Capital Outlay Fund for Deferred Capital Bond Debt Service -2,500,000
Use of Excess Public Liability Reserves for Expenditure Rate Relief -2,600,000
Use of Infrastructure Funds for Right of Way Maintenance -3,995,198
One-Time Uses Total $60,121,835
One-Time Uses
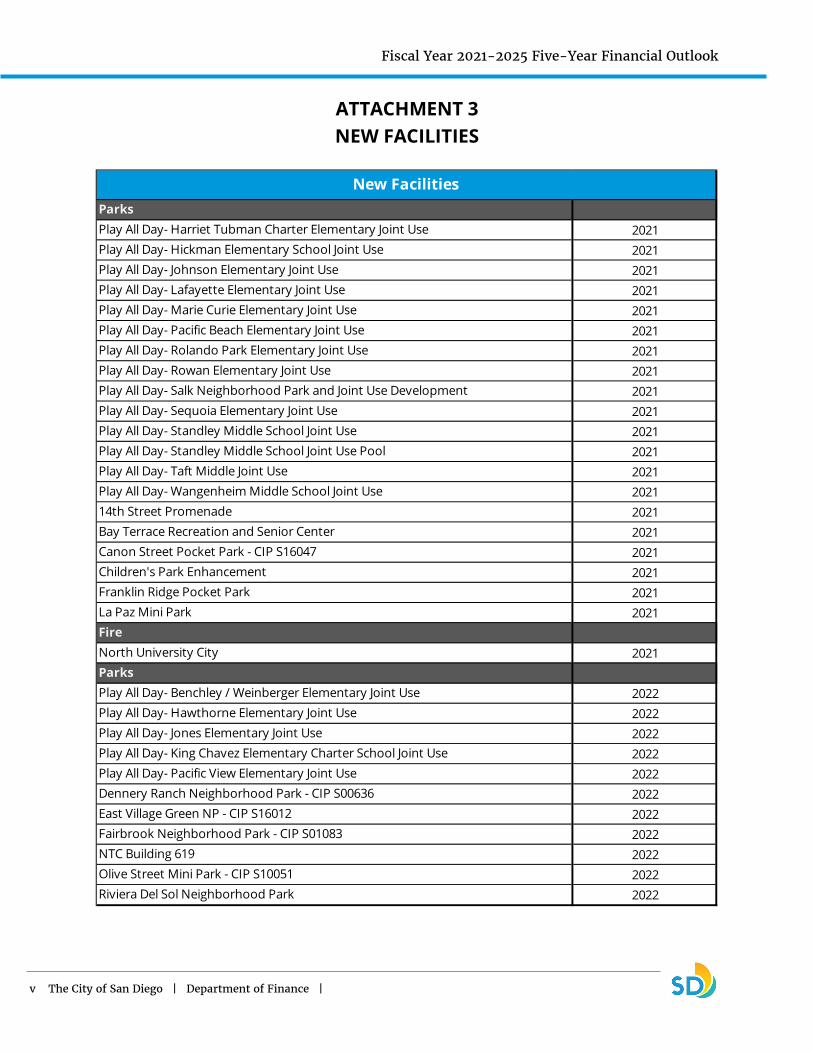
Fiscal Year 2021-2025 Five-Year Financial Outlook
v The City of San Diego | Department of Finance |
ATTACHMENT 3 NEW FACILITIES
ParksPlay All Day- Harriet Tubman Charter Elementary Joint Use 2021Play All Day- Hickman Elementary School Joint Use 2021Play All Day- Johnson Elementary Joint Use 2021Play All Day- Lafayette Elementary Joint Use 2021Play All Day- Marie Curie Elementary Joint Use 2021Play All Day- Pacific Beach Elementary Joint Use 2021Play All Day- Rolando Park Elementary Joint Use 2021Play All Day- Rowan Elementary Joint Use 2021Play All Day- Salk Neighborhood Park and Joint Use Development 2021Play All Day- Sequoia Elementary Joint Use 2021Play All Day- Standley Middle School Joint Use 2021Play All Day- Standley Middle School Joint Use Pool 2021Play All Day- Taft Middle Joint Use 2021Play All Day- Wangenheim Middle School Joint Use 202114th Street Promenade 2021Bay Terrace Recreation and Senior Center 2021Canon Street Pocket Park - CIP S16047 2021Children's Park Enhancement 2021Franklin Ridge Pocket Park 2021La Paz Mini Park 2021FireNorth University City 2021ParksPlay All Day- Benchley / Weinberger Elementary Joint Use 2022Play All Day- Hawthorne Elementary Joint Use 2022Play All Day- Jones Elementary Joint Use 2022Play All Day- King Chavez Elementary Charter School Joint Use 2022Play All Day- Pacific View Elementary Joint Use 2022Dennery Ranch Neighborhood Park - CIP S00636 2022East Village Green NP - CIP S16012 2022Fairbrook Neighborhood Park - CIP S01083 2022NTC Building 619 2022Olive Street Mini Park - CIP S10051 2022Riviera Del Sol Neighborhood Park 2022
New Facilities

Fiscal Year 2021-2025 Five-Year Financial Outlook
vi The City of San Diego | Department of Finance |
FireBlack Mountain Ranch 2022LibraryPacific Highlands Ranch 2023ParksPlay All Day- Dewey Elementary Joint Use 2023Play All Day- Florence Elementary School Joint Use 2023Play All Day- Toler Elementary Joint Use 2023Play All Day- Webster Elementary Joint Use 2023Mira Mesa Community Park (Phase III) - CIP L16002 2023Hidden Trails Neighborhood Park - CIP S00995 2023ParksPlay All Day- Lindbergh-Scheweitzer Elementary Joint Use 2024Play All Day- Spreckels Elementary Joint Use 2024FireFairmount Avenue 2024FireParadise Hills 2025
New Facilities


