Download - FIRST-HALF 2018 EARNINGS - Seeking Alpha

This document and the information therein are the property of Safran. They must not be copied or communicated to a third party without the prior written authorization of Safran
FIRST-HALF 2018 EARNINGS

This document and the information therein are the property of Safran. They must not be copied or communicated to a third party without the prior written authorization of Safran
> FORWARD-LOOKING STATEMENTS
This document contains forward-looking statements relating to Safran, Zodiac Aerospace and their combined businesses, which do not refer to historical facts but refer to expectations based on
management’s current views and assumptions and involve known and unknown risks and uncertainties that could cause actual results, performance, or events to differ materially from those
included in such statements. These statements or disclosures may discuss goals, intentions and expectations as to future trends, synergies, value accretions, plans, events, results of operations or
financial condition, or state other information relating to Safran, Zodiac Aerospace and their combined businesses, based on current beliefs of management as well as assumptions made by, and
information currently available to, management. Forward-looking statements generally will be accompanied by words such as “anticipate,” “believe,” “plan,” “could,” “would,” “estimate,” “expect,”
“forecast,” “guidance,” “intend,” “may,” “possible,” “potential,” “predict,” “project” or other similar words, phrases or expressions. Many of these risks and uncertainties relate to factors that are
beyond Safran’s or Zodiac Aerospace’s control. Therefore, investors and shareholders should not place undue reliance on such statements. Factors that could cause actual results to differ materially
from those in the forward-looking statements include, but are not limited to: uncertainties related in particular to the economic, financial, competitive, tax or regulatory environment; the risks that the
new businesses will not be integrated successfully or that the combined company will not realize estimated cost savings and synergies; Safran’s or Zodiac Aerospace’s ability to successfully
implement and complete its plans and strategies and to meet its targets; the benefits from Safran’s or Zodiac Aerospace’s (and their combined businesses) plans and strategies being less than
anticipated; and the risks described in the registration document (document de référence). The foregoing list of factors is not exhaustive. Forward-looking statements speak only as of the date they
are made. Safran and Zodiac Aerospace do not assume any obligation to update any public information or forward-looking statement in this document to reflect events or circumstances after the
date of this document, except as may be required by applicable laws.
> USE OF NON-GAAP FINANCIAL INFORMATION
This document contains supplemental non-GAAP financial information. Readers are cautioned that these measures are unaudited and not directly reflected in the Group’s financial statements as
prepared under International Financial Reporting Standards and should not be considered as a substitute for GAAP financial measures. In addition, such non-GAAP financial measures may not be
comparable to similarly titled information from other companies.
Disclaimer
2 Safran / H1 2018 earnings / September 6, 2018

This document and the information therein are the property of Safran. They must not be copied or communicated to a third party without the prior written authorization of Safran
Safran / H1 2018 earnings / September 6, 20183
H1 2018 HIGHLIGHTS
Philippe PETITCOLIN - CEO
1

This document and the information therein are the property of Safran. They must not be copied or communicated to a third party without the prior written authorization of Safran
H1 2018 Wrap up
Safran / H1 2018 earnings / September 6, 20184
Excellent financial performance
Organic growth of adjusted revenue(1) at 10.1%
Adjusted recurring operating income(1) up 20.3% (excluding Zodiac Aerospace)
Free cash flow representing 63% of recurring operating income (excluding Zodiac Aerospace)
2018 guidance raised for revenue, recurring operating income and free cash flow thanks to strong
organic momentum
CFM56-LEAP transition on track
Record level of CFM engines deliveries (CFM56 and LEAP) to support airframers
LEAP production ramp up is proceeding; confirmation of 2018 production targets
Integration of Zodiac Aerospace making progress
Zodiac Aerospace financial performance in line with roadmap
Recovery of Zodiac Aerospace’s aircraft interiors operations on track
Confirmation of financial targets for synergies and accretion as per Q1 2018 revenue announcement
Creation of a 50/50 JV with Boeing to design, build and service Auxiliary Power Units
New collaboration with Bell for on demand mobility
(1) See slide 15 for bridge with consolidated figures. (2) excluding airframers
LEAP engines
Zodiac Aerospace retrofit
cabin & structures
Safran, a global Aerospace leader: #3 in Aerospace(2) and #2 in Aerospace Equipment

This document and the information therein are the property of Safran. They must not be copied or communicated to a third party without the prior written authorization of Safran
H1 2018 financial highlights (H1 2017 restated for the application of IFRS 15)
Safran / H1 2018 earnings / September 6, 20185
Adjusted revenue(1) growth of 23.9% (including €1.5Bn from Zodiac Aerospace)Strong organic growth of 10.1%
H1 17 H1 18
(€M)
7,670
9,506
Adjusted recurring operating income(1) growth of 32.6% (including €129M from Zodiac Aerospace)
H1 17 H1 18
(€M)
1,045
1,386
Strong free cash flow generation at €820M (including €25M from Zodiac
Aerospace)
H1 17 H1 18
(€M)
820
Net debt position
12/31/2017 06/30/2018
294*(€M)
(3,533)
+23.9%+32.6%
+10.1%
org
666 +23.1%
Adjusted net profit(1) (group share)
H1 17 H1 18
(€M)
716932+30.2%
Basic earnings per share (group share)
H1 17 H1 18
(€)
1.742.17
772
Continuing
activities
Discontinued
activities
*Excluding €2Bn of securities pledged during the period of the
tender offer for the acquisition of Zodiac Aerospace
1.88
(1) See slide 15 for bridge with consolidated figures
Continuing
activities
Discontinued
activities
+24.7%

This document and the information therein are the property of Safran. They must not be copied or communicated to a third party without the prior written authorization of Safran
Update on the CFM56-LEAP transition
Safran / H1 2018 earnings / September 6, 20186
20% increase in CFM deliveries (CFM56 and LEAP) over H1 2018
1,029 deliveries compared with 857 units in H1 2017
Executing on LEAP production ramp-up
438 LEAP delivered in H1 2018 compared to 147 engines in H1 2017
> 100% dual-source capability on line
> Challenging ramp-up: deliveries still behind customers’ requests
Production cost reduction program on track
CFM56 production rate down, as expected
591 units delivered in H1 2018 compared with 710 units in H1 2017
Confirmation of 2018 delivery targets
LEAP: around 1,100 deliveries
> Recovery plan in place to catch up with customers’ requests by year-end
CFM56: around 1,000 deliveries
LEAP engine
CFM56 assembly line
Adressing the challenges of an unprecedented ramp-up

This document and the information therein are the property of Safran. They must not be copied or communicated to a third party without the prior written authorization of Safran
7 Safran / H1 2018 earnings / September 6, 2018
Update on LEAP program
LEAP-1A
In operations at 27 airlines which represents 240 aircraft
More than 1.2 million flight hours accumulated to date
58% market share on A320neo at June 30, 2018
LEAP-1B
In operations at 41 airlines which represents 183 aircraft
More than 550,000 flight hours accumulated to date
LEAP-1C
Approximately 80 flight hours logged to date
LEAP rolling line
LEAP delivery
LEAP: best-in-class utilization thanks to stable, robust design and industry leading support team

This document and the information therein are the property of Safran. They must not be copied or communicated to a third party without the prior written authorization of Safran
8 Safran / H1 2018 earnings / September 6, 2018
H1 2018 business highlights (1/2)
CFM commercial success
Excellent 2018 Farnborough International Airshow
> 858 LEAP and CFM56 orders and commitments, and long-term services agreements, for a total value of
$15.7bn list price
Backlog LEAP (orders and commitments): 15,450 engines at July 31, 2018
Backlog CFM56: 434 engines at July 31, 2018
Helicopter turbines: two engines type certification granted by EASA For Arriel 2H engine (powering the Avicopter AC312E)
For Ardiden 3C (powering the Avicopter AC352)
Silvercrest
Safran and Dassault Aviation reached an agreement regarding the indemnity to be paid to Dassault Aviation
related to the termination of the Silvercrest engine for the Falcon 5X
Amount covered by the provisions previously booked and payment spread over 3 years starting 2018
The agreement will not change the profitability and cash flow generation outlook of Safran
Signature of several carbon brakes contracts including:
Turkish Airline for 25 A350 and 25 787; Sun Express for 32 737 MAX; Indigo for 100 A320neo
Safran Electronics & Defense
Introducing of Geonyx™, a new family of inertial navigation and pointing systems for land vehicles
MoU between Raytheon and Safran on next-gen sighting systems for combat vehicles
Carbon brake
Ardiden 3C

This document and the information therein are the property of Safran. They must not be copied or communicated to a third party without the prior written authorization of Safran
Safran / H1 2018 earnings / September 6, 20189
Zodiac Aerosystems
Selected by ANA to retrofit its 16 Boeing 777-300 with the inflight connectivity system RAVE™ Broadband as well
as its 8 Boeing 777-200, 11 Boeing 787-8 and 2 Boeing 787-9 with the inflight entertainment system RAVE Centric.
Zodiac Aircraft Interiors
Selected by a major Middle East airline to provide business class and economy class seats for a large wide-bodies
linefit order
Selected by one major Asian airline to provide first class seats for a future wide-bodies linefit order
Signing of an agreement for the acquisition of the Rockwell Collins’ Actuators, Pilot controls and
Special products business
Expand the electrical actuation and flight control business lines of Safran Electronic & Defense and Zodiac
Aerospace
Subject to regulatory approval and expected to be finalized in H1-19
New 50/50 JV with Boeing to design, build and service Auxiliary Power Units (APUs)
Deal excepted to close in H2-18 (subject to regulatory and antitrust clearance)
JV to be accounted for by using the equity method and progressively capitalized once the regulatory authorizations
are obtained
New collaboration between Bell and Safran in the field of on demand mobility
Development of innovative hybrid electric power system solutions to support Bell's future air taxi and vertical take-
off and landing (VTOL) systems
Bell will lead the design, development and production of VTOL systems, and Safran will bring its technical expertise
to bear in the development of a disruptive propulsion system
H1 2018 business highlights (2/2)
Business class seats
Auxiliary Power Units

This document and the information therein are the property of Safran. They must not be copied or communicated to a third party without the prior written authorization of Safran
Continuing momentum in Aerospace services in H1 2018
10
Maintenance CFM56
Safran / H1 2018 earnings / September 6, 2018
Propulsion: civil aftermarket up 12.5% (in $)
2018 yoy change: Q1 +16.4%; Q2 +8.8%
Growth supported by continuing momentum in spare parts sales
As expected, progressive slow down in revenue recognition for service contracts in
Q2 2018 after a sharp seasonal increase in Q1 2018
Aircraft Equipment: services up of 12.6% organically
Growth driven by carbon brakes, nacelles and landing gear support activities
Civil aftermarket growth assumption raised for FY 2018 thanks to strong spare parts sales momentum
Civil aftermarket now expected to grow in the 10% to 12% range (previously “in the high single digits”)
This document and the information therein are the property of Safran. They must not be copied or communicated to a third party without the prior written authorization of Safran
Update on Zodiac Aerospace
Safran / H1 2018 earnings / September 6, 201811
Integration work on track with 3 priorities
Organizational with the objective notably of streamlining and reducing overheads and improving operational
responsiveness
> Envisaged merger by absorption of Zodiac Aerospace SA by Safran SA expected to be completed before the end of
2018
Functional with the implementation of methodologies and Group processes to recover critical programs
> Safran financial reporting & consolidation process deployed and effective
> Lean-Sigma Program launched: ~150 Green Belts / Black Belts / Master Black Belts trainings initiated
> Implementation of Safran operational standards (One Safran) started on key sites and programs
Operational performance with reinforced management of recovery plans for sites experiencing difficulties
> 30+ Safran coaches on site in Zodiac to support recovery plans and accelerate deployment
> 25+ on-site operational projects launched
Zodiac Aerospace financial outlook 4-month performance and 10-month expected contribution in line with financial roadmap
Next step: integrating Zodiac Aerospace financial outlook into Safran’s Medium Term Plan
Safran confirms its target of €200m annual pre-tax run rate cost synergies of which around
90% should be achieved by 2020
Based on the strong upgrade of Safran FY 2018 outlook, the acquisition of Zodiac Aerospace
should improve its 2018 earnings per share at the lower end of the previously indicated range
Business class seat mount
ECOS cabin

This document and the information therein are the property of Safran. They must not be copied or communicated to a third party without the prior written authorization of Safran
Safran / H1 2018 earnings / September 6, 201812
H1 2018 RESULTS
Bernard DELPIT – Group CFO
2

This document and the information therein are the property of Safran. They must not be copied or communicated to a third party without the prior written authorization of Safran
Foreword
Safran / H1 2018 earnings / September 6, 201813
(1) See slide 15 for bridge with consolidated and adjusted income statements(2) Continuing operations: Aerospace Propulsion, Aircraft Equipment, Defense, Zodiac Aerospace, Holding
and others / Discontinued operations: Safran Identity & Security
Application of IFRS 15
All figures are presented in application of IFRS 15 and comparisons
are established against 2017 figures restated for the application of
IFRS 15. The restatements for 2017 are detailed in Appendix.
Adjusted data
All revenue figures in this presentation represent adjusted data(1) and
continuing operations(2) (except where noted). Safran’s consolidated
income statement has been adjusted for the impact of:
purchase price allocations with respect to business combinations. Since 2005,
this restatement concerns the amortization charged against intangible assets
relating to aircraft programs revalued at the time of the Sagem-Snecma
merger. With effect from the first half 2010 interim financial statements, the
Group decided to restate:> the impact of purchase price allocations for business combinations, particularly
amortization charged against intangible assets recognized at the time of the
transaction and amortized over extended periods due to the length of the Group’s
business cycles and the impact of remeasuring inventories, as well as
> gains on remeasuring any previously held equity interests in the event of step
acquisitions or asset contributions to joint ventures;
Safran has also applied these restatements to the acquisition of Zodiac
Aerospace with effect from 2018
the mark-to-market of foreign currency derivatives, in order to better reflect the
economic substance of the Group’s overall foreign currency risk hedging
strategy:> revenue net of purchases denominated in foreign currencies is measured using
the effective hedged rate, i.e., including the costs of the hedging strategy
> all mark-to-market changes on instruments hedging future cash flows are
neutralized
The resulting changes in deferred tax have also been adjusted.
Consolidation of Zodiac Aerospace
Zodiac Aerospace is fully consolidated in Safran’s financial statements
starting March 1, 2018. Safran H1 2018 revenue includes four months
of revenue from Zodiac Aerospace
Organic growth
Organic variations were determined by excluding the effect of changes
in scope of consolidation (notably the four-months contribution of
Zodiac Aerospace) and the impact of foreign currency variations.
Recurring operating income
Operating income before capital gains or losses on disposals /impact
of changes of control, impairment charges, transaction and
integration costs and other items.

This document and the information therein are the property of Safran. They must not be copied or communicated to a third party without the prior written authorization of Safran
FX
Safran / H1 2018 earnings / September 6, 201814
Translation effect: foreign currencies translated into €
Negative impact mainly from USD
Impact on Revenues and Return on Sales
Transaction effect: mismatch between $ sales and € costs is hedged
Positive impact from hedged $ as planned
Impact on Profits
Mark-to-Market effect
€189M loss on fair value of financial instruments
Impact on consolidated “statutory” accounts
H1 2017 H1 2018
$1.08 $1.21
H1 2017 H1 2018
$1.21 $1.18
06/30/2017 12/31/2017 06/30/2018
$1.14 $1.20 $1.17
Average spot rate
Hedge rate
Spot rate at close

This document and the information therein are the property of Safran. They must not be copied or communicated to a third party without the prior written authorization of Safran
Consolidated and adjusted income statements
Safran / H1 2018 earnings / September 6, 201815
H1 2018 reconciliation (In €M) Consolidated data
Currency hedging Business combinations
Adjusted
dataRe-measurement of
revenue
(1)
Deferred hedging
loss/gain
(2)
Amortization
of intangible assets -
Sagem/Snecma merger
(3)
PPA impacts - other
business
combinations
(4)
Revenue 9,393 113 9,506
Other operating income and expenses (8,544) (1) 30 313 (8,202)
Share in profit from joint ventures 63 19 82
Recurring operating income 912 112 30 332 1,386
Other non-recurring operating income and expenses (26) (26)
Profit (loss) from operations 886 112 30 332 1,360
Cost of debt (34) (34)
Foreign exchange gains (losses) (175) (83) 189 (69)
Other financial income and expense (11) (11)
Financial income (loss) (220) (83) 189 (114)
Income tax expense (100) (10) (65) (10) (87) (272)
Profit (loss) from continuing operations 566 19 124 20 245 974
Attributable to non-controlling interests (31) (1) (1) (9) (42)
Attributable to owners of the parent 535 18 124 19 236 932
(1) Remeasurement of foreign-currency denominated revenue net of purchases (by currency) at the hedged rate (including premiums on unwound options) through the reclassification of changes in the fair value of
instruments hedging cash flows recognized in profit or loss for the period. However, the use of the outstanding portfolio of currency derivatives held by Zodiac Aerospace at the acquisition date gave rise to the
partial reclassification of changes in the fair value of currency hedges to financial income (loss) for a six-month transition period.
(2) Changes in the fair value of instruments hedging future cash flows that will be recognized in profit or loss in future periods (€189 million excluding tax), and the impact of taking into account hedges when
measuring provisions for losses on completion (zero at June 30, 2018).
(3) Cancelation of amortization/impairment of intangible assets relating to the remeasurement of aircraft programs resulting from the application of IFRS 3 to the Sagem-Snecma merger.
(4) Cancelation of the impact of remeasuring inventories at the time of the acquisition of Zodiac Aerospace for a negative €294 million (see Note 4, “Scope of consolidation” of the H1 2018 financial statements) and
cancelation of amortization/impairment of assets identified during business combinations.

This document and the information therein are the property of Safran. They must not be copied or communicated to a third party without the prior written authorization of Safran
H1 2018 profit from operations
Safran / H1 2018 earnings / September 6, 201816
(In €M)H1 2017
Restated for IFRS 15H1 2018
Revenue 7,670 9,506
Adjusted recurring operating income
% of revenue
1,045
13.6%
1,386
14.6%
Total one-off items (16) (26)
Capital gain (loss) on disposals - 5
Impairment reversal (charge) - 1
Other infrequent & material non operational items (16) (32)
Profit from operations
% of revenue
1,029
13.4%
1,360
14.3%
Transaction costs
This document and the information therein are the property of Safran. They must not be copied or communicated to a third party without the prior written authorization of Safran
H1 2018 income statement
Safran / H1 2018 earnings / September 6, 201817
Of which cost of debt
of €(34)M
Apparent tax rate of
22%
(In €M) H1 2017Restated for IFRS 15
H1 2018
Revenue 7,670 9,506
Other recurring operating income and expenses (6,707) (8,202)
Share in profit from joint ventures 82 82
Recurring operating income
% of revenue
1,045
13.6%
1,386
14.6%
Total one-off items (16) (26)
Profit from operations
% of revenue
1,029
13.4%
1,360
14.3%
Net financial income (expense) (36) (114)
Income tax expense (248) (272)
Profit from continuing operations 745 974
Profit from discontinued operations 773 0
Profit for the period 1,518 974
Profit for the period attributable to non-controlling interests (30) (42)
Profit attributable to owners of the parent
From continuing operations
From discontinued operations
1,488
716
772
932
932
-
EPS (basic in €) 3.62* 2.17**
From continuing operations
From discontinued operations
1.74
1.88
2.17
-
EPS (diluted in €)
From continuing operations
From discontinued operations
3.56***
1.71
1.85
2.11****
2.11
-
* Based on the weighted average number of shares of
411,224,858 as of June 30, 2017
** Based on the weighted average number of shares
of 428,935,570 as of June 30, 2018
*** Based on the weighted average number of shares
after dilution of 418,502,063 as of June 30, 2017
**** Based on the weighted average number of shares
after dilution of 441,222,853 as of June 30, 2018

This document and the information therein are the property of Safran. They must not be copied or communicated to a third party without the prior written authorization of Safran
776 8,446
7,670
(445)
1,505 9,506
+10.1%
H1 2018 revenue
Safran / H1 2018 earnings / September 6, 201818
Organic growth H1 2018 at H1
2017 scope
and exchange
rates
Currency
impact
Changes in
scope
H1 2018
at H1 2017
scope
8,001
+23.9%
H1 2018H1 2017*
Organic growth: +10.1%
Propulsion: +12.9%
Aircraft Equipment: +5.6%
Defense: +9.2%
Currency impact: (5.8)%
Negative translation impact mainly
from the weakening of the USD
versus the Euro compared with H1-17
Changes in scope: +19.6%
Consolidation of Zodiac Aerospace
activities starting March 1, 2018:
€1,516M (4 months)
*Restated for the application of IFRS 15
In €M

This document and the information therein are the property of Safran. They must not be copied or communicated to a third party without the prior written authorization of Safran
136 1,181
1,045
79
126 1,386
H1 2018 recurring operating income
Safran / H1 2018 earnings / September 6, 201819
Variation
excluding
currency impact
and changes in
scope
H1 2018 at H1
2017 scope
and exchange
rates
Currency
impact
Changes in
scope
H1 2018
at H1 2017
scope
1,260
+32.6%
H1 2018H1 2017*
Main organic drivers
Positive volume effect in Aerospace
services, particularly in civil aftermarket
activities, and in Defense
Positive impact of the CFM56-LEAP
transition on profitability in H1 2018 vs H1
2017
Productivity gains and cost reductions
Lower expensed R&D
Negative impact of lower M88 deliveries
FX
Positive effect of the €/$ hedge rate
Scope
Contribution of €129M from Zodiac
Aerospace activities (4 months)
*Restated for the application of IFRS 15
In €M

This document and the information therein are the property of Safran. They must not be copied or communicated to a third party without the prior written authorization of Safran
Research & Development
Safran / H1 2018 earnings / September 6, 201820
(In €M) H1 2017(1) H1 2018 Change
Total R&D (756) (726) 30
Customer funded R&D 217 161 (56)
Total self-funded R&D (539) (565) (26)
as a % of revenue 7.0% 5.9% (1.1)pt
Tax credit 74 72 (2)
Total self-funded R&D after tax credit (465) (493) (28)
Gross capitalized R&D 167 139 (28)
Amortised R&D (76) (104) (28)
P&L R&D in recurring EBIT (374) (458) (84)
as a % of revenue 4.9% 4.8% (0.1)pt
Self-funded R&D
€565M in H1 2018 including €126M related
to Zodiac Aerospace (4 months)
Excluding Zodiac Aerospace, decrease in
self funded R&D of €100M compared with
H1 2017, in line with FY 2018 assumption
Gross capitalized R&D
€139M in H1 2018 including €27M related
to Zodiac Aerospace
Excluding Zodiac Aerospace, decrease in
capitalized R&D of €55M
P&L R&D in recurring EBIT
€458M in H1 2018 including €112M related
to Zodiac Aerospace
Excluding Zodiac Aerospace, decrease in
R&D charged to the P&L of €28M, in line
with FY 2018 assumption
(1)Restated for the application of IFRS 15

This document and the information therein are the property of Safran. They must not be copied or communicated to a third party without the prior written authorization of Safran
H1 2018 results by activity
Safran / H1 2018 earnings / September 6, 201821
(In €M) H1 2018 Propulsion Equipment Defense AerosystemsAircraft
Interiors
Holding
& others
Revenue 9,506 4,744 2,585 651 742 774 10
Year-over-year growth
in %23.9% 7.5% (1.9)% 6.4% na na na
Year-over-year organic
growth in %10.1% 12.9% 5.6% 9.2% na na na
Recurring operating
income1,386 868 347 45 129 0 (3)
as a % of revenue 14.6% 18.3% 13.4% 6.9% 17.4% na na
Recurring operating
margin variation
(vs H1 2017)
+1.0pt +2.0pts +2.5pts +1.2pt na na na

This document and the information therein are the property of Safran. They must not be copied or communicated to a third party without the prior written authorization of Safran
Aerospace Propulsion
Safran / H1 2018 earnings / September 6, 201822
(In €M) H1 2017* H1 2018 ChangeOrganic
Change
Revenue 4,414 4,744 7.5% 12.9%
Recurring operating income 721 868 20.4%
% of revenue 16.3% 18.3% +2.0pts
One-off items - (1)
Profit (loss) from operations 721 867
% of revenue 16.3% 18.3%
Revenue
Higher volumes of narrowbody engines (CFM56 and LEAP): +20% to 1,029 units driven by LEAP ramp up (+291 deliveries) partially offset by CFM56
progressive ramp down (-119 deliveries)
Resumption of OE organic growth for helicopter turbines
Lower shipments of high thrust engines modules and military engines
Growth in services sales thanks to civil aftermarket (+12.5% in $) and helicopter turbines maintenance activities, partially offset by lower military support
activities
Recurring operating income
Positive drivers: civil aftermarket; tailwind of €35M on profitability from the CFM56-LEAP transition in H1 2018 vs H1 2017; helicopter turbines activity; lower
expensed R&D and improved €/$ hedge rate
Offsetting factor: lower military sales
*Restated for the application of IFRS 15

This document and the information therein are the property of Safran. They must not be copied or communicated to a third party without the prior written authorization of Safran
Aircraft Equipment
Safran / H1 2018 earnings / September 6, 201823
(In €M) H1 2017* H1 2018 ChangeOrganic
Change
Revenue 2,636 2,585 (1.9)% 5.6%
Recurring operating income 287 347 20.9%
% of revenue 10.9% 13.4% +2.5pts
One-off items - -
Profit (loss) from operations 287 347
% of revenue 10.9% 13.4%
Revenue
OE: higher shipments of nacelles for A320neo (+67 units vs H1 2017) and of equipment (landing gear and wiring) for 787 and A320 family
Service (+12.6% org.): growing contribution of carbon brakes as well as nacelle and landing gear support activities
Recurring operating income
Higher volumes (mainly in services)
Cost reduction and productivity actions
Improved hedge rate
Increase in R&D charged to the P&L
*Restated for the application of IFRS 15
This document and the information therein are the property of Safran. They must not be copied or communicated to a third party without the prior written authorization of Safran
Defense
Safran / H1 2018 earnings / September 6, 201824
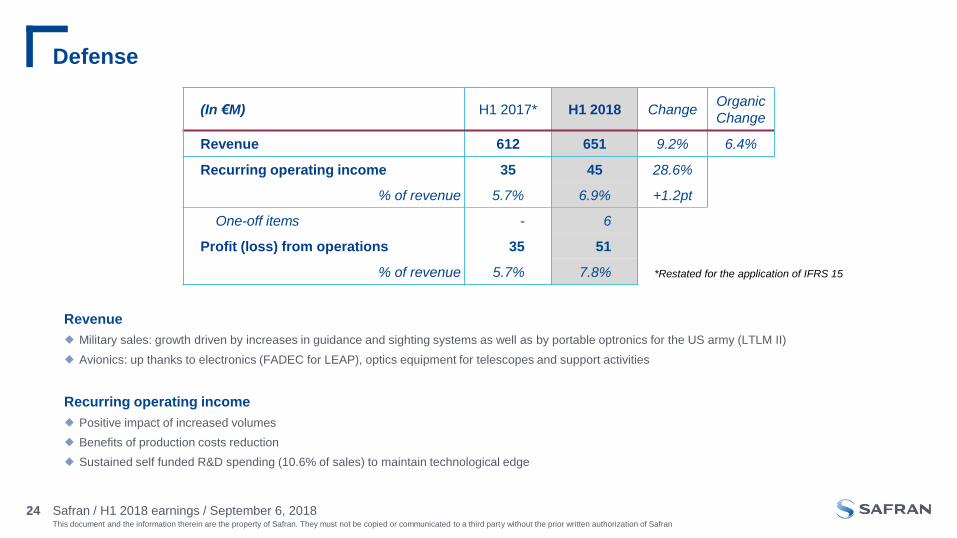
(In €M) H1 2017* H1 2018 ChangeOrganic
Change
Revenue 612 651 9.2% 6.4%
Recurring operating income 35 45 28.6%
% of revenue 5.7% 6.9% +1.2pt
One-off items - 6
Profit (loss) from operations 35 51
% of revenue 5.7% 7.8%
Revenue
Military sales: growth driven by increases in guidance and sighting systems as well as by portable optronics for the US army (LTLM II)
Avionics: up thanks to electronics (FADEC for LEAP), optics equipment for telescopes and support activities
Recurring operating income
Positive impact of increased volumes
Benefits of production costs reduction
Sustained self funded R&D spending (10.6% of sales) to maintain technological edge
*Restated for the application of IFRS 15
This document and the information therein are the property of Safran. They must not be copied or communicated to a third party without the prior written authorization of Safran
Zodiac Aerospace: Aerosystems & Aircraft Interiors
Safran / H1 2018 earnings / September 6, 201825
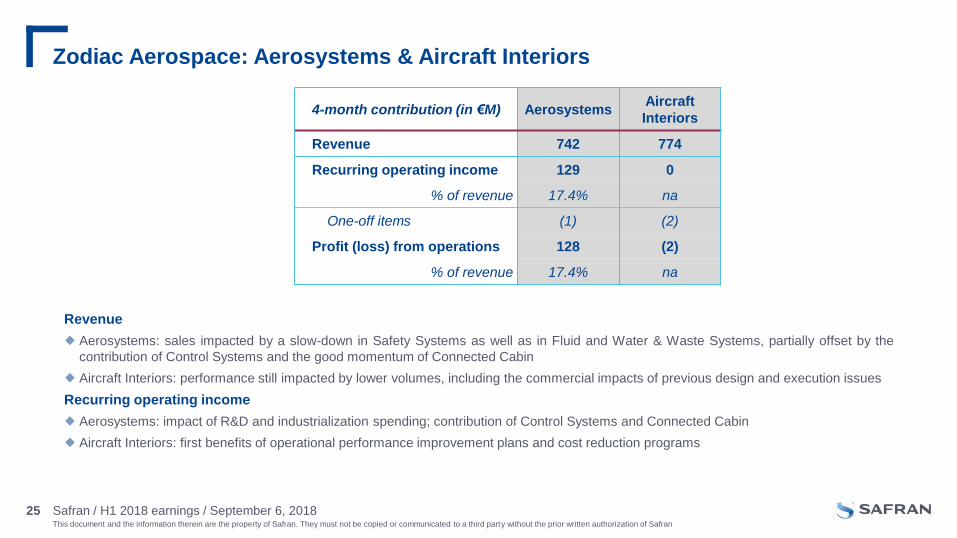
Revenue
Aerosystems: sales impacted by a slow-down in Safety Systems as well as in Fluid and Water & Waste Systems, partially offset by the
contribution of Control Systems and the good momentum of Connected Cabin
Aircraft Interiors: performance still impacted by lower volumes, including the commercial impacts of previous design and execution issues
Recurring operating income
Aerosystems: impact of R&D and industrialization spending; contribution of Control Systems and Connected Cabin
Aircraft Interiors: first benefits of operational performance improvement plans and cost reduction programs
4-month contribution (in €M) AerosystemsAircraft
Interiors
Revenue 742 774
Recurring operating income 129 0
% of revenue 17.4% na
One-off items (1) (2)
Profit (loss) from operations 128 (2)
% of revenue 17.4% na

This document and the information therein are the property of Safran. They must not be copied or communicated to a third party without the prior written authorization of Safran
7.3 7.7 7.2
5.06.0
1.6
3.8
2017 2018 2019 2020 2021
FX Hedging: $25.9bn hedge portfolio* (August 31, 2018)
26 Safran / H1 2018 results / September 6, 2018
€/$ hedge
rate target1.21 1.18 1.16-1.18 1.16-1.18 1.16-1.20
(in $Bn)
*Approx. 45% of Safran US$ revenue are naturally hedged by US$ procurement
Annual average exposure should increase from $7.7bn to $8.8bn starting
2019 reflecting the growth of $-exposed businesses and the inclusion
of former Zodiac Aerospace activities
2019
$7.2bn achieved through forward sales and knock
out options to rise to $8.8bn at a target rate
between $1.16 and $1.18
o Knock out options barriers set at various levels between
$1.26 and $1.32 with maturities up to end 2019
2020
$5.0bn achieved through forward sales and knock
out options to rise to $8.8bn at a target rate
between $1.16 and $1.18
o Knock out options barriers set at various levels between
$1.27 and $1.32 with maturities up to mid 2020
2021
Portfolio increased from $2.5bn to $6.0bn through
the set-up of new $3.5bn knock out options
o Knock out options barriers set at various levels between
$1.28 and $1.33 with maturities up to mid-2020
Note : the current portfolio structure and hedging strategy allow
to include the net exposure from Zodiac activities while
maintaining the targeted hedge rates
2018 fully
hedged

This document and the information therein are the property of Safran. They must not be copied or communicated to a third party without the prior written authorization of Safran
H1 2018 Free Cash Flow
Safran / H1 2018 earnings / September 6, 201827
(in €M) H1 2017Restated for IFRS 15
H1 2018
Adjusted attributable net profit 1,488 932
Of which post-tax capital gain on Security activities (774) -
Depreciation, amortization, provisions and others 380 787
Cash from operating activities before change in WC 1,094 1,719
Change in WC 183 (299)
Cash from operating activities after change in WC 1,277 1,420
Capex (tangible assets) (345) (387)
Capex (intangible assets)* (266) (213)
Free cash flow 666 820
Higher working capital
requirements due to the
CFM56-LEAP transition and
the integration of Zodiac
Aerospace
Of which
• Depreciation €21M
• Amortization of tangibles
and intangibles €400M
• Provisions (net) €53M
* Of which €144M capitalised R&D in H1 2018 vs €170M capitalised in H1 2017
Drop in CAPEX reflecting
lower development spending
partially offset by the
integration of Zodiac
Aerospace activities
This document and the information therein are the property of Safran. They must not be copied or communicated to a third party without the prior written authorization of Safran
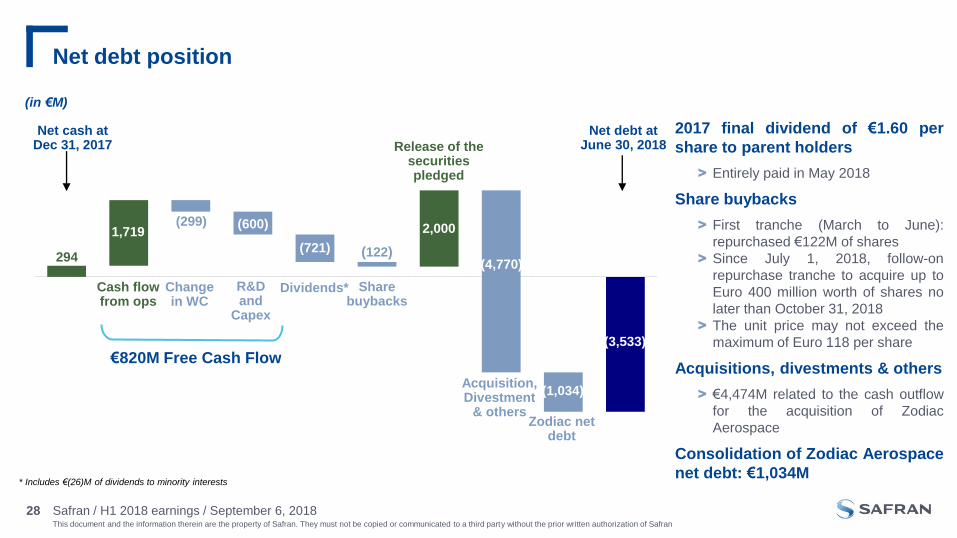
(in €M)
294
Dividends*
Net cash at Dec 31, 2017
Cash flowfrom ops
Share buybacks
Net debt atJune 30, 2018
Changein WC
R&Dand
Capex
€820M Free Cash Flow
* Includes €(26)M of dividends to minority interests
(299)
(401)
3,044
Net debt position
Safran / H1 2018 earnings / September 6, 201828
Acquisition, Divestment
& others
2017 final dividend of €1.60 per
share to parent holders
> Entirely paid in May 2018
Share buybacks
> First tranche (March to June):
repurchased €122M of shares
> Since July 1, 2018, follow-on
repurchase tranche to acquire up to
Euro 400 million worth of shares no
later than October 31, 2018
> The unit price may not exceed the
maximum of Euro 118 per share
Acquisitions, divestments & others
> €4,474M related to the cash outflow
for the acquisition of Zodiac
Aerospace
Consolidation of Zodiac Aerospace
net debt: €1,034M
(721)
(3,533)
(600)1,719
(4,770)(122)
2,000
(1,034)
Zodiac net debt
Release of the securities pledged

This document and the information therein are the property of Safran. They must not be copied or communicated to a third party without the prior written authorization of Safran
Balance sheet highlights as of June 30, 2018
Safran / H1 2018 earnings / September 6, 201829
(In €M)Dec 31,
2017*
June 30,
2018
Goodwill
Tangible & Intangible assets
Investments in joint ventures and associates
Other non current assets
Operating Working Capital
Net cash (debt)
1,831
9,114
2,127
575
(3,112)
294
7,346
10,401
2,144
862
(1,875)
(3,533)
Shareholders’ equity - Group share
Minority interests
Non current liabilities (excl. net cash (debt))
Provisions
Other current liabilities / (assets) net
9,347
301
1,251
2,188
(2,258)
10,487
309
1,981
2,632
(64)
Higher operating working capital
including Zodiac Aerospace and
within the context of the CFM56-
LEAP transition
Net debt position at June 30, 2018
reflecting the impact of the
acquisition of Zodiac Aerospace
*Restated for the application of IFRS 15
Of which €5.5Bn after the
preliminary allocation of Zodiac
PPA
Lifting of pledge on €2Bn of
marketable securities at the end of
the offer on Zodiac Aerospace

This document and the information therein are the property of Safran. They must not be copied or communicated to a third party without the prior written authorization of Safran
Safran / H1 2018 earnings / September 6, 201830
FY 2018 OUTLOOK
Philippe PETITCOLIN - CEO
3

This document and the information therein are the property of Safran. They must not be copied or communicated to a third party without the prior written authorization of Safran
2018 key assumptions changed
Safran / H1 2018 earnings / September 6, 201831
Assumptions changed:
Civil aftermarket growth in the range 10% to 12% (previously “in the high-single digits”)
Transition CFM56 – LEAP: overall negative impact on Propulsion adjusted recurring operating income variation in the range
€100 to 150 million (previously “€150 to 200 million”) thanks to an improvement of CFM56 gross margin
This negative impact from the transition represents a significant reduction compared to 2017 and includes:
Lower CFM56 OE volumes
Negative margin on LEAP deliveries
Assumptions unchanged:
Increase in aerospace OE deliveries despite a fall in high thrust engines modules
Reduction of self-funded R&D of around €150M
Positive impact on recurring operating income after activation and amortisation of capitalized R&D
Capex outflows of a similar level to 2017
Continued benefits from productivity improvements
2018 assumptions are established considering the full application of the new IFRS15 revenue recognition standard and is based on continuing
operations (Aerospace Propulsion, Aircraft Equipment, Defense, Holding & Others) at the group’s scope as of January 1, 2018.
This document and the information therein are the property of Safran. They must not be copied or communicated to a third party without the prior written authorization of Safran
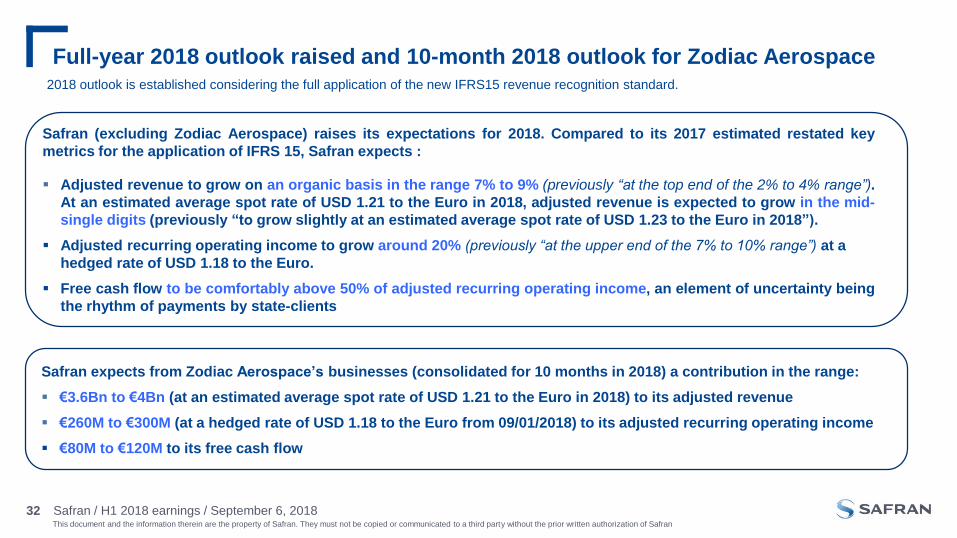
Full-year 2018 outlook raised and 10-month 2018 outlook for Zodiac Aerospace
32 Safran / H1 2018 earnings / September 6, 2018
2018 outlook is established considering the full application of the new IFRS15 revenue recognition standard.
Safran (excluding Zodiac Aerospace) raises its expectations for 2018. Compared to its 2017 estimated restated key
metrics for the application of IFRS 15, Safran expects :
Adjusted revenue to grow on an organic basis in the range 7% to 9% (previously “at the top end of the 2% to 4% range”).
At an estimated average spot rate of USD 1.21 to the Euro in 2018, adjusted revenue is expected to grow in the mid-
single digits (previously “to grow slightly at an estimated average spot rate of USD 1.23 to the Euro in 2018”).
Adjusted recurring operating income to grow around 20% (previously “at the upper end of the 7% to 10% range”) at a
hedged rate of USD 1.18 to the Euro.
Free cash flow to be comfortably above 50% of adjusted recurring operating income, an element of uncertainty being
the rhythm of payments by state-clients
Safran expects from Zodiac Aerospace’s businesses (consolidated for 10 months in 2018) a contribution in the range:
€3.6Bn to €4Bn (at an estimated average spot rate of USD 1.21 to the Euro in 2018) to its adjusted revenue
€260M to €300M (at a hedged rate of USD 1.18 to the Euro from 09/01/2018) to its adjusted recurring operating income
€80M to €120M to its free cash flow

This document and the information therein are the property of Safran. They must not be copied or communicated to a third party without the prior written authorization of Safran
Safran / H1 2018 earnings / September 6, 201833
Q&A
4

This document and the information therein are the property of Safran. They must not be copied or communicated to a third party without the prior written authorization of Safran
Safran / H1 2018 earnings / September 6, 201834
ADDITIONAL INFORMATION
5

This document and the information therein are the property of Safran. They must not be copied or communicated to a third party without the prior written authorization of Safran
Shareholding status 06/30/18 (versus 12/31/17)
35
Voting rights as of June 30, 2018
Number of exercisable voting rights : 532,916,990
French State
21.9%Public
62.7%
Employees
10.4%
French State14%
Public76.7%
Employees
7.4%
Treasury shares
1.9%
Equity as of June 30, 2018
Number of shares (post issue of preference shares) : 443,680,643
Former Zodiac Aerospace shareholders
5.0%
Former Zodiac Aerospace shareholders
6.0%
French State
13.1%Public72%
Employees
6.9%
Treasury shares
2.1%
Equity as of December 31, 2017
Number of shares : 417,029,585
Voting rights as of December 31, 2017
Number of exercisable voting rights : 508,465,912
French State
23%
Public
66.1%
Employees
10.9%

This document and the information therein are the property of Safran. They must not be copied or communicated to a third party without the prior written authorization of Safran
H1 2018: R&D by activity
Safran / H1 2018 earnings / September 6, 201836
(In €M) H1 2018 Propulsion Equipment DefenseZodiac
Aerospace
Total self-funded cash R&D (565) (257) (113) (69) (126)
as a % of revenue 5.9% 5.4% 4.4% 10.6% 8.3%
Tax credit 72 28 23 18 3
Total self-funded cash R&D after tax credit (493) (229) (90) (51) (123)
Gross capitalized R&D 139 42 47 23 27
Amortised R&D (104) (50) (30) (8) (16)
P&L R&D in recurring EBIT (458) (237) (73) (36) (112)
as a % of revenue 4.8% 5.0% 2.8% 5.5% 7.4%

This document and the information therein are the property of Safran. They must not be copied or communicated to a third party without the prior written authorization of Safran
H1 2017: R&D by activity
Safran / H1 2018 earnings / September 6, 201837
(In €M) H1 2017 Propulsion Equipment Defense
Total self-funded cash R&D (539) (360) (113) (66)
as a % of revenue 7.0% 8.2% 4.3% 10.8%
Tax credit 74 30 25 19
Total self-funded cash R&D after tax credit (465) (330) (88) (47)
Gross capitalized R&D 167 81 58 28
Amortised R&D (76) (41) (27) (8)
P&L R&D in recurring EBIT (374) (290) (57) (27)
as a % of revenue 4.9% 6.6% 2.2% 4.4%

This document and the information therein are the property of Safran. They must not be copied or communicated to a third party without the prior written authorization of Safran
Aerospace OE / Services revenue split (excluding Zodiac Aerospace)
Safran / H1 2018 earnings / September 6, 201838
Revenue
Adjusted data(in Euro million)
H1 2017 H1 2018 % change
OE Services OE Services OE Services
Propulsion
% of revenue
1,773
40.2%
2,641
59.8%
2,023
42.6%
2,721
57.4%
14.1% 3.0%
Equipment
% of revenue
1,829
69.4%
807
30.6%
1,739
67.3%
846
32.7%
(4.9)% 4.8%

This document and the information therein are the property of Safran. They must not be copied or communicated to a third party without the prior written authorization of Safran
Quantities of major aerospace programs
Safran / H1 2018 earnings / September 6, 201839
Safran
Number of units deliveredH1 2017 H1 2018 % change
CFM56 engines 710 591 (17)%
LEAP engines 147 438 x3
High thrust engines 256 201 (21)%
Helicopter engines 314 335 7%
M88 engines 12 4 (67)%
A350 landing gear sets 43 40 (7)%
787 landing gear sets 66 74 12%
A380 nacelles 21 20 (5)%
A330 thrust reversers 52 50 (4)%
A320neo nacelles 105 172 64%
A320 thrust reversers 263 176 (33)%
Small nacelles (biz & regional jets) 234 309 32%
Zodiac Aerospace
Number of units delivered
4 months
(March to June)
Lavatories A350 241
Spaceflex V2 A320 (lavatories + Galleys) 178
Business class seats 1,495
Emergency slides A320 1,296
Primary power distribution system 787 296

This document and the information therein are the property of Safran. They must not be copied or communicated to a third party without the prior written authorization of Safran
Gross debt and liquidity
Safran / H1 2018 earnings / September 6, 201840
Gross debt repayment schedule(June 30, 2018)
<1 year 1 to 5 years >5 years
€2,309M
€2,895M
€701M
OCEANE (issued on June 18, 2018) - €700M, zero coupon
Two-year floating rate notes (completed on July 5, 2018) -
€500M, coupon of 3-month Euribor + 33bps per annum
Gross
debt
€5,905M
Cash & equiv.
€2,380M
+
Debt hedging
instruments €(8)M
Net debt
€3,533M
Committed & undrawn financing resource:
Credit line - €2.52Bn, maturity Dec. 2020 – no covenant

This document and the information therein are the property of Safran. They must not be copied or communicated to a third party without the prior written authorization of Safran
IFRS 15 balance sheet as of June 30, 2018
Safran / H1 2018 earnings / September 6, 201841
Assets (In €M)Jan 1,
2018(1)
Jan 1,
2018(2)
June 30,
2018
Goodwill
Tangible & Intangible assets
Investments in JV and associates
Other non current assets
Inventories and WIP
Contracts costs
Trade and other receivables
Contracts assets
Cash and cash equivalents
Other current assets
1.8
8.7
2.1
0.5
4.5
-
6.4
-
4.9
3.3
1,831
9,114
2,127
591
3,954
261
4,952
1,366
4,914
3,275
7,346
10,401
2,144
874
5,578
473
6,154
1,485
2,380
1,535
Total Assets 32.2 32,385 38,370
Liabilities (In €M)Jan 1,
2018(1)
Jan 1,
2018*
June 30,
2018
Equity
Provisions
Interest bearing liabilities
Other non-current liabilities
Trade and other payables
Contracts liabilities
Other current liabilities
10.6
3.4
4.6
1.6
10.8
-
1.2
9,648
2,188
4,636
1,251
4,409
9,090
1,163
10,796
2,632
5,905
2,001
5,244
10,103
1,689
Total Liabilities 32.2 32,385 38,370
(1) As published in €Bn at the IFRS 15 workshop on March 12, 2018
(2) As published in €M in H1 2018 financial in application of IFRS 15
As previously indicated in our IFRS 15 workshop (March 2018), 3 main changes in Safran balance sheet :
• Contracts costs : costs not capitalized as intangible because related to one customer and very specific
• Contracts assets : the obligation was satisfied and revenue was recognized but Safran is not entitled to bill yet
• Contracts liabilities : significant amount that includes deferred revenue and advance payments from customers which used to be
included in trade payables and others

This document and the information therein are the property of Safran. They must not be copied or communicated to a third party without the prior written authorization of Safran
Customer financial guarantees
Safran / H1 2018 earnings / September 6, 201842
(In $M)Dec. 31,
2017
June 30,
2018
Total guarantees 35 29
Estimated value of pledges 16 15
Net exposure on these guarantees 19 14
Provisions 6 6
Total guarantees remaining at a historically low level
This document and the information therein are the property of Safran. They must not be copied or communicated to a third party without the prior written authorization of Safran
Definition
Safran / H1 2018 earnings / September 6, 201843
Civil aftermarket (expressed in USD)
This non-accounting indicator (non-audited) comprises spares and MRO (Maintenance, Repair & Overhaul) revenue for all civil
aircraft engines for Safran Aircraft Engines and its subsidiaries and reflects the Group’s performance in civil aircraft engines
aftermarket compared to the market.
Discontinued operations
Safran entered into exclusive negotiations with Advent International/Oberthur Technologies to sell Safran’s identity and security
activities (announced September 29, 2016). Following this decision, all the businesses comprising Safran’s identity & security
activities have been classified as “discontinued operations” at the end of September 2016, including detection activities which had
been classified as assets and liabilities held for sale since the announcement on April 21, 2016 of the signing of an agreement for
their sale to Smiths Group. The contribution of the I&S activities to Safran’s financial statements is therefore presented separately
from Safran’s continuing operations: Propulsion, Aircraft Equipment, Defense and Holding & Others. Safran finalized the sale of its
detection activities on April 7, 2017 and of its identity and security activities on May 31, 2017.
Recurring operating income
In order to better reflect the current economic performance, this subtotal named “recurring operating income” excludes income and
expenses which are largely unpredictable because of their unusual, infrequent and/or material nature such as: impairment
losses/reversals, capital gains/losses on disposals of operations and other unusual and/or material non-operational items.
Free cash flow
Free cash flow represents cash flow from operating activities less any disbursements relating to acquisitions of property, plant and
equipment and intangible assets.


