
Fine Sand for Usein
PC Concrete
Final Reportfor
MLR-88-6
March 1989
Highway Division
-----t:&tt.lowa Department-------~,of Transportation
Fine Sand For Use
In P.C. Concrete
Final ReportMLR-88-6
Kevi n JonesCement and Concrete Engineer
Office of MaterialsIowa Department of Transportation
March 1989
Abstract
Introduction
Objective
Materials
Scope
Testing
Discussion of Results
Conclusions
Recommendations
Appendix
Table of Contents
1
2
4
4
4
5
8
14
15
16
Disclaimer
The contents of this report reflect the views of the authorand do not necessarily reflect the official view of the IowaDepartment of Transportation. This report does not constitutea standard, specification or regulation.

Page 1
ABSTRACT
In several locations of Iowa, it is becoming more difficult to
produce concrete sand consistently at a reasonable cost. Both
ASTM and AASHTO have specifications for concrete sands that allow
a finer, poorer graded sand than Iowa specifications.
The objective of the study was to develop standard mix designs to
permit the use of finer graded sand for p.c. concrete. Three
hundred cylinders were made from five sands available in the
state. Based on the results of the study, the following is
recommended.
1. Create another class of concrete sand by:
a. Lowering the current mortar strength ratio from 1.5
to 1. 3
b. Raising the allowance for the percent passing one sieve
and retained on the next from 40 to 45.
c. Including a provision that 25 to 60 percent passing the
number 30 sieve is required for the sand.
2 • Modify the standard paving mixes with and without fly ash for
use with the finer sand as follows:
a . 8% more cement and fly ash for B-2 to B-5 mixes.
b. 7% more cement and fly ash for A-2 to A-5 mixes.
c. 5% more cement and fly ash for C-2 to C-5 mixes and
water reduced mixes.

Page 2
INTRODUCTION
The specifications for concrete sand in Iowa have been used for
many years with very good results. In several locations of the
state, it is becoming more difficult to produce concrete sand
consistently at a reasonable cost. Both ASTM and AASHTO have
specifications for concrete sands that allow a finer, less well
graded sand than the Iowa specification. An earlier study
included in Appendix B concluded that finer sand may be feasible
in Iowa concrete mixes with some modifications. The ASTM and
AASHTO specifications are based on the use of trial mix testing
prior to construction. Iowa does not currently use the trial mix
procedure.
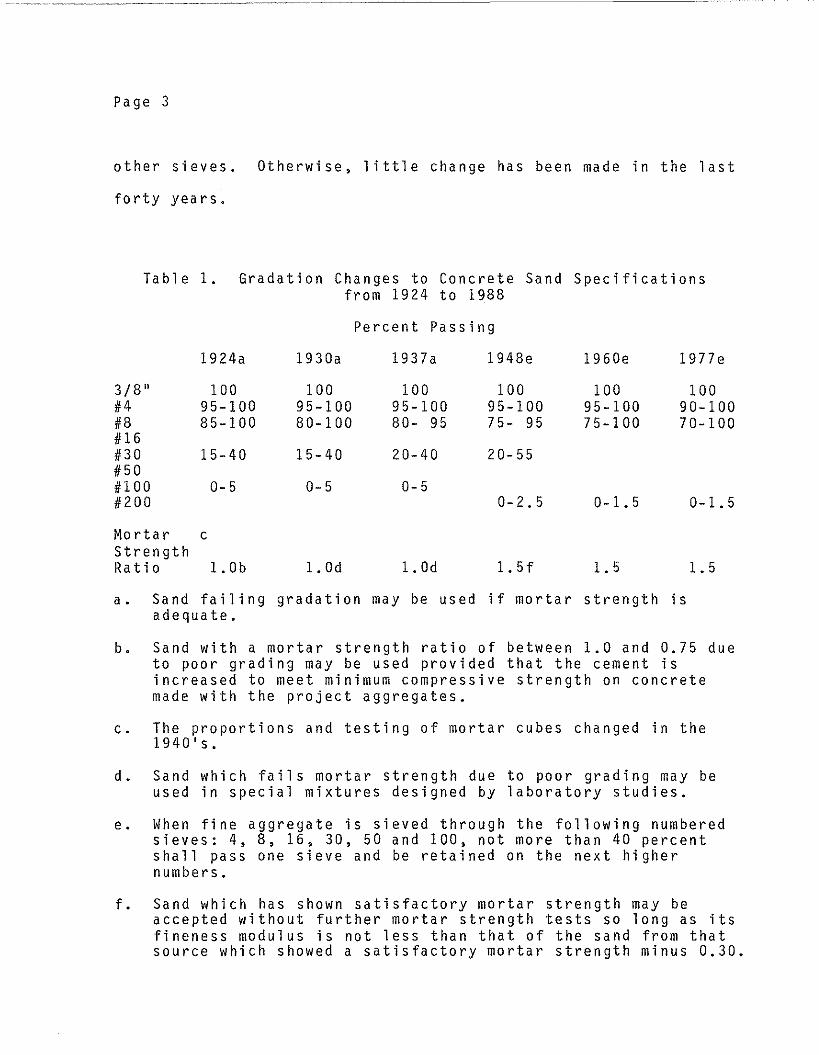
Changes in the gradation requirements for concrete sand in Iowa
are shown in table I. The specifications published in the I94B
"Standard Specifications for Highway and Bridge Construction"
were quite different from the previous specifications.
The major changes were:
1. Limit the gradation so that not more than 40 percent shall
pass one sieve and be retained on the sieve with the next
higher number.
2. Increase the mortar cube strength ratio to 1.5.
3. Eliminate the option of designing special mixes using sand
failing to meet cube strength or gradation requirements.
4. Adopt a #200 sieve requirement of 0 to 2.5% passing.
The changes since 1948 have been to reduce the percent passing
the #200 sieve and open up the gradation requirements on the
Page 3
other sieves. Otherwise, little change has been made in the last
forty years.
Table 1. Gradation Changes to Concrete Sand Specificationsfrom 1924 to 1988
Percent Passing
3/8"#4#8#16#30#50#100#200
1924a
10095-10085-100
15-40
0- 5
1930a
10095-10080-100
15-40
0- 5
1937a
10095-10080- 95
20-40
0- 5
1948e
10095-10075- 95
20- 55
0-2.5
1960e
10095-10075-100
0-1.5
1977e
10090-10070-100
0-1 . 5
Mortar cStrengthRatio LOb 1. Od 1. Od 1. 5f 1.5 1.5
a. Sand failing gradation may be used if mortar strength isadequate.
b. Sand with a mortar strength ratio of between 1.0 and 0.75 dueto poor grading may be used provided that the cement isincreased to meet minimum compressive strength on concretemade with the project aggregates.
c. The proportions and testing of mortar cubes changed in the1940's.
d. Sand which fails mortar strength due to poor grading may beused in special mixtures designed by laboratory studies.
e. When fine aggregate is sieved through the following numberedsieves: 4, 8, 16, 30, 50 and 100, not more than 40 percentshall pass one sieve and be retained on the next highernumbers.
f. Sand which has shown satisfactory mortar strength may beaccepted without further mortar strength tests so long as itsfineness modulus is not less than that of the sand from thatsource which showed a satisfactory mortar strength minus 0.30.

Cement:
Page 4
OBJECTIVE
The objective of the study was to determine the necessary
modification to the standard mix designs to permit the use of
finer, less well graded sand for concrete mixes.
MATERIALS
The following materials were used in the study:
Type I, standard laboratory blend of eight portland
cements available in Iowa (AC7-350).
Fly Ash: Ottumwa, Class C (ACFB-93)
Air Entraining Agent: Ad Aire, Single Strength,
Carter-Waters Corp.
Coarse Aggregate: Martin Marietta (Fort Dodge A94002) (AAC7-29)
Fine Aggregate: 1. Martin Marietta (West Des Moines A77510)(AASB-112)
2. Giese Construction (Conn A55520) (AASB-123)
3. Van Dusseldorp (Colfax (A50502) (AASB-117)
4. Finley (Shenandoah A73504) (AASB-155)
5. Vulcan Materials (Oxford Mills A53516)(AASB-154)
SCOPE
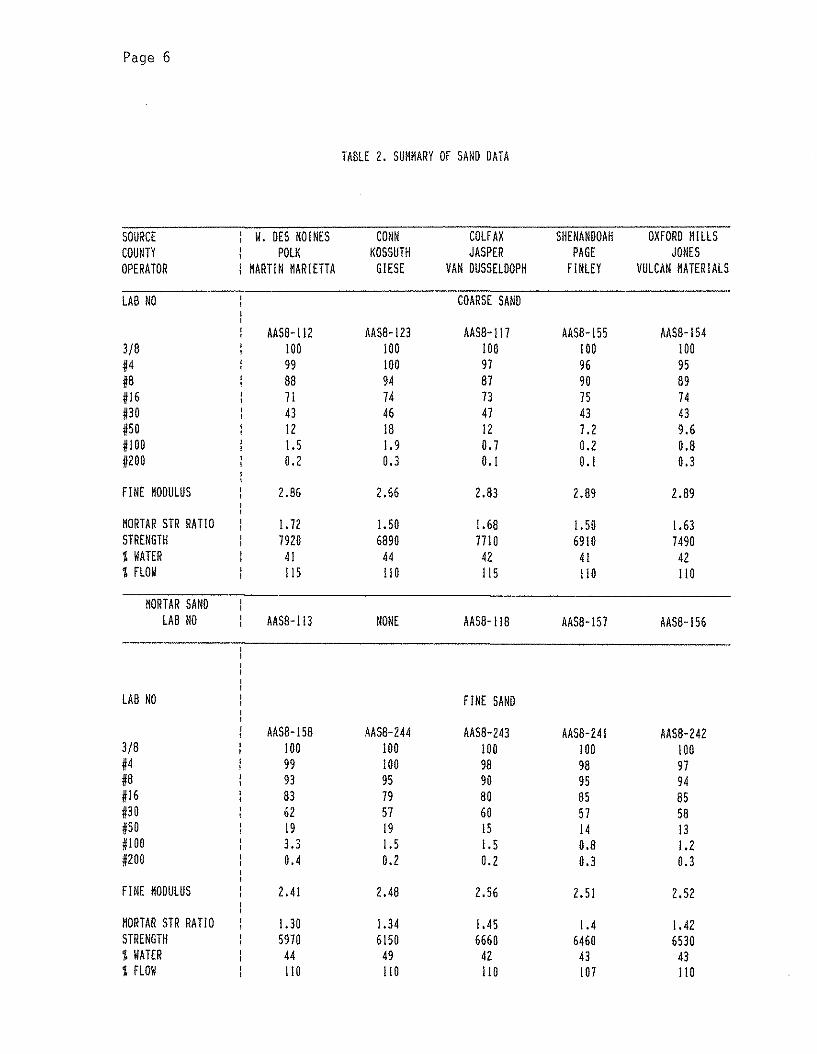
Five sands were chosen to represent the range of fine sands in the
state. Each sand was tested for gradation, coal, shale,
absorption, organic impurities, x-ray diffraction and mortar
strength. To build the sands to proper gradations for testing,

Page 5
fines from the concrete sand were obtained. No fines were
available from the Conn Pit. Instead, a portion of the concrete
sand was graded and blended into the remaining concrete sand. The
gradation chosen and the mortar strength obtained are in Table 2.
All aggregate test results are in the Appendix.
It should be mentioned that the fine gradation of Shenandoah sand
was tested twice for mortar strength. The first test showed a
ratio of 1.50, the same as the coarse gradation. The second test
was performed to verify the results. The second run was 1.40.
The two results are well within the single-laboratory coefficient
of variation for ASTM test procedure C109.
TESTING.
Thirty mixes were made according to ASTM C1n and 300 cylinders
were cast and tested for the project. The mixes are as follows:
Mix Mix Cemen~ Fl y As ~ Coarse Concrete FineNo. Designation (H/yd. ) (H/yd. ) Agg. ( %) Sand ( %) Sand ( %)
A C-3-C 513 91 55 45
B B-3-C 407 72 55 45
C C-3-C 513 91 55 45
D B-3-C 407 72 55 45
E C-3-C Mod 529 104 55 45
F B-3-C Mod 418 82 55 45
The test results are shown in Table 3.
Page 6
TABLE 2. SUMMARY OF SAND DATA
SOURCE , W. DES MOINES CONN COLF AX SHENANDOAH OXFORD MILLS,COUNTY POLK KOSSUTH JASPER PAGE JONESOPERATOR I MARTIN MARIETTA GIESE VAN DUSSELOOPH FINLEY VULCAN MATERIALS
LAB NO COARSE SAND
AASB-II2 AASB-123 AASB- II7 AASB-155 AASB-I543/B 100 100 100 100 100#4 99 100 91 96 95#B B8 94 81 90 89#16 11 14 13 15 14#30 43 46 41 43 43#50 12 18 12 1.2 9.6#100 1.5 1.9 0.1 0.2 0.8#200 0.2 0.3 O. I O. I 0.3
FINE MODULUS 2.86 2.66 2.83 2.89 2.89
MORTAR STR RATIO 1.12 1.50 1.68 I. 50 1.63STRENGTH 7920 6890 1110 6910 1490~ WATER 41 44 42 41 42~ FLOW 115 1I0 115 110 110
MORTAR SANDLAB NO AAS8- I13 NONE AAS8-118 AAS8- IS1 AAS8-156
LAB NO FINE SAND
AAS8-158 AAS8-244 AAS8-Z43 AAS8-241 AAS8-2423/8 100 100 100 100 100#4 99 100 98 98 91#8 93 95 90 9S 94#16 83 19 80 85 85#30 62 51 60 51 58#50 19 19 15 14 13#100 3.3 1.5 1.5 0.8 1.2#200 0.4 0.2 0.2 0.3 0.3
FINE MODULUS 2.41 2.48 2.56 2.51 2.52
MORTAR STR RATIO I. 30 1.34 1.45 1.4 1.42STRENGTH 5910 6150 6660 6460 6530i WATER 44 49 42 43 43i FLOW lID lID II0 101 110

TABL
E3
.SU
MM
ARY
OF
TEST
RES
ULT
S
MIX
SAN
OCE
MEN
TFL
YAS
HW
/C+
FAA
IRSL
UM
PC
OM
PRES
SIV
EST
R.
MOR
TAR
FIN
EN
ESS
SP
EC
IFIC
"NO
(#/Y
03
)(1
1/'(0
3)(;
0(I
N.)
7-0A
Y28
-0A
YST
REN
GTH
1100
Ulll
SSU
RFA
CE
'"<0 (J)
---lA---WESrJJ:f·r:------S13-------9r-----O:392-----S:0-----r:-SO------4830------S4S0------1:-7------S:-Sr-------12~~37--
-.J
IBW
EST
O.M
.40
;772
0.4
72
6.0
1.0
041
5054
001
.75
.51
12..3
7lC
WES
TD
.M..
51
391
0.4
02
6.4
1.5
050
9060
301
.35
.31
15..6
610
WES
TO
.M.
407
720
.50
96
.51
.25
4000
4990
1..3
5.3
11
5.6
6IE
WES
TD
.11.
52
910
40
.39
96
.21
.25
5120
6520
1.3
5.3
115
..66
IFW
EST
D.M
.41
882
0.4
88
6.4
1.2
540
5053
001
.35
.31
15
.66
2ACO
NN51
391
0.4
75
6.0
1.2
548
1065
601
.55
.43
13
.77
28CO
NN40
772
0.5
84
6.0
1.0
036
2052
101
.55
.43
13
.77
2CCO
NN5
13
910
.46
66
.51
.25
4590
6280
1.3
5.3
41
4.7
120
CONN
40
772
0..5
83
6.6
1.2
530
6045
501
..35
.34
14
.71
2ECO
NN52
910
40
.44
36
.41
.50
4790
6380
1..3
5.3
41
4.7
12F
CONN
418
820
.59
25
.81
.25
3550
4910
1.3
5.3
41
4.7
1
3ACOlFA~:
51
391
0.3
82
5.8
1.5
053
2064
601
.75
.50
12
..37
38CO
LFA
X40
772
0.4
60
6.2
1.2
541
5053
101
.75
.50
12..3
73C
COLF
AX
51
391
0.4
07
6_
31
.50
5210
6400
1.4
5.3
814
..17
30CO
LFA
X40
772
0.4
91
6.5
1.2
538
6050
801
.45
.38
14
.17
3ECO
LFA
X5
29
104
0.3
85
6.0
1.2
554
9063
601
.45
.38
14..1
73F
CO
lFH
X41
88
20
.47
66
.21
.25
4420
5600
1.4
5.3
81
4.1
7
4RSH
ENAN
OOAH
51
391
0.3
82
6.1
1.5
049
9060
201
.55
.53
11..
454B
SHEN
ANOO
AH40
77
20
.46
66
.21
.50
3690
4760
1.5
5.5
311
..45
4CSH
ENAN
OOAH
51
391
0.4
02
6.0
1.2
550
5061
301
.45
.36
14..0
240
SHEN
ANDO
AH40
772
0.4
84
6.5
1.2
540
8050
301
.45
.36
14
.02
4ESH
ENAN
DOAH
52
910
40
.38
56
.31
.50
5180
6660
1.4
5.3
61
4.0
24F
SHEN
ANOO
AH41
882
0.4
76
6.5
1.2
542
205
33
01
.45
.36
14
.02
SAO
X.
11Il
lS5
13
910
.38
25
.51
.25
5450
6610
1.6
5.5
31
2.0
258
OX
.H
IllS
407
720
.46
65
.91
.25
4750
5630
1.6
5.5
31
2.0
25C
OX
.M
IllS
513
910
.39
76
.01
.25
5160
6350
1.4
5.3
61
4.0
350
OX
.11
IllS
407
72
0.4
84
6.6
1.2
536
8045
501
.45
.36
14
.03
5EO
X.
HIl
lS52
910
40
.37
46
.11
.25
5310
6270
1.4
5.3
61
4.0
35F
OX
.H
IllS
418
820
.45
87
.51
.50
3670
4650
1.4
5.3
61
4.0
3
NO
TES:
MIX
AAN
D8
ARE
WIT
HCO
ARS
ESA
NO
I'1IX
CTH
ROUG
HF
ARE
WIT
HFI
NE
SAN
DST
REN
GTH
AV
ERA
GES
ARE
8ASE
DON
FIV
EC
YlIN
OE
RS

Page 8
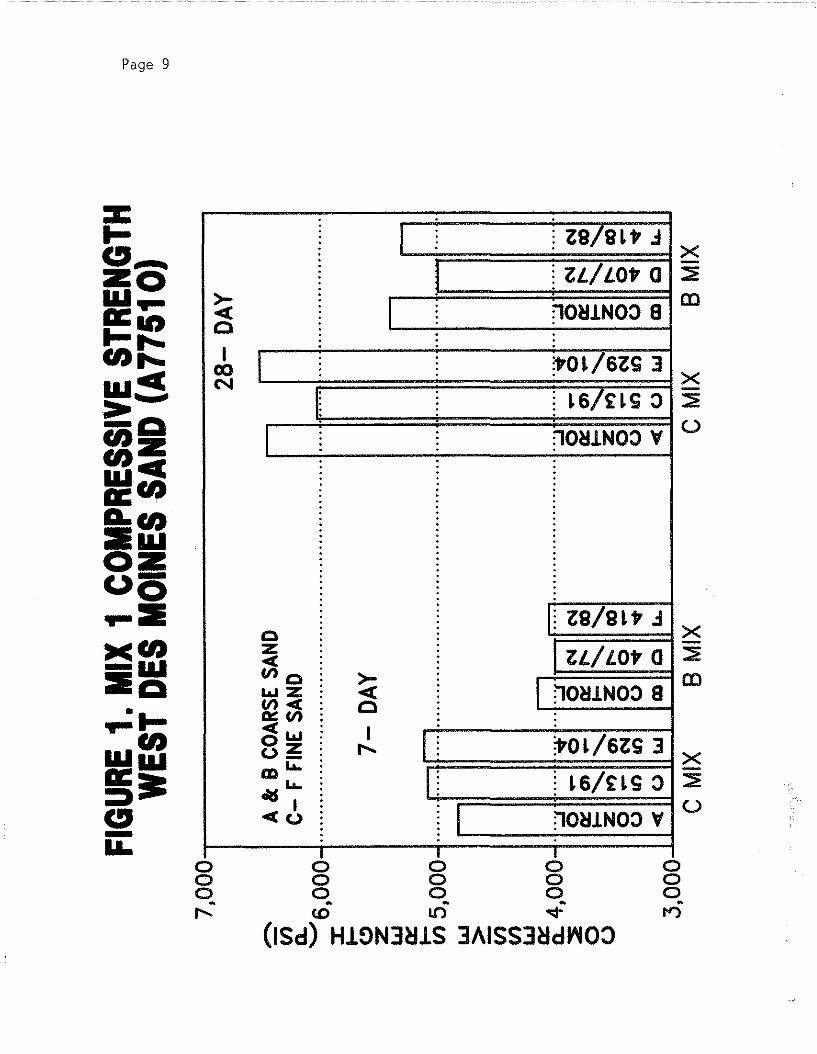
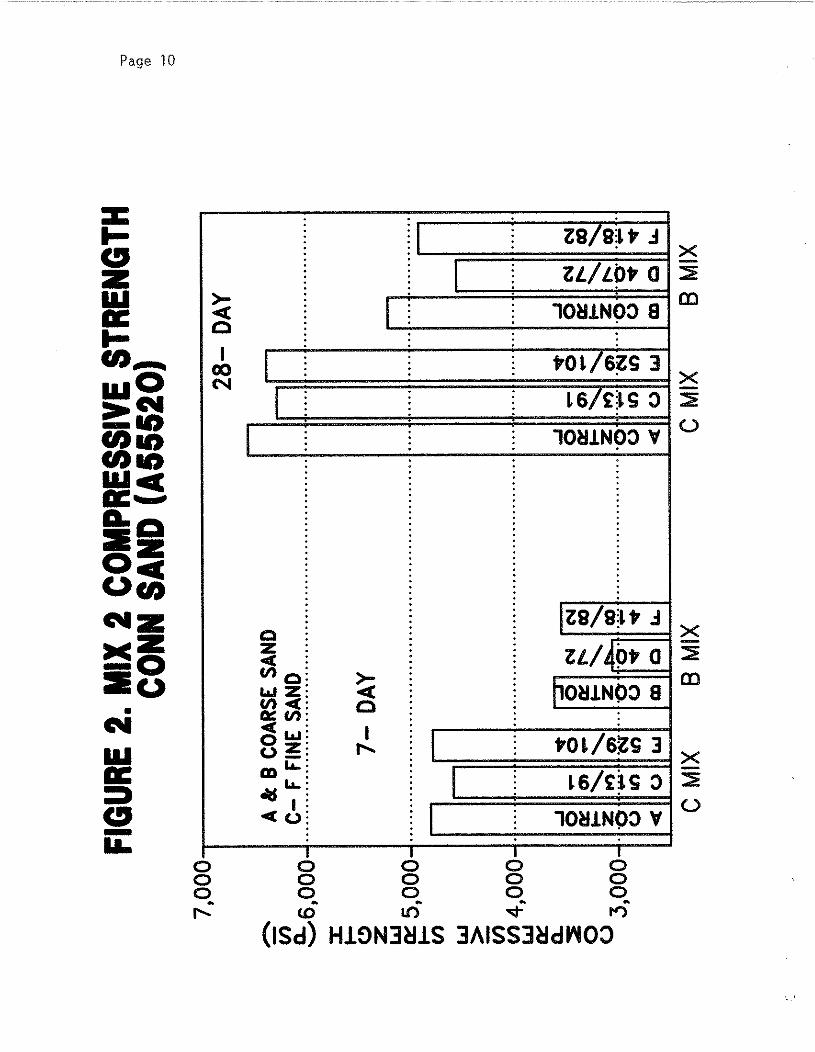
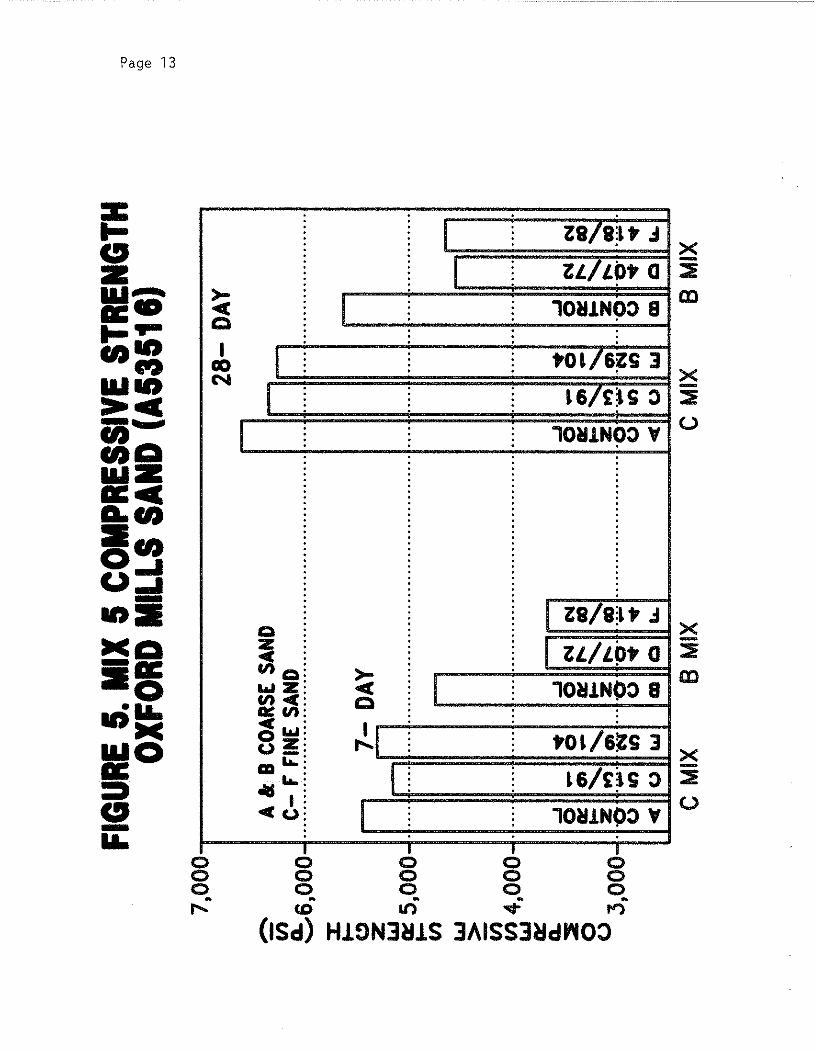
DISCUSSION OF RESULTS
The test results are shown graphically in Figures 1 through 5.
The trend for most of the sands was:
1. The fine sand produced lower strength mixes.
2. Adding 5 percent cement and fly ash to the fine sand mixes
increased the strength.
With the Shenandoah sand this trend did not exist. The strength
was consistently higher when the fine sand was used in place of
the concrete sand. The results would be consistent with the data
obtained from the mortar strength testing on the sand. The mortar
strength changed little despite the changed gradation. Figures 1
through 5 also indicate that the B mix is more noticeably affected
by the change in sand gradation.
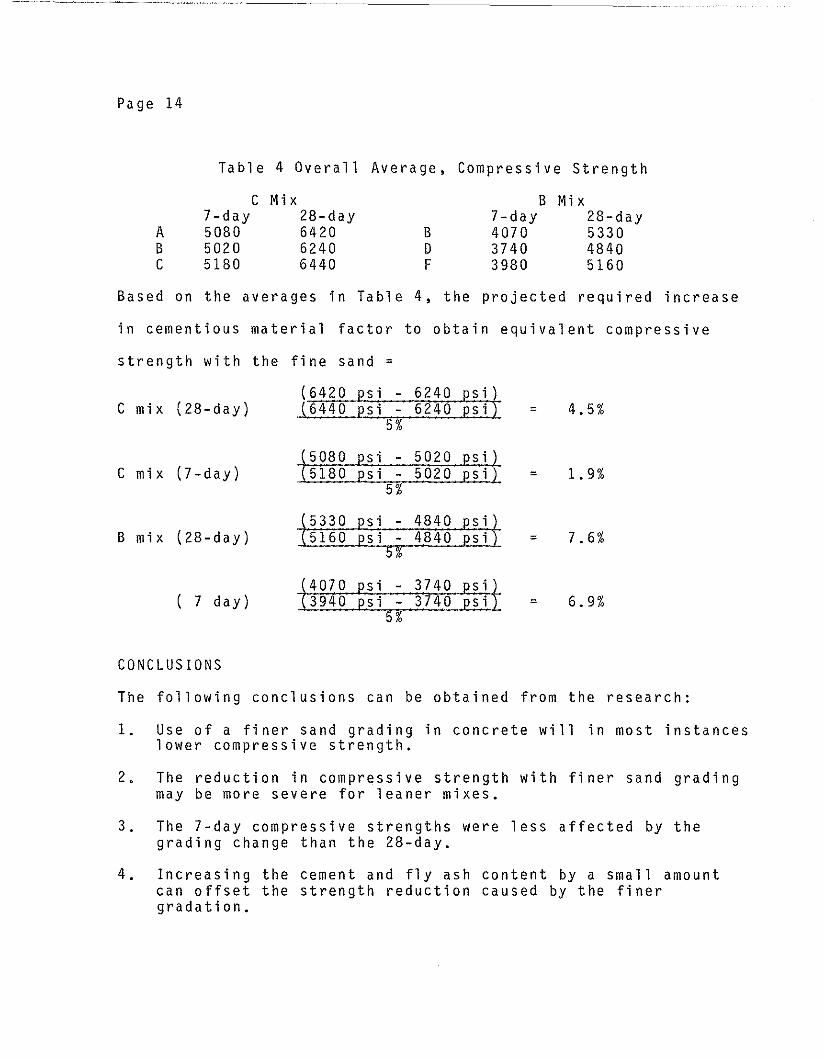
Table 4 shows the overall averages for the six different mix
types. The difference between the C mix with coarse sand and the
C mix with fine sand is 180 psi at 28 days. A statistical signif
cance test was performed assuming normal distribution and standard
deviations of 300 psi. A 180 psi difference in the average
strengths is significant at the 0.05 level of significance.
Page 9
:
I 1:S/Sl t .:I·: ·: 1:L/LOt a: ·>- I 10~!NOO a«
0 · ·· ·I · ·
I ~tOl/61:S 3coN · ·· · l6/£lS 0· · ·· · :
I · 10~!NOO 'f/::··· ·: :: :,
:·· · ·· :· I~ 1:S/Sl t .:I
Q% 1:L/lOt a-eCf)Q · >- II.&J% -c rtO~!NOO aCf)c( 0a::: Cf)e(l.&J I I ~ ;tOl/61:S 30% ......o_m ..... :
: L l6/£lS 0dg .....
<1(6 · I rtO~!NOO 'f/:
I I I
x~
o
x~
CD
x~
u
ooo-......
000000000- - -<0 L{) "<t'
(ISd) Hl~N3~lS 3AISS3~d"'O:>
ooo-tot")
Page 10
>-eo
cb I .N I .
I
QZ~ .en Q:..... z;en ~:0=: en:~ ..... :oz:O .
L;::m :old ..... ~__ I :-0:
I
I
~oI
......
I
.
II
: I.I
.1;9/9~l'" J X
-1;£/£0'" a ~ID
10~lN9:> 8
"'Ol/6~S 3 xl6/£~S:> ~
10~lNO:> v U
11;9/9~l'" J x1;£/4P'" a ~
. 110~lNO:> 8 ID
"'Ol/6~S 3 xl6/£~S:> ~
10~lNO:> v U.I I
0000000000o 0 0 0 0~ ~ ~ ~ n
(ISd) Hl~N3~lS 3AISS3~d"O::>

~.~._~-----
Page 11
· ·I : ~8!8l t .:I
H zc/ts» a>- · I-e · f10~lNO:> 80 ·· ·I · ·
I · ~tOl!6~S 3co :N ·
·I · · · l6!US o· ·· · ·I : 10~lNO:> 'fI· ····:
···· :·· ··: ·:
·:I ~8!8l t .:I:
Q · ·%
1 il/lOt a-eCl)Q >- I rJO~lNO:> 8..... % -eCI)~ 0G::CI)~ ..... ·
~I·
0% · ~Ol/6~S 3(,)-m .... ·· I · l6!£lS ooltS .... ·· :·~~
:
I· rJO~lNO:> 'fI·· · ·I I I
x-::ECD
x::Eo
x::ECD
X::Eo
o 0 0 0 0o 0 0 0 0o 0 0 0 0... .. "" .. ..~ ~ ~ v ~
(lSd) Hl!)N3~lS 3AISS3~d"O:>

Page 12
I · 1:S/Sl t .:I
: I~ · 1:£/£Ot 0>- : I ~O~.LNO:> 8-e ·· ·Q ··
~I· · :
: ~tOl!61:S :3·N
I ~: l6!£lS o
10~.LNO:> V··
·. :
·:
I 1:S/Sl t .:IQZ I ~ 1:£/£Ot 0-een Q >- :
~O.NO:> 8wZ : -een-c Qa:: en-C w IOz ....... I ~Ol/61:S :3u_CDL&. · H l6/ns41ISL&. : : o··-c~ · ;JO~.LNO:> V
: ·I I ,
x::Em
x-::EU
x::Em
x::EU
ooo•
"
000000000• • •CO If) V
(ISd) HH)N3~lS 3AISS3~d"OO
ooo•....,
Page 13
r ZS/Sjlt .:I
ZL/LOt 0>- :
I : · 10~lN9:> 8"'I( ·Q :
I. :
I tOl/6~S :300 . ·N
I · l6/£~S: : o·
r : 10~lNO:> y:
::
·: : :
·· I ZS/Sjlt: .:I
QZ : I ZL/LPt 0-een Q: >- :
.... z: "'I( I 10~lNO:> 8en -c: QGIl: en: :-c .... : ,!.I
: ·oz: : tOl/6~S :3u_:.... :CD : r l6/£~S o....... ~-e I: I 10~lNO:> yU:
· ·I I , I
x-:::EOJ
x-:.::eu
x-:.::eOJ
x-:::Eo
oooft
......
000 0o 0 0 0o 0 0 0ui ui ...; ri
(ISd) Hl~N3~lS 3AISS3~d"O:>
Page 14
Table 4 Overall Average, Compressive Strength
ABC
C7-day508050205180
Mix28-day642062406440
BDF
B7-day407037403980
Mix28-day533048405160
Based on the averages in Table 4, the projected required increase
in cementious material factor to obtain equivalent compressive
strength with the fine sand =
1. 9%
4.5%
=
=S 1 -(6440(6420
5%
(5080 psi - 5020 psi)(5180 psi - 5020 psi)
5%C mix (7-day)
C mix (28-day)
B mix (28-day) = 7.6%
( 7 day) 3940 = 6.9%
CONCLUSIONS
The followin9 conclusions can be obtained from the research:
1. Use of a finer sand grading in concrete will in most instanceslower compressive strength.
2. The reduction in compressive strength with finer sand gradingmay be more severe for leaner mixes.
3. The 7-day compressive strengths were less affected by thegrading change than the 28-day.
4. Increasing the cement and fly ash content by a small amountcan offset the strength reduction caused by the finergradation.
Page 15
RECOMMENDATIONS
The following recommendations are suggested.
1. Add to the specifications a class of sand that is the same as4110 sand except:
a. lower the mortar strength ratio from 1.5 to 1.3.
b. allow 45 percent instead of 40 percent passing one sieveand retained on the next.
c. Include a provision that material passing the number 30sieve shall be 25 percent or more and 60 percent or less.
The specification would read as follows:
Section 4111. Class Z Fine Aggregate for Concrete.
4111.01 DESCRIPTION. Class Z fine aggregate for concreteshall be used in mixes specifically permitting its use. Class Zfine aggregate shall meet the requirements of 4110.01 and 4110.02.
4111.02 GRADATION. Class Z fine aggregate for concrete shallmeet requirements of Section 4109 for gradation number 1. Inaddition, when the fine aggregate is sieved through the followingnumbered sieves -4, 8, 16, 30, 50 and 100 - not more than 45percent shall pass one sieve and be retained on the sieve with thenext higher number.
4111.03 MORTAR STRENGTH. Class Z fine aggregate from anapproved source shall have a historic record of mortar strength,determined by Laboratory Test Method 212, of not less than 1.3times the strength of mortar in which standard sand is used.
2. Modify Section 2301 of the specifications to allow the use offine sand with a modification to the concrete mixes. Themodified mixes should be as follows:
a . 8% more cement and fly ash for B-2 to B-5 mixes.
b. 7% more cement and fly ash for A-2 to A-5 mixes.
c . 5% more cement and fly ash for C-2 to C-5 mixesincluding water reduced mixes.
The increase in cementitious material will be one half fly ashand one half cement by weight.

Page 16
APPENDIX A
Page 17
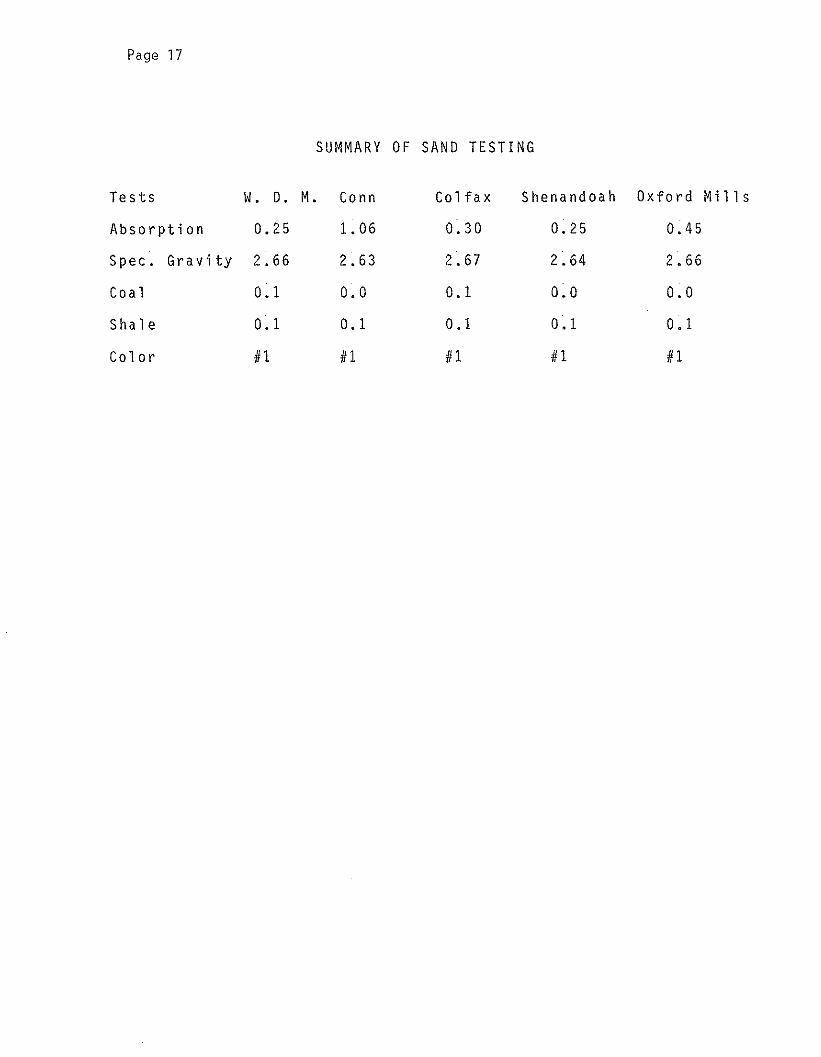
SUMMARY OF SAND TESTING
Tes ts w. D. M. Conn Colfax Shenandoah OXford Mi 11 s
Absorption 0.25 1. 06 0.30 0.25 0.45
Spec. Gravity 2.66 2.63 2.67 2.64 2.66
Coal 0.1 0.0 O. 1 0.0 0.0
Shale O. 1 O. 1 0.1 0.1 0.1
Color #1 #1 #1 #1 #1

Page 18
COARSE AGGREGATE GRADATION
Sieve Size
1"3/4"1/2"3/8"#4#200
% Passing
100774012
0.5O. 3
~ <.0-o s» <0 CD
WES
TDE
SM
OINE
SPI
TXR
DFI
NEAG
GREG
ATE
ANAL
YSES
SIE
VE
AN
AL
YS
IS1
2%
17
%2
8%
31
%1
0.
5%1
.3%
0.
2%10
0
80-1
I&..~W'~~~
I~"""W~~
CLAY
%00
.1
~6
0I
I~~
II
Inm
UMES
TONE
~~
05.7
%
UJ
..I
IIIZa
DOLO
MIT
Eu
05.8
%~
10UJ
4071
71I~
FELD
SPAR
0-70
1010
.6%
II
20-1
II
,I
,I
I,0
QUA
RTZ
77.8
%
0-1I
II
II
II
I•iii
IIii
+8
+1
6+
30
+5
0+
10
0+
20
0-2
00
SIE
VE
FR
AC
TIO
N

-c'" <0(I)
No
XRDPETROGRAPHIC
ANALYSISOF
RIVERSAND
CONNPIT
SIE
VE
AN
AL
YS
IS0%
20
%2
8%
28
%1
0.
1%1
.0%
0.
3%10080-1
111II1II1ImlllWff/Zl'~~~W'~~AJI88
8:fJ%
~60
I~$AJJY~
II
IIllIU
MESTO
NE
W~
11.2%
UJIr§l~
II
_~~g~~MITE
ull::~401~~~
I72
I72
I••~~
FELDSPAR
13.1%
20-1r
1I"
II
II
IDQ
UARTZaa
52.7%22
I21
II
0.
..
..
..
.+
8+
16+
30+
50+
100+
200-2
00
SIE
VE
FR
AC
TIO
N
-0 s» co ro N ~
COLF
AXPI
TXR
DFI
NEAG
GRE
GAT
EAN
ALYS
ESS
IEV
EA
NA
LY
SIS
13
%1
4%
zsx
35
%1
1.
3%0
.ex
0.
1%10
0 80-1
WllIJlJ1IJJ1IWLT&'~~~~~~ff/bl188
g~J%
~60
I~~~
II
II
IllIIL
IMES
TONE
I05
.0%
UJI~
II
II
I~
DOLO
MIT
Eu
11.1
%ll:: ~
401
r»»»
>1I
1777
71~FELDSPAR
7117
17.2
%
10o
QUA
RTZ
20-1
i40
I65
.7%
01
II
II
II
II
iii
ii
!i
i
+8
+16
+30
+50
+10
0+
200
-20
0S
IEV
EF
RA
CT
ION
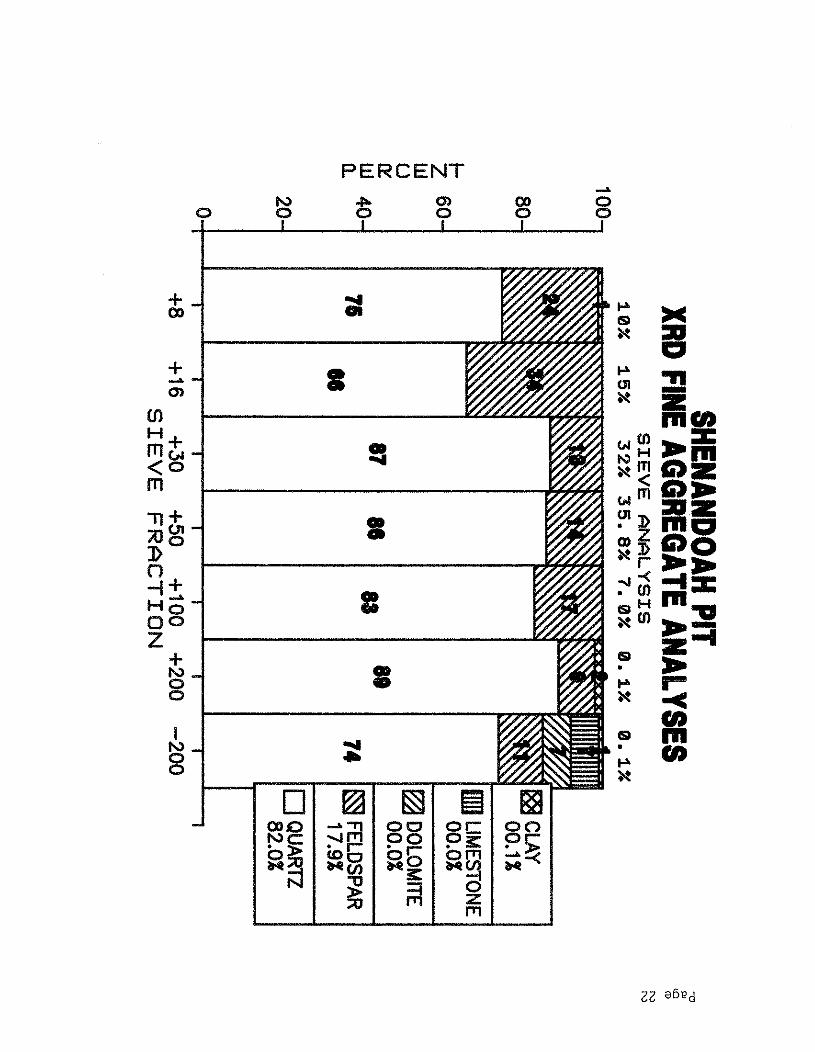
SHENANDOAHPIT
XRDFINE
AGG
REGATE
ANALYSESS
IEV
EA
NA
LY
SIS
10
%1
5%
32
%3
5.
8%7
.0%
0.
1%0
.1%
-0
'" <0CDNN
100
80
~60
wU(t:
w40
fl.
20
71II
87II
u81
I8aCLAY00.1%
moLIM
ESTONE
00.0%
~DO
LOM
ITE00.0%
74I~
FELDSPAR
17.9%
oQ
UA
RlZ
82.0%
01
'I
II
II
,,
•iii
iii
I
+8
+16
+30
+5
0+
100+
200-2
00
SIE
VE
FR
AC
TIO
N

OXFO
RDM
ILLS
PIT
XRD
FINE
AGGR
EGAT
EAN
ALYS
ESS
IEV
EA
NA
LY
SIS
11
%1
5%
31
%3
3.
4%8
.8%
0.
5%0
.3%
-o '"<0 '" N W
100 80
~60
W U 0:: W
40a,
20
1772
8184
8781
I8SCL
AY00
.6%
P""
'»:J
IIIllL
IMES
TONE
03.6
%
r2aDO
LOM
ITE
02.4
%
~FELDSPAR
14I
10.7
%
oQ
UART
Z82
.7%
01
II
II
II
II
ii
jiii
ii
+8
+16
+30
+50
+10
0+
200
-20
0S
IEV
EF
RA
CT
ION

Page 24
APPENDIX B

Page 25
A
Study of
Fine Sand From Nine Mile Island
At Dubuque
Kevin Jones
Cement and Concrete Engineer
May, 1988
8
Page 26
INTRODUCTION
The specifications for concrete sand in Iowa have been used formany years with very good results. In several locations of thestate, it is becoming more difficult to produce concrete sandconsistently at a reasonable cost. Both ASTM and AASHTO havespecifications for concrete sands that allow a finer, poorergraded sand than the Iowa specification. The ASTM and AASHTOspecifications are based on the use of trial mix testing priorto construction. Iowa does not currently use the trial mixprocedure.
Changes in the gradation requirements for concrete sand in Iowaare shown in table 1. The specification published in the I948"Standard Specifications for Highway and Bridge Construction"were quite different from the previous specifications.The major changes were:
1. Limit the gradation so that not more than 40 percent shallpass one sieve and be retained on the sieve with the nexthigher number.
2. Increase the mortar cube strength ratio to 1.5.
3. Eliminate the option of designing special mixes using sandfailing to meet cube strength or gradation requirements.
4. Adopt a #200 sieve requirement of 0 to 2.5% passing.
The changes sinc~ 1948 have been to reduce the percent passingthe #200 sieve and open up the gradation requirements on theother sieves. Otherwise, little change has been made in the lastforty years.

Page 27
Table 1. Gradation Changes to Concrete Sand Specificationsfrom 1924 to 1988
Percent Passing
1924a 1930a 1937a 1948e 1960e 1977e
3/8" 100 100 100 100 100 100#4 95-100 95-100 95-100 95-100 95"100 95-100#8 85-100 80-100 80- 95 75- 95 75-100 70-100#16#30 15-40 15-40 20-40 20-55#50#100 0-5 0-5 0- 5#200 0-2.5 0.1.5 0-1.5
Mortar cStrengthRati 0 LOb 1. Od 1. Od 1. 5f 1.5 1.5
a. Sand failing gradation may be used if mortar strength is adequate.
b. Sand with a mortar strength ratio of between 1.0 and 0.75 due to poorgrading may be used provided that the cement is increased to meet minimumcompressive strength on concrete made with the project aggregates.
c. The proportions and testing of mortar cubes changed in the 1940's.
d. Sand which fails mortar strength due to poor grading may be used inspecial mixtures-designed by laboratory studies.
e. When fine aggregate is sieved through the following numbered sieves: 4,8, 16, 30, 50 and 100, not more than 40 percent shall pass one sieve andbe retained on the next higher number.
f. Sand which has shown satisfactory mortar strength may be accepted withoutfurther mortar strength tests so long as its fineness modulus is not lessthan that of the sand from that source which showed a satisfactory mortarstrength minus 0.30.
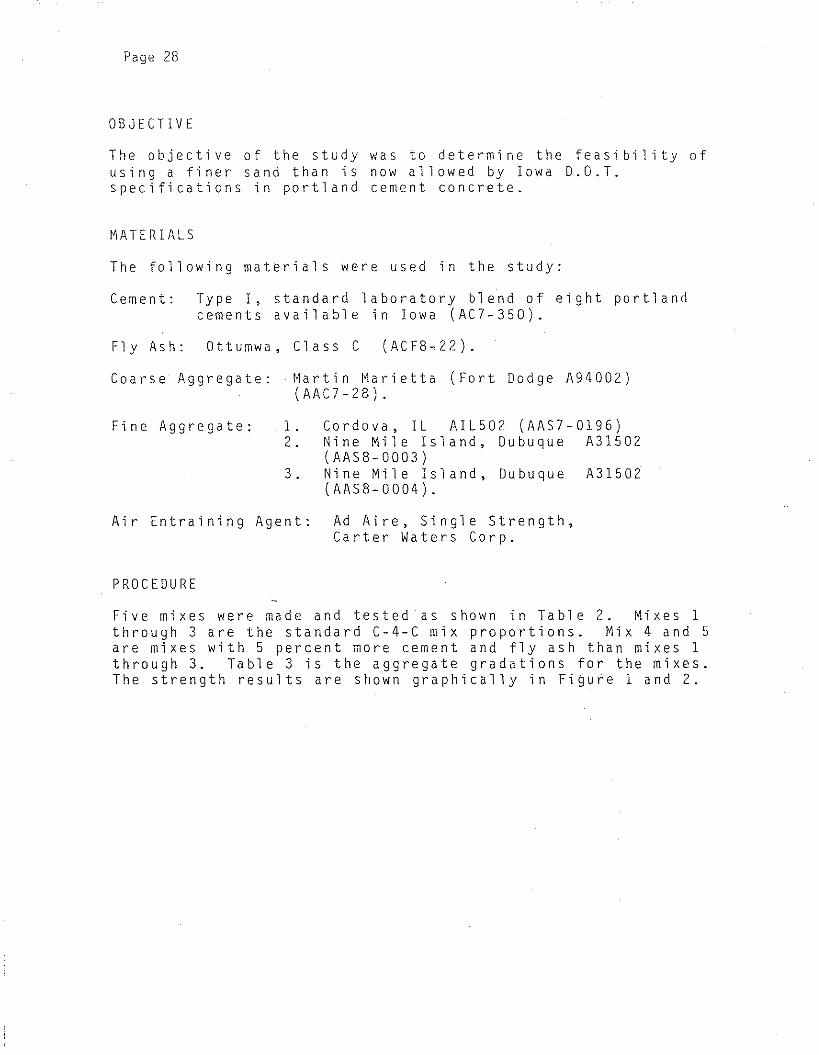
Page 28
OBJECTIVE
The objective of the study was to determine the feasibility ofusing a finer sand than is now allowed by Iowa D.O.T.specifications in portland cement concrete.
MATERIALS
The following materials were used in the study:
Cement: Type I, standard laboratory blend of eight portlandcements available in Iowa (AC7-350).
Fly Ash: Ottumwa, Class C (ACF8-22).
Coarse Aggregate: Martin Marietta (Fort Dodge A94002)(AAC7-28).
Fine Aggregate: 1. Cordova, IL AIL502 (AAS7-D196)2. Nine Mile Island, Dubuque A31502
(AAS8-0003)3. Nine Mile Island, Dubuque A31502
(AAS8-0004).
Air Entraining Agent: Ad Aire, Single Strength,Carter Waters Corp.
PROCEDURE
Five mixes were made and tested as shown in Table 2. Mixes 1through 3 are the standard C-4-C mix proportions. Mix 4 and 5are mixes with 5 percent more cement and fly ash than mixes 1through 3. Table 3 is the aggregate gradations for the mixes.The strength results are shown graphically in Figure 1 and 2.

-0
TABL
E2
MIX
RESU
LTS
'"<D fi) N <.0
Air
Str
engt
h(P
SI)
Mix
Sand
Cem
ent
Fly
Ash
W/C
+C
onte
ntSl
ump
Com
pres
sive
Fle
xura
lN
o.#/
Yd.
3II
/Yd.
3F.
A.
%(I
n.)
7D
ay28
Day
7D
ay28
Day
1D
ubuq
ueFi
ne52
995
0.38
06.
51.
2550
5062
5074
079
0I
2D
ubuq
ueC
oars
e52
995
0.37
66.
21.
055
7064
8078
084
0
3C
ordo
va52
995
0.37
26.
51.
2554
2070
6079
088
0
4D
ubuq
ueFi
ne55
610
00.
363
6.0
1.25
5370
6450
840
850
5D
Ubu
que
Coa
rse
556
100
0.36
76.
01.
2555
0063
6083
085
0

Page 30
TABU 3 AGGREGATE GRADATONS
(Percent Passing)
Sieve No. Nine Mile Island Nine I~ile Island Cordova Fort DodgeFine Coarse Coarse Aggr.
1" 1003/4" 771/2" 403/8" 100 100 100 12#4 99 94 99 0.5#8 93 75 93 0.3#16 81 60 79#30 58 47 44#50 12 18 8.5#100 0.6 2.3 1.0#200 0.3 0.8 0.2
Fineness Modulus 2.56 3.04 2.75Mortar Stren9thRatio 1.4 1.3 1.6
Combined Grading (Percent Pas s inq )
1" 100 100 1003/4" 88 88 881/2" 70 70 703/8" 5.6 56 56#4 50 47 50#8 47 38 47#16 41 30 40#30 29 24 22#50 6.2 9.2 4.4#100 0.4 1.3 0.6#200 0.3 0.6 0.2
Fineness Modulus 4.82 5.06 4.92Specific Surface(Sq. Ft./Lb.) 14.9 14.2 13.4
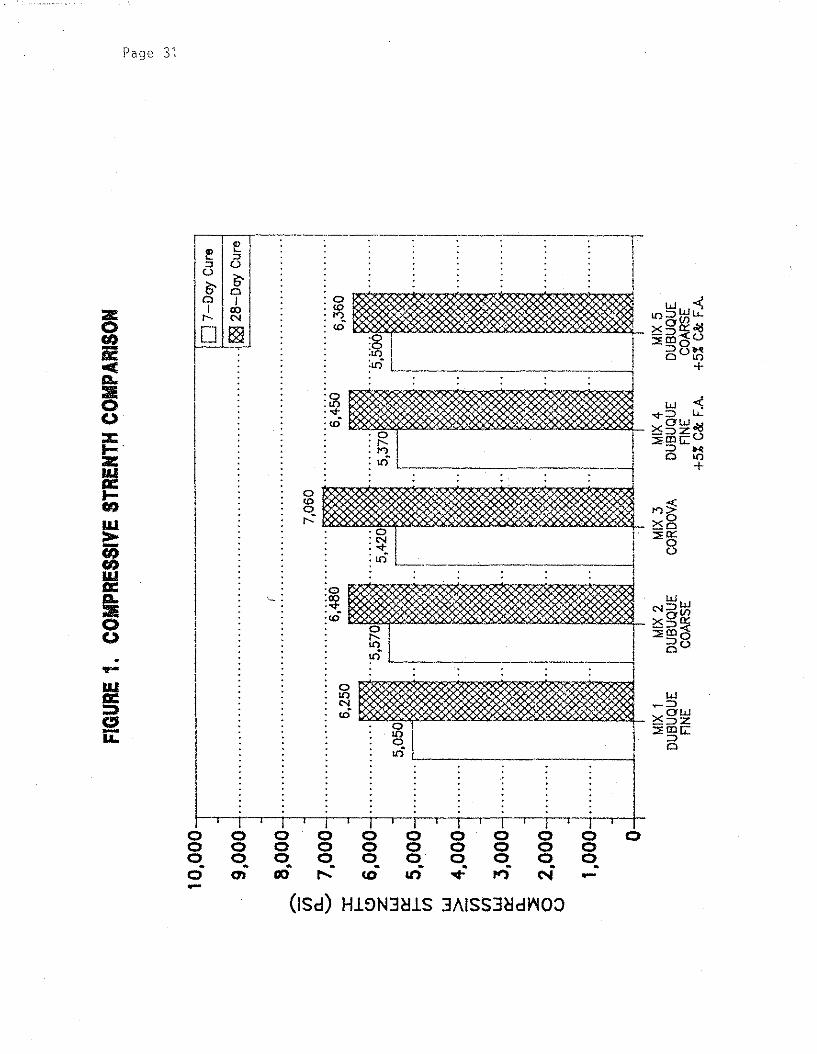
FIGU
RE1.
COM
PRES
SIVE
STRE
NTH
COM
PARI
SON
V Q>
<D ro w ~
r-: i
"1I 1_1~~4
MIX
5DU
BUQU
ECO
ARSE
+5%
C&F
A
....
...
5,37
0
I --- MIX
4DU
BUQU
EFl
NE
+5%
C&
FA
MIX
3CO
RDOV
A
waL__
mJ
i~"
..I~"
I "I~I
MIX
2DU
BUQU
ECO
ARSE
....
....
...r
····
····
····
····
····
····
····
····
····
····
····
····
····
····
····
···1
I7,
060
I~
..··
····
····
····
..··
····
····
····
····
····
····
I...
.....6
;48'0
......
....Q
9\iQ
Q1
6,45
06,
360
;;50'1
1
~...
......
I
IH1
1 07
-Dcr;
Cur
e
....
....
....
....
....
....
....
....
....
....
....
....
....
..'1
sg28
-DO
)'C
ure
I
I I I J
--~~._~
_._-
----
-
MIX
1DU
BUQU
EFl
NE
_.
-1
-..
....
....
....
....
....
...
J-
....
....
....
....
..,..
....
-I-
....
....
....
....
....
....
.
-6,
250
J-
......
......
....~
-5,
050
1-
......
...~--
"J-
....
....
.m..
-1
-..
....
-...
..
-1
-...
.....
·1..
- -..
....
...
..
4,00
0
3,00
0
5,00
0
2,00
0
1,00
0 o
:c fo-~
6,00
0w 0:
:f0
U
l
W ~ Ul
Ul
W 0:: a. ~ o o
10.0
00
9,00
0
8,00
0.....
....U
l
~7,
000
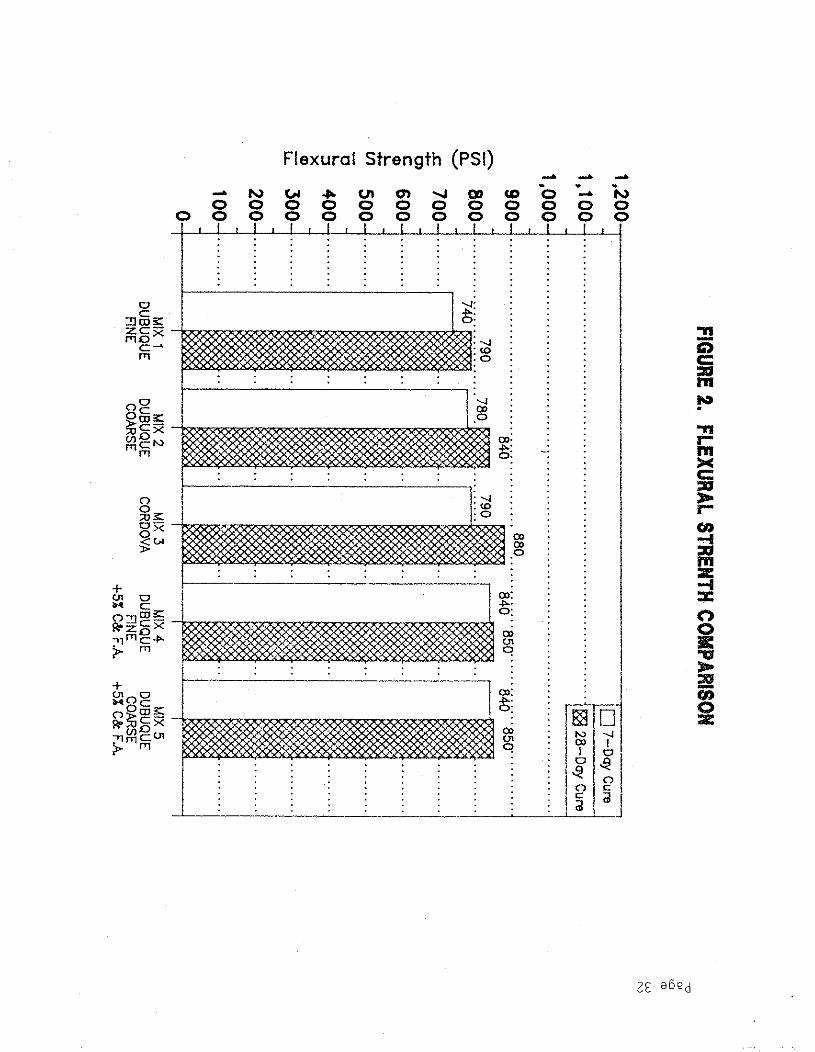
FIGURE2.
FLEXURALSTRENTH
COMPARISON
:·~~~r~
=~:~~~c~:e
..
-oC>
<0rowN
~""""'!
KX
XX
XJ···
......
~.........
m::.·:·::·
.__L~
11 ·'1--1·........
••I
.
:
II..~
..
·J~::f~"·r
--300~····"·,,
200~·
..······
500~
....·....
100~·········
01
I~I~-
o5400~
......"·xCD
u...
,...."
MIX
1DUBUQUE
FINE
MIX
2DUBUQUECOARSE
MIX
3CORDOVA
MIX
<4DUBUQUE
FlNE
+5%C&:
FA
MIX
5DUBUQUECOARSE
+5%C&:
FA
Page 33
TEST RESULTS
The fine sand from Dubuque tested about 5 percent lower onstrength in the C-4-C mix than the coarse sand from Dubuque.The hi gher cement factor mi x with the fi ne sand compared veryfavorably with the C-4-C mix and coarse sand. Strengths for thehigher cement factor mix and fine sand were within 30 psi on the28-day compressive and 10 psi on the 28-day flexural of those forthe standard C-4-C mix with coarse Dubuque sand.
Results on the higher cement factor mix and coarse Dubuque sandwere different than expected. The mixes were repeated and thesame result of no strength increase with the higher cement andfly ash content occurred. In order to realize a strengthdifference, the water to cement ratio (w/c) would normally needto go down. The reduction in wlc for the coarse sand was abouthal f that of the fine sand mix.
Results on the mix with Cordova Mississippi sand were asexpected. The fineness modulus of the Cordova sand was betweenthat of the two Dubuque sands. Because the Cordova sand had lessmaterial passing the #30 through #200 sieves, the surface area ofthe aggregate was less which contributed to a slightly lower wlcratio. The 28-day compressive strength was 580 psi higher thanany of the other mixes.
SUMMARY
Aggregate shape, texture and grading do have an affect onconcrete strength and workability. The thrust of the study hasbeen to look at the affect of fine aggregate gradation on theconcrete strength~ A lower compressive and flexural strength wasobserved at both 7 and 28 days for the C-4-C mix with finer,poorer graded sand. To reduce the water cement ratio and offsetthe affects of the fine sand, more cement and fly ash were addedto the mix. Five percent of additional cement and fly ash wassufficient to increase the strength of the mix to what the C-4-Cmix was with a coarser sand.
RECOMMENDATIONS
From the limited study it appears that finer concrete sands mayhave application in Iowa provided that adjustments to theconcrete mixes are made. Based on this study, the following workshould be done:
1. Perform tests on at least five other sources of sandrepresentative of sands available from around the state.
2. Examine the effect of silt and organic matter on mortar cubestrengths and concrete strengths with finer sand.
3. Formulate specifications and mix designs to provide concretemixes using finer concrete sand comparable in quality to thecurrent concrete mix designs and specifications.


