
2017 Job Seeker Nation StudyFinding the Fault Lines in the American Workforce

1
IntroductionIf the past year taught us anything, it’s that we live in a divided nation. In fact, nearly 80% of Americans — an all-time high — believe the country is split in two. With this year’s Jobseeker Nation Survey of 2,000 Americans, we sought to define that split: who are the two groups and what does the job seeking experience look like for each?
The answer surprised us: ‘Divided America’ is a myth.
Sure, from 30,000 feet you see Blue vs. Red. Coast vs. Coast. But dig a couple layers deeper and you don’t find a neatly divided population. That’s a misleading oversimplification. What we found is many different versions of the American job seeker.
This year’s survey seeks to define those diverse American job seeker experiences. It examines in more depth than ever before the ways people find, secure, and experience work.

2
Shades of the American JobseekerToday’s job seeker experience in the U.S. is fractured. The following survey findings highlight the contrasts that make up today’s workforce.

3
The Country: Coasts vs. Middle America
Westerners are more
aggressive about salary than friendly
Midwesterners.
36% of
westerners negotiate salaries while only 25% in
the Midwest do.
21% of West
coast workers negotiated benefits compared to 11%
in Midwest.
21% in
the West coast used counter offers to negotiate higher
salary while only 12% Midwesterners
did.
55% of
Easterners make more money than their
parents make/made pre-retirement, compared
to 39% in the South and 40% in the
Midwest.
East Coasters
are more likely to make more
than their parents, but are most
scared of losing their jobs.
Southerners are the most
optimistic about the next four years – 43% believe job prospects
will be better, 10% higher than other
regions.
The South is
hurting the most… but holding out
hope.
Southerners have the
bleakest view of the job market – 50% feel that it is harder to find
a job compared to last year.
East Coast
workers are the most afraid of losing a job within
the next year (29%).

4
Women don’t like negotiating — and when they do, they get less money.
56% of men feel comfortable negotiating vs. 38% of women.
At their current or most recent job, 26% of women negotiated vs. 32% of men.
87% of men say negotiation resulted in higher pay, while 80% of women said the same.
Women vs. Men: Money at the Center of the Debate
When it comes to salary, women feel slighted.
27% of women think men are paid more for the same quality of work — while just 15% of men share that opinion.

5
Racial Disparities Persist In salary:
Non-whites are more likely to have to use a competing job offer to secure a satisfactory salary:
African- American
Latino
Asian
White
In diversity:
Non-whites are more likely to rank diversity in the workplace as “very important”:
African- American
Latino
Asian
White
Non-whites are more likely to say it’s “very” or “somewhat important” their company makes an effort to hire immigrants:
African- American
Latino
Asian
White
In what we fear:
Latinos and African-Americans are more likely to think immigrants pose a threat to their jobs:
African- American
Latino
Asian
White
19% 13%56%
60%
23% 16%43%
53%
12% 10%27%
37%
23% 9%30%
66%

6
Is Diversity Important? Depends On Who You Ask
Battle of the sexes.
of men believe that men and
women are paid the same amount for the same work — while just 54% of women say the same.
Put another way:
Women are 82% more likely to
believe that men are paid more for the same work.
While 80% of job seekers believe their employer fosters diversity at work, we don’t all agree on how important it is.
of job seekers rated diversity in the workplace as very important — 18% say it’s not too important.
Here’s who ranked workplace diversity as “very important”:
African American
Hispanic
Women
Asian / Pacific Islander
Men
White
60%
29%
43%
27%
36%
32%
32% 69%
82%

7
Millennials vs. Older Workers: Threatened by the Future, Motivated by Passion
Young people are more scared their jobs will be automated in the next five years.
21% are concerned compared to 8% of older workers.
But they’re motivated by passion.
Older and younger workers are equally likely to have a second source of income, but younger workers are more
likely (33% vs. 17%) to pursue this second income as part of a passion project.
33% of both younger and older workers are ready to take a pay cut of 10% in order to pursue careers they are more passionate about.

8
Parents and the Unemployed: Two Groups Most Worried About the Future
More than half of all parents (51%) believe the job market this year is worse than last year.
Parents are more afraid than non-parents that they or members of their family will lose a job in the next year:
They are more concerned their jobs will be automated in the next five years:
They feel more threatened by Generation Z:
Unemployed people are worried about being replaced.
Unemployed workers are less confident that automation won’t be a threat to them in the next five years:
66% of unemployed people said they are certain their job won’t be automated in the next five years whereas 78% of employed people said the same.
Unemployed workers looking for jobs feel more threatened by Generation Z:
33% are very or somewhat threatened compared to 22% of employed workers.
27%
20%
28%
21%
11%
19%
9
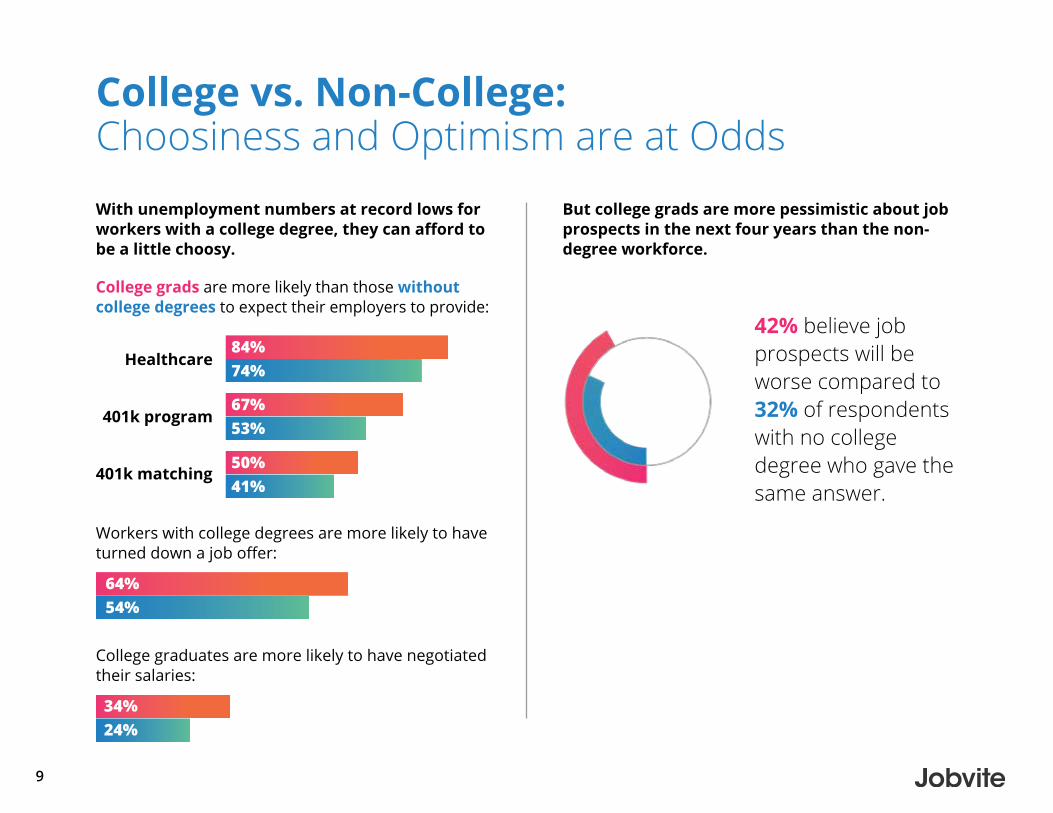
College vs. Non-College: Choosiness and Optimism are at OddsWith unemployment numbers at record lows for workers with a college degree, they can afford to be a little choosy.
College grads are more likely than those without college degrees to expect their employers to provide:
Healthcare
401k program
401k matching
Workers with college degrees are more likely to have turned down a job offer:
College graduates are more likely to have negotiated their salaries:
But college grads are more pessimistic about job prospects in the next four years than the non-degree workforce.
42% believe job prospects will be worse compared to 32% of respondents with no college degree who gave the same answer.
64%
84%
67%
50%
34%
54%
74%
53%
41%
24%

10
High vs. Low Earners: High Expectations, Low Loyalty
High-earning workers are more likely than low earners to expect.
401k matching
401k program
Remote work
Healthcare
Parental leave
High earners tend to check their email after hours more frequently:
Low earners are less loyal to their employers.
16% of high earners change jobs every 1-3 years compared to 28% of low-earning workers who do the same.
51%
66%
17%
82%
28%
48%
38%
53%
7%
75%
22%
41%

11
Rural vs. Urban: Job Hopping Divides the Group
Rural workers are more optimistic despite earning less than their urban counterparts.
40% expect the job market to get better compared to 35% of urban workers.
Rural workers are also less concerned their jobs will be automated in the next five years:
86% say they are not concerned compared to 75% of urban workers.
Urban workers are job hoppers looking for the next best thing.
50% of rural workers stay at a job for more than 10 years compared to 37% of those in a city.
City workers more often pursue job opportunities without the intention of leaving their current post:
64% of rural workers have never done that, compared to 49% of city workers.

12
The Workforce as a WholeWhile we are a country divided in pieces, there are still issues that unite us. The following findings examine the ways larger groups agree — and disagree — on work.

13
Is Trump Good for Jobs? No One AgreesThe country is split on how the new president will impact jobs in the next four years.
37% of job seekers think job prospects will be worse in the coming years in light of the presidential administration — while 35% think they’ll be better.
What’s the breakdown?
Women and men can’t agree:
Men feel more confident than women about Trump — 41% of males think job prospects will be better, while just 29% of females agree.
Gen Z and Baby Boomers have opposite opinions too:
Only 19% of younger workers (18-22) believe that job prospects will improve under Trump — but 45% of older workers (55+) do.
35%37%
Worse Better

14
In 2017, It’s Still Not Easy to Find a Job
46% of job seekers say it was harder to find a job than last year.
It was “much harder” for those in:
Mining
Real estate
Construction
Services
And:
African Americans
People who make less than $25K
But 15% said finding a job is easier this year than last.
It was “easier” for those in:
Large cities
High-skilled industries:
Telecommunications
Finance
Technology
And:
People who make more than $300K
57% 18%
30%
30%
28%25%
22%23%
18%
27%34%

15
Talk of the Robot Apocalypse is OverblownPeople feel more threatened by each other than by machines.
Today’s job seekers are more afraid of Generation Z and their entrance into the workforce than they are of immigrants: nearly 1 in 4 feel at least slightly threatened by Gen Z vs. 1 in 10 by immigrants.
Young workers in particular are afraid of their slightly younger peers:
18-22 year olds
55+ year olds
Those who work in the following industries are most likely to perceive immigrants as a threat to their jobs:
What are job seekers less worried about?
Only 15% of people are concerned
their job will be automated within 5 years.
But 30% of people in the tech
industry fear automation.
15%
30%
27%
27%
58%
19%
20%
Construction
Mining
Hospitality

16
Welcome to the Age of the “Hyper-Hopper”Job hopping is accelerating, with almost half of job seekers changing jobs at least every 5 years.
42% of job seekers job hop every 1 to 5 years, compared to 34% last year.
However, almost 70% of job seekers over age 55 stay at a job for more than 10 years (compared to just 14% of millennials 23-29).
Hyper-hoppers (n): Job seekers who change jobs every 1-3 years.
That includes:
• Single people (33%)
• Millennials (46%)
• People who make less than $25k (42%)
• People who work in hospitality (29%) and comms (32%)

17
Job Satisfaction is Down, Job Browsing is UpJob seekers are not as happy as they used to be.
In 2017, more than half of job seekers are satisfied at work (64%) — but 82% of them are open to new job opportunities.
In contrast, in 2016, 74% were satisfied and 74% were open.

18
Job Seekers Want to Understand Their Value
of job seekers had at least one interview in the last year to explore options or get experience — with no intention of leaving their current jobs.
For younger workers, pursuing 1-2 positions a year to sample their options was common:
Younger
Same with:
Single people
Communications
Technology
Real estate
The older you get, the less you sample.
Older workers were more content with what they have: just 30% of workers over 55 sampled any positions.
30%50%
40%
59%
49%
41%
40%

19
The Cover Letter is DeadCover letters are losing footing in the modern job seeker’s repertoire.
47% of job seekers did not submit a cover letter with their current or most recent job application.
Younger and older workers particularly eschew tradition: 58% of both 18-22 year olds and 55+ year olds decided to forego the cover letter.
According to Jobvite data, only 26% of recruiters consider cover letters important in their decision to hire an applicant. 26%
58%

20
Job Boards are — Referrals are 60% of job seekers have referred someone to work at their company.
Almost 35% of job seekers applied to their current or most recent position via referral — especially millennials.
Luckily, Jobvite data shows that referred applicants are 5 times more likely than average to be hired, and 15 times more likely to be hired than applicants from a job board.
According to Jobvite data, Job boards have a .4% effectiveness and employee referrals have 5.2% effectiveness. In other words, an applicant has over 13X a better chance of getting the job than applying through a job board.
Quality control.
34%
of recruiters consider referrals their best source of hires, according to Jobvite’s Recruiter Nation Study.
5x13x
35%

21
For Younger Job Seekers, Instagram Eclipses LinkedInYounger workers are more than twice as likely to research companies via Instagram.
Facebook and LinkedIn still reign supreme when it comes to researching prospective companies:
But Instagram provides an important window into company culture and workplace life:
of 18-29 year olds use the photo sharing network to preview companies they are interested in.
25%
23%
28%

22
From the Job Seeker PerspectiveWhether it’s about perks that actually impact their decision to sign or how to balance work and life, job seekers are spilling what matters most to them.

23
Negotiating Your Salary Works - So Do ItOnly 29% of job seekers negotiated their salary at their current or most recent job — 48% still don’t feel comfortable doing it at all.
Almost half (48%) of job seekers received an initial salary offer on par with what they expected from their current or most recent job.
Men are significantly more comfortable negotiating salary than women:
Workers who make more are more likely to negotiate:
<$25K
$200-300K
How well does it work?
of job seekers negotiated salaries for higher pay.
And for a fifth of them, that was 11-20% higher.
56%
21%
38%
49%
84%

24
Job Seekers Willing to Sacrifice to Follow Their Bliss
Almost half (48%) of job seekers would be willing to take at least a 10% pay cut to work at a job they’re more interested in and passionate about.
10% of younger workers would take a 50% pay decrease, along with 15% of tech workers. And 26% of them pursue secondary jobs because they’re passionate about them.

25
Perks are Nice, But Healthcare is BetterWhen it comes down to signing an offer, the modern job seeker cares less about intangibles.
Healthcare
401k program
401k matching
Bonuses + stipends
Casual dress code
Parental leave
M - 18% W - 35%
When asked their reason for turning down a job offer, only 13% said company culture — 23% cited their commute as a major obstacle and 42% said salary.
What’s less important?
Food
Volunteer time
Pet-friendly office
79%
33%
60%
26%
46%
39%
10%7%4%
Job seekers expect the following from their employers:

26
Parental Leave is a LuxuryJust 20% of job seekers have taken, or plan to take, parental leave.
The ones who did:
took 6-12 weeks:
Men - 19% Women - 53%
But 23% took less than 2 weeks.
The ones who will:
Highly educated
With college
Without
High earning
$25-50K
$300K
Gender
Women
Men
The ones who won’t:
cite workload as the primary reason for not taking time off — followed by cost (31%) and a lack of company policy (23%).
38%
23%
32%
24%
13%
25%
16%
35%
17%

27
Today’s Worker is Always On45% of job seekers check their work email after hours every day — many at the request of their employers.
.
Daily
Weekly
Monthly
Never
of job seekers feel at least a bit encouraged by their employers to check email after hours.
Young people feel the pressure.
Young professionals (23-29) were most likely of any age group to check email after hours every day, with 51% reporting they do.
39%
45%
30%
19%
36%6%
$300K+ salary 70%
Real estate 85%

28
As Hours Increase, Boundaries DecreaseThe modern workplace is a casual one.
Workers have done, experienced, or seen the following at the office in the last year.
33%
22%
14%
28%
20%
12%
7%
36%22%
Painted their nails
Stayed in the office past midnight
Worked on another job
Sworn in front of a higher-up
Left dirty dishes for someone else to clean
Come to work hungover
Exercised during the work day
Bad mouthed a co-worker

29
All Work and No PlayA quarter of job seekers have a second source of income outside of the regular 9-to-5 — mostly because they have to.
Over half need the money (54%) — particularly women (61%) compared to men (48%).
Freelance work
Babysitting
Dog sitting
Driving for a ride-sharing service
Etsy shop
35%
7%
11%
7%
36%11%
Tech industry
76%
Men 41%,
women 27%
Workers with
children at home 12%
Ride-sharing is
most common in the West (19%
compared to 5% in other
regions)

30
At the Office, Relationships Are Made (and Broken)
All’s well that ends well? Not for everyone.
of men report that their workplace
relationship ended amicably.
of women say the same.
of workers consider themselves friends with coworkers — and a quarter have been romantically involved.
Romance ‘Round the the States:
Office romances
are most likely to succeed in the
West (47% are still together!).
But in the South, 18%
of work-fueled relationships
end badly.
of office relationships are still together.
80%
42%
46%
38%
Congrats!

31
I Quit! Here’s WhyFor job seekers who left a job in the past year, salary and professional development were key factors in their departure.
30% of all job seekers cited salary as the main reason they left their job, but younger workers have different priorities.
Growth opportunities:
All job seekers
23-29 year-olds
Work-life balance:
All job seekers
People in their 30s
18-22 year-olds
Location:
All job seekers
18-22 year-olds
Men and women have different priorities.
Left their job for growth opportunities:
Left their job because of work-life balance:
11%
18%
17%
14%
14%
11%
16%
18%
18%
21%
23%

32
Summary — The Fault Lines of America, and What Brings Us TogetherThis year’s survey illuminates the different shades of the adaptable American job seeker and how the workforce as a whole is changing.
The job seeker experience is multifaceted — and defies stereotypes:
• Rural workers are more optimistic about the next four years than urban ones — 40% expect the job market to get better.
• Workers with college degrees are more likely to have turned down a job offer (64%) than those without (54%).
• Younger workers are more concerned that their jobs will be automated (21%) than older ones (8%).
Today’s job seeker is always working — which means more $ and less boundaries:
• 45% check their work email after hours every day.
• A quarter have a second source of income outside their primary source of cash — 54% of them because they need the money.
• 80% of workers consider themselves friends with coworkers and ¼ have been romantically involved.
We’ve entered the age of job sampling:
• More than half are satisfied at work (64%) — but 81% of them are open to new job opportunities.
• 50% had at least one interview this year to explore options — with no intention of leaving their current position.

33
About the Study
On behalf of Jobvite, Zogby Analytics conducted a nationwide online survey of 2,287 adults (aged 18+), of whom 1,531 were participants in the U.S. labor force. Participants were screened based on their employment situation and attitude toward future career opportunities.
The survey included questions on current employment status, future career opportunities and workplace dynamics. The survey was fielded during March 2017. Respondents for this survey were invited to participate in this interactive survey at random. Using information based on census data, voter registration figures, CIA fact books and exit polls, complex weighting techniques were used to best represent the demographics of the population being surveyed.

Jobvite is the industry leader in recruiting software that helps emerging, mid-market, and enterprise companies hire top talent easily, efficiently, and effectively. Our comprehensive and analytics-driven recruiting platform accelerates recruiting with an easy-to-use Applicant Tracking System (ATS), social recruiting capabilities, mobile-optimized branded career sites, a recruiting branding solution, on-demand video screening, advanced analytics, onboarding, and seamless integration with other HR systems. Focused exclusively on recruiting software since 2006, with offices in San Mateo and London, Jobvite has thousands of customers including LinkedIn, Schneider Electric, Premise Health, Zappos.com, and Blizzard Entertainment. To learn more & request a free demo, visit www.jobvite.com or follow us @Jobvite.
CONNECT WITH US
www.jobvite.com
www.facebook.com/jobvite
www.twitter.com/jobvite
www.linkedin.com/company/jobvite
650-376-7200


