
0
Financial performance management of Access Engineering PLC

1
Table of Contents
Executive summary …………………………………………………………………………. 2
1.0 Company background …………………………………………………………………… 3
2.0 Financial performance …………………………………………………………………... 4
3.0 Ratio Analysis ………………………………………………………………………….... 5
3.1 Operating profit margin …………………………………………………………. 5
3.2 Return on capital employed ……………………………………………………... 6
3.3 Asset turnover …………………………………………………………………… 8
3.4 Gearing ratio……………………………………………………………………… 9
3.5 Interest cover …………………………………………………………………… 10
3.6 Price earnings ratio ……………………………………………………………... 11
4.0 How to fund to purchase the assets which represents 25% of Net assets employed…… 13
4.1 Internal sources ………………………………………………………………… 13
4.1.1 Retained profit……………………………………………………… 13
4.1.2 Sales of fixed assets………………………………………………… 14
4.2 External sources ………………………………………………………………... 15
4.2.1 Equity financing …………………………………………………… 15
4.2.2 Debt financing ……………………………………………………… 16
4.3 Recommendation ………………………………………………………………. 18
5.0 Modern management accounting technique …………………………………………… 19
5.1 Balance scorecard ……………………………………………………………… 19
5.2 Lean management ……………………………………………………………... 20
5.3 Strategic management accounting……………………………………………… 21

2
Executive summary
Access Engineering PLC (AEL) is one of the leading company in the civil engineering and
construction industry of Sri Lanka which is listed in Colombo Stock Exchange. During post war
period of Sri Lanka, construction industry was boost due to major infrastructure projects which
were conducted by Sri Lankan government and also skyscraper construction, hotels and housing
projects which were driven with the growth of tourism industry.
Infrastructure was a one of the driven factor of construction industry which suffered heavily by
slowdown of sector after 2015 since new government halted some major infrastructure projects to
review of their environmental and cost impact. Further natural disasters were also negatively
impact to the construction industry during last few years. However now it is indicated that
construction industry arise again since major infrastructure projects are restarted by the
government which were halted recent past. According (Mathew, 2016) Government recommence
some high way and road development projects, water and draining systems and also government
has initiated number of rural road development projects, bridge constructions and port
development projects. Further few housing scheme projects are started targeting on city
inhabitants. And also USD 44 billion Megapolis development project is initiated which
government plan to develop 142 different projects in western province. These main infrastructure
projects are expected to significantly impact to boost the construction industry of Sri Lanka.
Development of the tourism industry helps to increase the hotels and skyscraper constructions.
Further foremost entities are trying to move to skyscrapers due to scarcity of office space in
Colombo city. Therefore Access Engineering PLC has huge opportunity to increase their market
share.
This report will comprehensively analysis the financial performance of AEL in this transition
period of 2014 and 2015.Profitability, efficiency and liquidity ratios will be used to analysis the
financial performance and position of the company. Ratio analysis of AEL will be compared with
ratio analysis of MTD Walkers PLC which is listed Colombo Stock Exchange. MTD Walker PLC
is one of main competitor of AEL. Walker was one of oldest company which was acquired by
MTD Capital, a leading Malaysian based infrastructure development company in 2006. MTD
Walkers mainly specialize in piling, highway and roads, building constructions and among other
sectors. (Annual Report, 2016)
Further this report will analysis which opportunities available for AEL for funding to purchase
land and building which represents 25% of its Net Asset Employed. Report will discuss what
internal and external sources are available, associated risk with these funding sources and finally
recommend the best option based on company performance and capital structure.
And also this report will discuss Modern Management Accounting Technique such as Balance
scorecard, Lean management and their pros and cons and how these techniques could be impact
to AEL. Finally recommendations will be given what are more suitable modern management
techniques and how those can adjust to AEL according to current commercial environment.

3
1.0 Company Background
Access Engineering PLC was established in 2001 and listed as a public limited company in
Colombo stock exchange. Access Engineering PLC has expanded its operation in property and
automobile sectors too instead of construction industry. Access Engineering PLC is recognized as
a “specialist contactor” by the National Construction Association of Sri Lanka and as a “major
contractor” by Construction Industry Development Authority (CIDA). The company gained many
international accreditations and membership such as ISO 9001.2008 accreditation for quality
management system, ISO 18001.2007 for health and safety management system and ISO
14001.2004 for environment management system. Access Engineering has awarded as “6th Asia
best employer brand award in 2015, “Best corporate citizen sustainability award (construction
sector)”, “National award for construction performance for road sector and bridge sector”,
“National award for construction excellence for building sector” in 2015 and “Chartered
Accountants annual report awards (Silver – construction sector)” and many other awards in various
categories. (Annual Report, 2016).
AEL conducts its operations in sectors such as roads and highways, bridges and flyovers, harbors
and maritime development, irrigation and land drainage water and waste water management and
pilling and building. The company is delivering services for both private and public sector, but
mainly its infrastructure operations are driven through public sector projects.
Since 2002, Access Engineering has conducted many road and highway development projects
throughout the Sri Lanka. Initially, AEL has conducted in small scale road construction projects
in rural areas. Then, the company moved to the medium scale road development projects and now
company is conducting large scale projects which project value is more than Rs 5000 million. AEL
has conducted bridge and flyover projects which exceed Rs 1000 mn. Further irrigation
development projects, water and drain management projects and maritime and port development
projects are conducted in different scale throughout the Sri Lanka.
Access Engineering PLC has also moved to building construction sector after 2011. Since then,
AEL has completed many building construction projects which build for housing schemes for
urban habitant. Now AEL is building skyscrapers for luxury apartments and office space. 1% of
AEL total revenue comes from the property segment. AEL has 100% owned entity called Access
Realtles (Pvt) Ltd which is located in center of Colombo city provides office space for commercial
entities. Construction of Access tower II that adopts to green concept is currently going on. Further
AEL invests Harbor village (pvt) Ltd in partnership with two other overseas companies.
Company vision is to be the foremost Sri Lankan business enterprise in value engineering. Mission
is to meet the challenges in the development of multi sector civil engineering projects, providing
innovative solutions while developing long term progressive relationships with all the
stakeholders. (Annual Report, 2016).

4
2.0 Financial performance
AEL revenue is increased continuously in last three financial years even though industry get
slowdown after 2015. Revenue is increased by 1% and 6% respectively in financial year 2014/15
and 2015/16 compared to previous financial year. However gross profit and gross profit margin of
financial year 2015/16 and 2014/15 is low compared to 2013/14. Gross profit has been reduced by
9% in 2014/15 and then it has been increased by 4% in 2015/16. On the other hand, net profit and
net profit margin of financial year 2015/16 and 2014/15 is lower to compare with 2013/14. Net
profit has been reduced by 16.5% in 2014/15 and it is increased by 5% in 2015/16. This financial
performance was common for all construction companies during this time since new government
appointed in early 2015, most of major infrastructure projects were halted to review their cost and
environmental impact. However AEL has performed well in financial aspects compared to other
construction companies during this adverse time period.
Table 1: financial performance of AEL
LKR million FY 2015/16 FY 2014/15 FY 2013/14
Revenue 17,624 16,514 16,373
Gross profit 3,977 3,815 4,186
Gross profit margin 22.6% 23.1% 25.5%
Net profit 2,550 2,423 2,901
Net profit margin 14.5% 14.6% 17.7%
(Source: Annual Report 2016, 2015)
Access Engineering PLC current share price is moving around Rs 26.00. Therefore current market
capitalization is around Rs 26 Billion. AEL share price as at 31st March 2014 was Rs 22.50 and it
was reached to Rs 40.00 in November 2014 then again it is fallen less than Rs 20.00 in end of
March 2015. Now share price has been settled in between Rs 24.00 and Rs 26.00.
Table 2: Share price analysis and investor ration of AEL
As at 31st March
2016
As at 01st April
2015 Change (%)
AEL share Price (Rs.) 20.80 20.40 1.96
ASPI 6,071.88 6,916.08 (12.21)
S&P SL 20 3,204.44 3,900.67 (17.85)
EPS (Rs) 2.47 2.35 5%
DPS (Rs) 0.75 1.00 (25)
Payout % 30 43 (30)
(Source: Annual report 2015/16)
AEL share price is slightly increased with in the financial year 2015/16 even though ASPI (All
share price index) and S&P SL 20 index have been reduced. According to past data of the AEL,
it is indicated that AEL dividend policy is not change much from stable dividend policy.
Currently Colombo stock exchange is performing well and AEL share price rises to Rs 26.00

5
3.0 Ratio Analysis
Ratio analysis is used to evaluate company operation and financial performances in different
aspects. This report will do basic analysis of profitability, efficiency and liquidity of AEL in 2014
and 2105 by using ratios such as
Operating profit margin
Return on capital employed
Asset turnover
Gearing
Interest cover
PE ratio
Further AEL performance will be compared with MTD Walters PLC (MTDW) performance which
is key competitor of AEL to get the better understanding of AEL.
3.1 Operating profit margin
Operating profit margin is one of profitability ratio which explain how well company’s operations
contributes for its profitability. According to (Gallagher and Andrew,2007) It is a one indication
of company’s earning ability through its operation. As an example, a company which has
considerable profit margin ratio makes more profit on each rupee of revenue than a company which
has a narrow operating profit margin. Operating profit margin determines to shareholders and
creditors how well company can generate operating cash flow.
Operating profit Margin = Operating Income × 100
Total Revenue
Table 3: operating profit margin comparison
2015/16 2014/15 Change
AEL 16.4% 16% 2.5%
MTD Walkers 7% 14% (50% )
(Source: Annual report, 2015/16)
Operating profit margin of AEL has been recorded as 16.4% and 16% respectively in 2015 and
2014 financial years. It is only increased by 2.5%. However operation profit margin of AEL is
much better compared to MTD Walkers PLC in financial year 2015/16. It is decreased by 50%
from 14% to 7%. Main reason for that would be the 15% of revenue reduction of MTDW in 2015.
On the other hand in AEL, operating profit margin has increased 2.5% while total revenue is
increased by 6% in 2015. This is better performance compared to financial year 2014/15 since
during 2014/15 revenue was just increased by 1% and operating profit margin has been reduced
by 15%.
Main reason for this performance is improvement of revenue. Main portion of revenue comes from
building construction. And also, revenue of bride construction has increased around 50% in this
period. Further other income of AEL is increased by 50%. This is also cause to increase the

6
operating profit margin of AEL. Mainly exchange rate gain of Rs 105 million, significant
improvement of sundry income and gain on disposal of investment are caused to increase the other
income.
This is indicated that AEL’s operations work effectively and generate cash flows even in negative
macro-economic environment. This is good indication to shareholders to determine how well
company can generate operating cash flow.
Table 4: working – operating profit margin
2015/ 16 (Rs Mn) 2014 / 16 (Rs Mn)
AEL = 2,889 × 100
17,624
= 16.4%
= 2,642 × 100
16,514
= 16%
WTDW = 837 × 100
11,964
= 7%
= 1,968 × 100
14,025
= 14%
(Source: Annual report 2015/16)
3.2 Return on Capital Employed
Acording to (Lumby and Jones, 2003) Return on capital employed (ROCE) is also a profitability
ratio which indicates competence of company to generate profits from its capital employed (the
total amount of capital utilized for the gaining of profit). ROCE is more reliable measure compared
to basic profit margin ratios since it provide more broad evaluation on corporate performance and
return value to investors by measuring company efficiency on utilizing its capital to operate. This
is calculated by dividing earnings before interest and tax (PBIT) from capital employed of the
company. ROCE should be higher than the rate at which company borrow to fund the assets.
ROCE = PBIT × 100
Capital employed
Capital employed = (Total Asset – Current Liabilities)
Table 5: ROCE comparison
2015/ 16 2014/ 15 Change
AEL 12.3% 15.3% (20%)
MTD Walkers 5.5% 16.6% (67%)
(Source: Annual report, 2015/16)

7
Table 6: Working – ROCE
2015/ 16 (Rs Mn) 2014 / 15 (Rs Mn)
AEL = 2,889 × 100
30,342- 6,744
= 12.3%
= 2,642 × 100
22,327 – 5,118
= 15.3%
WTDW = 837 × 100
29,003 – 13,660
= 5.5%
= 1,968 × 100
22,255 – 10,434
= 16.6%
(Source: Annual report, 2015/16)
ROCE of AEL has been reduced by 20% from 15.3% to 12.3% in financial year 2015/16. However
compared to WTDW’s ROCE, AEL has performed well since WTDW ROCE has been reduced
by 67%. But shareholders will consider this because 2013/14 AEL ROCE is 20.5%. So it is being
reduced continuously in three consecutive years. This shows that efficiency of company to
generate profit from its employed capital is reduced. One main reason for this reduction could be
slowdown the revenue growth in last two financial years. And Mainly AEL issued Rs 5,000 million
worth of debenture in 2015 and this is impact significantly to increase the liabilities.
ROCE need to be compared with the rate at which borrow to fund the assets.
Total finance cost in 2015 = Rs 369 million
Loan term loans and borrowing = Rs 5,193 million
Short term loans and borrowings= Rs 652 million
Bank overdraft = Rs 412 million
Average periodic interest rate = 369 × 100
5,193 + 652 + 412
= 6%
As per the above calculation, it is indicated that ROCE is higher than the rate which borrow the
funds. And also Sri Lanka current interest rate is moving around 8%. Therefore even though AEL
ROCE is getting reduced, overall financial performance is fine compared to competitors, interest
rate and considering debenture issue.

8
3.3 Asset turnover
According to (Gallagher and Andrew,2007) asset turnover ratio is the efficiency ratio which
measures competence of company to generate revenue from its assets. If company has higher asset
turnover ratio means that the company is gaining more revenue per rupee of asset. This ratio is
useful for shareholders to understand the efficiency of company asset utilization.
Asset turnover = Revenue
Total assets
Asset turnover ratio is more relevant to industry like construction since its revenue highly depend
on assets.
Table 6: Asset turnover comparison
2015/ 16 2014/ 15 Change
AEL 0.58 0.74 (22%)
MTD Walkers 0.41 0.63 (35%)
(Source: Annual report, 2015/16)
AEL asset turnover is reduced by 22% I from 0.74 and 0.58 financial year 2015/16 while
MTDW asset turnover ratio is reduced by 35%.
Table 7: Working – Asset turnover
2015/ 16 (Rs Mn) 2014 / 15 (Rs Mn)
AEL = 17,624
30,342
= 0.58
= 16,514
22,327
= 0.74
WTDW = 11,964
29,003
= 0.41
= 14,025
22,255
= 0.63
(Source: Annual report, 2015/16)
AEL total asset value in 2015/16 = Rs 30,342 million
AEL total asset value in 2014/15 = Rs 22,327 million
MTDW total asset value in 2015/16 = Rs 29,003 million
MTDW total asset value in 2014/15 = Rs 22,255 million
AEL and MTDW total assets are almost similar. Therefore the reason for the asset turnover
difference is revenue achievement. It is shown that AEL has generated more revenue per rupee of
assets. Therefore AEL asset utilization efficiency is higher than MTDW. AEL asset value is
increased by 36% while revenue is increased only 6%. On the other hand, MTDW total asset value

9
is increased by 30% but revenue is decreased 17%. Total asset value is mainly increased because
of investment of properties (work in progress) and investment of joint venture. This could be the
construction of Access Tower II and Harbor Village. Therefore when these two projects are over,
AEL can generate the revenue from these assets. So current asset turnover deduction of AEL could
be a short time issue.
3.4 Gearing Ratio
According to (Ogilvie. J,2009) Gearing ratio use to measure the financial leverage of the company
which compares the equity funded by the shareholders versus company borrowing to conduct their
operation. High gearing ratio means that the company has high degree of leverage and high level
of financial risk since having higher amount of debt compare to equity capital. However gearing
ratio should have to compare with industry gearing to get more reliable understanding about
company financial structure since financial structure is depend on the industry norms. However
maintaining balance capital structure is always important to keep company free from liquidity risk.
(Brealey et al., 2015). Mainly financial institution looks gearing of company in preparation of
issuing loans to check its ability to pay back.
Gearing = Total debt × 100
Total equity
Table 8: Gearing ratio comparison
2015/ 16 2014/ 15 Change
AEL 34.78% 3.75% 828%
MTD Walkers 165% 100% 65%
Industry 68% 54% 26%
(Source: Annual report, 2015/16)
Table 9: Working – Gearing
2015/ 16 (Rs Mn) 2014 / 15 (Rs Mn)
AEL = 5,193+652+412 × 100
17,994
= 34.78%
= 252+ 276+97 × 100
16,694
= 3.75%
WTDW = 14,277 × 100
8,641
= 165%
= 8,841 × 100
8,770
= 100%
(Source: Annual report, 2015/16)
Total equity 2015/16 – AEL = Rs 17,994 million
Long term loans and borrowing 2015/16 –AEL = Rs 5,193 million

10
Short term loans and borrowing 2015/16 –AEL = Rs 652 million
Bank overdraft 2015/16 – AEL = Rs 412 million
Total equity 2014/15 – AEL = Rs 16,694 million
Long term loans and borrowing 2014/15 –AEL = Rs 97 million
Short term loans and borrowing 2014/15 –AEL = Rs 252 million
Bank overdraft 2014/15 – AEL = Rs 276 million
Total equity 2015/16 – MTDW = Rs 8,641 million
Total debt 2015/16 – MTDW = Rs 14,277 million
Total equity 2014/15 – MTDW = Rs 8,841million
Total debt 2014/15 – MTDW = Rs 8,870 million
Even though AEL gearing ratio has been increased significantly in 2015/16 its gearing ratio is
34.78% which is lesser than industry gearing. And also MTDW is highly geared and ratio is
increased by 65%.
Main reason for AEL gearing improvement is Rs 5,000 million worth of debentures in 2015.
Before this, AEL funding has mainly driven through equity and its gearing ratio was 3.75%.
Therefore after debenture issue, AEL capital structure has been more balance. Further total equity
has been increased by 7%. Gearing of AEL is reached to very healthy level even though it is
increased by 828% during 2015. Normally if gearing is higher than 50% it is considered as risky
but compared to industry gearing AEL has enough room to increase debt financing further.
3.5 Interest cover
Interest cover ratio is a liquidity ratio which measures the company ability to pay interest expenses
on outstanding debts. Interest cover ratio simply can be calculated as below.
Interest cover = EBIT
Interest expenses
This indicates that how many times over a company can pay its current interest cost with its
earning. Creditors and finaical institution look this to check whether company has ability to pay
the interest. According to (Ogilvie. J,2009) if interest cover is higher than 1, it means company
has ability to pay its interest cost via earning and if interest cover is lower than 1, there could be
risk of facing difficulty to pay the interest on timely manner.
Table 10: Interest cover comparison
2015/ 16 2014/ 15 Change
AEL 7.8 30 (74%)
MTD Walkers 0.76 2.95 (74%)
(Source: Annual report, 2015/16)

11
Table 11: Working – Interest cover
2015/ 16 (Rs Mn) 2014 / 15 (Rs Mn)
AEL = 2,889
368
= 7.8
= 2,642
88
= 30
WTDW = 837
1,099
= 0.76
= 1,968
665
= 2.95
(Source: Annual report, 2015/16)
AEL finance cost 2015/16 = Rs 368 million
AEL finance cost 2014/15 = Rs 88 million
WTDW finance cost 2015/16 = Rs 1099 million
WTDW finance cost 2014/15= Rs 665 million
Interest cover has been reduced by 74% from 30 to 7.8. Even though interest cover has been
decreased significantly, 7.8 is not an issue because it means that AEL has gained earning which
can pay 7.8 time over its interest cost. WTDW interest cover is also reduced by 74% and it is
became less than 1. This is because that WTDW’s earnings before interest and tax has been
reduced by 57% while its finance cost is reduced by 65%.
AEL finance cost is increased by 318% mainly because of adding Rs 183 million of interest on
debenture. Further interest cost on bank overdraft and interest cost on bank loan has been increased
respectively 125% and 288%.
3.6 Price Earnings Ratio (P/E Ratio)
P/E Ratio is one of the most broadly used ratio for stock selection. This measures that company
current share price relative to its earnings per share.
P/E Ratio = Market value per share
Earnings per share
P/E ratio shows the rupee amount a shareholder can expect to invest in a company in order to
receive one rupee of its earnings. According to (Ogilvie. J, 2009) it reflects that what the market
is keen to pay for a stock based on its current earnings. It is more important to investors to analysis
which will be the market value by predicting future earnings per share. A Company which has

12
higher PE Ratio reflects better future performance and investors are willing to invest a company
which has higher PE. Comparing P/E ratio with similar company in same sector or industry P/E is
more meaning rather than analysis individual company P/E ratio.
Table 12: P/E ratio comparison
2015/ 16 Rs 2014/ 15 Rs Change
AEL 8.4 8.6 (2.3%)
MTD Walkers - 10 -
Construction industry 9.1 10.6 (14.15%)
(Source: Annual report, 2015/16)
Table 13: Working – P/E Ratio
2015/ 16 (Rs Mn) 2014 / 15 (Rs Mn)
AEL = 20.80
2.47
= 8.4
= 20.40
2.35
= 8.6
WTDW = 33.30
-2.0
= - 16.6
= 46.40
4.6
= 10
(Source: Annual report, 2015/16)
WTDW EPS in 2015/16 = Rs -2.0
WTDW EPS in 2014/15 = Rs 4.6
Share price as at 31.03.2016 = Rs 33.30
Share price as at 31.03.2015 = Rs 46.40
Access Engineering P/E ratio has been reduced to 8.40 from 8.60 while industry P/E is reduced to
9.10 from10.60. AEL share price and earning per share have been retained stable in 2015/16
financial year. MTDW EPS has been became negative since company made a loss in financial year
2015/16. AEL P/E ratio indicates better performance of AEL and shareholders confidence on AEL
compared to industry P/E ratio. Currently Colombo stock exchange is performing well and
construction industry will be raised back. Therefore share price of AEL is expected to increase and
confidence of investors will further improve.

13
4.0 How to fund to purchase the assets which represents 25% of Net Assets Employed.
In this scenario, Access Engineering PLC is going to purchase land and building which represents
25% of net asset of company. This report will discuss what the available financing sources are and
which one is the most suitable. There are two type of funding sources called internal and external.
Net assets can be calculated by deducting company’s liability from its assets. And it is equal to
shareholder’s equity of the company.
Rs million
Net Asset (2015/16) = Total Assets - Total Liabilities
= 30,342 - 12,348
= 17,994
25% of the net assets = 17,994 × 25%
= 4498.5
Value of the land and building to be purchased = Rs 4,498.5 million
There are various internal and external financing sources are available to purchase proposed asset.
4.1 Internal sources
Internal sources means the funds which are raised within the organization such as
Retained profits
Owner’s investment
Sale of stock
Sales of fixed assets
Debt collections
Among above all the internal sources, retained profits, sales of fixed assets can be further discussed
according to financial requirement and nature of AEL business.
4.1.1 Retained profit
This is a medium or long term source of finance and retained earnings means the net earnings
which does not paid as dividends, but keep by the company to reinvest in the business or to pay
debts. Company can use retained earnings to invest on areas where company can generate the
growth opportunities such as purchase required assets.
14
Advantages of using retained profit as a funding source are no need to repay and no interest cost
involved like some other funding methods. However sometimes, liquidity risk of company can be
increased by using retained earnings and reserve as a funding source.
As per the balance of sheet of as at 31st March 2016, retained earnings recorded as Rs 8,361
million. Required fund to purchase the assets is 54% of retained earnings. So AEL retained
earnings is sufficient to purchase proposed land and building. However this should be further
evaluated by analyzing overall financial impact of this decision.
How this decision could impact to gearing of the company need to be evaluated.
Gearing of AEL as at 31st March 2016 is 34.78%.
If land and building will purchase by utilize retained earnings, gearing would be;
= Debt × 100
Equity
= 5,193+652+412 × 100
17,994 – 4,498.5
= 46.36%
If AEL use its retained earnings to purchase proposed land and building, gearing ratio will be
increased by 33% from 34.78% to 46.36%. In 2015, gearing ratio has been increased significantly
(around 800%). In this condition, increasing gearing ratio again would give negative signal to the
market. But compared to industry gearing (68%), AEL still has enough room for gearing. However
considering time, this would not be a good time to increase the gearing further. However this is
the quickest way to obtain funds. Therefore urgency of requirement and return on investment is
also need to be concerned.
4.1.2 Sales of fixed assets
Sometimes company can generate funds by selling off fixed assets which company no longer
needed. But businesses always does not have this option since surplus fixed assets are not available
often. This is also medium term of financial options. AEL fixed asset value as at 31st March 2016
is Rs 4,790 million so it need to be checked is that possible to use some of fixed assets which AEL
no longer needed to cover some portion of fund needed to purchase new land and building.
However normally this is not much effective financing method because most of equipment which
AEL no longer needed may be outdated. Most of the property of AEL still company use and
generates money. Advantage of this financial method is that company can raise funds from assets
which are no longer needed.
15
4.2 External sources
External financial sources refer the funds which are raised outside of the organization such as
Equity finance
Debt finance
Leasing
Mortgage
Additional partners
Above all, equity, debt, lease is more relevant to this scenario.
4.2.1 Equity finance
Available equity finance options for AEL are right issue or warrants. In right issue, exiting
shareholders are invited to subscribe for more share capital in proportion to their exiting holdings
and induce them to subscribe for right by issuing rights at a discount; lesser than the market price.
However price would be more than the original issue price to avoid the adverse reaction by
shareholders if they recognize capital dilution. AEL current share price is around Rs 26. In right
issuing, given discount need to be decided based on market condition, required amount of fund
because it needs to encourage its shareholders to subscribe in the rights offering. Therefore this
discount should be selected carefully.
As an example, if 20% discount offer,
Issue price = 26 × 0.8
= Rs 20.80
Required amount of fund = Rs 4,498.50 million
If whole amount is funded through right issues,
No of rights need to be issued = 4498.5
20.8
= 216 million
Initially AEL has issued 1000m shares. Therefore rights can be issued around 4.5 : 1 ratio.
Possible disadvantage of this is that 20% discount may be not enough to attract the enough
shareholders.
16
If 40% discount offer,
Issue price = 26 × 0.6
= Rs 15.60
No of rights need to be issued = 4498.5
15.6
= 288 million
Therefore rights can be issued around 3.5: 1 ratio.
40% discount will help to attract more shareholders. However some shareholders think that EPS
will dilute since more share are issuing.
Benefit of right issuing is that company can find funds from its existing shareholders. Existing
shareholders have a better idea about company performance, negative impact of speculation could
be reduced. Further there is no involvement of underwriting fee.
Disadvantages are that this will lead to dilute the earning per share and some shareholders are not
willing to subscribe the rights. And also generally there is a perception that company goes for right
issue when company is struggling. But here AEL can explain the requirement of funding to their
shareholders and its financial performance indicates that company is financially performing well.
4.2.2 Debt financing
Debt finance can use for short, medium and long term. Short term, limited finding can be obtained
from bank overdraft. However available options to obtain Rs 4,500 million funding is debenture
and bank loan. In 2015, Access Engineering PLC has done Rs 5,000 million debenture issue. So
signal provides to market by issuing debenture again is not positive. Therefore the best available
debt financing option is obtain a bank loan.
When it comes to apply a bank loan, interest rate will be depend on average weighted prime lending
rate (AWPR). AWPR is 11.1 % as at 20th October 2017. So interest rate is 11.10%. Therefore
when applying a bank loan, it should be analyzed repaying ability of loan.
Loan Amount = Rs 4498.5 million
Interest rate = 11.1%
Repayment period will assume as 10 years.
17
= 4,498.5 × 1.111
= Rs 4997.8 million
Total interest payable = Rs 499.3 million
Interest cost per year = Rs 49.93 million
One year installment = Rs 499.78 million
Considering interest cost and installment, it would not be difficulty to pay it as per AEL financial
position.
Further this option can be evaluated by measuring impact to the gearing ratio and interest cover
ratio.
Gearing of AEL as at 31st March 2016 is 34.78%.
Gearing ratio after loan
= 5,193+652+412 + 4,498.5 × 100
17,994
= 60%
As per the above calculation, gearing of AEL would be increased by 72% from 34.78% to 60%.
Compare to industry gearing and competitor’s gearing, still 60% of gearing is fine. However
gearing has increased significantly within very short period due to debenture and bank loan. This
is not provided positive signal to the market.
Interest cover as at 31st March 2016 is 7.8.
Interest cover after the loan
= 2,889
368 + 49.93
= 6.9
(EBIT difference is not considered)
If AEL obtain a bank loan is reduced by 11.5%. However still AEL has enough ability to pay back
the installments and interest cost.
Considering AEL gearing ratio and interest cover, bank and financial institution is willing to
provide debt since company financial performance is healthy.

18
4.3 Recommendation
Main objective of any profit motive business is wealth maximization of shareholders. This means
company need to conducts projects which generate positive NPV generated projects. So it should
be considered return on this proposed assets. When it comes to funding decision, how quickly
company need to obtain funds is also need to consider instead of financial position. As per the
above explanation and calculations, AEL has more than one option to obtain funding. Therefore
best option is to use few funding options to mitigate the risk. AEL can use retained earnings to
obtain some part of funding and remaining part can obtain from bank loan. This is because AEL
has performed well in financial aspects even in challenging macro business environment. And also
capital structure is also balance to compare to industry. Interest rate is also expected to be stable.
Right issue is also available option, the issue is that it may give a negative signal to market which
company is struggling. So AEL need to provide relevant information to market at right time.
Further Colombo Stock Exchange is currently performing well compare to last two years.
Therefore all these funding options are available for AEL.
19
5.0 Modern management accounting technique
Traditional accounting techniques mainly concern on financial performance of the company.
However modern management accounting techniques looks on both financial and non-financial
performance of the company. In traditional accounting, company uses technique such as ratio
analysis, variance analysis. According to (CIMA study text, 2012-13) These traditional
management accounting technique criticize since
Some assumptions are not realistic.
These systems such as budgeting are time consuming and provide little value of
information.
This techniques concerns many costs as production costs when they really are overhead.
Business is not considered.
To eliminate the above weaknesses, modern management accounting technique were introduced.
In modern management accounting, company performance evaluate in different financial and non-
financial aspects. Today, corporate environment has been changed lot and new technology has
comes to industry, so management accounting technique such as balance scorecard, Lean
management, activity based budgeting.
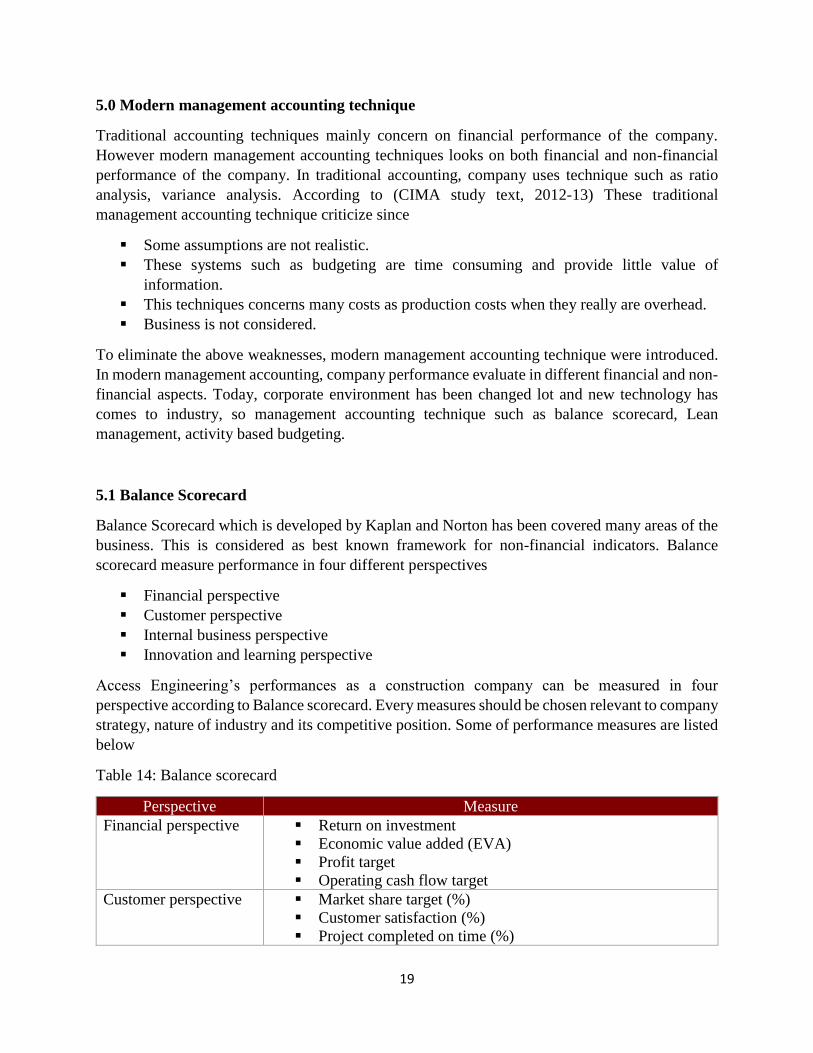
5.1 Balance Scorecard
Balance Scorecard which is developed by Kaplan and Norton has been covered many areas of the
business. This is considered as best known framework for non-financial indicators. Balance
scorecard measure performance in four different perspectives
Financial perspective
Customer perspective
Internal business perspective
Innovation and learning perspective
Access Engineering’s performances as a construction company can be measured in four
perspective according to Balance scorecard. Every measures should be chosen relevant to company
strategy, nature of industry and its competitive position. Some of performance measures are listed
below
Table 14: Balance scorecard
Perspective Measure
Financial perspective Return on investment
Economic value added (EVA)
Profit target
Operating cash flow target
Customer perspective Market share target (%)
Customer satisfaction (%)
Project completed on time (%)

20
Target Retention of customer and repeated tenders (%)
Brand image index(%)
Customer ratings (%)
Internal business
perspective
Carbon emission from production (%)
Industrial accident per year (No)
Equipment down time (%)
Innovation and learning
perspective
Investment on training
Research and development cost
No of training hours
No of employees expertise in industry
Balance scorecard helps to understand the overall performance of the company. Balance scorecard
is also related to company strategy. It helps employees to identify the goals. And this improve the
goal congruence because all employee work on archive same set of goals.
Disadvantage of balance scorecard is some of non-financial performance targets are not easy to
measure. And also when try to achieve targets in different perspectives, could be inconsistent and
conflicting with each other.
5.2 Lean management
Lean management is a technique of management based on minimize waste and non-value added
activities. Here waste defines the every type of waste such as product waste, time waste, knowledge
waste etc. When it comes to construction industry this is called lean construction. Key principles
of lean concept is
Eliminate the every type of waste.
Specify ultimate customer requirement
Clearly identify the processes which add value to the ultimate customer and eliminate non
value adding activities.
Try to achieve perfection by continuous improvement
This concept can be used to different stages of Construction Company.
Procurement
Manage the supply chain by integrating all the parties who contribute to the supply chain
to eliminate waste in both activities and processes
Transparency of cost which incurred to purchases
21
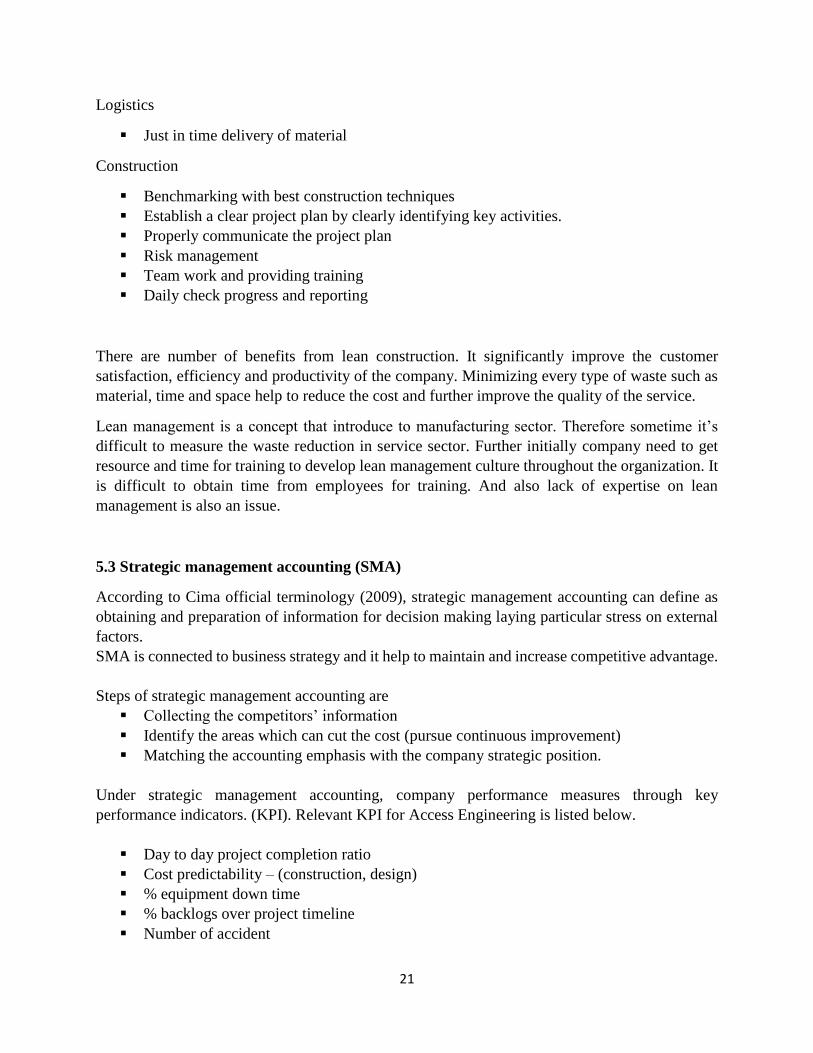
Logistics
Just in time delivery of material
Construction
Benchmarking with best construction techniques
Establish a clear project plan by clearly identifying key activities.
Properly communicate the project plan
Risk management
Team work and providing training
Daily check progress and reporting
There are number of benefits from lean construction. It significantly improve the customer
satisfaction, efficiency and productivity of the company. Minimizing every type of waste such as
material, time and space help to reduce the cost and further improve the quality of the service.
Lean management is a concept that introduce to manufacturing sector. Therefore sometime it’s
difficult to measure the waste reduction in service sector. Further initially company need to get
resource and time for training to develop lean management culture throughout the organization. It
is difficult to obtain time from employees for training. And also lack of expertise on lean
management is also an issue.
5.3 Strategic management accounting (SMA)
According to Cima official terminology (2009), strategic management accounting can define as
obtaining and preparation of information for decision making laying particular stress on external
factors.
SMA is connected to business strategy and it help to maintain and increase competitive advantage.
Steps of strategic management accounting are
Collecting the competitors’ information
Identify the areas which can cut the cost (pursue continuous improvement)
Matching the accounting emphasis with the company strategic position.
Under strategic management accounting, company performance measures through key
performance indicators. (KPI). Relevant KPI for Access Engineering is listed below.
Day to day project completion ratio
Cost predictability – (construction, design)
% equipment down time
% backlogs over project timeline
Number of accident
22
Main issue that company faces is obtaining relevant data to calculate those KPIs. Company has to
consume lot of time and effort to gather those data.
5.4 Environmental management accounting (EMA)
Currant global environmental issues has become major problem for human civilization.
Environmental risk is highly effected to the business operation too. Negative environmental factors
make huge adverse impact to business and its finance. Environmental issues could be effected
construction business by loss of insurance coverage, loss of revenue, disrupt to operation,
environmental taxes, fine, boycott and etc. Even though this environment impact has mentioned
in external reports, management accounting system is not captured this environment impact
properly.
In modern management accounting technique, organization would reflect environment impact to
its accounting by identifying environment cost of their processes, products and services. There is
a management accounting approach to identify environment related cost. So this approach is still
developing to find appropriate mechanism to measure environment cost.
The problem of EMA is absence of a clear definition for environment cost. So most of the
companies does not report or maintain this kind of cost.
.

23
References
Annual Report (2016). Retrieved from: www.accessengsl.com (Accessed on 20th October 2017)
Annual Report (2016). Retrieved from: www.walkerscml.com (Accessed on 20th October 2017)
Mathew,D (2016). “Construction back with a boom. FC Research “
Gallenger,T and Andrew,J (2007). “Financial management principal and practice” 4th edition,
USA: Freeload press
Lumby,S and Jones,C (2006). “Corporate finance theory and practice” 7th edition, London,
Thomson Learning
Ogilvie, 7 (2009). “CIMA official learning system, management accounting financial strategy”
London, UK: Cima publishing
Brealey, R., A., Myres, S., C., Allen, F., Mohanty, P. (2015), Principles of Corporate Finance,
11th edition, McGraw Hill Education, India
Cima official study text (2012-13)


