3730 ______________________________________________________________ DOI: https://doi.org/10.33258/birci.v4i3.2140
Financial Performance against Sukuk Ratings in the Islamic
Finance Sector
Sufyati HS Universitas Pembangunan Nasional Veteran, Jakarta, Indonesia
I. Introduction
The Islamic capital market in Indonesia has made significant strides. At the moment,
many individuals like to put their money in investing (Huda, 2006). The Islamic capital
market is an activity involving the trading of public company securities in which all
operations and processes adhere to sharia principles that prohibit usury, maysir, and qharar
(Abdalloh, 2019). Sharia bonds, or what are today referred to as Sukuk, are the plural
version of the Arabic word "sakk," which signifies certification or evidence of ownership
and was widely utilized in the Middle Ages for international commerce in Muslim regions
(Winanti et al., 2019). Existing sukuk are traded on the Indonesian stock exchange.
Sukuk is a document that details financial commitments originating from trading
enterprises and many other economic operations in Muslim lands throughout the Middle
Ages (Melis, 2017). Sukuk are similar to ordinary bonds in that they are not debt securities.
Sukuk is more like to a fund partner unit, in that holders are entitled to profit sharing and
are repaid by bond issuers at maturity (Ramadhani, 2013). Sukuk or sharia bonds may be
issued in accordance with the mudharabah, musyarakah, ijarah, istisna', salam, and
murabahah principles. However, the most often utilized concepts of this bond instrument
are bonds with mudharabah and ijarah instruments (Datuk, 2014).
Indonesia is categorized as late compared to other countries that implement the
Islamic financial system, such as Malaysia, Singapore, Bahrain, United Arab Emirates,
Iran, etc. Sukuk issued and traded on the stock exchange is known as Islamic bonds
because there is no legal umbrella for giving Sukuk (Kurniyawati, 2019). The existing
legal umbrella is only for the issuance of conventional bonds. Therefore, Indonesia is quite
Abstract
This research examined the evaluations of Sukuk. Sukuk refers to the Fatwa of the National Sharia Council; sharia bonds or Sukuk are long-term sharia-compliant securities issued by Issuers to Sharia Bondholders. Additionally, the Sukuk rating serves as a barometer for potential investors to assess if the Sukuk's performance is positive or negative. The objective of this study is to examine the financial performance's impact. Sukuk Ratings in the Islamic financial industry, namely Islamic Commercial Banks, as a sample based on purposive sampling with particular criteria for credit risk, return on assets (ROA), and firm size. The data in this study is derived from secondary sources and analyzed using multiple linear regression techniques. According to the findings of this study, the ROA variable has a substantial influence on the Sukuk rating. By contrast, the factors Current Ratio and Firm Size have no discernible effect on the Sukuk rating. This is demonstrated by the t-test, which indicates that the ROA variable has a significant value, but the Current Ratio and Firm Size variables do not.
Keywords
CR; ROA; firm size;
sukuk rating; Islamic
Bank

Budapest International Research and Critics Institute-Journal (BIRCI-Journal) Volume 4, No 3, August 2021, Page: 3730-3741
e-ISSN: 2615-3076 (Online), p-ISSN: 2615-1715 (Print) www.bircu-journal.com/index.php/birci
email: [email protected]
3731
brave because the legal umbrella does not yet exist but dares to issue Sukuk. The primary
distinction between Sukuk and bonds is that Sukuk must be implemented in accordance
with and in accordance with sharia principles in order to ensure that Sukuk are free of
usury and non-halal activities that are prohibited by sharia principles (Purnamawati, 2013).
Sukuk, like conventional bonds, is assessed similarly (Tamara, 2013). According to
Raharja and Sari (2008), this bond rating is critical since it provides an educated
assessment of the probability of a firm defaulting on its obligations. The rating is one
element that has contributed to Sukuk's rapid rise. Alternatively, the Sukuk rating becomes
essential as a source of information and signals about the likelihood of debt default and the
risks that the issuer is taking. This is strengthened by the amendment to Bapepam-LK
regulation IX.C.11, an attachment to Bapepam-LK decision KEP-712/BL/2012 on Debt
Securities and Sukuk Ratings, which mandates that each Sukuk issue be accompanied with
a securities rating. In other words, investors can use the Sukuk rating information to
evaluate the Sukuk issuing business's performance.
The six renowned rating agencies in Indonesia are: Fitch Ratings, Moody's Investor
Service, Standard and Poor's, PT. Fitch Ratings Indonesia and PT (Pramesti, 2018). The
Indonesian rating agency PEFINDO is utilized in the calculation of Sukuk in this study as
a reference point. The first rating agency in Indonesia is PEFINDO. Over 500 companies
and local governments have been evaluated by PEFINDO. PEFINDO has also put
instruments on the capital market, such as bonds, sukuk and medium-term bonds. In the
Indonesian rating sector PEFINDO is also a market leader. The study will examine the
bulk of sukuk published in Indonesia using the PEFINDO rating.
According to the description above, the author wants to do research on the financial
performance analysis of Sukuk ratings in Islamic banking, which covers the current ratio,
return on assets, and company size. The purpose of this study is to correlate economic
performance (current ratio, return on assets, and firm size) with Sukuk rating in Islamic
banking. It is intended that this research would contribute to the growth of Islamic bonds
and Islamic banking in Indonesia, as well as serve as a suggestion for more research on
grading Sukuk in Islamic banking.
II. Review of Literature
2.1 Financial Management
According to Fahmi (2014), financial management is a combination of art and
science discussing, reviewing, and analyzing how a financial manager uses all company
resources to seek funds, manage funds and distribute funds to provide profit or prosperity
for shareholders and businesses for the company.
2.2 Financial Statements
According to Sutrisno (2012), for evaluation purposes, it is necessary to link the
elements in the financial statements to be interpreted further. Connecting the components
in the financial statements is often called financial ratio analysis. "From the above
understanding, it can be concluded that financial ratio analysis is an analytical method that
compares financial statement posts with other posts to assess company performance
(Pongoh, 2013).
2.3 Capital Market
The capital market is a market for several long-term financial products, according to
Darmaji & Fakhrudin, which may either be exchanged in form of debt, equity (shares),

3732
derivatives and other instruments. Investment operations are funded by the capital market
(Juliati, 2015).
2.4 Syariah Banking
Sharia Bank is the bank which operates on a basis of sharia principles or islamic
legal principles governed by the Indonesian Council of the Ulemas (adl wa tawazun),
advantages (maslahah), universalism (alamiyah), and does not include gharar, maysir.
Objects of use, unfair and illicit (Antonio, 2001). The difference between Conventional
Banks and Islamic Banks is that there are relatively many similarities in terms of technical
receipts of money, computer technology, general financing requirements, and so on
(Marimin & Romdhoni, 2015).
2.5 Sukuk
Sukuk derives from the Arabic word "Sak," which has a similar meaning to a
certificate or note, (singular), or "Sukuk" (plural). Sukuk is non-contractual debt securities,
but is investment certificates (proof of ownership) in the case of tangible assets or profits
(beneficial title), which are the underlying assets (Arisanti et al., 2014).
2.6 Difference between Sukuk and Conventional Bonds
In principle, Sukuk and conventional bonds are different bonds. Conventional bonds
are fixed-income security that provides interest to the holder as bondholder income. At the
same time, Sukuk is not based on interest but on profit sharing/margin/fee, where the
amount of the margin fee has been agreed at the beginning, so it is clear how much return
will be obtained (Zakiyah, 2017).
2.7 Sukuk Rating
Of course a Sukuk investor who wants to purchase Sukuk must take care of the
Sukuk rating. It may be inferred that the rating is objective information on the capacity of a
firm to make due payments on time or on its debtor condition and what can and will be
done about the debtor owing. A bond will be rated by a rating agency in stages so that the
bond's risk can be reflected in the bond's rating. The higher the bond rating, the higher the
bond issuer's ability to pay debts. Sukuk have the same factors that affect the rating as
bonds.
2.8 Liquidity
The liquidity ratio measures a company's ability to meet short-term (or current)
obligations (Van Horne & Wachowicz, 2001). In the current economic development,
manufacturing companies are required to be able to compete in the industrial world.
Manufacturing companies need to invest to increase the company's business capital. To
invest, various kinds of information about the issuer are needed, both company
performance information in the form of financial statements or other relevant information.
The economic development of a country can be measured in many ways, one of which is
by knowing the level of world capital market development. (Angelia and Toni, 2020). The
manufacturing industry plays a very important and strategic role in contributing Gross
Domestic Product (GDP) to the national economy and labor absorption. This study is
aimed atanalyzing factors influencing labor absorption of the manufacturing industry
(Pramusinto and Daerobi, 2020). We can measure liquidity, namely the ratio of current
assets divided by current liabilities. A current asset ratio of 100% or more is owned by a
company that has healthy liquidity. A liquid company means that the company has large
3733
funds to pay all of its obligations. The more liquid the company is, the more internal funds
it will have to meet its operational needs (Afiezan et al, 2020).
2.9 Profitability
According to Dwi Prastowo (2011), profitability uses the rate of return on investment
that has been made by the company, either by using the total assets owned by the company
or by using funds originating from the owner (capital).
2.10 Company Size
Siregar and Nurmala (2018) reports that company size is a size that may be
categorized in different ways, including total assets, log size, stock market value, etc.
III. Research Methods
Sukuk in the Islamic financial sector, Islamic Commercial Banks, is the subject of
this research (BUS). The statistics are obtained from each company/official bank's website.
The data source utilized are secondary information acquired in each bank's annual report
from 2013 to 2017, namely Bank Mandiri Syariah, Bank BRISyariah, Bank Muamalat and
Bank BNI Syariah.
Islamic Commercial Banks in Indonesia are the population of this research and are
registered in decision of the Financial Services Authority's Committee of Commissars. The
research participants continue actively produce Sukuk and receive a PEFINDO rating. In
particular, 12 Sharia Commercial Banks (SBUs) are in operation, among which are the PT.
Bank of Muamalat Indonesia, the PT. Bank of Muamalat Mandiri, PT. Bank of Maggiore
Syaria, PT. BRI Syariah Bank, the PT. Bukopin of Islamic Bank, BNI Syariah Bank, PT.
Bank of Jabar Banten Syariah, PT.
The sample utilized the deliberate method of sampling in this investigation. Proper
sampling is a judgment on the basis of certain criteria of representatives of the current
population.
3.1 Descriptive Analysis Method
The descriptive approach is designed to describe the facts obtained without any
general inferences or generalizations. In this work, the analysis technique employs the CR,
ROA, firm dimensions calculations.
3.2 Classic Assumption Test
a. Normality Test
The normality test focuses at evaluating if there is a normal distribution in
confusion or residual variables in the regression model or not. A normal or almost ordinary
data distribution regression model is a reasonable model for regression. Graph analysis and
statistical testing can be carried out to determine whether or not the distribution of data is
normal (Ghozali, 2012).
b. Autocorrelation Test
The test of autocorrelation is used to assess if the confounding error in period t is
correlated with the error in period t-1 (prior) in a linear regression model. In practice, the
remaining quantities cannot be considered to be linked. If a connection exists, it is termed
an issue of automotive correlation.
3734
c. Heteroscedasticity Test
The test for heteroscedasticity seeks to determine if the regression model differs
from the residues from one observation to another. A suitable model for regression is one
with or without homoscedasticity (Husein, 2011).
d. Multicollinearity Test
The multicolinearity test seeks to examine if a correlation has been discovered
between independent variables in the regression model. There is no correlation between a
decent regression model and independent variables. To find out about the existence of
collinearity, in particular, by knowing the value of the correlation coefficient between one
variable and the other (Santoso, 2010).
3.3 Multiple Linear Regression Analysis
In this research, the analysis approach is utilized to determine the influence on
Sukuk ratings of CR, ROA and Firm Size factors (multiplicate linear regression method).
This is why the following may be formulated:
Information:
Y = Sukuk Rating
b0 = Constant
b1,b2,b3, = Regression line coefficient
X1 = CR
X2 = ROA
X3 = Firm Size
e = error
3.4 Model Feasibility Test
a. F Test
The F test or regression test is used to evaluate if the independent variables have a
significant influence combined on the dependent variable. In this example, find out
whether or not the CR, ROA, and company size factors affect Sukuk's rating significantly.
b. Coefficient of Determination ( )
The determination coefficient () basically assesses the capacity of the model to
explain the variance of the dependent variable. The size of the determination coefficient is
0 to 1. A little number implies that when explaining the variance of the dependent variable,
the power of the individual factors is limited. A near one value implies that virtually all
data required to determine the interpretation of the variable dependent are provided by the
independent variables.
c. Hypothesis Test (Uji t)
The t-statistical test illustrates how far the independent variable has an important
positive effect partially or individually on the dependent variable.
3735
IV. Results and Discussion
4.1 Descriptive Analysis Method
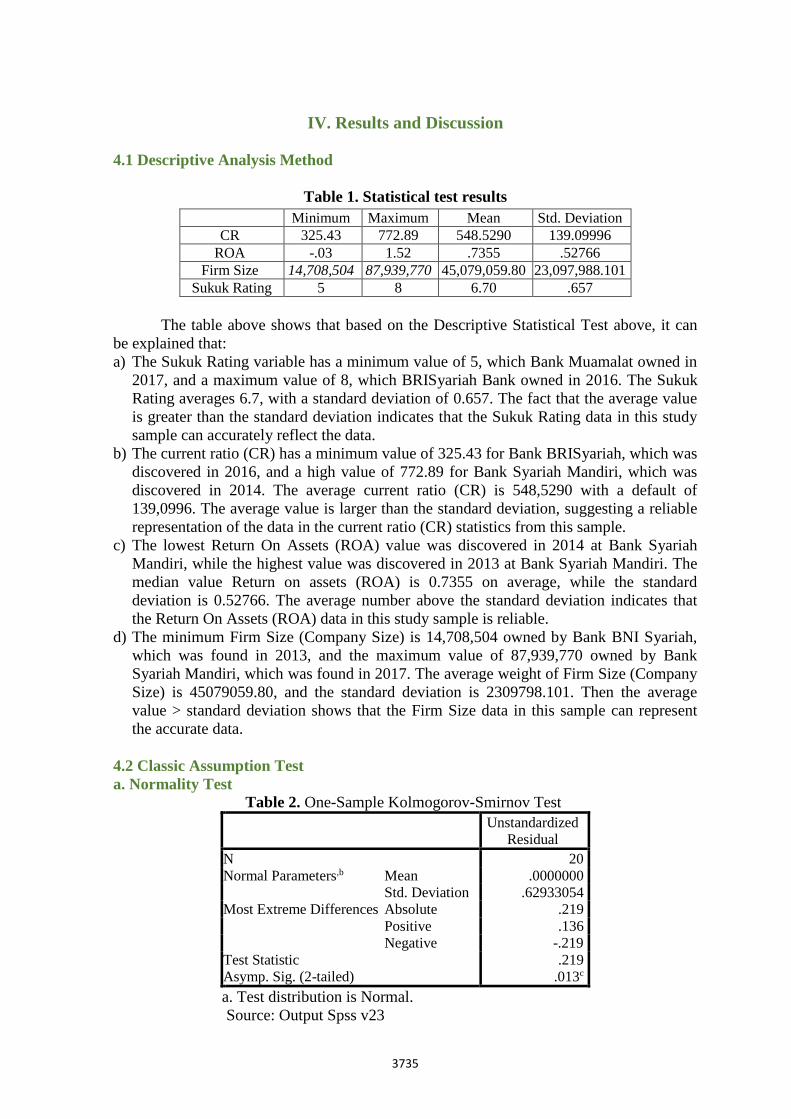
Table 1. Statistical test results
The table above shows that based on the Descriptive Statistical Test above, it can
be explained that:
a) The Sukuk Rating variable has a minimum value of 5, which Bank Muamalat owned in
2017, and a maximum value of 8, which BRISyariah Bank owned in 2016. The Sukuk
Rating averages 6.7, with a standard deviation of 0.657. The fact that the average value
is greater than the standard deviation indicates that the Sukuk Rating data in this study
sample can accurately reflect the data.
b) The current ratio (CR) has a minimum value of 325.43 for Bank BRISyariah, which was
discovered in 2016, and a high value of 772.89 for Bank Syariah Mandiri, which was
discovered in 2014. The average current ratio (CR) is 548,5290 with a default of
139,0996. The average value is larger than the standard deviation, suggesting a reliable
representation of the data in the current ratio (CR) statistics from this sample.
c) The lowest Return On Assets (ROA) value was discovered in 2014 at Bank Syariah
Mandiri, while the highest value was discovered in 2013 at Bank Syariah Mandiri. The
median value Return on assets (ROA) is 0.7355 on average, while the standard
deviation is 0.52766. The average number above the standard deviation indicates that
the Return On Assets (ROA) data in this study sample is reliable.
d) The minimum Firm Size (Company Size) is 14,708,504 owned by Bank BNI Syariah,
which was found in 2013, and the maximum value of 87,939,770 owned by Bank
Syariah Mandiri, which was found in 2017. The average weight of Firm Size (Company
Size) is 45079059.80, and the standard deviation is 2309798.101. Then the average
value > standard deviation shows that the Firm Size data in this sample can represent
the accurate data.
4.2 Classic Assumption Test
a. Normality Test
Table 2. One-Sample Kolmogorov-Smirnov Test
Unstandardized
Residual
N 20
Normal Parameters,b Mean .0000000
Std. Deviation .62933054
Most Extreme Differences Absolute .219
Positive .136
Negative -.219
Test Statistic .219
Asymp. Sig. (2-tailed) .013c
a. Test distribution is Normal.
Source: Output Spss v23
Minimum Maximum Mean Std. Deviation
CR 325.43 772.89 548.5290 139.09996
ROA -.03 1.52 .7355 .52766
Firm Size 14,708,504 87,939,770 45,079,059.80 23,097,988.101
Sukuk Rating 5 8 6.70 .657
3736
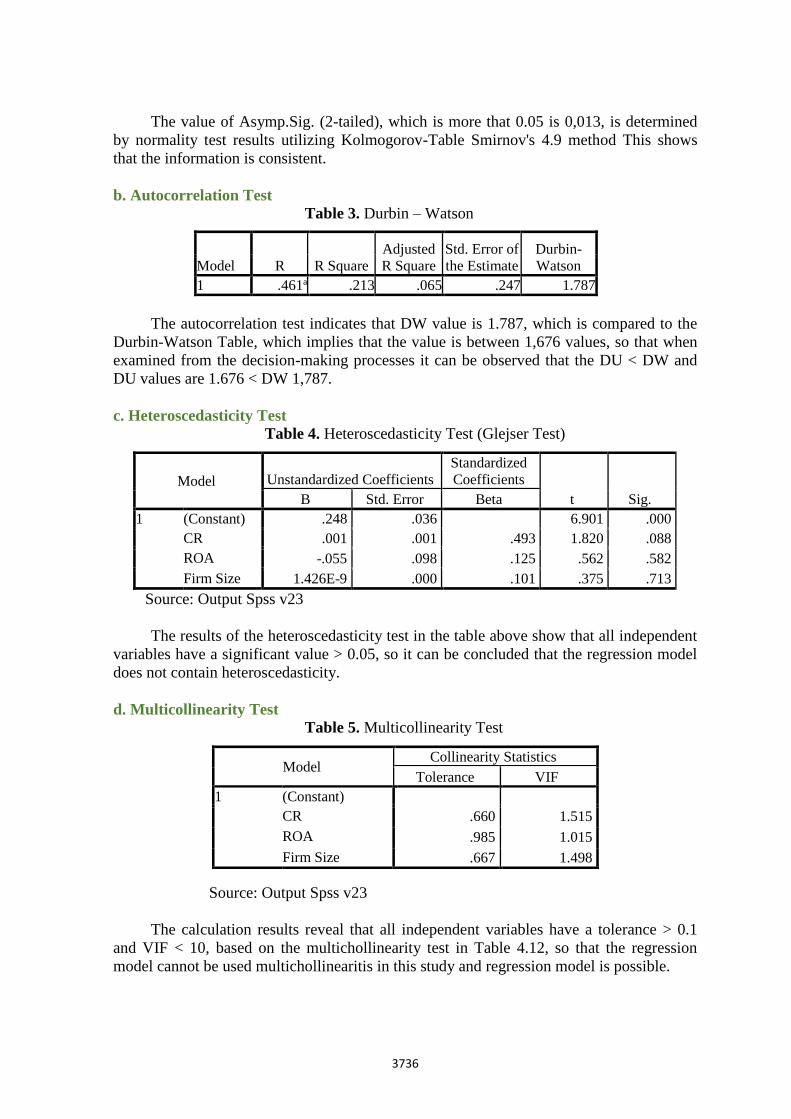
The value of Asymp.Sig. (2-tailed), which is more that 0.05 is 0,013, is determined
by normality test results utilizing Kolmogorov-Table Smirnov's 4.9 method This shows
that the information is consistent.
b. Autocorrelation Test
Table 3. Durbin – Watson
The autocorrelation test indicates that DW value is 1.787, which is compared to the
Durbin-Watson Table, which implies that the value is between 1,676 values, so that when
examined from the decision-making processes it can be observed that the DU < DW and
DU values are 1.676 < DW 1,787.
c. Heteroscedasticity Test
Table 4. Heteroscedasticity Test (Glejser Test)
Source: Output Spss v23
The results of the heteroscedasticity test in the table above show that all independent
variables have a significant value > 0.05, so it can be concluded that the regression model
does not contain heteroscedasticity.
d. Multicollinearity Test
Table 5. Multicollinearity Test
Source: Output Spss v23
The calculation results reveal that all independent variables have a tolerance > 0.1
and VIF < 10, based on the multichollinearity test in Table 4.12, so that the regression
model cannot be used multichollinearitis in this study and regression model is possible.
Model R R Square
Adjusted
R Square
Std. Error of
the Estimate
Durbin-
Watson
1 .461a .213 .065 .247 1.787
Model Unstandardized Coefficients
Standardized
Coefficients
t Sig. B Std. Error Beta
1 (Constant) .248 .036 6.901 .000
CR .001 .001 .493 1.820 .088
ROA -.055 .098 .125 .562 .582
Firm Size 1.426E-9 .000 .101 .375 .713
Model Collinearity Statistics
Tolerance VIF
1 (Constant)
CR .660 1.515
ROA .985 1.015
Firm Size .667 1.498

3737
4.3 Multiple Linear Regression Analysis
Table 6. Multiple Linear Regression Analysis
Coefficients
Model
Unstandardized
Coefficients
Standardized
Coefficients
T Sig. B Std. Error Beta
1 (Constant) .122 .087 1.401 .180
CR .001 .002 .090 .329 .746
ROA .443 .237 .417 1.868 .040
Firm Size 7.737 .000 .228 .840 .413
Source: Output Spss v23
Based on the value of the Standardized Coefficients above, the formulation of a
standardized regression model is obtained, namely:
Y = 0,122 + 0,001X1 + 0,443X2 + 7,737X3 + e
This table displays many linear regression coefficients that construct a linear
regression equation using Sukuk Rating's values as independent variable and current ratio,
Asset Return and Corporate Size as a dependent variable.
The Sukuk rating will improve by 0.001 on the basis of the regression coefficient X1,
which is positive for each growth of a single CR unit. At 0.443 the X2 regression
coefficient is positive, which means that the Sukuk Rating will grow by 0.443 for each
increase in one ROA team. The regression coefficient of the X3 is positive at 7.737 and
hence the Sukuk rating will grow to 7.737 for every increase of one unit of firm size.
4.4 Model Feasibility Test
a. F test
Table 7. F test results
ANOVA
Model Sum of Squares Df Mean Square F Sig.
1 Regression .263 3 .088 11.442 .000b
Residual .974 16 .061
Total 1.238 19
a. Dependent Variable: Peringkat Sukuk
b. Predictors: (Constant), Firm Size, ROA, CR
Source: Output Spss v23
Fount > Ftable with a 0.000 significant value, less than the 0.05 (0.000 <0.05)
significant threshold, is therefore rejected, which implies that this research model is
workable to study.
3738
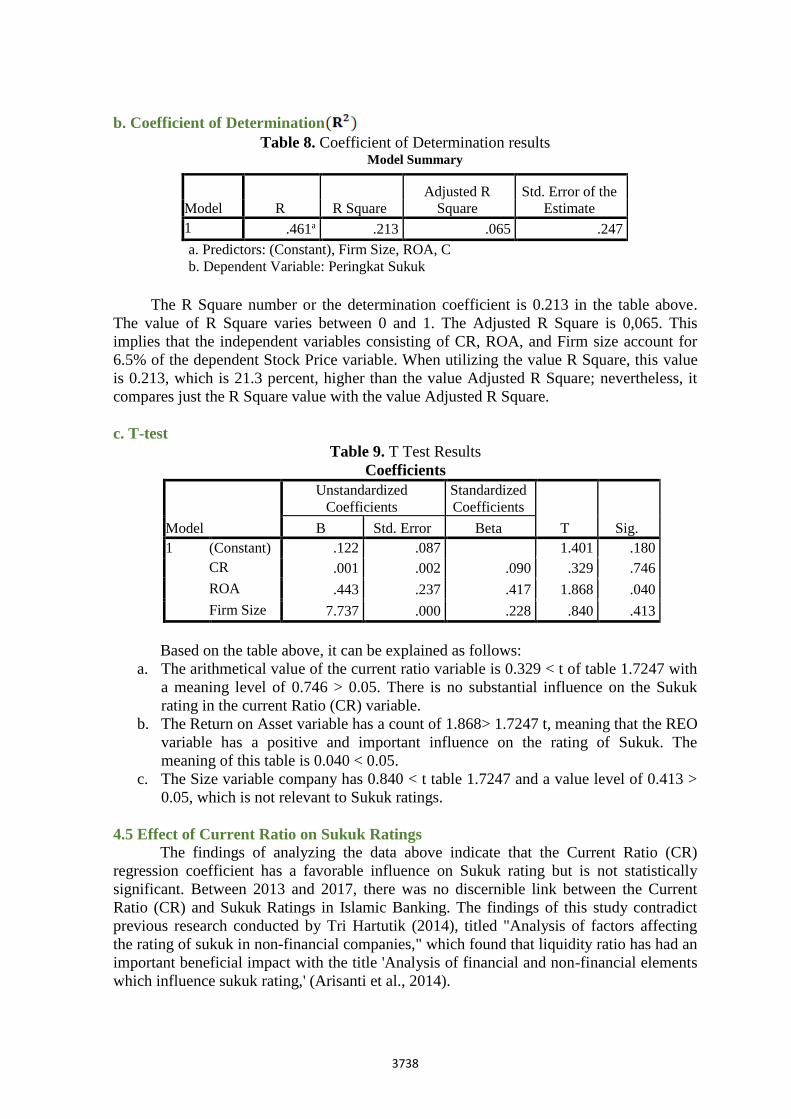
b. Coefficient of Determination
Table 8. Coefficient of Determination results Model Summary
The R Square number or the determination coefficient is 0.213 in the table above.
The value of R Square varies between 0 and 1. The Adjusted R Square is 0,065. This
implies that the independent variables consisting of CR, ROA, and Firm size account for
6.5% of the dependent Stock Price variable. When utilizing the value R Square, this value
is 0.213, which is 21.3 percent, higher than the value Adjusted R Square; nevertheless, it
compares just the R Square value with the value Adjusted R Square.
c. T-test
Table 9. T Test Results
Coefficients
Model
Unstandardized
Coefficients
Standardized
Coefficients
T Sig. B Std. Error Beta
1 (Constant) .122 .087 1.401 .180
CR .001 .002 .090 .329 .746
ROA .443 .237 .417 1.868 .040
Firm Size 7.737 .000 .228 .840 .413
Based on the table above, it can be explained as follows:
a. The arithmetical value of the current ratio variable is 0.329 < t of table 1.7247 with
a meaning level of 0.746 > 0.05. There is no substantial influence on the Sukuk
rating in the current Ratio (CR) variable.
b. The Return on Asset variable has a count of 1.868> 1.7247 t, meaning that the REO
variable has a positive and important influence on the rating of Sukuk. The
meaning of this table is 0.040 < 0.05.
c. The Size variable company has 0.840 < t table 1.7247 and a value level of 0.413 >
0.05, which is not relevant to Sukuk ratings.
4.5 Effect of Current Ratio on Sukuk Ratings
The findings of analyzing the data above indicate that the Current Ratio (CR)
regression coefficient has a favorable influence on Sukuk rating but is not statistically
significant. Between 2013 and 2017, there was no discernible link between the Current
Ratio (CR) and Sukuk Ratings in Islamic Banking. The findings of this study contradict
previous research conducted by Tri Hartutik (2014), titled "Analysis of factors affecting
the rating of sukuk in non-financial companies," which found that liquidity ratio has had an
important beneficial impact with the title 'Analysis of financial and non-financial elements
which influence sukuk rating,' (Arisanti et al., 2014).
Model R R Square
Adjusted R
Square
Std. Error of the
Estimate
1 .461a .213 .065 .247
a. Predictors: (Constant), Firm Size, ROA, CR
b. Dependent Variable: Peringkat Sukuk

3739
4.6 Effect of ROA on Sukuk Rating
The Coefficient table demonstrates that the Return On Assets (ROA) regression
coefficient has a substantial positive influence on the Sukuk Rating. Between 2013 and
2017, this study demonstrates a significant positive link between Return On Assets (ROA)
and Sukuk Ratings in Islamic banking. The findings of this study corroborate Damalia
Afiani's (2013) earlier research, titled "the effects of liquidity, productivity, profitability,
and leverage on the sukuk rating," which concluded that profitability had an effect on the
Sukuk rating.
4.7 Effect of Firm Size on Sukuk Rating
The findings of the testing of the data above indicate that the Firm Size regression
coefficient has no discernible influence on the Sukuk Rating. This study is distinct from
Yuni Catur's (2018) "analysis of the influence of financial measures on the prediction of
sukuk rating of businesses registered on the sharia securities list," which concluded that
company size had a significant impact on Sukuk rating. Nonetheless, the firms in this study
have a size value: those that are not large enough or that lack public awareness of the
company.
IV. Conclusion
According to the research, the findings of analyzing the data above indicate that the
Current Ratio (CR) regression coefficient has a favorable influence on Sukuk Ratings but
is not statistically significant. Meanwhile, the Sukuk Rating is heavily impacted by the
Return on Asset (ROA) regression. Finally, the size of the firm has little bearing on the
Sukuk rating. The t-test demonstrates that while the ROA variable is significant, the
Current Ratio and Firm Size factors do not provide a meaningful discount.
References
Abdalloh, I. (2019). Pasar Modal Syariah. Elex Media Komputindo.
Afiani, D. (2013). Pengaruh Likuiditas, Produktivitas, Profitabilitas, Dan Leverage
Terhadap Peringkat Sukuk. Accounting Analysis Journal, 2(1).
Afiezan, A. et al. (2020). The Effect of Free Cash Flow, Company Size, Profitability and
Liquidity on Debt Policy for Manufacturing Companies Listed on IDX in 2016-2019
Periods. Budapest International Research and Critics Institute-Journal (BIRCI-
Journal). P. 4005-4018.
Angelia, N and Toni, N. (2020). The Analysis of Factors Affecting Dividend Policy in
Food and Beverage Sector Manufacturing Companies Listed in Indonesia Stock
Exchange in 2015-2017. Budapest International Research and Critics Institute-
Journal (BIRCI-Journal). P. 902-910.
Antonio, M. S. I. (2001). Bank Syariah: dari Teori ke Praktik. Gema Insani.
Arisanti, I., Fadah, I., & Puspitasari, N. (2014). Analisis Faktor Keuangan dan Non
Keuangan yang Mempengaruhi Prediksi Peringkat Obligasi Syariah. Jurnal Ekonomi
Akuntansi dan Manajemen, 13(2)
Darmaji, T., & Fakhrudin, H. M. (2011). Pasar Modal di Indonesia Vol 3. Jakarta: Salemba
Empat.
Datuk, B. (2014). Sukuk, Dimensi Baru Pembiayaan Pemerintah Untuk Pertumbuhan
Ekonomi. Jurnal Riset Akuntansi Dan Bisnis, 14(1).
3740
Fahmi, I. (2014). Pengantar Manajemen Keuangan (Teori Soal dan Jawab). Bandung:
Alfabeta.
Ghozali, I. (2012). Aplikasi Analisis Multivariate Dengan Program SPSS. Semarang:
Universitas Diponegoro Publihser.
Hartutik, T. (2014). Analisis Faktor-Faktor Yang Mempengaruhi Peringkat Sukuk Pada
Perusahaan Non Keuangan. Yogyakarta: UIN Sunan Kalijaga.
Huda, N. (2006). Perkembangan Pasar Modal Syariah Di Indonesia. Jurnal Ekonomi Yarsi,
3(2), 1141-0776.
Husein, U. (2011). Metode Penelitian Untuk Skripsi dan Tesis Bisnis Vol 11. Jakarta: Raja
Grafindo Persada.
Juliati, Y. S. (2015). Peranan Pasar Modal Dalam Perekonomian Negara. HUMAN
FALAH: Jurnal Ekonomi dan Bisnis Islam, 2(1), 95-112.
Kurniyawati, D. (2009). Obligasi Syariah: Studi Tinjauan Hukum Islam Terhadap Aplikasi
Sukuk Ijarah Al-Muntahiya Bittamlik Di Bursa Efek Indonesia Surabaya (Doctoral
Dissertation, IAIN Sunan Ampel Surabaya).
Marimin, A., & Romdhoni, A. H. (2015). Perkembangan Bank Syariah Di Indonesia.
Jurnal Ilmiah Ekonomi Islam, 1(02).
Melis, M. (2017). Perkembangan Sukuk di Indonesia, Malaysia, Dan Dunia. Ekonomica
Sharia: Jurnal Pemikiran dan Pengembangan Ekonomi Syariah, 2(2), 75-88.
Pongoh, M. (2013). Analisis Laporan Keuangan untuk Menilai Kinerja Keuangan PT.
Bumi Resources Tbk. Jurnal EMBA: Jurnal Riset Ekonomi, Manajemen, Bisnis dan
Akuntansi, 1(3).
Pramesti, W. (2018). Analisis Pemeringkatan Sukuk: Perspektif Keuangan. BISNIS: Jurnal
Bisnis Dan Manajemen Islam, 5(1), 93-110.
Pramusinto, N. and Daerobi, A. (220). Labor Absorption of the Manufacturing Industry
Sector in Indonesia. Budapest International Research and Critics Institute-Journal
(BIRCI-Journal). p. 549-561.
Prastowo, D. (2011). Analisis Laporan Keuangan Konsep dan Aplikasi. Yogyakarta:UPP
STIM YKPN.
Purnamawati, I. (2013). Perbandingan Sukuk Dan Obligasi (Telaah Dari Perspektif
Keuangan Dan Akuntansi). Jurnal Akuntansi Universitas Jember, 11(1).
Raharja & Sari, M. P. (2008). Kemampuan Rasio Keuangan dalam Memprediksi Peringkat
Obligasi (PT KASNIC Credit Rating) .Jurnal Maksi, 8(2). 212-232.
Ramadhani, I. (2013). Pengaruh penerbitan obligasi syariah terhadap profitabilitas.
Etikonomi, 12(2).
Siregar, H., & Nurmala, P. (2018). Pengaruh Ukuran Perusahaan dan Penerimaan Opini
Going Concern Terhadap Harga Saham. Jurnal Riset Keuangan dan Akuntansi, 4(2).
Sugianti, Y. C. (2018). Analisis Pengaruh Rasio Keuangan Terhadap Prediksi Peringkat
Sukuk Pada Perusahaan Tercatat Di Daftar Efek Syariah (Doctoral Dissertation, UIN
Walisongo).
Sutrisno. (2012). Manajemen Keuangan, Teori Konsep dan Aplikasi, Vol 1. Yogjakarta:
Ekonisia.
Tamara, K. (2013). Analisis Model Prediksi Pemeringkatan Obligasi Syariah Perusahaan
dengan Pendekatan Rasio Keuangan di Bursa Efek Indonesia. Jurnal Penelitian,
10(2), 232-253.
Van Horne, J. C., & Wachowicz Jr, J. M. (2001). Principles of financial management.
United Kingdom: McGraw Publisher.

3741
Winanti, E., Nurlaela, S., & Titisari, K. H. (2017). Pengaruh Rasiolikuiditas, Rasio
Produktivitas, Rasio Profitabilitas, Dan Rasio Solvabilitas Terhadap Peringkat
Sukuk. Jurnal Akuntansi dan Pajak, 18(01).
Zakiyah, F. (2017). Perbandingan Risiko Sukuk Dan Obligasi Konvensional Perspektif
Fiqih Kontemporer. Dinar: Jurnal Prodi Ekonomi Syariah, 1(1), 65-106.


