
Financial Modeling of Residential PV Systems
Solar Powering Michigan Conference Traverse City, Michigan September 12, 2014

The Challenge:
• Develop a course that teaches solar energy professionals concepts associated with financing a PV system, that includes having them use a soDware model to accurately determine PV system costs and benefits.
Which financial so,ware models would meet this challenge?
The Choices Available:
• SophisFcated financial modeling soDware
• Websites that quickly calculate PV financial results
• Excel Spreadsheet
The Choices Available: Sophisticated Financial Modeling Software
A number of companies and organizaFons provide PV financial modeling soDware to PV professionals and their customers can access online (ex. Energy Periscope)
Advantages
• SophisFcated modeling of finances
• Results reporFng may be included
• Some soDware models the finances of solar thermal and small wind systems
• Model itself is protected from being changed or altered
• Many come with technical support services
Limita=ons
• Can take Fme to see results
• ODen can’t see how financial calculaFons are done
• Don’t always know what assumpFons are used in the model
• Can’t customize the models for your own purposes
• Some online financial modeling soDware requires a fee (aDer a free trial) before it can be used

The Choices Available: Websites that Quickly Calculate PV Financial Results
Advantages
• Requires only a few essenFal inputs: uFlity rates, electricity usage, etc.
• Easy to use, and don’t require sophisFcated knowledge of financing
• Results are quickly reported
• Websites are protected from being changed or altered
Limita=ons
• Limited in terms of sophisFcaFon and detail
• “Black box-‐like”: can’t see how financial calculaFons are done
• Don’t always know what assumpFons are used in the model
• Can’t customize the models for your own purposes
The Choices Available: Excel Spreadsheet Models
Advantages
• Financial modeling can range from simple to sophisFcated
• Results are quickly reported
• Programming is transparent – can see what assumpFons have been made
• Easy to customize for the user’s own purpose
• Good choice for teaching financial concepts
Limita=ons
• Need to have some Excel background to develop, work with, and revise the model
• There may be li]le to no technical support or model updates for some users
The MREA used an Excel spreadsheet to Develop a PV Finance Model for its PV 203: PV Sales and Finance course.
The MREA PV Finance Model
Features
• Excel spreadsheet that models residenFal PV systems using PVWa]s producFon data.
• Incorporates residenFal uFlity rates, net metering producFon credits, and feed-‐in tariffs.
• Can enter PV system, O&M, and equipment costs; and grants, rebates, and other benefits.
• Produces a PV System CumulaFve Cash Flow chart alongside reported cost and benefit results. The Cash Flow chart changes immediately upon entering new input data, so the user can quickly see the effects of revised inputs on cumulaFve cash flow.
• Reports environmental benefits of electricity produced by a PV system.
• Can be customized to add features and calculate addiFonal results.

MREA PV Finance Model – Entering Data and Calculating Results
• Data are entered into the of the PV Finance Model.
• CalculaFons, results, and other funcFons are shown in the
• Costs are entered as negaFve numbers and shown as red: -‐$100.00 (excepFons: PV system costs and UFlity rates)
• Income and benefits are entered as posiFve numbers and shown as black: $4,800.00
• To enter the same number many Fmes in the same row or column, highlight the cell and grab it at the lower right corner square [n] with the cursor showing a [+] sign, then drag over or down. You can also use the Edit > Fill > Right funcFon from the menu.
Source: MREA.
White cells
Green cells

MREA PV Finance Model – PV System Inputs
PV System Cost ($/WaF) and Size (kW).
• Enter the PV system cost/Wa] and the desired PV system size.
• Calculates annual energy producFon using PVWa]s producFon data.
PV System Loca=on.
• Enter a locaFon from a list of 26 midwest ciFes and towns, or enter “Custom” to get PVWa]s data for a specified locaFon.
• Model returns PV system characterisFcs corresponding to the specified locaFon.
PV System Life=me and PV Module Degrada=on Rate.
• Can model a PV system with up to a 30 year lifeFme.
Source: MREA., NREL PVWa]s Calculator. h]p://pvwa]s.nrel.gov/index.php

MREA PV Finance Model – Custom PVWatts Data Input
• Enter data from PVWa]s into the spreadsheet in the PVWaFs System Data-‐Custom tab.
Source: MREA.
• Then enter “Custom” in the cell for PV System Loca=on
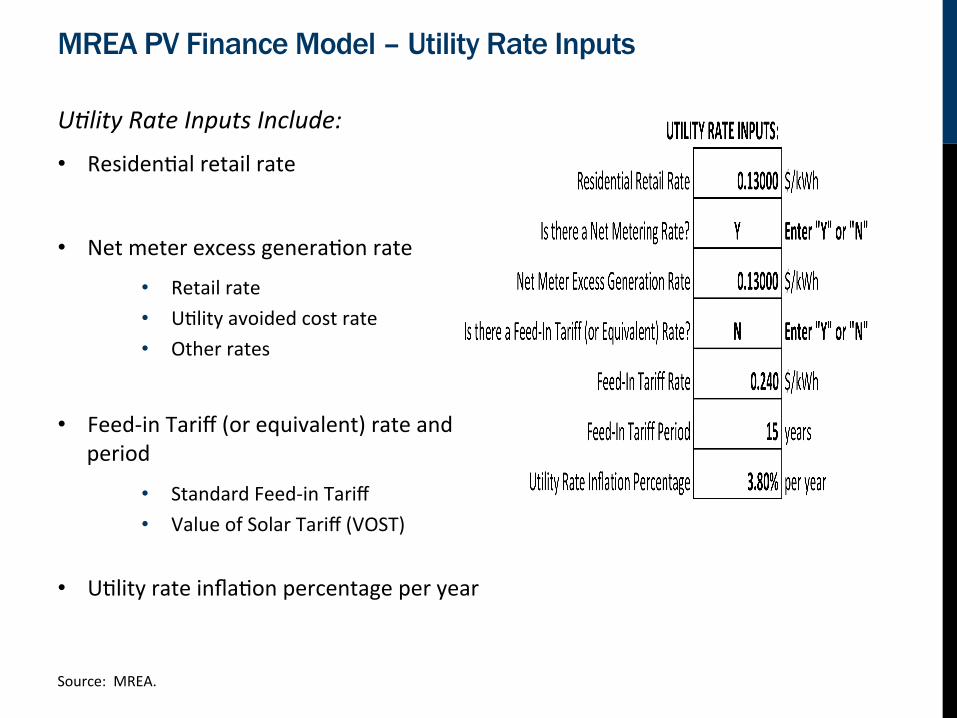
MREA PV Finance Model – Utility Rate Inputs
U=lity Rate Inputs Include:
• ResidenFal retail rate
• Net meter excess generaFon rate
• Retail rate • UFlity avoided cost rate • Other rates
• Feed-‐in Tariff (or equivalent) rate and period
• Standard Feed-‐in Tariff • Value of Solar Tariff (VOST)
• UFlity rate inflaFon percentage per year
Source: MREA.

MREA PV Finance Model – Tax Rate and Discount Rate Inputs
Tax Rate and Discount Rate Inputs Include:
• Federal tax credit rate for installing PV systems
• State tax credit rate for installing PV systems, if applicable
• Federal and state income tax rates for calculaFng pre-‐tax benefits of energy savings from the PV system
• State or municipal sales tax rate (under construcFon)
• Discount rate for calculaFng net present values (NPV) of future cash flows
Source: MREA.
• Label with state name alerts user to enter corresponding state tax information, if applicable.

MREA PV Finance Model – PV System Costs
• Calculates the Ini=al Cost of the PV System:
• Equals $/Wa] x 1,000 W/kW x PV system size (kW)
• Enter Grants, Rebates, and Cash Down Payment
• Calculates Federal Tax Credit (ITC) and State Tax Credits (fi available)
• Calculates Net Cost of the PV system a,er grants, rebates, federal and state tax credits, and cash down payment
Source: MREA.
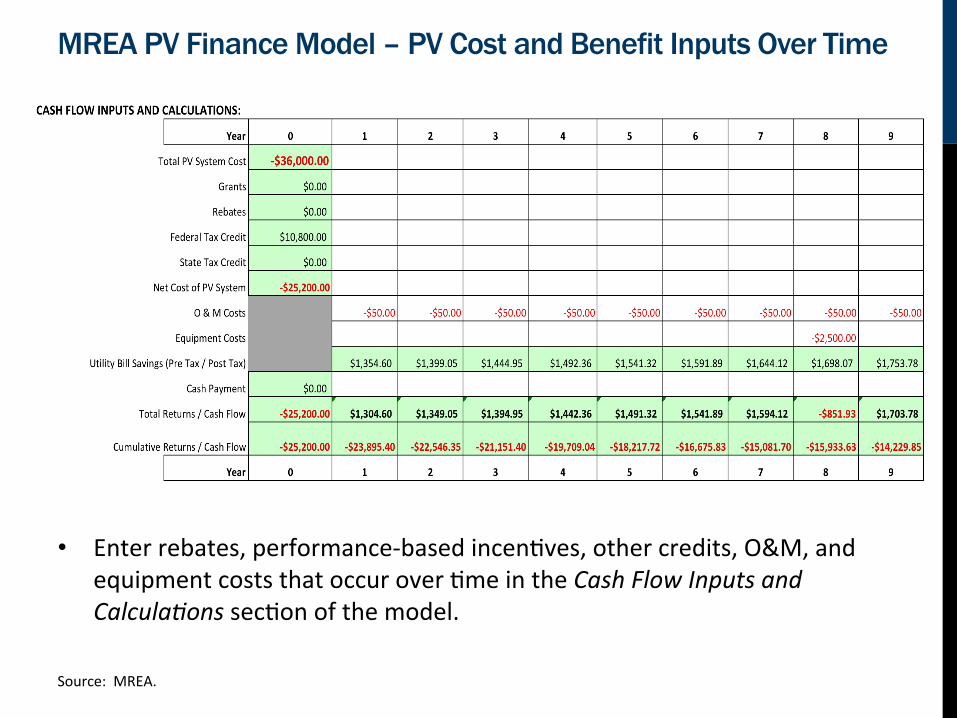
MREA PV Finance Model – PV Cost and Benefit Inputs Over Time
• Enter rebates, performance-‐based incenFves, other credits, O&M, and equipment costs that occur over Fme in the Cash Flow Inputs and Calcula=ons secFon of the model.
Source: MREA.

MREA PV Finance Model – PV System Electricity Production Results
PV System Electricity Produc=on Results Include:
• Customer’s annual electricity usage (kWh)
• Annual electricity producFon of PV System (installed kWh)
• Percentage of annual electricity usage supplied by the PV system
• LifeFme electricity producFon of the PV system (kWh)
• Accounts for module degradaFon over the specified PV system lifeFme.
Source: MREA.
-
2,000
4,000
6,000
8,000
10,000
12,000
2013
kWh
Annual Customer Electricity Usage
Annual PV System Electricity Production

MREA PV Finance Model – PV System Financial Results
Source: MREA.
Measures of Financial Results Include: • Simple Payback • Return on Investment (ROI) • Net Present Value (NPV) • Internal Rate of Return (IRR) • Profitability Index (PI)
• CumulaFve Cash Flow • Expressed in future values of $
• Number of Years to Cost Recovery • Usually < Simple Payback
• Sum of Returns • NPV of Returns

MREA PV Finance Model – Cumulative Cash Flow Chart
Cumula=ve Cash Flow Chart
• The cumulaFve cash flow chart is displayed to the right of the Results secFon of the spreadsheet.
• The chart changes immediately aDer new values are entered.
• Other charts can be easily produced as needed.
Source: MREA.
• The calculated cumulaFve cash flow is equal to the height of the last bar on the PV System CumulaFve Cash Flow chart.
-$30,000.00
-$20,000.00
-$10,000.00
$0.00
$10,000.00
$20,000.00
$30,000.00
$40,000.00
$50,000.00
0 2 4 6 8 10 12 14 16 18 20 22 24 26 28 30
Cas
h Fl
ow ($
)
Year
PV System Cumulative Cash Flow

MREA PV Finance Model - Environmental Benefits
Sources: MREA., Energy Periscope. www.energyperiscope.com, U.S. Environmental ProtecFon Agency. www.epa.gov/cleanenergy/energy-‐resources/refs.html , U.S. Energy InformaFon AdministraFon. www.eia.gov
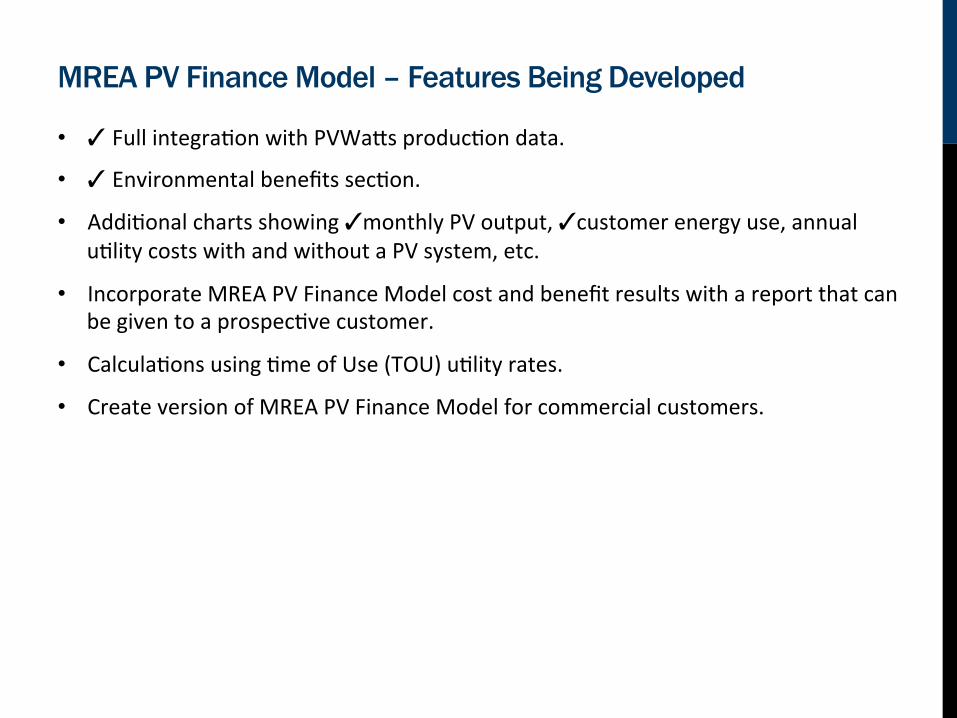
MREA PV Finance Model – Features Being Developed
• ✓ Full integraFon with PVWa]s producFon data.
• ✓ Environmental benefits secFon.
• AddiFonal charts showing ✓monthly PV output, ✓customer energy use, annual uFlity costs with and without a PV system, etc.
• Incorporate MREA PV Finance Model cost and benefit results with a report that can be given to a prospecFve customer.
• CalculaFons using Fme of Use (TOU) uFlity rates.
• Create version of MREA PV Finance Model for commercial customers.

MREA PV Finance Model – Comprehensive Example Determine the costs and benefits for a PV system to be installed in Traverse City, Michigan with Consumers Energy as the uFlity, based on the following informaFon:
PV System cost = $4.00/Watt Grants, Rebates, Cash Payments = $0 Federal Tax Credit rate = 30% O&M costs
= -$50 from Year 1 to Year 30 Equipment Cost
= -$2,500 for inverter replacement in Year 13
Assumptions: • PV system lifetime = 30 years • PV module degradation = 0.5% / year • Utility inflation rate = 3.80% / year • Discount rate = 5.00%
Source: MREA.

To Learn More About the MREA PV Finance Model and the PV Sales and Finance Course:
PV 203.03 PV Sales and Finance Saturday, September 13, 2014 8:30 AM – 4:30 PM Aero Park Laboratories Room APL 101 2525 Aero Park Drive, Traverse City, MI
Fees: Non-‐Member Price: $270.00, MREA Member price: $250.00 Course Materials:
Pencil & paper, laptop, calculator, lunch ConFnuing EducaFon Credits:
7.0 hours for NABCEP PV Technical Sales cerFficaFon
Source: MREA.

Works Cited
• Energy Periscope™. h]p://www.energyperiscope.com/
• -‐-‐-‐ “Performance & Financial Analysis Report, September 18, 2013”. h]p://www.energyperiscope.com/
• MicrosoD Office: Excel h]p://office.microsoD.com/en-‐us/excel-‐help/excel-‐funcFons-‐by-‐category-‐HP005204211.aspx
• Midwest Renewable Energy AssociaFon (MREA). www.midwestrenew.org.
• NREL PVWa]s Calculator. h]p://pvwa]s.nrel.gov/index.php.
• U.S. Energy InformaFon AdministraFon. www.eia.gov.
• U.S. Environmental ProtecFon Agency. www.epa.gov/cleanenergy/energy-‐resources/refs.html.


