
1
Finance @ NTU – Taipei, March 26, 2013

2
MORE THAN CONNECTEDNES-
HETEROGENEITY OF CEO SOCIAL NETWORKS AND FIRM VALUE
Iftekhar Hasan(with Bill Francis and Yiwei Fang)
Fordham University and Bank of Finland
2

3
MORE THAN CONNECTEDNES-
HETEROGENEITY OF CEO SOCIAL NETWORKS AND FIRM VALUE
Iftekhar Hasan(with Bill Francis and Yiwei Fang)
Fordham University and Bank of Finland
3

4
Focus of the paper
Social Network Heterogeneity of Top Management and Its Potential Impact on Firm Performance?

5
Social Networks
• Social network is one of the most striking phenomena of modern society.
• LinkedIn, a social networking website for people in professional occupations, has more than 175 million users in around 200 countries and territories.
• Facebook, for another example, has more than 1 billion active users all over the world as of September, 2012.
• Its IPO in May 2012 was valued at $104 billion, the largest valuation to date for a newly listed public company.

6
Trends of Globalization
6
19921993
19941995
19961997
19981999
20002001
20022003
20042005
20062007
20082009
20100
100
200
300
400
500
600
700
foreign income -other firms
foreign income -S&P1500

7
Heterogeneity of Corporate Hierarchy
Figure 1: Increase of foreign-born managers
7
2000 2001 2002 2003 2004 2005 2006 2007 2008 2009 20100.0%
2.0%
4.0%
6.0%
8.0%
10.0%
12.0%
14.0%
7.5% 7.8% 8.2%7.6% 7.9% 8.1% 8.3% 8.3% 8.6% 9.0% 9.3%
9.0% 8.6% 8.7% 8.8% 9.1%9.9%
10.5% 11.0%11.6% 11.3% 11.6%
Percentage of female
Percentage of foreign-born

8
CEO Social Networks
• CEOs have extensive social networks, e.g., they meet people from alumni event, workplace, conferences, and country clubs.
• It is considered as an important social capital, where one can draw resources from others, obtain business opportunities, and learn new market information.

9
Economics of Diversity
Issues of ethnicity, culture and human diversity have been at the forefront of behavioral and social science research.
Heterogeneous social connections create more opportunities (Granovetter,1973 AJS; Burt, 1992).
The role of social capital in the creation of human capital (Coleman, 1988 AJS; Uzzi, 1996 ASR).
9

10
Economics of Diversity
Psychologists emphasize that differences in individual attributes is important for knowledge creation, leadership creativity, and firm innovation (Barron and Harrington, 1981 ARP; Amabile, 1988; Bassett Jones, ‐2005 CIM)
Most groundbreaking ideas are found at the intersections of diverse fields, industries, disciplines, and cultures (Frans Johansson, 2006, The Medici Effect).
10

11
Economics of Diversity
Moderate population diversity promotes economic development, but too much diversity inhibits communication and cooperation (Lazear, 1999 JPE; Alesina et al., 2000 AER; Ashraf and Galor, 2011 AER)
11

12
Impacts on the Financial World• CEO social networks have significant impacts on
various corporate finance issues– Corporate investment decisions (Fracassi, 2012); – Mutual fund performance and investment behavior
(Cohen et al., 2008 JPE); – Cost of capital (Engelberg et al., 2012 JFE);– M&A performance (Cai and Sevilir, 2011 JFE)– CEO compensation and governance (Hwang and
Kim, 2010 JFE; Engelberg et al., 2012 RFS; Fracassi and Tate, 2011 JF).

13
What do we do?
We look at the impact of CEO social network heterogeneity on firm performance.
Social networks Whom you know from school, work, club, charity, army,
government, and other non-profit associations.
Heterogeneity of social ties Demographic (e.g. gender, ethnicity) Intellectual (e.g. degree, major, school ) Professional (e.g. industry, managerial expertise) International experience (e.g. connections to foreign
companies)

14
Research Questions
Does heterogeneity of CEO social network add value to corporations ?
If so, through which channels ?
14

Key Findings
• We find that CEO social network heterogeneity has a positive impact on firms’ Tobin's Q.
• Greater CEO social network heterogeneity also leads to (i) more innovation, (ii) more foreign sale growth, (iii) higher investment efficiency, (iv) better M&A performance, and (v) lower cost of financing .

16
Related Academic Work on Demographic Diversity
Gender and Ethnic Diversity Matter Males and females differ in risk appetite and
work attitude (Barber and Odean, 2001, QJE; Hillman, Shropshire, and Cannella, 2007, AMJ).
Different ethnic groups differ in beliefs and cognitive functioning, which could provide a broader view and more alternative solutions to the questions (Peffer and Salancik, 1978; Carter et al., 2003).
16

17
Related Academic Work on Diversity
Intellectual and Professional Diversity Matter
Different educational and professional backgrounds provide a diverse range of expertise, which enhances problem solving capability (Rodan and Galunic, 2004 SMJ; Bassett-Jones, 2005 CIM).
Greater diversity in the board room can bring informational richness to the discussion and improve firm performance (Adams and Ferreira, 2009 JFE; Anderson et al., 2011 FM).
17

18
Our Contribution
Our study attempts to bring a new perspective to this debate by focusing on the value implication of the diversity of social networks. Importantly, it looks at the heterogeneity within the diversity of social networks.
18

19
Our Hypotheses
• Current-day CEOs could benefit from a broader set of knowledge to response to the innovations in the new products and increased competitive business pressure in the market.
• Interacting with dissimilar others enable CEOs to learn diverse of knowledge, new perspectives, and multiple problem-solving options.
• It also likes to widen their mindset and improves capability of decision-making.
H1: Diversity of CEO social connections (in terms of demographic, intellectual, professional experiences, and geographical exposure) increase firm value.
19

Our Hypotheses
• Social network theories have well documented the role of social networks in knowledge diffusion (Goyal and Moraga-Gonzales, 2001 RJE).
• Economic studies emphasize that variety within human populations gives rise to knowledge heterogeneity, which is crucial to the production of innovation and the accumulation of universally applicable human capital (Hargadon and Sutton, 1997 ASQ; Galunic and Rodan, 2004 SMJ; Lazear, 1999a, 1999b).
H2: CEO Social network heterogeneity contributes to firm value through its impact on firm innovation.

• Entering a foreign market is a process that compounds the complexity of all managerial tasks, especially culture knowhow (Prahalad and Hamel 1990 HBR; Carpenter and Sanders, 1998 AMJ).
• Social networks with people from different culture are likely to provide more foreign market information, reach a network of foreign contacts, identify good opportunities, and push sales (e.g. Masulis and Wang, 2012, JAE).
H3: CEO Social network heterogeneity contributes to firm value through its impact on foreign business generation.
Our Hypotheses

Our Hypotheses
• Individuals with similar attitudes tend to have group thinking, which may sometime lead to the ignorance or lack of challenging views and missed opportunities (Asch, 1951; Janis, 1982).
• In contrast, a heterogeneous social network could simulate debate about the appropriateness of a business strategy, which allows managers to gain multiple perspectives and alternative solutions (Wiersema and Bantel, 1992; Watson et al., 1993).
• In our case, social network diversity is likely to provide the CEO with a wider breadth of information sources and skill sets.
H4: Heterogeneity of CEO social network has a positive impact on a firm’s investment performance.

23
Our Hypotheses
• Engelberg et al. (2012 JFE) report that firms that have social connections with bankers obtain lower cost of bank loans.
• In another paper, Engelberg et al. (2012 RFS) suggest that CEO social network is a valuable social capital that increases CEO’s ability to draw resources from resource holders.
H5: Heterogeneity of CEO social network has a negative impact on a firm’s cost of capital.

Data and Sample
• Primary data• BoardEx (Management Diagnostics Limited)
• CEOs’ social ties with schoolmates, colleagues, and other connections through club memberships, charities, army, government, etc.
• Biographical information of CEOs and their connections, including gender, nationality, education, and working experience
• Other data• Compustat; NBER Patent; SDC; CRSP; ExecuComp
• Our final sample consists of 2216 firms’ 3100 CEOs over 2000-2010.
24

25
Limitation of the data
The social network diversity measures are still limited to professionals, rather than everyone in a society.
We can only trace the exposure but not the real depth or intensity of the relationship.
25

Construction of social networks
26
Step 2: Check their education background.School ties are built if two people went to the same school within 3 years of each other
Step 2: Check their education background.School ties are built if two people went to the same school within 3 years of each other
Step 3: Check their work experienceWork ties are built if two people used to worked at the same company same yearStep 3: Check their work experienceWork ties are built if two people used to worked at the same company same yearStep 1: Our network consists of senior mangers, executives and board of directors of all US companies identified in BoardExStep 1: Our network consists of senior mangers, executives and board of directors of all US companies identified in BoardExStep 4: Check their social activities (e.g. club, charity, army, government)? Other ties are built if two people did social activities at the same organizationsStep 4: Check their social activities (e.g. club, charity, army, government)? Other ties are built if two people did social activities at the same organizationsStep 5: In the end, we only look at CEOs and calculate their social network heterogeneity based on who they know.Step 5: In the end, we only look at CEOs and calculate their social network heterogeneity based on who they know.

27
An example of Coca-Cola CEO (Muhtar Kent)
27Name Gender Nationality Degree Major Occupation Company Company Country Industry
Michel Naquet-Radig M French MBA MBA BoardDirectorefes breweries international nv
Netherlands
Hon. John Kornblum M American CEO lazard & co gmbh Unknown
Hon. Mrs Alexis F American BS BoardDirector new venture inc United States
Tom Pritzker M American JD Law CEO hyatt hotels corp United StatesRichard Wolford M American CEO del monte foods co United States 2000Andrew Liveris M American BS CEO dow chemical co United States 2821
Tim Shriver M American PhD BoardDirector special olympics international United States
Senator Bill Frist Sr M American MD BoardDirector cressey & company lp United States
Sir David Logan M American BoardDirectorefes breweries international nv
Netherlands
TuncayÖzilhan M Turkish MBA MBA BoardDirector efes sinai yatirim hldgs as Turkey 2086
Metin Tokpinar M Dutch MS BoardDirector efes sinai yatirim hldgs as Turkey 2086
Ibrahim Yazici M Turkish MBA MBA BoardDirector efes sinai yatirim hldgs as Turkey 2086
Hursit Zorlu M Dutch BS BoardDirector efes sinai yatirim hldgs as Turkey 2086
DemirArman M Turkish MS Finance BoardDirectorefes breweries international nv
Netherlands
Doctor Ali Tigrel M Dutch PhD BoardDirectorefes breweries international nv
Netherlands
Christos-Alexis Kom M Greek BoardDirector shelman sa Greece
Doctor Nakedi Phosa M PhD BoardDirector braemore resources plc United Kingdom 1000
Doctor Helene Gayle F American MD CEO care usa United States
David Bucey M American JD Law BoardDirector amedisys inc United States 8082

The measure of CEO social network heterogeneity
• Demographic heterogeneity has two components: Gender and Ethnicity – Het_gender =1/(female_ratio2 + male_ratio2). – Het_enthnicity = 1/(North_America_ratio2 + Latin_America_ratio2 +
Europe_ratio2 + Asia_ratio2 + Africa_ratio2). Het-demo = (Het_gender + Het_ethnicity ) /2
• Intellectual heterogeneity has three components: Degree, Major, and School– Het_degree = PhD_ratio 2+ Master_ratio 2+ Bachelor_ratio2. – Het_major = Business_Finance_ratio2 + Engineering_ratio2+
Liberal_Arts_ratio2 + Law_ratio)2 – Het_school = Same_school_ratio2+Different_school_ratio2 Het-Intellectual = (Het_degree + Het_major + Het_school)/3

The measure of CEO social network heterogeneity
• Profession heterogeneity has two components: occupation and industry experience– Het_occupation = (CEO ratio)2 +(CFO ratio)2+ (Other executives
ratio)2+(board of directors ratio)2 – Het_industry =(same industry ratio)2+(different industry ratio)2 Het_prof = ( Het_occupation + Het_industry ) / 2
• International heterogeneity is based on the percentage of connections with foreign countries with different income level based on WB classification. Het_geography = 1/ (HighIncome_ratio2 +
UpperMidIncome_ratio2 + LowerMidIncome_ratio2 + LowIncome2).
• Overall heterogeneity is the average of above four heterogeneity indices.
30
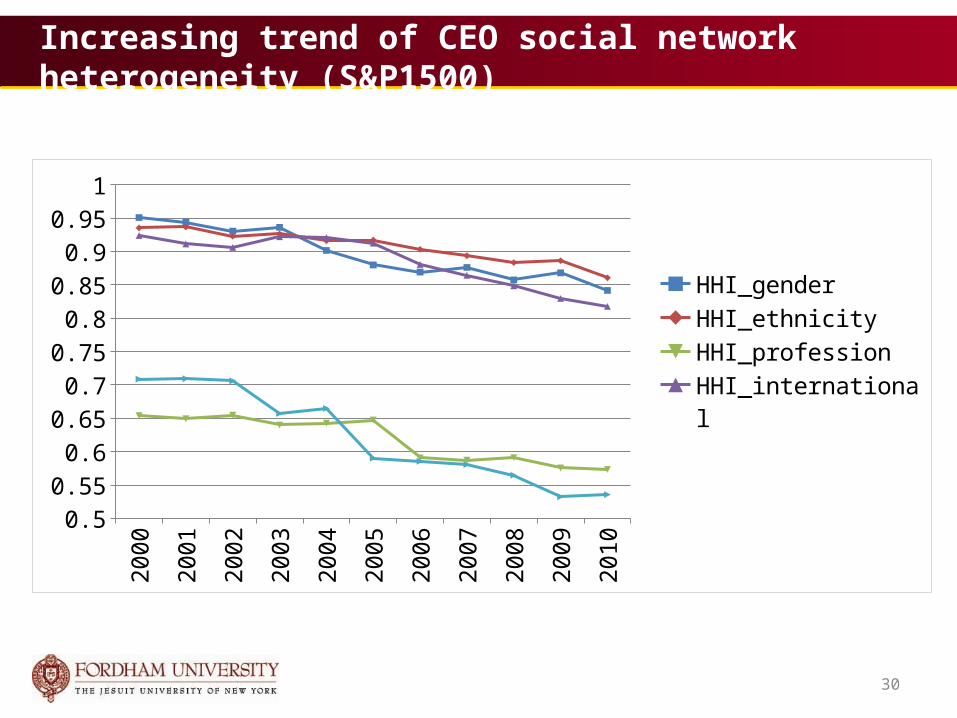
Increasing trend of CEO social network heterogeneity (S&P1500)
2000
2001
2002
2003
2004
2005
2006
2007
2008
2009
2010
0.50.55
0.60.65
0.70.75
0.80.85
0.90.95
1
HHI_genderHHI_ethnicityHHI_professionHHI_internationalHHI_education
30

Table 1: summary statistics of CEO social network heterogeneity
(HHI measures)
Panel A: By Industry 1-digit SIC
SIC1 HHI-demographic HHI-intellectual HHI-profession HHI-international HHI-overall
0 0.880 0.825 0.695 0.669 0.7041 0.935 0.761 0.611 0.675 0.6972 0.898 0.732 0.611 0.666 0.6823 0.916 0.757 0.622 0.670 0.6915 0.923 0.777 0.659 0.670 0.7047 0.919 0.761 0.614 0.672 0.6848 0.909 0.754 0.639 0.671 0.702
Panel B: By High tech (High tech=1 if SIC2=48, SIC2=73, SIC3==283)
High Tech HHI-demographic HHI-intellectual HHI-profession HHI-international HHI-overall
0 0.916 0.756 0.629 0.670 0.6941 0.908 0.753 0.604 0.668 0.678
Panel C: By R&D (R&D=1 if R&D expenditure>0)
R&D HHI-demographic HHI-intellectual HHI-profession HHI-international HHI-overall
0 0.923 0.770 0.639 0.673 0.7011 0.908 0.745 0.613 0.668 0.684
Panel D: By foreign business (Multinational=1 if foreign revenue>0)
Multinational HHI-demographic HHI-intellectual HHI-profession HHI-international HHI-overall
0 0.927 0.782 0.645 0.676 0.7031 0.905 0.734 0.607 0.666 0.682
CEOs of high tech-, R&D, and multinational firms tend to have lower HHI (higher heterogeneity).

Other variables• Size of the network• Various firm characteristics
– Size, leverage, capx, cash flow, R&D, Tobin’s Q, innovation, foreign sale growth
• Board diversity– Female ratio and minority ratio
• CEO characteristics– Age, gender, ethnicity, education background, and past work
experience
• CEO turnover– CAR, outside hire/inside hire, past experience
• M&A characteristics– CAR, BHAR, Run-up, diversified M&A, tender offer, payment
method, relative size, target type, acquirer financial variables

33
Sample description—Firm characteristics
Firm and board characteristics
Variable N Mean S.D Min Median MaxQ 14259 2.041 1.328 0.603 1.609 10.739Size (million) 14259 3024.073 5810.793 5.951 855.341 40877.000
Leverage 14259 0.204 0.188 0.000 0.178 0.987
Capex 14259 0.047 0.044 0.001 0.033 0.305Total capital expenditure ratio 16856 0.155 0.147 0.004 0.111 0.979
Acquisition expenditure ratio 10108 0.102 0.244 0.000 0.030 8.338Cashflow 14259 0.132 0.165 -0.996 0.156 0.516R&D intensity 14259 0.054 0.093 0.000 0.013 0.737HiTecPharma 14259 0.214 0.410 0.000 0.000 1.000Multinational 14259 0.566 0.496 0.000 1.000 1.000Innovation (patent) 2944 59.404 148.570 1.000 13.000 1843.000Foreign sales growth 8471 0.112 1.381 -7.319 0.081 7.696
Board female ratio 14259 0.091 0.094 0.000 0.100 0.800Board minority ratio 14259 0.067 0.139 0.000 0.000 0.800

34
Sample description—CEO characteristics
CEO characteristics
Variable N Mean S.D Min Median MaxAge 9147 55.754 7.261 31.000 56.000 91.000Female CEO 9147 0.031 0.174 0.000 0.000 1.000Minority CEO 9147 0.006 0.079 0.000 0.000 1.000MBA 9147 0.361 0.480 0.000 0.000 1.000PhD 9147 0.153 0.360 0.000 0.000 1.000Ivy school graduate 9147 0.156 0.363 0.000 0.000 1.000
Work mobility 9147 4.858 2.798 1.000 4.000 26.000Oversea experience 9147 0.043 0.220 0.000 0.000 2.000
CEO social network measures
Het-demographic 14259 1.119 0.153 1.000 1.043 2.000Het-intellectual 14259 1.439 0.276 1.000 1.462 2.419Het-profession 14259 1.760 0.397 1.000 1.641 2.978
Het-international 14259 1.511 0.139 1.000 1.474 2.228Het_overall1 14259 1.457 0.167 1.100 1.459 2.130
Centrality 14157 0.0004 0.0003 0.0000 0.0003 0.0049

Endogeneity concerns
• The relationships between CEO SNH and firm value can be spurious due to the possibility that– (1) better performing firms can provide CEOs
opportunities to meet more people and different people (reverse causality)
– (2) certain firm characteristics can simultaneously affect CEOs’ choice of social network and firm value (simultaneity bias).
• We employ several methods to address this issue.
CEO SNH and Firm Value: Simultaneous Equations Approach
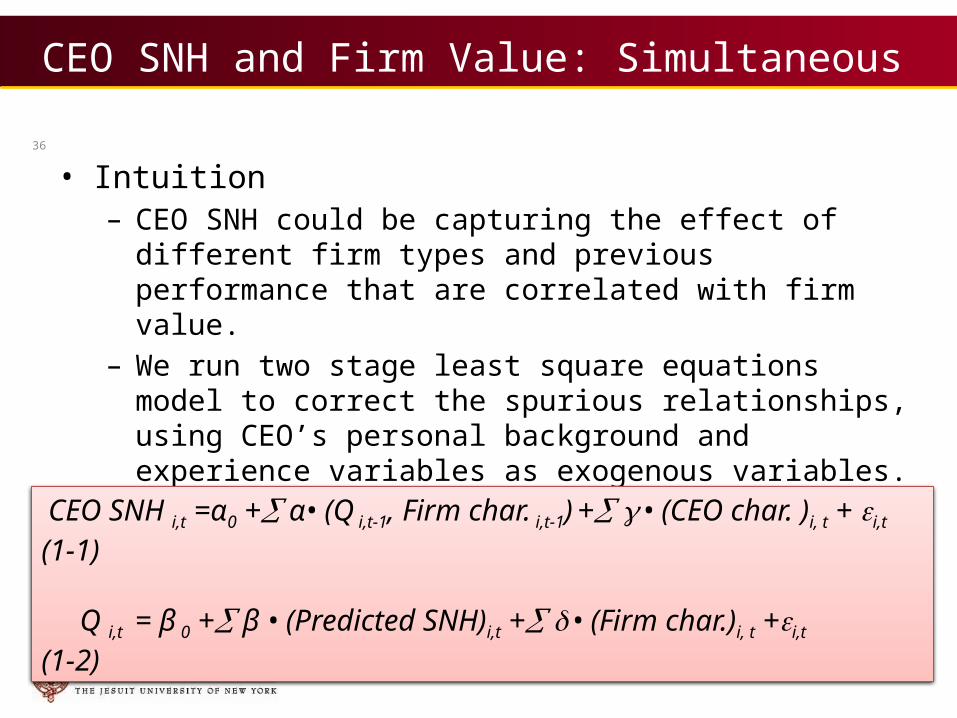
• Intuition– CEO SNH could be capturing the effect of different firm types and
previous performance that are correlated with firm value. – We run two stage least square equations model to correct the
spurious relationships, using CEO’s personal background and experience variables as exogenous variables.
• Model specification:
36
CEO SNH i,t =α0 + α• (Q i,t-1, Firm char. i,t-1) + • (CEO char. )i, t + i,t (1-1)
Q i,t = β 0 + β • (Predicted SNH)i,t + • (Firm char.)i, t +i,t (1-2)

37
Baseline model: 1ststage- Determinants of CEO network heterogeneity (1) (2) (3) (4) (5)
VARIABLES Het - demographic Het - intellectual Het - profession Het - international Het - overall
Firm characteristics (t-1)Log(assets) 0.010*** 0.040*** 0.026*** 0.004*** 0.021***Leverage -0.014 -0.055*** -0.046* -0.015* -0.034***Tobin's Q 0.002 0.005** 0.008** 0.005*** 0.006***Capextoasset -0.008 -0.095 0.184* -0.054 0.006Cashflow -0.007 -0.022 0.016 0.030** 0.005RDtoasset 0.049* 0.213*** 0.323*** 0.002 0.147***High tech 0.018** 0.006 0.132*** 0.011* 0.042***Multinational -0.001 -0.008 0.036*** -0.001 0.007*Board female ratio 0.054*** 0.058* -0.122** 0.039** 0.010Board minority ratio 0.109*** 0.005 -0.032 0.013 0.024**CEO characteristicsCentrality 9.056 136.326*** 80.988*** 5.979 58.087***Female 0.042*** 0.084*** 0.026 0.027*** 0.045***Minority 0.023 0.038 0.171*** 0.052*** 0.071***Log (age) -0.001*** 0.000 -0.003*** -0.000 -0.001***MBA 0.027*** 0.057*** 0.053*** 0.081*** 0.054***PhD 0.020*** 0.138*** 0.036*** 0.098*** 0.073***Ivy school graduate 0.084*** -0.067*** 0.008 0.014*** 0.010**Work mobility 0.002*** 0.015*** 0.027*** 0.002*** 0.011***Oversea experience 0.055*** -0.003 -0.011 0.017** 0.014*Constant 1.102*** 0.988*** 1.376*** 1.360*** 1.207***Year dummies Yes Yes Yes Yes YesIndustry dummies Yes Yes Yes Yes YesObservations 8,430 8,430 8,430 8,430 8,430Adjusted R-squared 0.115 0.204 0.101 0.139 0.208

38
Baseline model: 2nd Stage: CEO network heterogeneity and firm value (1) (2) (3) (4) (5) (6) (7) (8)VARIABLES Tobin's Q Tobin's Q Tobin's Q Tobin's Q Tobin's Q Tobin's Q Tobin's Q Tobin's QNetwork char Het_demographic 1.697***Het_intellectual 0.725***Het_profession 1.155***Het_international 2.430***Het_overall 2.180*** 2.432*** 2.216*** 2.386***
Centrality 203.096*** 99.195** 51.628** 192.154*** 26.529** 19.278 25.855 40.083Interaction with CEO charHet_overall*MaleCEO 2.698***Het_overall*AmericanCEO 2.122***Het_overall*NonIvySchoolCEO 1.986***Firm characteristics (t-1)Log(assets) -0.094*** -0.104*** -0.103*** -0.100*** -0.120*** -0.126*** -0.120*** -0.116***Leverage -0.639*** -0.650*** -0.637*** -0.627*** -0.618*** -0.595*** -0.618*** -0.618***Capextoasset 0.802*** 0.897*** 0.598* 0.881*** 0.761** 0.702** 0.794*** 0.786***Cashflow 2.104*** 2.122*** 2.097*** 2.003*** 2.102*** 2.110*** 2.100*** 2.115***RDtoasset 5.292*** 5.226*** 4.998*** 5.303*** 5.004*** 4.966*** 5.010*** 5.058***High tech 0.401*** 0.406*** 0.262*** 0.365*** 0.312*** 0.300*** 0.309*** 0.288***Multinational -0.088*** -0.079*** -0.129*** -0.089*** -0.103*** -0.108*** -0.104*** -0.109***Board female ratio 0.508*** 0.586*** 0.776*** 0.458*** 0.567*** 0.646*** 0.568*** 0.561***Board minority ratio -0.021 0.165** 0.194** 0.110 0.096 0.096 0.092 0.093MaleCEO -3.958***AmericanCEO -3.295***NonIvySchoolCEO -2.912***Constant 0.644* 1.730*** 0.924*** -0.919** -0.179 -0.496 -0.232 -0.557Year dummies Yes Yes Yes Yes Yes Yes Yes YesIndustrydummies Yes Yes Yes Yes Yes Yes Yes YesObservations 8,430 8,430 8,430 8,430 8,430 8,430 8,430 8,430Adjusted R-squared 0.191 0.215 0.110 0.182 0.174 0.159 0.172 0.171

39
Exploring economic significance
CEO SNH Coefficients% increase in
Tobin's Q
Dollar amount (mil) increase in market value as a result of 10% increase in CEO SHN
Calculation
Het-demographic 1.679*** 9.21% 278.5[10% * Mean (Het-demographic) * β (Het-demographic) / Mean (Q)]*Assets = (0.1*1.119*1.679/2.041)*3024.073=278.5
Het-intellectual 0.725*** 5.11% 154.6[10% * Mean (Het-intellectual) * β (Het-intellectual) / Mean (Q)]*Assets = (0.1*1.439*0.725/2.041)*3024.073=154.6
Het-profession 1.155*** 9.95% 301.2[10% * Mean (Het-profession) * β (Het-professional) / Mean (Q)]*Assets = (0.1*1.760*1.155/2.041)*3024.073=301.2
Het-international 2.430*** 17.99% 554.0[10% * Mean (Het-international) * β (Het-international) / Mean (Q)]*Assets = (0.1*1.511*2.430/2.042)*3024.073=554.0
Het-overall 2.180*** 15.56% 407.6[10% * Mean (Het-overall) * β (Het-overall) / Mean (Q)]*Assets = (0.1*1.457*2.180/2.042)*3024.073=407.6
Centrality 203.096** 3.98% 12.0[10% * Mean (Centrality) * β (Centrality) / Mean (Q)]*Assets = (0.1*0.0004*203.096/2.041)*3024.073=12

CEO SNH and firm value: IV approach
• Our identification strategy– Exogenous changes in CEO social networks which are
unrelated to firm performance – IV: number of death and retirement of directors (or
senior managers) to whom the testing CEO is connected (Fracassi and Tate, 2011)
• Model specification
40
CEO SNHi,t =α0 + α• (Deceased or retired network ties)i,t+ •(Firm char)I, t+i,t
Q i,t = β 0 + β • (Predicted SNH )i,t + • (Firm char.)i, t-1 +i,t

41
Results on IV Regressions (1) (2) (3) (4) (5)
VARIABLES Het - demographic TobinQ Het -
intellectual TobinQ Het - profession TobinQ Het -
international TobinQ Het - overall TobinQ
IV: death and retirement -0.021*** -0.086*** -0.166*** -0.019*** -0.070***
Het_demographic 7.334**
Het_intellectual 1.213*
Het_profession 0.690*
Het_international 7.983**
Het_overall 1.740*Firm characteristics (t-1)
Log(assets) -0.001 -0.047** 0.035*** -0.095*** 0.016*** -0.054*** 0.002 -0.070*** 0.013*** -0.069***
Leverage -0.011 -0.727*** -0.018 -0.779*** 0.020 -0.827*** -0.017 -0.679*** -0.015 -0.748***
Capextoasset 0.023 0.964* -0.091 1.181*** 0.145 1.209*** 0.015 1.013* 0.032 0.995**
Cashflow -0.001 2.080*** -0.070** 1.964*** -0.058 1.931*** 0.012 1.975*** -0.012 2.204***
RDtoasset 0.037 5.080*** 0.219*** 4.779*** 0.185** 5.164*** 0.024 5.178*** 0.187*** 5.388***
High tech 0.023** 0.396*** 0.023 0.507*** 0.134*** 0.479*** 0.027*** 0.345** 0.050*** 0.432***
Multinational 0.004 -0.116** -0.002 -0.096*** 0.018 -0.099*** 0.004 -0.118** 0.005 -0.103***Networksize 0.064*** -0.414* 0.136*** -0.093 0.186*** -0.068 0.046*** -0.307* 0.082*** -0.077
Board female ratio 0.034 0.223 0.062 0.488** -0.092 0.604*** 0.039 0.163 0.025 0.370Board minority ratio 0.096*** -0.491 0.032 0.268* 0.043 0.152 0.029 -0.022 0.059*** 0.124
Constant 0.992*** -4.946 0.784*** 1.334** 0.989*** 1.475*** 1.376*** -8.652 1.113*** 0.223Year dummies Yes Yes Yes Yes Yes Yes Yes Yes Yes YesIndustry dummies Yes Yes Yes Yes Yes Yes Yes Yes Yes YesObservations 14,429 14,429 16,191 16,191 15,404 15,404 14,389 14,389 12,157 12,157Adjusted R-squared 0.233 -0.395 0.342 0.166 0.242 0.188 0.137 -0.417 0.310 0.199

Event study on CEO turnover
• The CEO turnover event provides a good setting to see market’s immediate reaction to the change of CEO
• Controlling for everything else, we relate announcement CAR of new CEO appointment to the change of SN between the new CEO and previous CEO.
• After matching with ExecuComp turnover data, we identify 114 turnover events with complete information on SN for both new CEO and old CEO.
42

Table 8: Investor Response to CEO Appointment Announcement
Panel A. Matching on firm characteristics and CEO characteristics
Variable Name
Group 1: New CEO has more heterogeneous network than the old
CEO
Group 2: New CEO has less heterogeneous
network than the old CEO Diff. T-stat
Firm characteristicsSize 7.369 7.609 -0.240 0.910Leverage 0.166 0.201 -0.035 1.099Capex 0.036 0.038 -0.003 0.498Cashflow 0.165 0.174 -0.170 0.474R&D intensity 0.048 0.040 0.007 0.754HiTecPharma 0.246 0.211 0.035 0.443Multinational 0.807 0.807 0.000 0.000CEO characteristicsExperience as CEO 0.053 0.018 0.035 1.014Outside hire 0.596 0.596 0.000 0.000
Panel B: Comparison of announcement CARCAR (-1,1) 0.016* -0.008 0.023** 1.742CAR (-2,2) 0.018* -0.009 0.027** 2.086CAR (-5,5) 0.032** 0.001 0.031* 1.754
43
Panel A shows that there are no significant differences among firm characteristics and new CEO characteristics
Panel B shows that when the new CEO has more heterogeneous networks than the old CEO, market reactions are significantly higher.

44
Exploring potential channels Channel 1: Innovation
Individual differences and intellectual diversity promote creativity
Channel 2: New Revenue Generation Exposure to different cultural and international experiences
allow managers to better understand the global market. Channel 3: Better Investment (Investment
Efficiency and M&A) Knowledge and information obtained from people working in
different professions and industries Channel 4: Lower Cost of Financing
Bank value relationships and CEO can draw different resources from his or her network.
44

45
Testing Channel 1: Innovation Model specification:
Rationale: if CEO SNH impacts firm value through innovation, we expect to find (1) Heterogeneity increases innovation (2) Innovation increases firm value (3) Controlling for innovation, the impact of heterogeneity on
firm value is weakened.
Procedure: We examine individual heterogeneity indices in addition to the aggregated heterogeneity index.
45
CEO SNHi,t =α0 + α• (Deceased or retired network ties)i,t+ •(Firm char)i, t+i,t (3-1) Innovation i,t =α0 +α• (Predicted SNH)i,t + • (Firm char)i, t + i,t (3-2)Q i,t = β 0+ β •(Innovation)i,t-1+ α•(Predicted SNH)i,t+ •(Firm char.)i t +i,t (3-3)

Table 9: Regression results relating innovation channel
MODELSimultaneous equations on
overall heterogeneity, innovation, and Tobin's Q
Simultaneous equations on intellectual heterogeneity, innovation, and Tobin's Q
Simultaneous equations on professional heterogeneity,
innovation, and Tobin's Q
(1) (2) (3) (4) (5) (6)
Log (patent) Tobin's Q Log (patent) Tobin's Q Log (patent) Tobin's Q
Het-overall-hat 5.183*** 1.636
Het-intellectual-hat 4.414*** 1.430
Het-profession-hat 1.229*** 0.667
Log (patent) t-1 0.025** 0.025** 0.028***
Firm characteristics (t-1)
Log(assets) 0.434*** -0.125*** 0.354*** -0.153*** 0.502*** -0.111***
Leverage -0.569*** -0.529*** -0.647*** -0.556*** -0.698*** -0.578***
Capextoasset -0.901 2.685*** -0.284 2.960*** -0.998* 2.677***
Cashflow 0.477*** 1.491*** 0.719*** 1.581*** 0.521*** 1.527***
RDtoasset 3.012*** 3.816*** 3.104*** 3.856*** 3.614*** 3.967***
High tech -0.632*** 0.512*** -0.547*** 0.535*** -0.463*** 0.546***
Networksize -0.248*** -0.084 -0.375*** -0.127 -0.075 -0.075
Board female ratio 0.091 0.986*** 0.046 0.972*** 0.343 1.111***
Board minority ratio 0.490*** -0.127 0.568*** -0.097 0.708*** -0.052
Constant -6.896*** 0.946 0.000 0.000 -2.584*** 1.588**
Year dummies Yes Yes Yes Yes Yes Yes
Industry dummies (SIC1) Yes Yes Yes Yes Yes Yes
Observations 6,220 6,220 6,220 6,220 6,220 6,220
Adjusted R-squared 0.388 0.212 0.388 0.212 0.386 0.212
46
Column(1) shows that overall CEO SHN significantly increases innovation. Column(2) shows that after controlling for patent channel, the effect of heterogeneity becomes weakened.
Same effects are found for intellectual heterogeneity and professional heterogeneity. So, the innovation channel is more pronounced for these two types of heterogeneity.

47
Testing Channel 2: Foreign revenue generation Model specification:
If CEO SNH impacts firm value through foreign sale, we expect to find (1) CEO SNH increases foreign sale growth (2) Foreign sale growth increases firm value (3) Controlling for foreign sale growth, the impact of
heterogeneity on firm value is weakened.
We repeat the analysis for individual heterogeneity indices in addition to the aggregated heterogeneity index.
47
CEO SNHi,t =α0 + α• (Deceased or retired network ties)i,t+ •(Firm char)i, t+i,t (4-1) Foreign sale growth i,t =α0 + α• (Predicted SNH)i,t + • (Firm char)i, t + i,t (4-2)Qi,t =β 0+ β•(Foreign sale growth)i,t-1+α•(Predicted SNH)i,t+ •(Firm char.)it,+i,t (4-3)

Table 10: Regression results relating foreign sale channel
48 MODELSimultaneous equations on
overall heterogeneity, foreign sale growth, and Tobin's Q
Simultaneous equations on demographic heterogeneity, foreign
sale growth, and Tobin's Q
Simultaneous equations on international heterogeneity, foreign
sale growth, and Tobin's Q
(1) (2) (3) (4) (5) (6)
VARIABLESForeign sale
growth Tobin's Q Foreign sale growth Tobin's Q Foreign sale growth Tobin's Q
Het-overall-hat 2.061* 0.974Het-demographic-hat 6.769* 3.200Het-international-hat 4.091* 1.934Foreign sale growth (t-1) 0.080*** 0.080*** 0.080***Firm characteristics (t-1)Log(assets) -0.062*** -0.016 -0.038*** -0.005 -0.044*** -0.008Leverage -0.100 -0.877*** -0.066 -0.861*** -0.079 -0.867***Capextoasset -0.019 -2.308*** -0.087 -2.340*** 0.044 -2.278***Cashflow -0.896*** 5.446*** -1.272*** 5.268*** -1.165*** 5.319***RDtoasset -1.224* 5.044*** -1.421* 4.951*** -0.759* 5.263***High tech -0.005 0.486*** 0.168* 0.568*** -0.016 0.481***Networksize -0.130* -0.019 -0.404* -0.149 -0.173* -0.040Board female ratio -0.401** 0.550*** -0.646*** 0.434** -0.617*** 0.447**
Board minority ratio 0.062 0.239** -0.772 -0.156 0.049 0.233**Constant -1.183 0.483 -5.371 -1.497 -4.128 -0.909Year dummies Yes Yes Yes Yes Yes Yes
Industry dummies (SIC1) Yes Yes Yes Yes Yes YesObservations 5,091 5,091 5,091 5,091 5,091 5,091Adjusted R-squared 0.038 0.330 0.038 0.330 0.038 0.330
Column(1) shows that overall CEO SHN significantly increases foreign sale growth. Column(2) shows that after controlling for foreign sale channel, the effect of heterogeneity becomes weakened.
Same effects are found for demographic heterogeneity and international heterogeneity. So, the channel is more pronounced for these two types of heterogeneity.

Testing Channel 3: Investment Efficiency
• Model specification – Estimating the investment equation (Fazarri et al., 1988)
– Estimating the interaction between investment-Q sensitivity and CEO SNH
• Rationale:– Tobin (1969) shows that marginal q is a predictor of investment. This means that b1
in equation (5) should be positive. Durnex et al. (2004 JF) argue that higher marginal q suggests higher investment efficiency.
– Chen et al. (2007RFS) estimate investment-Q sensitivity and show that information content of a stock increases investment efficiency.
– Following similar approach as Chen et al. (2007), we argue that if CEO SNH enhances investment efficiency, the interaction term β3 should be positive.
Ii,t/TAi,t-1= β0 + β1Qi,t-1 + β2(CFi,t /TAi,t-1)+ •(Firm fixed effects)i, t +i,t (5)
Ii,t/TAi,t-1= β0 + β1Qi,t-1 + β2(CFi,t /TAi,t-1)+ β3Qi,t-1 *CEO SNH (predicted) + β4CEO SNH (predicted) + β5(Firm fixed effects) + i,t (6)

Table 11: CEO SNH and Investment Efficiency
(1) (2) (3) (4)
VARIABLEStotal capital
expenditure ratiototal capital
expenditure ratioacquisition
expenditure ratioacquisition
expenditure ratio Het-overall-hat 1.088 ` 2.231
(1.410) (1.534)Het-overall-hat * Tobin's Q (t-1) 0.299*** 1.043***
(2.739) (3.529)Tobin's Q (t-1) 0.021*** 0.022*** 0.026*** 0.042***
(11.368) (8.769) (3.693) (4.731)Inverse logasset (t-1) 1.884*** 1.863*** 5.490** 2.481
(6.733) (4.022) (2.083) (0.861)Leverage (t-1) -0.166*** -0.188*** -0.385*** -0.438***
(-10.258) (-8.640) (-9.178) (-7.967)Cash flow (t-1) 0.017 0.001 0.274*** 0.174*
(0.873) (0.031) (3.529) (1.928)Constant 0.137*** 0.131*** 0.064** 0.089***
(15.976) (9.575) (2.243) (2.848)Firm fixed effect Yes Yes Yes YesObservations 9,788 7,820 6,386 5,265Number of firms 2,375 2,099 1,814 1,612Adjusted R-squared 0.086 0.078 0.098 0.098
Column (1) is the investment equation. The positive coefficient of Q on investment is consistent with Tobin (1969).
Column (2) finds that the interaction term is positive and significant, which means that higher CEO SNH increases investment efficiency.
In Column (3) and (4) we repeat the same analysis for acquisition expenditure because it is often inefficient.
We find that the positive effect of CEO SNH on investment efficiency is strongly significant for acquisition investment.

Table 12: Regressions on CEO SNH and M&A Performance
51
(1) (2) (3) (4)VARIABLES CAR[-2,2] CAR[-2,2] BHAR- 3year BHAR- 3year Het-overall-hat 0.298** 0.266** 4.461* 5.205*
Het-overall-hat* Diversifying M&A 0.009** 1.963**Deal characteristicsAll stock payment -0.020** -0.019** 0.003 0.008Mix cash and stock payment 0.003 0.003 -0.023 -0.026Private target -0.006 -0.004 -0.062 -0.074Public target -0.030*** -0.028*** -0.215** -0.238**Tender offer 0.019 0.018* 0.142 0.169Relative size -0.476 -2.586 331.354** 345.398**Diversifing M&A -0.018*** -3.021**Acquirer characteristicsLog (assets) -0.013** -0.012** -0.063 -0.096Leverage 0.063*** 0.062*** 0.506** 0.586**Market to book -0.003 -0.003 -0.048 -0.062*Run-up 0.018 0.018 0.007 -0.031Sale growth -0.008 -0.009 -0.100 -0.064ROA 0.104*** 0.092** 0.790 0.992Board female ratio 0.041 0.042 -0.739** -0.788*Board minority ratio 0.003 0.007 -0.123 -0.217Constant -0.393** -0.353** -5.720* -6.299*Year dummies Yes Yes Yes YesIndustry dummies Yes Yes Yes YesObservations 3,757 3,781 3,781 3,757Adjusted R-squared 0.023 0.059 0.060 0.023
Column (1) and (2) examine market reaction around 5 days of M&A announcement for acquirers.
We find strong evidence that CEO SNH is positively associated with M&A announcement returns, especially for diversified M&As.
Column (3) and (4) examine long-run post-merger performance of acquirers, measured by buy and hold abnormal returns over 3-year window.
We find that CEO SNH is also positively associated with M&A performance in the long run, especially for diversified M&As.

52
Testing the channel of cost of financing
Match Syndicate loan data with our sample.
We investigate the cost of financing by borrowing firms as reported in these syndicate loan data. We focus on the variability of loan rate, collateral used and covenants attached to these loans.
We find that CEOs with diverse social connections receive cheaper loans, need lower collateral, and experience lower intensity of covenants.
52

53
Table 13: CEO network diversity and bank loan contracts (1) (2) (3)
VARIABLES Log (spread) collateral covenant intensity
Het_overall -0.234* -1.580*** -0.307*(-1.675) (-3.213) (-1.646)
Total assets (log) -0.166*** -0.491*** -0.123***(-10.264) (-8.506) (-5.444)
Market to book -0.177*** -0.076 -0.071***(-10.892) (-1.219) (-3.116)
Book leverage 0.894*** 2.694*** 0.458***(9.763) (7.927) (3.791)
Profitability -1.280*** -8.325*** -0.012(-4.550) (-6.428) (-0.040)
Altman_Z -0.036** -0.115** 0.044(-2.494) (-2.077) (0.307)
Rating -0.022*** 0.011 0.004(-4.614) (0.668) (0.617)
Loansize (log) -0.070*** -0.086 0.099***(-4.525) (-1.549) (4.786)
Maturity (log) 0.106*** 0.623*** 0.010(4.945) (8.337) (0.350)
Collateral 0.599*** 1.133***(20.068) (5.077)
Syndication -0.138 -0.044 -0.842***(-0.908) (-0.137) (-12.964)
Constant 5.732*** 3.682*** 0.321(22.315) (3.670) (0.718)
Year and industry dummy Yes Yes YesObservations 2,395 1,653 2,395R-squared 0.639 0.329Pseudo R-squared 0.244
53
Key findings: CEOs with heterogeneous social networks are able to obtain bank loans with lower interest rates, less likelihood of having collaterals, and less stringent covenants. Key findings: CEOs with heterogeneous social networks are able to obtain bank loans with lower interest rates, less likelihood of having collaterals, and less stringent covenants.

Conclusions
• We find that CEOs with diverse social connections (e.g. demographic, intellectual, profession, foreign exposure) create higher value to firms.
• We also identify the channels and find that the diverse social network adds value through innovation, new revenue generation, better investment decisions and lower cost of funding.
• These results overall are consistent with the notion that greater heterogeneity allows for transfer of different knowledge, expertise, and problem-solving skills between connected people and companies, which is value-added to the firm.
54

Implications• Current-day CEOs could benefit from a broader set of
knowledge to response to the innovations in the new products and increased competitive business pressure in the market.
• Our findings suggest that a diverse social network provide a CEO with exposures to different information and resources, which ultimately improves managerial performance.
• Given the changing face of workforce and the increasing competition from international markets, corporate management needs to think about how diversity of social networks can be value-added for the company.
55


