Final Recommendations on the Update Factors for FY 2019
Final Recommendations on the Update Factors for FY 2019
June 13, 2018
Health Services Cost Review Commission 4160 Patterson Avenue
Baltimore, Maryland 21215 (410) 764-2605
FAX: (410) 358-6217
This document reflects the Final Recommendation on the Update Factors for FY 2019 as ultimately approved by the Commission on June 13, 2018.
Final Recommendations on the Update Factors for FY 2019
Table of Contents
List of Abbreviations .................................................................................................................... 1
Changes from Draft to final .......................................................................................................... 2
Introduction and Background ....................................................................................................... 2
AssessmentS ................................................................................................................................. 3
Overview of Final Update Factors Recommendations ........................................................... 3
Calculation of the Inflation/Trend Adjustment for Global and Non-Global Revenues .......... 3
Summary of Other Policies Impacting RY 2019 Revenues .................................................... 4
Central Components of Revenue Change Linked to Hospital Cost Drivers/Performance
........................................................................................................................................... 6
Central Components of Revenue Offsets with Neutral Impact on Hospital Financial
Statements ......................................................................................................................... 9
Additional Revenue Variables .......................................................................................... 9
Shifts to Unregulated ........................................................................................................ 9
Consideration of All-Payer Model Agreement Requirements ................................................ 11
All-Payer Financial Test ................................................................................................... 11
Medicare Financial Test .................................................................................................... 12
Consideration of National Cost Figures .................................................................................. 13
Medicare’s Proposed National Rate Update for FFY 2019 .............................................. 13
Meeting Medicare Savings Requirements and Total Cost of Care Guardrails ................. 14
Stakeholder Input .................................................................................................................... 17
Recommendations ......................................................................................................................... 22
Preparation for the Total Cost of Care Model Effective January 1, 2019 .................................... 23
Maryland Primary Care Program Care Management Fees ............................................... 23
Updated Hospital Contract ................................................................................................ 23
Changes to the Annual Update ......................................................................................... 24
Appendix I. Supplemental Information on Rising Cost of Hospital Drugs .................................. 25
Appendix II. Stakeholder comment letters .................................................................................. 26

Final Recommendations on the Update Factors for FY 2019
1
LIST OF ABBREVIATIONS
ACA Affordable Care Act
ACO Accountable Care Organization
CMS Centers for Medicare & Medicaid Services
CY Calendar year
DSH Disproportionate Share Hospital
FFS Fee-for-service
FFY Federal fiscal year, refers to the period of October 1 through September 30
FY Fiscal year
GBR Global Budget Revenue
HSCRC Health Services Cost Review Commission
JHHS Johns Hopkins Health System
MACRA Medicare Access and Chip Reauthorization Act
MDPCP Maryland Primary Care Program
MHA The Maryland Hospital Association
MPA Medicare Performance Adjustment
PAU Potentially avoidable utilization
QBR Quality Based Reimbursement
RY Rate year, which is July1 through June 30 of each year
TCOC Total Cost of Care
UCC Uncompensated care

Final Recommendations on the Update Factors for FY 2019
2
CHANGES FROM DRAFT TO FINAL
This final recommendation adjusts the draft recommendation to include amounts for QBR,
estimated to be -0.38 percent, and the oncology drug adjustment, estimated to be 0.20 percent.
The total net value of these adjustments is -0.18 percent and is reflected in Table 2 on page
5. This recommendation also includes contract language relating to shifts to unregulated on page
9, staff responses to stakeholder input on page 17, and an overview on preparing for the Total
Cost of Care Model on page 22, which begins on January 1, 2019. Staff has indicated changes to
the draft by highlighting these areas in yellow.
The Commission voted to amend staff’s final recommendation and decrease the update for
Global Budget Revenues by 0.25 percent. This reduction has been removed from the gross
inflation amount and is reflected throughout the report.
INTRODUCTION AND BACKGROUND
The Maryland Health Services Cost Review Commission (HSCRC or Commission) has been
setting hospital payment rates for all payers since 1977. As part of this process, the HSCRC
updates hospitals’ rates and approved revenues on July 1 of each year to account for factors such
as inflation, policy related adjustments, other adjustments related to performance, and
settlements from the prior year.
On January 1, 2014, the Centers for Medicare & Medicaid Services (CMS) approved the
implementation of a new All-Payer Model in Maryland. The All-Payer Model aims to promote
better care, better health, and lower costs for all Maryland patients. In contrast to Maryland’s
previous Medicare waiver that focused on controlling increases in Medicare inpatient payments
per case, the All-Payer Model (Model) focuses on controlling increases in total hospital revenue
per capita. The Model established a cumulative annual limit on per capita revenue growth of 3.58
percent and a Medicare savings target of $330 million over the five-year Model period.
In order to meet the requirements of the All-Payer Model and assure that the annual update will
not result in a revenue increase beyond the 3.58 percent limit, the update process needs to
account for all sources of hospital revenue that will contribute to the growth of total Maryland
hospital revenues for Maryland residents. In addition, the HSCRC needs to consider the effects
of the update on the Model’s $330 million Medicare savings requirement and the total hospital
revenue that is set at risk for quality-based programs. While rates and global budgets are
approved on a fiscal year basis, the All-Payer Model revenue limits and Medicare savings are
determined on a calendar year basis. Therefore, the HSCRC must account for both calendar year
and fiscal year revenues when establishing the fiscal year updates.
It is important to note that the proposed update incorporates both price and volume adjustments
for revenues under global budgets. Thus, the proposed update should not be compared to a rate
update, which does not control for volume changes. It is also important to view the revenue
updates in the framework of gross and net revenue. Specially, beginning in calendar year 2014,
the expansion of Medicaid and other Affordable Care Act enrollment has reduced

Final Recommendations on the Update Factors for FY 2019
3
uncompensated care and in response the State has reduced several related hospital assessments.
The revenue reductions for uncompensated care and associated assessment reductions decrease
gross revenues, but they do not decrease net revenues. Therefore, the net revenue increases are
higher than gross revenue increases during these periods.
For rate year (RY) 2019, there are two categories of hospital revenue:
1. Hospitals under Global Budget Revenues, which are under the HSCRC’s full rate-setting
authority.
2. Hospital revenues for which the HSCRC sets the rates paid by non-governmental payers
and purchasers, but where CMS has not waived Medicare's rate-setting authority to
Maryland and, thus, Medicare does not pay on the basis of those rates. This includes
psychiatric hospitals and Mount Washington Pediatric Hospital.
The purpose of this report is to present analyses and make recommendations for the update
factors for RY 2019 for global revenues and non-global revenues.
ASSESSMENTS
Overview of Final Update Factors Recommendations
As described in detail below, for RY 2019, HSCRC staff is proposing a final update of 1.62
percent per capita for global revenues and a final update of 1.77 percent for non-global revenues.
Calculation of the Inflation/Trend Adjustment for Global and Non-Global Revenues
The calculation of the inflation/trend adjustment to Global Revenues and Non-Global Revenues,
including psychiatric hospitals and Mt. Washington Pediatrics, starts by using the gross blended
statistic of 2.57 percent growth1, which was derived by combining 91.20 percent of Global
Insight’s Fourth Quarter 2017 market basket growth of 2.70 percent with 8.80 percent of the
capital growth estimate of 1.20 percent, calculating to 2.57 percent. The Commission voted to
amend staff’s recommendation and decrease inflation by 0.25 percent for Global Budget
Revenues. As a result, the gross inflation decreased from 2.57 percent to 2.32 percent. The
proposed inflation/trend adjustment follows:
1 Any inflation increase published in Global Insights 2018 First Quarter data and used in this recommendation will
have a forecasting error applied.
Final Recommendations on the Update Factors for FY 2019
4
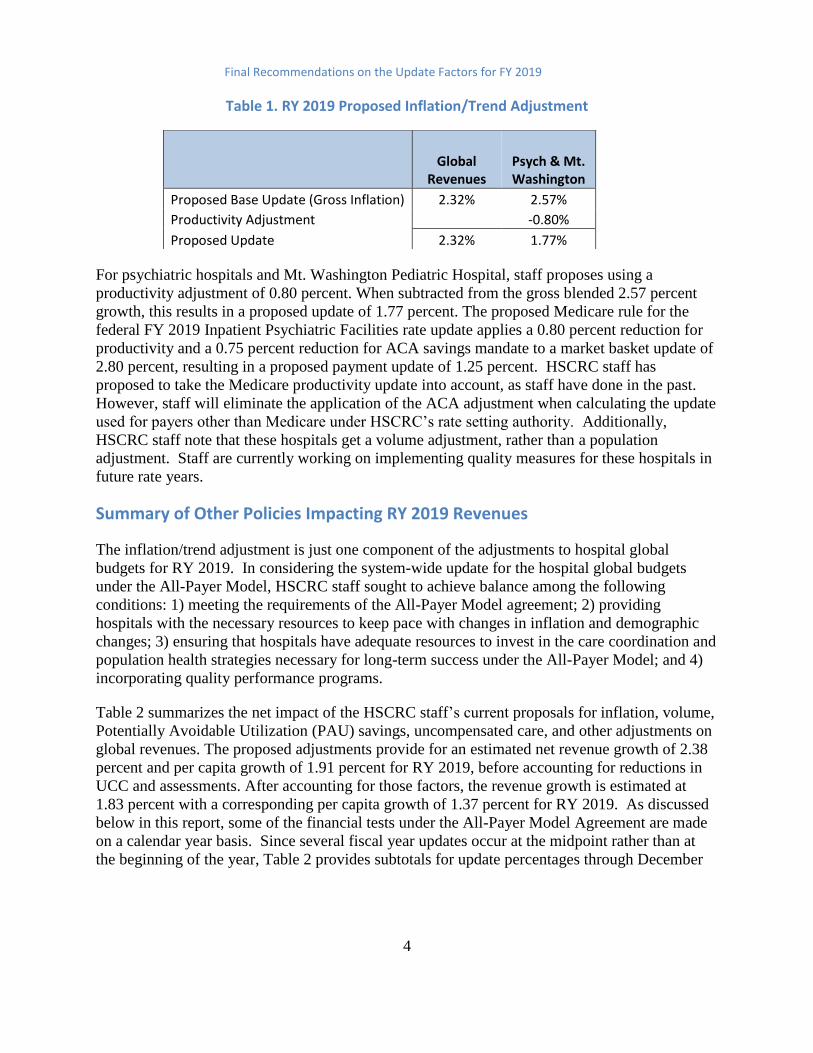
Table 1. RY 2019 Proposed Inflation/Trend Adjustment
For psychiatric hospitals and Mt. Washington Pediatric Hospital, staff proposes using a
productivity adjustment of 0.80 percent. When subtracted from the gross blended 2.57 percent
growth, this results in a proposed update of 1.77 percent. The proposed Medicare rule for the
federal FY 2019 Inpatient Psychiatric Facilities rate update applies a 0.80 percent reduction for
productivity and a 0.75 percent reduction for ACA savings mandate to a market basket update of
2.80 percent, resulting in a proposed payment update of 1.25 percent. HSCRC staff has
proposed to take the Medicare productivity update into account, as staff have done in the past.
However, staff will eliminate the application of the ACA adjustment when calculating the update
used for payers other than Medicare under HSCRC’s rate setting authority. Additionally,
HSCRC staff note that these hospitals get a volume adjustment, rather than a population
adjustment. Staff are currently working on implementing quality measures for these hospitals in
future rate years.
Summary of Other Policies Impacting RY 2019 Revenues
The inflation/trend adjustment is just one component of the adjustments to hospital global
budgets for RY 2019. In considering the system-wide update for the hospital global budgets
under the All-Payer Model, HSCRC staff sought to achieve balance among the following
conditions: 1) meeting the requirements of the All-Payer Model agreement; 2) providing
hospitals with the necessary resources to keep pace with changes in inflation and demographic
changes; 3) ensuring that hospitals have adequate resources to invest in the care coordination and
population health strategies necessary for long-term success under the All-Payer Model; and 4)
incorporating quality performance programs.
Table 2 summarizes the net impact of the HSCRC staff’s current proposals for inflation, volume,
Potentially Avoidable Utilization (PAU) savings, uncompensated care, and other adjustments on
global revenues. The proposed adjustments provide for an estimated net revenue growth of 2.38
percent and per capita growth of 1.91 percent for RY 2019, before accounting for reductions in
UCC and assessments. After accounting for those factors, the revenue growth is estimated at
1.83 percent with a corresponding per capita growth of 1.37 percent for RY 2019. As discussed
below in this report, some of the financial tests under the All-Payer Model Agreement are made
on a calendar year basis. Since several fiscal year updates occur at the midpoint rather than at
the beginning of the year, Table 2 provides subtotals for update percentages through December
Global
Revenues Psych & Mt. Washington
Proposed Base Update (Gross Inflation) 2.32% 2.57%
Productivity Adjustment -0.80%
Proposed Update 2.32% 1.77%
Final Recommendations on the Update Factors for FY 2019
5
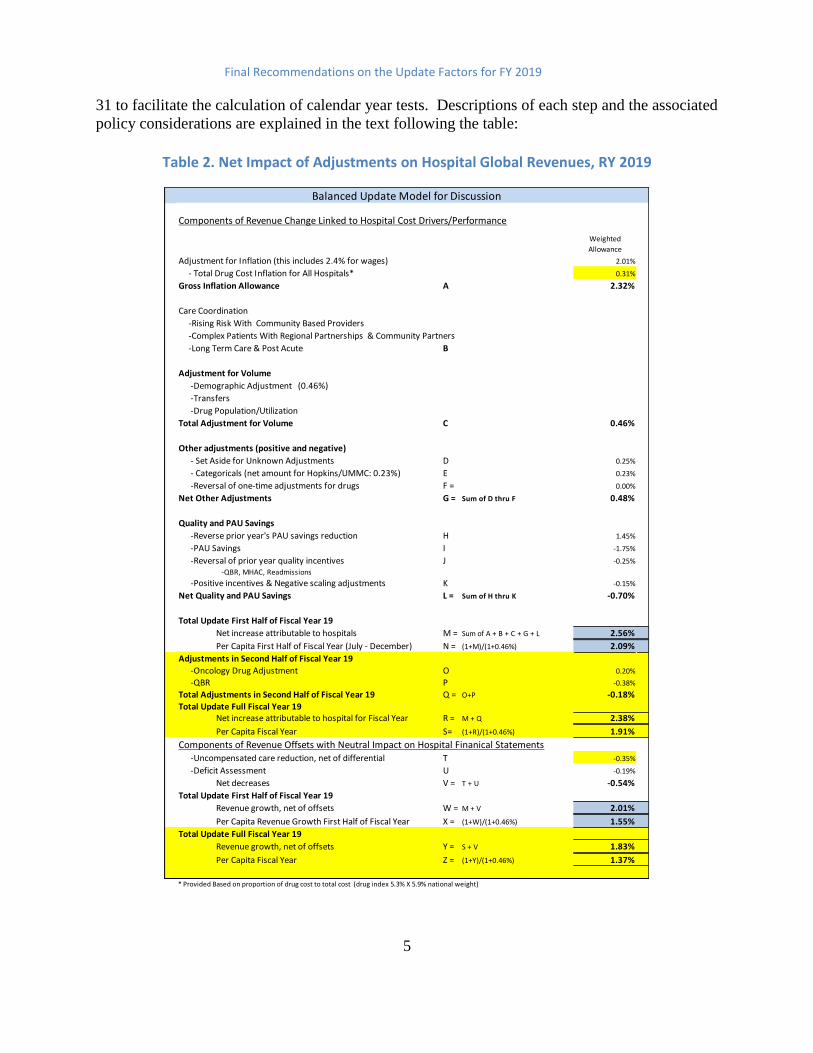
31 to facilitate the calculation of calendar year tests. Descriptions of each step and the associated
policy considerations are explained in the text following the table:
Table 2. Net Impact of Adjustments on Hospital Global Revenues, RY 2019
Components of Revenue Change Linked to Hospital Cost Drivers/Performance
Weighted
Allowance
Adjustment for Inflation (this includes 2.4% for wages) 2.01%
- Total Drug Cost Inflation for All Hospitals* 0.31%
Gross Inflation Allowance A 2.32%
Care Coordination
-Rising Risk With Community Based Providers
-Complex Patients With Regional Partnerships & Community Partners
-Long Term Care & Post Acute B
Adjustment for Volume
-Demographic Adjustment (0.46%)
-Transfers
-Drug Population/Utilization
Total Adjustment for Volume C 0.46%
Other adjustments (positive and negative)
- Set Aside for Unknown Adjustments D 0.25%
- Categoricals (net amount for Hopkins/UMMC: 0.23%) E 0.23%
-Reversal of one-time adjustments for drugs F = 0.00%
Net Other Adjustments G = Sum of D thru F 0.48%
Quality and PAU Savings
-Reverse prior year's PAU savings reduction H 1.45%
-PAU Savings I -1.75%
-Reversal of prior year quality incentives J -0.25%
-QBR, MHAC, Readmissions
-Positive incentives & Negative scaling adjustments K -0.15%
Net Quality and PAU Savings L = Sum of H thru K -0.70%
Total Update First Half of Fiscal Year 19
Net increase attributable to hospitals M = Sum of A + B + C + G + L 2.56%
Per Capita First Half of Fiscal Year (July - December) N = (1+M)/(1+0.46%) 2.09%
Adjustments in Second Half of Fiscal Year 19
-Oncology Drug Adjustment O 0.20%
-QBR P -0.38%
Total Adjustments in Second Half of Fiscal Year 19 Q = O+P -0.18%
Total Update Full Fiscal Year 19Net increase attributable to hospital for Fiscal Year R = M + Q 2.38%
Per Capita Fiscal Year S= (1+R)/(1+0.46%) 1.91%
Components of Revenue Offsets with Neutral Impact on Hospital Finanical Statements -Uncompensated care reduction, net of differential T -0.35%
-Deficit Assessment U -0.19%
Net decreases V = T + U -0.54%
Total Update First Half of Fiscal Year 19
Revenue growth, net of offsets W = M + V 2.01%
Per Capita Revenue Growth First Half of Fiscal Year X = (1+W)/(1+0.46%) 1.55%
Total Update Full Fiscal Year 19
Revenue growth, net of offsets Y = S + V 1.83%
Per Capita Fiscal Year Z = (1+Y)/(1+0.46%) 1.37%
* Provided Based on proportion of drug cost to total cost (drug index 5.3% X 5.9% national weight)
Balanced Update Model for Discussion

Final Recommendations on the Update Factors for FY 2019
6
Beginning in RY 2017, the HSCRC split the approved revenue for the year into two targets, a
mid-year target and a year-end target. Through this process, the HSCRC deferred a portion of
the update from one calendar year to the next. This deferral was meant to address a particularly
low federal Medicare update for FFY 2017, and also better matched the historic volume patterns
incurred by hospitals, with higher volumes through the winter months of January through March.
This revenue split more accurately matched historical volumes, and therefore the HSCRC staff
plans to continue this split. The staff will apply 49.73 percent of the Total Approved Revenue to
determine the mid-year target and the remainder of revenue will be applied to the year-end
target. Of note, there are a few hospitals that do not follow this seasonal pattern, particularly
Atlantic General Hospital. Thus, HSCRC staff will adjust the revenue split to accommodate their
normal seasonality.
Central Components of Revenue Change Linked to Hospital Cost Drivers/Performance
HSCRC staff accounted for a number of factors that are central provisions to the update process
and are linked to hospital costs and performance. These include:
Adjustment for Inflation: As described above, the inflation factor uses the gross
blended statistic of 2.57 percent. The gross inflation allowance is calculated using
Global Insight’s Fourth Quarter 2017 market basket growth of 2.70 percent with 8.80
percent of the capital growth 1.20 percent estimate As noted above, the Commission
amended the staff recommendation to decrease overall inflation by 0.25 percent for
Global Budget Revenues. As a result, the gross inflation decreased from 2.57 percent to
2.32 percent. A portion of the 2.32 inflation allowance (0.31 percent) will be allocated
to hospitals based on each hospital’s proportion of drug costs to total costs in order to
accurately provide revenues for increases in drug prices. This drug cost adjustment is
further discussed below.
Adjustments for Volume: Staff proposes a 0.46 percent adjustment that is equal to the
Maryland Department of Planning’s estimate of population growth for CY 2018.2
Hospital-specific adjustments will vary based on changes in the demographics of each
hospital’s service area. In the past, a portion of the adjustment was set aside to account
for growth in highly specialized services at Johns Hopkins Hospital and University of
Maryland Medical Center. Several workgroup members suggested funding these
increases through avoidable utilization reductions, rather than the demographic
adjustment. For RY 2019, the staff are proposing recognizing the full value of the 0.46
percent growth for the demographic adjustment to hospitals and accounting categoricals
cost separately in the formulation of the revenue increase. The demographic adjustment
2 See http://planning.maryland.gov/msdc/.

Final Recommendations on the Update Factors for FY 2019
7
has been criticized for providing revenue increases to hospitals that are experiencing
volume decreases. The HSCRC staff is working to analyze alternative approaches, but
the analysis will take time and require stakeholder and Commissioner input. There also
is a need for improved outpatient volume measures for cycle billed services and
expanded measures for avoidable and unnecessary utilization. The HSCRC staff is
actively working on improving outpatient volume measures. HSCRC staff has also
identified a need for better drug case-mix data submissions from hospitals to improve
the accuracy when recognizing volume changes of drugs utilized. These core
measurement improvements are building blocks necessary to improve policy analysis
and demographic adjustment changes while improving efficiency comparisons among
hospitals and other delivery settings. Also, with ICD-10 conversion and electronic
medical record conversions mostly complete, case-mix and volume measurements are
expected to become more stable.
Rising Cost of New Outpatient Drugs: The rising cost of drugs, particularly of new
physician-administered drugs in the outpatient setting, continues to be a growing
concern among hospitals, payers, and consumers. Not all hospitals provide these
services and some hospitals have a much larger proportion of costs allocated. To
address this situation, staff recommends earmarking 0.31 percent of the inflation
allowance to fund increases in the cost of drugs and provide this allowance based on the
portion of total hospital costs that were comprised of drug costs in RY 2017.
In addition to the 0.31 drug inflation allowance, this recommendation also addresses
high cost oncology drugs. In RY 2017, HSCRC initiated a volume adjustment for
growth in high cost oncology drugs. The adjustment for growth between RY 2015 and
RY 2016 was made utilizing information provided in a supplemental report provided by
the hospitals for the top 80 percent of these outpatient medications. Half of the
estimated cost changes due to volume were recognized as a one-time adjustment and
half were recognized as a permanent adjustment. On July 1 2017, hospitals were
provided a prospective estimate to account for potential volume changes in RY 2017
over RY 2016 while awaiting the supplemental reporting results. A true up of the
estimate was made with the RY 2018 mid-year adjustments based on the supplemental
reports provided by hospitals.
For RY 2019, as a result of their experience adjusting the estimates to the actual
reports, staff plans to eliminate the prospective volume estimate for these high cost
drugs. Staff is also proposing accelerating the due date for the supplemental drug
report and they are meeting with industry representatives and experts to evaluate the
potential to make just-in-time adjustments for emerging drugs. Staff will make the
outpatient high-cost drug volume adjustment for RY 2018 over RY 2017 with the mid-
year adjustments for RY 2019.
Industry briefs suggest that there will be substantial increases in oncology drug costs
for RY 2019. There are several drugs with expected introductions or new indications
Final Recommendations on the Update Factors for FY 2019
8
for use. Staff is expecting to get improved claims data drug information in October.
By mid-year, staff will determine whether the improved information can be used to
make adjustments for a very limited set of new oncology drugs. After additional
consultations and calculations, staff will provide an allowance in the second half of RY
2019 for increases in costs related to net volume growth of high cost oncology
medications for RY 2018 over RY 2017. Staff will also potentially provide an
adjustment for emerging medications, if warranted. Based on early estimates contained
in industry briefs, staff is utilizing an estimate of 0.20 percent to calculate the overall
RY 2019 update (for further discussion, see Supplemental Report Information).
Categoricals: At the January commission meeting, Johns Hopkins Hospital and
University of Maryland Medical Center made a presentation regarding new and
expensive inpatient therapies for cancer and spinal muscular atrophy. The HSCRC
staff has been working to develop an approach to provide a revenue adjustment for
these expensive therapies together with adjustments for existing categorical cases
(transplants, cancer research cases). HSCRC staff has been provided a wide range of
potential volume estimates for these services. To create a fixed pool of funds for these
services, staff proposed a set aside of a one percent revenue adjustment for these two
academic medical centers for RY 2019. While this adjustment will increase the
permanent base revenue of these two institutions for RY 2019 and beyond, the
Commission will need to deliberate how to fund these types of services in the future.
This approach applies only to RY 2019, and there are certain conditions that must be
met to receive this funding. The Commission approved a set of conditions for Johns
Hopkins Hospital at the June Commission meeting. Discussions with University of
Maryland Medical Center are still underway.
QBR Adjustment: Because the Quality Based Reimbursement (QBR) adjustment data
comes from CMS, there is a delay in the calculation of this adjustment. This
adjustment is expected to be approximately -0.38 percent, based on the changes in
Commission policy and preliminary modeling. This adjustment will be made in the
second half of RY 2019.
Set-Aside for Unforeseen Adjustments: Staff recommends a 0.25 percent set-aside to
fund unforeseen adjustments during the year. Although the actual unforeseen
adjustments in RY 2018 were above this amount, staff’s estimate of the high cost drug
volume adjustment was excessive and, as a result, the revenue growth remained on
target for the year. It is important to note that CMS’s final regulations lowered its
update by approximately 0.60 percent for the federal fiscal year that began in October
2017 relative to its initial proposal. HSCRC did not lower hospitals’ revenue budgets
when this occurred. Fortunately, high cost drug volume increases came in lower than
expected and, as a result, helped to offset the lower federal inflation provision.
Reversal of the Prior Year’s PAU Savings Reduction and Quality Incentives: The
total RY 2018 PAU savings and quality adjustments are restored to the base for RY
2019, with new adjustments to reflect the PAU savings reduction and quality incentives
for RY 2018.

Final Recommendations on the Update Factors for FY 2019
9
PAU Savings Reduction and Quality Scaling Adjustments3: The RY 2019 PAU
savings will be continued, and an additional 0.30 percent savings is recommended for
RY 2019. Staff have provided final figures for both positive and negative quality
incentive programs.
Central Components of Revenue Offsets with Neutral Impact on Hospital Financial Statements
In addition to the central provisions that are linked to hospital costs and performance, HSCRC
staff also considered revenue offsets with neutral impact on hospital financial statements. These
include:
Uncompensated Care (UCC) Reduction: The proposed uncompensated care
reduction for FY 2019 will be -0.35 percent. The amount in rates was 4.51 percent in
RY 2018, and the proposed amount for RY 2019 is 4.16 percent.
Deficit Assessment: The legislature reduced the deficit assessment by $30 million in
RY 2019, as a result, this line item is -0.19 percent.
Additional Revenue Variables
In addition to these central provisions, there are additional variables that the HSCRC considers,
as mentioned in Table 2. These additional variables include one-time adjustments, revenue and
rate compliance adjustments and price leveling of revenue adjustments to account for
annualization of rate and revenue changes made in the prior year.
Shifts to Unregulated
A growing focus in Maryland continues to be on the total cost of care. Global budgets must be
adjusted for shifts from regulated to unregulated settings to prevent double payment for the
services and dis-savings. Adjustments related to shifts, whether to related or unrelated entities,
must be made in a timely manner. The GBR agreements that apply to each hospital clearly
anticipate revenue reductions when services are shifted and require timely reporting to the
HSCRC so that adjustments may occur. In order to ensure better reporting and facilitate
disclosure, staff is proposing to withhold 0.50 percent of a hospital’s total update if the hospital
fails to submit a properly executed disclosure. The applicable GBR agreement provisions are
provided in the following paragraphs below.
3 The RY 19 MHAC and QBR penalties are significantly higher than the RY 18 penalties because the scale was
modified to use full distribution of scores. Furthermore for QBR the mortality benchmark increased in RY19 and
this resulted in greater penalties. For RRIP, there was an increase in penalties because improvement in readmissions
slowed down. There were 22 hospitals that had increases in their case-mix adjusted readmission rate.

Final Recommendations on the Update Factors for FY 2019
10
Section IV.B.3a. Of the Global Budget Agreement states the following:
The HSCRC and the Hospital recognize that some services may be offered more effectively in an
unregulated setting. When services covered by the GBR model are moved to an unregulated
setting, the HSCRC staff will calculate and apply a reduction to the Hospital's Approved
Regulated Revenue. At a minimum, the reduction will ensure that the shift provides a savings to
the public and Medicare after taking into consideration the payment amounts likely to be made
for the same services in an unregulated setting.
Furthermore, section VI.3 of the Global Budget Agreement states the following:
Significant changes in the health care delivery system in the Hospital’s Primary and Secondary
Service Areas could influence the appropriateness of the Approved Regulated Revenue
established for the Hospital under this Agreement. Therefore, the Hospital agrees to declare and
describe, in Appendix G, any financial interest (or control) it holds in other hospitals or entities
that provide services, including non-hospital services, in the Hospital’s Primary and Secondary
Service Areas, as of the Effective Date of this Agreement.
In addition, the Hospital agrees to inform the HSCRC at least thirty (30) days in advance, in
writing, or at the earliest practicable time thereafter, of any acquisitions or divestitures which it
undertakes regarding such interests.4 The HSCRC may request data from the Hospital, on a
periodic or ongoing basis, regarding the utilization of the services provided by such related
entities, to ensure that the Hospital complies with the GBR constraint through better
management of its existing regulated services and not by moving services from the HSCRC-
regulated sector to unregulated sectors of the hospital or non-hospital environment in ways that
do not comport with the objectives of the GBR model, the Three Part Aim and the final contract
between CMMI and the State of Maryland.
The Hospital will provide [two] annual disclosure and certification report, regarding changes in
the services it provides. [One disclosure report includes initiation of ventures outside the
hospital which may result in a shift in volumes. The other disclosure report requires a reporting
of any shift in volumes to unregulated settings, whether initiated by the hospital or another
party] The initial report[s] [were ] due upon signing of [the GBR] Agreement and additional
reports will due on an annual basis within 30 days after the end of each subsequent Rate Year.
Hospitals have expressed some confusion regarding shifts to unregulated settings. In order to
provide additional guidance to hospitals, HSCRC staff recommend that a sub-group of the
4 This would include the purchase or divestiture of physician practices, joint-venture arrangements with other
providers to establish unregulated services that duplicate or could substitute for regulated services currently
provided by the Hospital (such as, but not limited to, unregulated clinic, urgent care, or ambulatory surgery
services), or other non-hospital services.

Final Recommendations on the Update Factors for FY 2019
11
Payment Models Workgroup meet to outline and provide additional guidance regarding reporting
and adjustments for shifts to unregulated settings.
Consideration of All-Payer Model Agreement Requirements
As described above, the staff proposal increases the resources available to hospitals to account
for rising inflation, population changes, and other factors, while providing adjustments for
performance under quality programs. Additionally, based on staff calculations, the proposed
update falls within the financial parameters of the All-Payer Model agreement requirements. The
staff’s considerations in regards to the All-Payer Model agreement requirements are described in
detail below.
All-Payer Financial Test
The proposed balanced update keeps Maryland within the constraints of the Model’s all-payer
revenue test. Maryland’s agreement with CMS limits the annual growth rate for all-payer per
capita revenues for Maryland residents at 3.58 percent. Compliance with this test is measured by
comparing the cumulative growth in revenues from the CY 2013 base period to a ceiling
calculated assuming an annual per capita growth of 3.58 percent. To evaluate the impact of the
recommended update factor on the State’s compliance with the all-payer revenue test, staff
calculated the maximum cumulative growth that is allowable through the end of CY 2019. As
shown in Table 3, cumulative growth of 23.50 percent is permitted through CY 2019.
Table 3. Calculation of the Cumulative Allowable Growth in All-Payer per Capita Revenue for Maryland Residents
CY 2014
CY 2015
CY 2016
CY 2017
CY 2018
CY 2019 Cumulative Growth
A B C D E F G = (1+A)*(1+B)*(1+C)*(1+D)*(1+E)*(1+F)
Calculation of Revenue Cap 3.58% 3.58% 3.58% 3.58% 3.58% 3.58% 23.50%
Table 4 below shows the allowed all-payer growth in gross revenues. Staff removed adjustments
due to reductions in uncompensated care (UCC) and assessments that do not affect the hospitals’
bottom lines. Staff projects that the actual cumulative growth, excluding changes in
uncompensated care and assessments, through FY 2019 is 17.78 percent. The actual and
proposed revenue growth is well below the maximum levels.
Table 4. Evaluation of the Proposed Update’s Projected Growth and Compliance with the All-Payer Gross Revenue Test
Actual Jan -June
2014
Actual FY
2015
Actual FY
2016
Actual FY
2017 Staff Est. FY 2018
Proposed FY 2019 Cumulative Growth
A B C D E F G =
(1+A)*(1+B)*(1+C)*(1+D)*(1+E)*(1+F) Maximum Gross Revenue Growth Allowance 2.13% 4.21% 4.06% 3.95% 4.06% 4.06% 24.66%
Revenue Growth for Period 0.90% 2.51% 2.47% 2.20% 2.62% 2.01% 13.40%

Final Recommendations on the Update Factors for FY 2019
12
Savings from UCC & Assessment Declines that do not Adversely Impact Hospital Bottom Line 1.09% 1.40% 0.69% 0.18% 0.54% 3.96%
Revenue Growth with UCC & Assessment Savings Removed 0.90% 3.60% 3.87% 2.89% 2.80% 2.56% 17.78%
Revenue Difference from Growth Limit
6.87%
“Maximum Gross Revenue Growth Allowance” includes the following population estimates: FY17/CY16 = 0.36%;
FY18/CY17 = 0.46%
Medicare Financial Test
The proposed balanced update also keeps Maryland within the constraints of the Model’s
Medicare savings test. This second test requires the Model to generate $330 million in Medicare
fee-for-service (FFS) savings in hospital expenditures over five years. The savings for the five-
year period were calculated assuming that Medicare FFS hospital costs per Maryland beneficiary
would grow about 0.50 percent per year slower than the Medicare FFS costs per beneficiary
nationally after the first performance year (CY 2014).
Performance years one through four (CY 2014 through CY 2017) of the Model generated $916
million in cumulative hospital savings. Under these calculations, the cumulative hospital savings
are ahead of the required savings of $330 million.
However, there continues to be a shift toward greater utilization of non-hospital services in the
State, relative to national rates of growth. When calculating savings relative to total cost of care,
the four-year (CY 2014-CY2017) cumulative savings estimate is $599 million, still well above
the required savings level. Maryland’s All-Payer Model Agreement with CMS contains
requirements relative to the total cost of care, which includes non-hospital cost increases. The
purpose is to ensure that cost increases outside of the hospital setting do not undermine the
Medicare hospital savings that result from the Model implementation. If Maryland exceeds the
national total cost of care growth rate by more than 1.00 percent in any year, or exceeds the
national total cost of care growth rate in two consecutive years, Maryland is required to provide
an explanation of the increase and potentially provide steps for corrective action.
While cumulative savings are above the required level, staff has calculated that the year over
year total cost of care growth was above the national growth rate for Medicare for CY 2017 over
CY 2016. This annual excess growth was caused by increases in Maryland’s non-hospital Part B
services, which were not offset by sufficient hospital savings. As a result, Maryland must set out
to ensure that growth does not exceed the national total cost of care growth for Medicare in CY
2018. A commitment to continue the success of the first four years is critical to building long-
term support for Maryland’s Model.

Final Recommendations on the Update Factors for FY 2019
13
Consideration of National Cost Figures
Medicare’s Proposed National Rate Update for FFY 2019
CMS published proposed updates to the federal Medicare inpatient rates for FFY 2019 in the
Federal Register in late-April 2018.5 These proposed updates are summarized in Table 5 below;
they will not be finalized for several months and are subject to change. In the proposed rule,
CMS would increase rates by approximately 3.05 percent in FFY 2019 compared to FFY 2018,
after accounting for inflation, a disproportionate share increase, and other adjustments required
by law. The proposed rule includes an initial market basket update of 2.80 percent for those
hospitals that were meaningful users of electronic health records and for those hospitals that
submitted data on quality measures, less a productivity cut of 0.80 percent and an additional
market basket cut of 0.75 percent, as mandated by the Affordable Care Act (ACA). This
proposed update also reflects a proposed 0.50 percentage point increase for documentation and
coding required by the American Taxpayer Relief Act of 2012. Disproportionate share payment
changes resulted in an increase of approximately 1.30 percent from FFY 2018.
Table 5. Medicare’s Proposed Rate Updates for FFY 2019
Inpatient Outpatient
Base Update
Market Basket 2.80% 2.80%
Productivity -0.80% -0.80%
ACA -0.75% -0.75%
Coding 0.50%
1.75% 1.25%
Other Changes
DSH 1.30% 0.00%
Other Changes 0.00% 0.00%
1.65% 0.00%
3.05% 1.25%
Applying the inpatient assumptions about market basket, productivity, and mandatory ACA
outpatient savings, staff estimates a 1.25 percent Medicare outpatient update effective January
5 See httpshttps://www.cms.gov/Medicare/Medicare-Fee-for-Service-Payment/AcuteInpatientPPS/FY2019-IPPS-
Proposed-Rule-Home-Page.html.
Final Recommendations on the Update Factors for FY 2019
14
2019. This estimate is pending any adjustments that may be made when the final update to the
federal Medicare outpatient rates is published.
Meeting Medicare Savings Requirements and Total Cost of Care Guardrails
For the past four updates, Maryland obtained calendar year Medicare fee-for-service growth
estimates from the CMS Office of the Actuary. Staff then compared Medicare growth estimates
to the all-payer spending limits. During CY 2014-CY 2017, all-payer growth outpaced Medicare
growth on a per capita basis and in the updates staff adjusted the all-payer growth limit using the
difference in Medicare and all-payer per capita growth to estimate the implied limit for
Medicare. Staff also incorporated a targeted Medicare savings of 0.50 percent in hospital
payment growth relative to the national growth rate, designed to provide at least $330 million in
cumulative savings over a five-year period. The CMS Office of the Actuary provided national
Medicare fee-for-service per capita hospital spending increase estimates of 2.10 percent for CY
2018 and of 2.00 percent for total cost of care (Parts A and B). The updates provided by the
Office of the Actuary did not include a provision for DSH in the amount of 1.30 percent that is
included in the federal update and begins on October 1. Due the federal update beginning with
three months left in the calendar year, staff have added 25 percent of the DSH cost to the CY
2018 projections. This was calculated by taking 25 percent of the 1.30 percent and multiplying
that by the inpatient percentage of total hospital payments, approximately 71 percent. This
calculation results in a revised increase of 2.32 percent for hospital spending. Staff also
calculated a revised increase for total cost of care by taking the 0.23 percent increase from the
hospital projection and multiplying that by the hospital percentage of total cost of care of
approximately 50 percent. This calculation produced a 0.12 percent increase which was added to
the total cost of care projection resulting in a revised estimate of 2.13 percent. These revised
spending projections were used by staff to estimate desired CY 2018 Medicare savings (Tables
6A and 6B).
For the purposes of evaluating the maximum all-payer spending growth that will allow Maryland
to meet the per capita Medicare FFS target, the Medicare target must be translated to an all-payer
growth limit. There are several ways to calculate the difference between Medicare FFS and all-
payer growth rates using recent data trends. A consultant to CareFirst developed a “conservative
difference statistic’ that reflected the historical increase in Medicare per capita spending in
Maryland relative to all-payer per capita spending growth. CareFirst has updated this statistic
each year using data provided by HSCRC staff. For the FY 2019 update, CareFirst and HSCRC
staff calculated a difference of 0.86 percent, which used a four-year average difference between
Maryland Medicare and all-payer claims reduced by the average annual absolute variance.
A feature of the current hospital Model that will continue in the Total Cost of Care All-Payer
Model, which begins January 1, 2019, is that Maryland Medicare total cost of care cannot exceed
national Medicare total cost of care growth by one percent in any single year and cannot exceed
the national growth by any amount in two consecutive years; these are known as ‘total cost of
care guardrails.’ Maryland ended the year above Medicare national growth in CY 2017. In an
effort to ensure Maryland that does not exceed the national Medicare growth rate in CY 2018,
staff modeled the impact of excess non-hospital growth on the maximum hospital update that
Final Recommendations on the Update Factors for FY 2019
15
could be provided. This calculation assesses Medicare growth in unregulated settings and factors
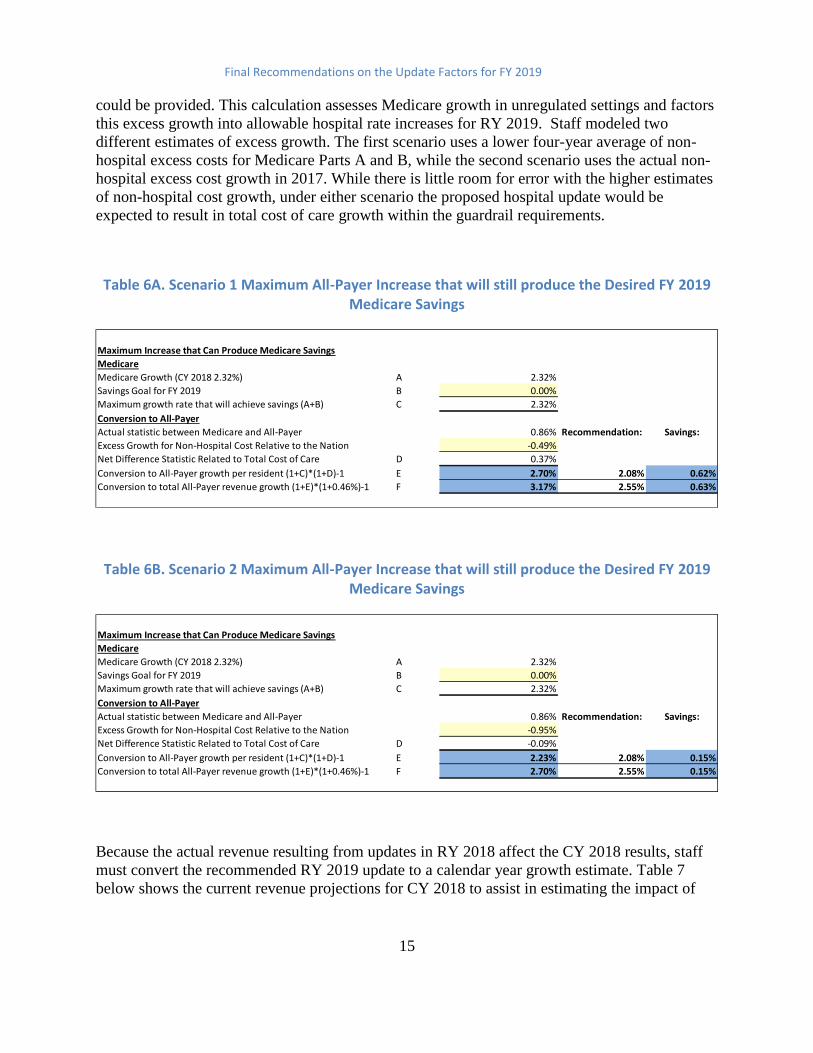
this excess growth into allowable hospital rate increases for RY 2019. Staff modeled two
different estimates of excess growth. The first scenario uses a lower four-year average of non-
hospital excess costs for Medicare Parts A and B, while the second scenario uses the actual non-
hospital excess cost growth in 2017. While there is little room for error with the higher estimates
of non-hospital cost growth, under either scenario the proposed hospital update would be
expected to result in total cost of care growth within the guardrail requirements.
Table 6A. Scenario 1 Maximum All-Payer Increase that will still produce the Desired FY 2019 Medicare Savings
Table 6B. Scenario 2 Maximum All-Payer Increase that will still produce the Desired FY 2019 Medicare Savings
Because the actual revenue resulting from updates in RY 2018 affect the CY 2018 results, staff
must convert the recommended RY 2019 update to a calendar year growth estimate. Table 7
below shows the current revenue projections for CY 2018 to assist in estimating the impact of
Maximum Increase that Can Produce Medicare Savings
Medicare
Medicare Growth (CY 2018 2.32%) A 2.32%
Savings Goal for FY 2019 B 0.00%
Maximum growth rate that will achieve savings (A+B) C 2.32%
Conversion to All-Payer
Actual statistic between Medicare and All-Payer 0.86% Recommendation: Savings:
Excess Growth for Non-Hospital Cost Relative to the Nation -0.49%
Net Difference Statistic Related to Total Cost of Care D 0.37%
Conversion to All-Payer growth per resident (1+C)*(1+D)-1 E 2.70% 2.08% 0.62%
Conversion to total All-Payer revenue growth (1+E)*(1+0.46%)-1 F 3.17% 2.55% 0.63%
Maximum Increase that Can Produce Medicare Savings
Medicare
Medicare Growth (CY 2018 2.32%) A 2.32%
Savings Goal for FY 2019 B 0.00%
Maximum growth rate that will achieve savings (A+B) C 2.32%
Conversion to All-Payer
Actual statistic between Medicare and All-Payer 0.86% Recommendation: Savings:
Excess Growth for Non-Hospital Cost Relative to the Nation -0.95%
Net Difference Statistic Related to Total Cost of Care D -0.09%
Conversion to All-Payer growth per resident (1+C)*(1+D)-1 E 2.23% 2.08% 0.15%
Conversion to total All-Payer revenue growth (1+E)*(1+0.46%)-1 F 2.70% 2.55% 0.15%

Final Recommendations on the Update Factors for FY 2019
16
the recommended update factor together with the projected FY 2018 results. The overall growth
from this table is used in Table 6A.
Table 7. Estimated Position on Medicare Target
Steps to explain Table 7 are described as below:
Step 1: The table begins with the estimated global revenue for FY 2018 and actual
revenue for the last six months for CY 2017 to calculate the projected revenue for the
first six months of CY 2018 (i.e. the last six months of FY2018).
Step 2: This step shows the estimated FY 2019 global budget revenue based on the
information that staff have available to date. The permanent update over FY 2018 of
2.01 percent represents the portion of the RY 2019 update provided during the calendar
year 2018, as shown in Table 2.
Step 3: For this step, to determine the calendar year revenues, staff estimate the revenue
for the first half of RY 2019 by applying the recommended mid-year split percentage of
49.73 percent to the estimated approved revenue for FY 2019 and hospital specific
seasonality adjustments. An adjustment for the temporary rate adjustment for Johns
Hopkins Hospital is added to revenues.
Actual Revenue CY 2017 17,056,291,338
Step 1:
Approved GBR FY 2018 17,183,983,214
Actual Revenue 7/1/17-12/31/17 8,421,055,533
Projected Revenue 1/1/18-6/30/18 A 8,762,927,681
Step 2:
Estimated Approved GBR FY 2019 17,529,893,859
Permanent Update 2.01%
Step 3:
Estimated Revenue 7/1/18-12/31/18
(after 49.73% & seasonality) 8,717,616,216
Change in Hopkins Payback 10,000,000
B 8,727,616,216
Step 4:
Estimated Revenue CY 2018 A+B 17,490,543,897
Increase over CY 2017 Revenue 2.55%
Estimated Position on Medicare Target
Final Recommendations on the Update Factors for FY 2019
17
Step 4: This step shows the resulting estimated revenue for CY 2018 and then calculates
the increase over CY 2017 Revenue.
Stakeholder Input
HSCRC staff worked with the Payment Models Workgroup to review and provide input on the
proposed FY 2019 updates. Staff has received and reviewed comments from CareFirst, the
Maryland Hospital Association, MedStar Health (Good Samaritan, Union Memorial,
Montgomery, Harbor, and Franklin Square), Johns Hopkins Health System, Holy Cross Health,
and Mount Washington Pediatrics. Stakeholder comments and staff responses are provided
below.
Comment: CareFirst expressed concern that the proposed update may place the State at risk of
exceeding total cost of care guardrails. CareFirst stated that Maryland has exceeded the nation in
non-hospital growth every year since 2014 and believes it is imperative that staff reflect the
increasing growth in non-hospital excess cost growth in its modeling, to ensure that the update
provided does not place Maryland at risk of violating the total cost of care guardrail.
Response: Staff updated Table 6B to include a more conservative amount for non-hospital cost
growth of 0.95 percent. Staff projected that the State will still meet the total cost of care growth
limit guardrail requirements with higher non-hospital cost growth, although there is very little
room for error with this higher non-hospital growth estimate.
The Maryland Hospital Association (MHA) and its member hospitals provided feedback on the
draft recommendation. Staff has outlined MHA’s concerns in addition to providing comments
on each item below.
Comment: MHA believes that 0.23 percent revenue adjustment for Johns Hopkins Hospital and
University of Maryland Medical Center shouldn’t be funded through the annual payment update.
Response: Staff accounts for all estimated growth in revenue in determining whether it will
meet the revenue growth limit and savings test. It would not be accurate to exclude a category of
hospital revenue growth from the analysis.
Comment: The annual payment update should be increased by at least 0.50 percent. MHA
expressed several reasons to support this statement.
Response: Staff does not agree with MHA’s recommendation to increase the update factor. The
RY 2018 update appears to be providing an increased level of regulated operating profits and
staff believe the inflation factor provided for RY 2019 is reasonable. The PAU adjustment of -
0.30 percent is far lower than the reductions to Medicare provided by CMS in the proposed
federal Inpatient Prospective System update.
Final Recommendations on the Update Factors for FY 2019
18
i. MHA has expressed that there is an additional cushion built into the growth
projections and believes that the conservative estimates staff used to project
growth are not needed. MHA made projections based on the first three months of
the federal fiscal year (October 2017 – December 2017). Response: Staff is not
willing to make projections on hospital spending based on three months of data.
ii. MHA also expressed concern that the projections provided in the President’s
budget may be under-projected based on prior year’s data. Response: Staff
agrees that the actuals came in higher than the projections for the previous year.
However, staff must use the estimates provided by the Office of the Actuary and
has no basis to make additional projections based on those figures.
iii. MHA also noted that the national IPPS proposed rule shows a rate payment
update of 3.40 percent, which is 0.35 percent higher than the 3.05 percent shown
in the draft recommendation. Response: Staff believes the additional growth of
0.35 percent reflects CMS’s estimate of volume growth. Also, conversations with
the Office of the Actuary indicate that modeling included all estimates except for
the proposed change in the disproportionate share funding. Therefore, staff would
not change its calculations even if the federal update were higher due to other
miscellaneous estimates.
iv. MHA stated in their letter, that Maryland is an all-payer state, yet it is limited by
Medicare growth. Response: The All-Payer Model Agreement with CMS
requires the State to perform under multiple tests. The HSCRC staff has
recommended an update, which they believe balances the need to meet the
requirements of the Agreement with CMS as well as providing for efficient cost
growth due to inflation and other factors. Staff believes that the Potentially
Avoidable Utilization (PAU) savings amount, which is proposed at an increment
of 0.30 percent for RY 2019, is reasonable and appropriate in light of the
requirements to achieve savings through quality improvements. There are no
additional productivity subtractions that are input into the update, including the
Affordable Care Act reduction of 0.75percent and the productivity reduction of
0.80percent that are built into the FFY 2019 proposed rule. Furthermore, the
Commission provided an update for RY 2018 that resulted in higher year-over-
year Medicare growth for CY 2017 over CY 2016 than the nation. It is important
that Maryland not exceed the national Medicare growth rate two years in a row.
v. MHA stated that the Medicare Performance Adjustment (MPA) is in effect and
the incentives in place provide a cushion for Medicare total cost of care
performance in 2018. Response: Staff does not agree that the MPA provides a
cushion, but rather, is an incentive to help focus hospitals on total cost of care for
beneficiaries they serve. Further, adjustments related to performance in 2018 will
not be reflected until RY 2020. Staff will make sure to account for MPA
adjustments when developing future estimates for the total cost of care guardrail
test.

Final Recommendations on the Update Factors for FY 2019
19
vi. MHA also stated that the update does not fully account for expected service
growth from an aging population and expressed concern that the update model is
limited to statewide population growth. Response: HSCRC staff utilizes
population growth statistics from the Maryland Department of Planning to
determine population growth. This approach is consistent with the calculation
requirements under the Agreement with CMS. In addition, staff adjusts for high
cost drug growth, categoricals cases (very high cost inpatient services
concentrated in The Johns Hopkins Hospital and University of Maryland Medical
Center) and actual population growth, which results in a larger adjustment for
volume growth. For example, the final RY 2019 recommendation provides 0.46
percent for a volume adjustment. When drug cost estimates, (0.20 percent,) and
categoricals, (0.23 percent) are included actual volume adjustments account for
0.89 percent of the total update, before accounting for reductions in avoidable
utilization.
vii. MHA expressed a concern that the shared savings has exceeded infrastructure
investment funding. Response: Staff believes this is a very narrow view of the
Model and does not provide a holistic view of the Model funds flow. Hospitals
should provide funding from their own resources since they expect a return on
investment and are permitted to keep the revenues from reducing PAUs, except
for the portion that is reduced through the PAU savings adjustment. As stated
earlier, the incremental adjustment for PAU savings in this year’s update is -0.30
percent. The proposed rule for IPPS has taken a -0.80 percent cut for productivity
and an additional -0.75 percent cut for the ACA. The adjustment for PAU savings
built into the update is far less than the productivity reductions proposed for
Medicare. Moreover, staff notes that while a PAU adjustment is required in order
to comply with the Model Agreement, the hospital industry has been able in some
measure to succeed in this test because of the reduction of uncompensated care,
which was primarily due to the Medicaid expansion, the elimination of the
Maryland Health Insurance Plan assessment, and the decreases in the Medicaid
Deficit Assessment.
viii. Another point that MHA expressed in their letter was an observation that the State
has followed a pattern in past years, namely that the year following an
unfavorable year the State tends to be favorable in regards to the total cost of care
guardrail. Response: Staff does not believe that future projections can be based
on the assumption that a past short-term cyclical observation will continue.
ix. MHA expressed concern that the draft recommendation did not reflect the Quality
Based Reimbursement adjustment. Response: Staff has included an estimate for
QBR in the final recommendation.
Comment: MHA has stated that the productivity offset for Maryland’s psychiatric and specialty
hospitals should be eliminated, or at least reduced.

Final Recommendations on the Update Factors for FY 2019
20
Response: Staff does not agree. Staff has not made a reduction for ACA similar to what occurs
on the national landscape. Also, these specialty hospitals have very low use of drugs compared
to the general acute hospitals, and, as a result, the inflation factor provided is higher than would
be expected. Also, these hospitals are not restricted in their ability to derive additional revenues
through volume growth.
In addition the above points, MHA requested that staff provide support for several
reconciliations and analyses. Staff shared these analyses with the Payment Model work group
meeting on May 31, 2018 where stakeholder comments and concerns were discussed.
Comment: MedStar Health, including five of the seven community hospitals that make up the
system, expressed concern that the overall update will vary among each hospital and some
hospitals may receive updates below inflation, based on PAU savings, the demographic
adjustment, and other factors. Each hospital expressed that the update should be increased by
0.50 percent to continue investments in the community and overcome the criticisms levied
against current HSCRC methodologies. One reason to increase the update factor was the
increased cost in nursing support.
Response: Many of the concerns raised have been already been addressed in the response to the
MHA comments. Hospitals in areas of declining population and with high levels of avoidable
utilization should expect to have updates that are lower than factor cost inflation, given their
opportunities to control costs through the reduction of avoidable and unnecessary utilization.
There are various opinions in the industry regarding retention of revenues for volume reductions,
especially those that result from market shift or reductions unrelated to avoidable utilization. As
noted above in the Central Components of Revenue Change, staff is working to analyze the
volume policies including the demographic adjustment, market shift, and potentially avoidable
utilization. Staff commit to work with the industry to enhance these adjustments. While it is not
HSCRC practice to dictate how a hospital apportions its outlays, staff do believe that the
inflationary increase of 2.40 percent built into the update factor for wages, together with the
additional inflation provided in RY 2018, should help hospitals address needed wage increases
consistent with national trends.
Comment: MedStar Health hospitals also expressed concern regarding HSCRC’s mention of
hospitals’ contractual obligations to notify the HSCRC about movements of services from
regulated to unregulated.
Response: Staff will be sure to work with the industry to provide additional guidance regarding
the expectations and needs with respect to any shifts to an unregulated space, but notes that the
GBR contracts clearly delineate the obligations of the hospital to notify the HSCRC about any
shifts in volume from regulated to unregulated. HSCRC staff must make adjustments as needed
to ensure that payers are not facing increased costs that could result if services shifted from the
hospital to an unregulated setting did not result in decreased hospital revenues.
Comment: Johns Hopkins Health System (JHHS) comments solely focused the section of the
draft recommendation dedicated to shifts to unregulated services. JHHS believes that while
Final Recommendations on the Update Factors for FY 2019
21
notification surrounding service shifts to unregulated is necessary for improving total cost of care
in the state of Maryland, there needs to be a well formulated policy. JHHS suggest a policy
should consider the following: clear process and timeline, incentives to move to a lower cost
setting, and the factors that contributed to the shift. It was also stated that penalties should not be
made for shifts outside of the hospitals control and retroactive adjustments should not be made.
Response: Staff notes that each hospital signed a global budget agreement that included
language pertaining to shifts to unregulated settings. In addition, each hospital is required to
submit an annual disclosure that includes any changes in these items from the previous year.
One-time adjustments are necessary if staff finds that a hospital did not provide notification and
money was left in the global budgets. If staff does not make one-time adjustments for
undisclosed shifts, it would discourage hospitals from reporting shifts and result in excess
billings to payers. In some instances, these excess billings could be a compliance problem. Staff
believes it has the obligation to evaluate the reported shifts and make necessary adjustments.
Staff must still be notified timely when a hospital is aware of shifts that occur as the result of
physician or payer decisions. The issue is not who is making the decision, but the need to
eliminate duplicate payment for a service when it is covered under a global budget and is also
being billed by another party. Staff agrees with the need to work with payers and providers to
provide additional policy guidance.
Comment: Holy Cross Health expressed support for a higher update factor to include making
investments in population health initiatives. Holy Cross also noted drug shortages are causing an
increase in total drug costs and expressed the need for the rate system to fund pharmaceuticals.
Response: Staff appreciates the investments Holy Cross has made towards population health.
Staff believes the proposed update factor is appropriate. The RY 2018 update provided
increased profit levels and hospitals have additional opportunities to reduce costs through
productivity improvements and reduced avoidable or unnecessary utilization. Through FY 2017,
HSCRC has overfunded drug cost growth statewide through the inflation adjustment, together
with the high cost drug volume adjustment. Staff will update the analysis for FY 2018, when the
data is available, and consider additional policy adjustments as needed.
Comment: Mt. Washington Pediatric Hospital requested relief from the proposed update of
1.77 percent. Mt. Washington stated that offsetting inflation by the productivity adjustment
increases overall statewide costs and detracts from the ability to continue to be a niche in the
continuum of care in Maryland.
Response: As previously noted, staff believes the 1.77 percent proposed update is appropriate
and notes that the non-acute hospitals are not subject to the volume limitations of the global
budget hospitals.

Final Recommendations on the Update Factors for FY 2019
22
RECOMMENDATIONS
Based on the currently available data and the staff’s analyses to date, the HSCRC staff provides
the following final recommendations for the FY 2019 update factors.
For Global Budget Revenue Hospitals:
a) Provide an overall increase of 1.83 percent for revenue (net of uncompensated care
offset) and 1.37 percent per capita for hospitals under Global Budgets, as shown in Table
2. In addition, staff is proposing to split the approved revenue into two targets, a mid-year
target and a year-end target. Staff will apply 49.73 percent of the Total Approved
Revenue to determine the mid-year target and the remainder of revenue will be applied to
the year-end target. Staff is aware that there are a few hospitals that do not follow this
pattern of seasonality and will adjust the split accordingly.
b) Allocate 0.31 percent of the total inflation allowance based on each hospital’s proportion
of drug cost to total cost to more equitably adjust hospitals’ revenue budgets for increases
in drug prices and high cost drugs. Continue to adjust for volume changes of high cost
oncology drugs at the mid-year data point for RY 2018 over RY 2017. Evaluate the need
for an additional adjustment for growth in high cost drugs during RY 2019.
c) The Commission should continue to closely monitor performance targets for Medicare,
including Medicare’s growth in total cost of care and hospital care costs per beneficiary
during the performance year. As always, the Commission has the authority to adjust rates
as it deems necessary.
d) Hospitals should submit, 30 days after the fiscal year, their annual disclosures of their
GBR Agreements to disclose any shifts from regulated to unregulated and unregulated to
regulated (Appendix F); as well as changes in financial interest, ownership, or control of
hospital or non-hospital services within the service area (Appendix G). Failure to submit
these disclosures will result in a holdback of 0.50 percent of a hospital’s update for RY
2019. HSCRC should convene a sub-group to outline additional guidance to hospitals in
reporting shifts to unregulated settings, as well as outlining the expectations for revenue
adjustments.
e) Continued refinements should be made to adjust revenues for volume changes in high-
cost drugs. Hospitals must report shifts to unregulated settings to avoid duplicate billing.
Data collection should be expedited and improved and external resources consulted in
order to improve the timeliness and ease of adjustments.
Non-Global Revenues including psychiatric hospitals and Mt. Washington Pediatric Hospital:
a) Provide an overall update of 1.77 percent by using a productivity adjustment of 0.80
percent from the inflation factor of 2.57 percent.

Final Recommendations on the Update Factors for FY 2019
23
b) Continue to focus on implementation of quality measures and value based programs for
psychiatric facilities.
PREPARATION FOR THE TOTAL COST OF CARE MODEL EFFECTIVE JANUARY 1, 2019
During May, 2018, Governor Hogan announced the federal approval of a ten-year Total Cost of
Care Model, which builds on the existing All-Payer Model and moves beyond hospitals to
address total cost of care for Medicare beneficiaries. The new Total Cost of Care Model will
require increased efforts to improve population health, enhance chronic condition management,
and align efforts with physicians, nursing homes, and other parts of the system to increase
patient-centered care. Hospitals will take on increased financial responsibility for performance
through the Medicare Performance Adjustment.
The new Model will necessitate changes in the annual update and in the global revenue
agreement. There are several considerations:
Maryland Primary Care Program Care Management Fees
The Maryland Primary Care Program (MDPCP) will be initiated in January 2019. Primary care
physicians will receive care management fees for their Medicare patients when they participate
in the voluntary program. During a start-up period, hospital utilization reductions may not be
adequate to offset the increased care management fees. Under the current update formulation,
growth in care management fees could result in a reduced hospital update. The Commission
wishes to avoid this result because it might dampen enthusiasm for the MDPCP, which is
important to the long term goal of improving chronic care and population health. As a result,
staff recommends a supplemental resolution for Commission consideration. This resolution
should state that:
1. Any adjustments to hospital payments necessary to ensure the State meets the annual
savings targets of the Total Cost of Care Model as a result of the inclusion of MDPCP
care management fees will not be effectuated on an all-payer basis, but only in a way that
recaptures the Medicare costs resulting from the inclusion of the care management fees in
the Medicare total cost of care calculation; and,
2. The HSCRC will advocate for additional funding sources to offset early start-up costs of
the MDPCP that will help provide for the cost of care management fees in excess of
Medicare savings achieved.
Updated Hospital Contract
The HSCRC will need to update the Global Budget Revenue agreements for the new Total Cost
of Care Model and the alignment programs. There will be a contract amendment for the
Medicare Performance Adjustment, effective July 1, 2018, which is necessary for MACRA
eligibility in care redesign programs. The HSCRC staff also proposes to work with a sub-group

Final Recommendations on the Update Factors for FY 2019
24
of the Payment Models Workgroup to evaluate needed updates to the contract, in addition to the
Medicare Performance Adjustment amendment. Staff will establish a schedule with the
objective of completing a contract amendment effective July 1, 2018, with a full replacement
contract to be put in place with an effective date of January 1, 2019.
Changes to the Annual Update
In order to drive success in achieving population health improvements and reducing avoidable
and unnecessary utilization, new aggressive goals will need to be established. HSCRC should
consider how to adjust the inflation process to assure the adoption of aggressive goals (Bold
Improvement Goals, BIG). Some portion of inflation (say 0.50 percent) could be set aside and
only those hospitals adopting approved aggressive (BIG) improvement goals would be eligible
for that portion of inflation. For example, one hospital could commit to a thirty percent
reduction in COPD related admissions with interventions that start with early detection and
prevention of COPD, disease and medication management supports, pulmonary rehabilitation,
vaccines for pneumonia and flu, among others. Other hospitals might commit to reduced
hospitalizations for sepsis, hospital related pneumonia or urinary tract infections, a reduction in
diabetes and other related improvements. The HSCRC will need to quickly formulate an overall
approach to facilitate planning for the upcoming year. Staff recommends that this formulation
take place through discussions among the Commission, senior stakeholder executives, and staff.
The Total Cost of Care Agreement with CMS will have different features and requirements than
the existing All-Payer Model Agreement. HSCRC staff recommends that the Payment Model
Workgroup continue working through the fall to evaluate adjustments that will be needed to the
annual update process as a result of the new Agreement with CMS.
Recommendations regarding preparation for the Total Cost of Care Model, effective January 1,
2019:
a) The Commission should adopt a resolution and policy regarding the treatment of
Maryland Primary Care Program care management fees during the start-up of the
program.
b) HSCRC staff should update the hospital revenue agreement template to reflect the new
Model requirements.
c) The annual update process should be reconfigured to conform to the new Total Cost of
Care Model Agreement with CMS.
d) The annual update should be reconfigured, in consultation with stakeholders, to promote
aggressive and progressive care delivery changes that will improve population health,
chronic care management, and reduce unnecessary and avoidable utilization, consistent
with the goals of the new Total Cost of Care Model.

Final Recommendations on the Update Factors for FY 2019
25
APPENDIX I. SUPPLEMENTAL INFORMATION ON RISING COST OF HOSPITAL DRUGS
Staff completed, separate from this recommendation, an analysis that focused on the rising cost
of hospital drugs. The purpose of this analysis was to aid staff, the Commission, and
stakeholders in assessing funding levels and future policymaking decisions. Currently, hospitals
are provided drug funding through two avenues: 1) drug cost inflation distributed using each
hospital’s drug cost in proportion to total drug costs and 2) changes in volume for the top 80
percent spend of high cost oncology drugs (providing 50 percent of the growth as a permanent
adjustment and 50 percent of the growth as a one-time adjustment).
The drug cost analysis showed that drug costs increased faster than total hospital costs since
2014 in every year, except 2017, and that outpatient cost growth is the primary cost driver.
Academic medical centers and hospitals with large outpatient programs were the largest
proportion of this growth. Since 2014, there has been a statewide excess in funding provided in
rates and funding in total appears to be adequate, although the analysis also found a variation by
hospital in funding levels versus cost growth.
There have been some shifts of drugs to unregulated settings. As a result of specialization, some
hospitals may be affected more by new drug introductions than others. The staff will continue to
focus on making adjustments for changes in volumes of high cost drugs to address these and
other dynamics. Staff is working to remove oncology drugs from the hospital market shift to
avoid overlaps in adjustments and to more accurately measure changes in volumes of cycle-
billed services such as clinics.
Inflation rates appear to be high enough to pick up the costs for much of the drug funding.
However, funding for new oncology and biological drug costs continue to be a growing concern.
Staff is continuing to refine the methodologies used to provide adjustments for changes in drug
costs.

Final Recommendations on the Update Factors for FY 2019
26
APPENDIX II. STAKEHOLDER COMMENT LETTERS


May 22, 2018 Nelson J. Sabatini Chairman, Health Services Cost Review Commission 4160 Patterson Avenue Baltimore, MD 21215 Dear Chairman Sabatini: On behalf of the Maryland Hospital Association’s 64 member hospitals and health systems, I write to share feedback from the hospital field on the commission’s rate year 2019 (RY 2019) annual payment update. Hospitals appreciate the work of commission staff and the careful consideration of the payment update by the commission. We look forward to discussing the considerations in our letter. Changes Needed for the Final Update 1. Categorical funding should be excluded from the annual payment update
The draft recommendation identifies a 0.23 percent revenue adjustment for The Johns Hopkins Hospital and University of Maryland Medical Center to fund an expected increase in new and expensive therapies. Hospital innovation should be funded through the rate setting system, but the annual payment update is not the proper vehicle for addressing the concerns of individual institutions. We recommend that the commission create a work group with all stakeholders to address this issue.
2. Increase the annual payment update by at least 0.5 percent
Maryland’s hospitals recognize the limits imposed by the Medicare Total Cost of Care (TCOC) guardrail. Based on discussions with commission staff and the commission’s discussion of the draft recommendation, we understand the commission’s desire to exercise caution when approving a revenue increase that will affect calendar year 2018 TCOC performance. That said, there is ample justification for a modest increase. There is room within the model to accommodate such an adjustment. There are several reasons to support a higher increase:
i. There is additional cushion built into the national payment growth projection.
ii. Maryland is an all-payer state, yet we are limited by Medicare growth. iii. The Medicare Performance Adjustment is currently in effect.

Nelson J. Sabatini May 22, 2018 Page 2
iv. The update does not fully account for expected service growth from an aging population.
v. Savings shared with payers exceeds infrastructure investment funding. vi. The prior year base period affects Maryland’s total cost of care guardrail.
vii. The draft recommendation does not reflect the Quality Based Reimbursement adjustment.
Below we elaborate upon each of these points.
i. There is additional cushion built into the national payment growth projection. The draft recommendation draws on several conservative estimates to project national and Maryland growth including: For the first quarter of federal fiscal year 2018 (October 2017 through December
2017), national Medicare hospital spending per beneficiary compared to the same quarter in the previous year. In federal fiscal year 2018, national hospital spending growth per beneficiary is projected to grow . (This figure combines one quarter of calendar year 2017 and three quarters of calendar year 2018 and is based on hospital spending growth rates in the President’s budget.) For this federal fiscal year 2018 projection to hold, the remaining three quarters must or less per capita growth. Such a projection is highly unlikely to hold (Chart 1).
HSCRC revenue projection assumes that the 0.25 percent allowance for unforeseen
adjustments will be used in full, beginning July 1, the first day of the fiscal year. The draft recommendation states that the entire set-aside was used during rate year 2018, but no summary was included to detail previous uses of these funds. Even if true, this would be the first time these funds were spent in their entirety.
Commission staff appropriately adjusted the projected national growth rate for the
fourth quarter of calendar year 2018, with one minor modification. Per the Centers for Medicare & Medicaid Services, the recently published Medicare Inpatient Prospective Payment System proposed rule reflects a national payment increase of 3.4 percent beginning in October 2018. The staff adjustment, 3.05 percent, is short by 0.35 percent.
In addition to actual growth exceeding what was projected for the first quarter, the
national spending growth from the President’s budget projections is, in itself, under-projected. When projections from the federal fiscal year 2019 budget are compared to the prior year, all prior period growth rates have been revised upward, reflecting actual spending above what was projected (Chart 2).

Nelson J. Sabatini May 22, 2018 Page 3
ii. Maryland is an all-payer state, yet we are limited by Medicare growth. The All-Payer Model is predicated on controlling both all-payer spending per capita and Medicare spending per beneficiary (per capita for the Medicare population). Spending can be managed by controlling prices, controlling service use, or both. The commission has regulated hospital prices since its inception, and has shifted its focus to the incentives to control service use since the beginning of the All-Payer Model. Service use should be measured as a function of population change, particularly by payer. Unfortunately, global budget mechanics have had the unintended consequence of increasing Medicare payments even though Maryland’s hospitals have controlled Medicare utilization per capita better than expected.
From 2013 to 2017, using equivalent case mix adjusted discharges (ECMADs) as the measure, Medicare service use declined 1.84 percent. All-payer service use declined 3.48 percent. Under global budgets, hospitals then collectively raised prices by 3.48 percent to achieve global budgeted revenue compliance, resulting in a 1.70 spending increase to Medicare. (Chart 3). For the same period, the number of Maryland Medicare beneficiaries rose by 8.04 percent while the overall population of Maryland grew by 2.35 percent. Measured on a per person basis, Medicare utilization declined 9.15 percent compared to an all-payer utilization decline of 5.70 percent. Even if there was an implicit price increase of 5.70 percent to account for the all-payer reduction per capita, this would have resulted in Medicare savings of 3.66 percent, more than 5 percent greater than the actual experience (3.66 percent savings versus a 1.70 percent increase.) These per capita volume changes are consistent with the monthly commission reports, reflecting Medicare and all-payer volume changes and volume changes per 1,000 population. If the commission is concerned about the annual payment update causing Medicare payment growth to exceed the total cost of care guardrail, it should consider a review of the effects of utilization reduction per capita and the interaction with global budgets, then rebalance the rate setting system using the payer differential. The timing of this differential adjustment is appropriate before Maryland moves to the Enhanced Total Cost of Care Model in January 2019.
iii. The Medicare Performance Adjustment (MPA) is currently in effect.
In 2017, the commission adopted the MPA, beginning with a calendar year 2018 performance period. The MPA places hospitals at risk for the variance in calendar year 2018 Medicare total cost of care. The commission adopted this policy to drive hospital-specific accountability for total cost of care growth in calendar year 2018 via rewards or penalties. This new incentive gives additional cushion for Medicare TCOC performance in 2018.

Nelson J. Sabatini May 22, 2018 Page 4
iv. The update does not fully account for expected service growth from an aging population. During the last Payment Models Work Group meeting on May 3, MHA noted that the 0.46 percent set-aside for the demographic adjustment limits the amount provided for age-weighted use rates. Commission staff agreed. The commission’s calculation weights service use by age classifications (for example, people aged 75-84 use services about three times the statewide average, while people aged 15-44 use services at about 60 percent of the average). Each of these age-weighted use rates is calculated for every hospital, minus an adjustment for potentially avoidable utilization (PAU) and application of a 50 percent variable cost factor. However, the update model limits the demographic adjustment to statewide population growth. On a cumulative basis, this creates a 0.36 percent negative difference (Chart 4).
v. Savings shared with payers exceeds infrastructure investment funding. On an ongoing and permanent basis, hospitals are returning an additional $77 million in payer savings, per year, beyond care transformation investments. The HSCRC staff’s draft recommendation removes 1.75 percent, or $299 million, of statewide revenue for payer savings. Including the 2014 through 2016 infrastructure investments, regional transformation grants, and the original Total Patient Revenue (TPR) incentives, 1.35 percent, or $222 million, was placed in hospital rates for infrastructure and care transformation incentives (Chart 5). It will be extremely challenging to expand upon the field’s care transformation efforts when the first $77 million needs to be funded from current operations, combined with receiving a payment update below inflation. Hospitals do not support the HSCRC’s shared savings policy, which would reduce revenue by an estimated 1.75 percent. The amount of the reduction is too severe. Moreover, the way the Agency for Healthcare Research and Quality’s Prevention Quality Indicators (PQIs) are quantified as a percentage of a hospital’s total revenue is an inappropriate use of the indicators. PQIs are intended to measure the percentage of admissions for “ambulatory sensitive conditions” within a population, not as a percentage of hospital discharges, as HSCRC measures them. Hospital discharges shift for a number of reasons, making the calculation unsteady as a basis for payment incentives that materially affect hospitals’ viability. HSCRC staff are aware of this concern and in the process of revising how PQIs are measured, the proposed revenue reduction should be eliminated until this issue can be resolved.
vi. The prior year base period affects Maryland’s total cost of care guardrail. Growth in hospital costs and total cost of care during the first four years of the model shows two peaks and two valleys. These peaks and valleys did not affect the favorable performance on the cumulative hospital savings measure, but did result in unfavorable performance on the annual total cost of care measure (Chart 6).
In year one and year three, Maryland’s Medicare hospital spending per beneficiary growth rate was substantially below the nation’s. In year two and year four, Maryland’s

Nelson J. Sabatini May 22, 2018 Page 5
hospital spending per beneficiary growth rate was only slightly below the nation’s. The strong performance in years one and three likely contributed to the higher statewide growth rates in years two and four, if for no other reason than that the base period was lower, affording a greater risk to grow faster than the nation. Assuming the pattern continues, calendar year 2018 (year five) should see favorable total cost of care performance compared to calendar year 2017.
vii. The draft recommendation does not reflect the Quality Based Reimbursement (QBR) adjustment. The amount approved by the commission will apply to rate year 2019. Though the final adjustment is not expected until January 1, 2019, the estimated revenue change for Maryland’s QBR program is not included in the template. At the May public meeting, staff stated that they expect the QBR placeholder to be negative – that is, adverse to hospitals. Early projections suggest this amount would reduce the average update by at least another 0.3 percent, reducing all-payer spending per capita to 1.52 percent. HSCRC staff also suggested that some funding may be included for oncology drugs, but this amount is unlikely to offset the entire QBR reduction.
3. The productivity offset for Maryland’s psychiatric and specialty hospitals should be eliminated, or at least reduced HSCRC staff is recommending an update of 1.77 percent, or 2.57 percent inflation less a 0.8 percent productivity adjustment, for Maryland’s psychiatric and specialty hospitals. At the time when investments are sorely needed, the 0.8 percent reduction will put serious pressure on the ability to invest in critical behavioral health services. The proposed adjustment is double what the productivity offset was for rate year 2018. Mt. Washington Pediatric Hospital has no Medicare volume and will not impact the total cost of care growth. We respectfully request staff consider eliminating, or at least reducing, the productivity offset.
Commission Process for Handling of Stakeholder Comments At the May public meeting, the commission discussed the process for stakeholders to provide feedback to commission staff and how that feedback was incorporated into the draft recommendation. As mentioned during the discussion, the commission’s Payment Models Work Group is used to solicit feedback from stakeholders. We appreciate commission staff listening to stakeholder concerns and attempting to be fair and balanced in developing the draft recommendation. In the recently adopted guidance on adopting staff recommendations, the commission approved a policy that requires staff to address stakeholder comments in the final recommendation. We look forward to these written responses. Already, MHA has raised several considerations that have not been addressed in the Payment Models Work Group, or for which responses are not clear. First, staff noted that the scheduled payback from The Johns Hopkins Hospital will increase revenue by $10 million in calendar year

Nelson J. Sabatini May 22, 2018 Page 6
2018. It is not clear if the amount provided to Johns Hopkins, net of last year’s payback, is reflected in the calendar year 2017 base period figure. Second, for rate year 2018, the commission approved an all-payer revenue increase of 3.34 percent, or 2.97 percent per capita. This year’s staff recommendation reflects an actual global budgeted revenue increase from $17.1 billion in rate year 2017 to $17.5 billion in rate year 2018. That amounts to an all-payer revenue increase of 2.64 percent. We have respectfully asked staff to clarify this discrepancy. Third, we requested a reconciliation of the amounts provided for unforeseen adjustments in rate year 2018. Finally, in the last work group meeting, the hospital field noted that the first quarter calendar year 2018 Global Insight data reflect an inflation factor of 2.68 percent, 0.11 percent higher than the previous estimate. Staff did not account for this adjustment in their presentation of the draft recommendation at the May public meeting. Historically, the Global Insight release from the first quarter of the calendar year immediately preceding the update has been used as the inflation factor. We did not expect staff responses to all of these requests be included in the draft recommendation, but we would appreciate receiving this information at the next work group meeting on May 31. We look forward to discussing the update at the May 31 meeting and at the HSCRC’s monthly public meeting on June 13, as we continue to work together on behalf of the patients and communities we serve. Sincerely,
Brett McCone, Vice President cc: Joseph Antos, Ph.D., Vice Chairman Adam Kane
Victoria W. Bayless Jack C. Keane John M. Colmers Donna Kinzer, Executive Director James Elliott, M.D. Jerry Schmith, Director, Revenue & Compliance
Enclosure

Chart 1
National Medicare Hospital Spending per Beneficiary GrowthActual First Quarter Federal Fiscal Year 2018 Compared to First Quarter Federal Fiscal Year 2017;

Chart 2
Medicare Per Capita Hospital Spending Projections[Based on Fiscal Year 2019 President's Budget]
Hospital Spending per Beneficiary
Prior YearTotal Total President's
CY Inpatient Outpatient Hospital Inpatient Outpatient Hospital Budget Difference2013 3,666$ 1,095$ 4,761$ 2014 3,645 1,241 4,886 -0.6% 13.3% 2.6% 2.6% 0.00%2015 3,682 1,346 5,028 1.0% 8.5% 2.9% 2.6% 0.31%2016 3,753 1,425 5,178 1.9% 5.9% 3.0% 1.1% 1.87%2017 3,783 1,548 5,331 0.8% 8.6% 3.0% 1.6% 1.33%2018 3,776 1,667 5,442 -0.2% 7.7% 2.1% 3.1% -1.06%2019 3,862 1,775 5,637 2.3% 6.5% 3.6%
CY14 - CY17 average difference 0.88%
Annual Per Capita Expenditures Per Capita Trend

Chart 3
Change in Medicare and All-Payer Utilization, and Utilization per CapitaUtilization defined as Equivalent Case Mix Adjusted Discharges (ECMADs)
`
A B = A(tot)C = (1+A) /
(1-B)-1 DE = (1+A) /
(1+K)-1 F = E(tot)G = (1+E) / (1-F) - 1 H = C - G
Unadjusted Use and Spending % Change Use and Spending % Change per Beneficiary
Payer
Service Use % Change
(ECMADs)Price
Increase
Net Change in Spending
Beneficiary or
Population Change
Service Use % Change
per Beneficiary
Price Increase (if per capita)
Net Change
in Spending
Cost Shift to/(from)
payerMedicare -1.84% 3.48% 1.70% 8.04% -9.15% 5.70% -3.66% 5.36%All Payer -3.48% 3.48% 0.00% 2.35% -5.70% 5.70% 0.00% 0.00%

Chart 4
Demographic Adjustment Compared to Population Growth Limit
Age and PAU
Adjusted Weighted Amount
Variable Cost
Factor (VCF)
Age/PAU Weighted Factor @ 50% VCF
Demographic limit
Limit Over / (Under)
Age/PAU @ 50% VCF
Rate year 2018 0.86% 50% 0.43% 0.36% -0.07%Rate year 2017 1.32% 50% 0.66% 0.44% -0.22%Rate year 2016 1.18% 50% 0.59% 0.47% -0.12%Rate year 2015 1.10% 50% 0.55% 0.60% 0.05%
Total -0.36%

Chart 5
Cumulative Infrastructure Funding; Cumulative Potentially Avoidable Utilization SavingsFinancial impacts in FY2018 dollars
% Rate Funding $ Impact Notes/Comments
Potentially avoidable utilization (PAU) savings and other funding offsetsShared savings offsetFY2014 -0.20% (34,200) Annual PAU savings offsetFY2015 -0.20% (34,200) Annual PAU savings offsetFY2016 -0.20% (34,200) Annual PAU savings offsetFY2017 -0.65% (111,150) Annual PAU savings offset, increased for FY2017FY2018 -0.20% (34,200) Annual PAU savings offsetFY2019 (proposed) -0.30% (51,300) Annual PAU savings offset
Subtotal PAU savings offset -1.75% (299,250)
Infrastructure / care coordination fundingTPR conversion funding (provided in FY2011) 0.27% 46,581$ 2011 TPR incentive, price leveled by 2% for five yearsInfrastructure fudningFY2014 0.22% 38,011$ HSCRC report to CMS (FY2014 budget was 0.25%)FY2015 0.28% 48,583 HSCRC GBR Summary FileFY2016 0.37% 63,057 HSCRC GBR Summary FileFY2017 - - No fundingFY2018 - - No fundingFY2019 - - No funding
Subtotal infrastructure funding 0.88% 149,652 TPR plus infrastructure funding 1.15% 196,232
Regional transformation grants (2016-2017); net of required return on investment (1/3 of total) 0.15% 25,926 Total less 30% return; HSCRC Nov 16 rec.Total infrastructure and transformation funding 1.30% 222,158$
PAU Savings net of infrastructure and transformation funding -0.45% (77,092)$
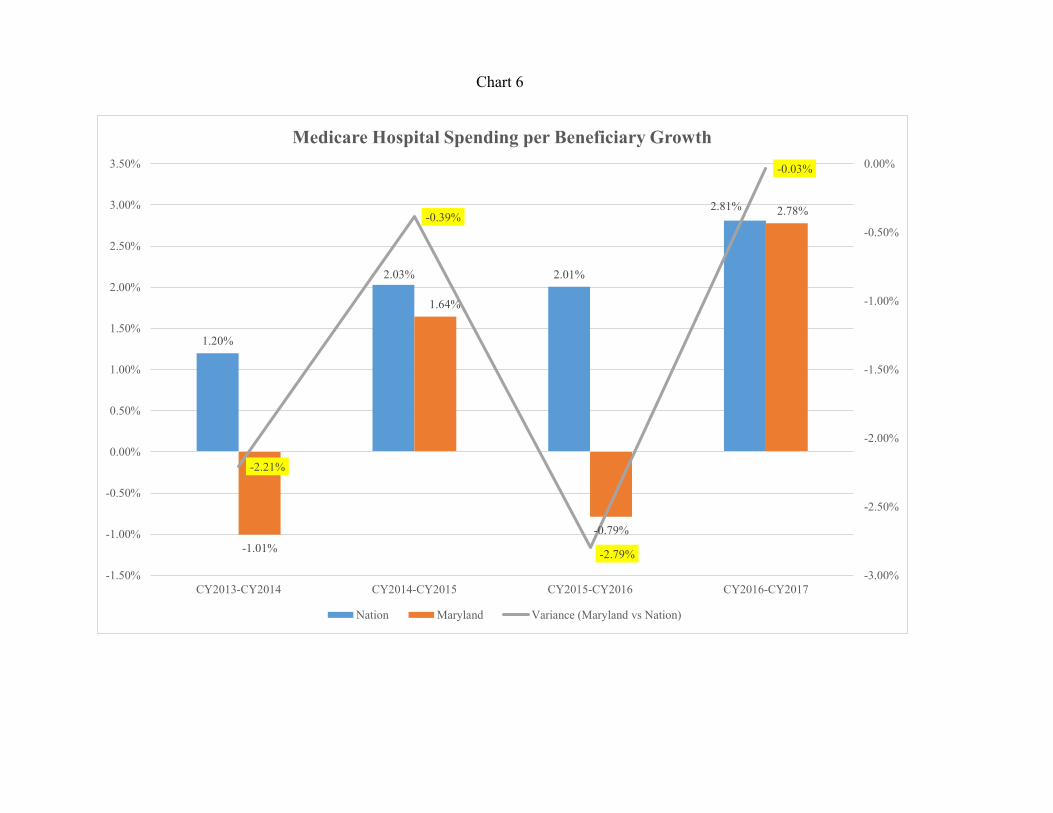
Chart 6
1.20%
2.03% 2.01%
2.81%
-1.01%
1.64%
-0.79%
2.78%
-2.21%
-0.39%
-2.79%
-0.03%
-3.00%
-2.50%
-2.00%
-1.50%
-1.00%
-0.50%
0.00%
-1.50%
-1.00%
-0.50%
0.00%
0.50%
1.00%
1.50%
2.00%
2.50%
3.00%
3.50%
CY2013-CY2014 CY2014-CY2015 CY2015-CY2016 CY2016-CY2017
Medicare Hospital Spending per Beneficiary Growth
Nation Maryland Variance (Maryland vs Nation)


Bradley S. Chambers President, MedStar Good Samaritan Hospital
President, MedStar Union Memorial Hospital
Senior Vice President, MedStar Health
MedStar Good Samaritan Hospital
5601 Loch Raven Blvd.
Baltimore, MD 21239
443-444-3902 PHONE
MedStarGoodSam.org
MedStar Union Memorial Hospital
201 E. University Pkwy.
Baltimore, MD 21218
410-554-2227 PHONE
MedStarUnionMemorial.org
May 22, 2018
Nelson J. Sabatini, Chairman
Health Services Cost Review Commission
4160 Patterson Avenue
Baltimore, MD 21215
Dear Chairman Sabatini:
On behalf of the MedStar Health System, MedStar Good Samaritan Hospital and MedStar Union Memorial Hospital, I
am writing to share a few additional comments on the Staff’s Draft Recommendation for Rate year 2019 beyond the
Maryland Hospital Association’s letter for the Hospital Industry.
While we appreciate the HSCRC staff deliberations on the proposed update factor, I remain extremely concerned that
the current proposal will result in another year of expense inflation outpacing revenue inflation. This disconnect
continues at a time when we are striving to build programs that align with our obligations under Waiver 2.0.
As you know, the community we serve, in particular at MedStar Good Samaritan, has a unique patient population. Our
patients consistently have multiple chronic conditions and co-morbidities. The PAU methodology already
disproportionately penalizes these hospitals due to the type of patients we serve. Providing lower than inflation
update factors only compounds the problem.
Our ability to better manage the chronic population we serve will be critical to our success under the new waiver. We
have a number of program plans under way that will allow us to better manage these patients in the outpatient setting
as desired under the new waiver. These programs include, but are not limited to the following:
Expansion of the Center for Successful Aging
Addition of the Center for Chronic Disease Management
Investments in post acute care coordination
Expansion of services provided in the Good Health Center
Investment in resources in the Emergency Department to ensure patients are being treated in the most appropriate care setting
These are just a few of the initiatives we are currently working on. Continuing to provide revenue updates at a rate
below expense inflation, coupled with the disproportionate penalties of some of the pay for performance programs,
will absolutely slow our progress on these important initiatives because our ability to fund these priorities will be
severely limited. Without investment in these types of programs, our ability to meet the goals of the new waiver will
be compromised. Therefore, I strongly urge you to consider an additional 0.5% for the FY 19 update factor.
Thank you for the opportunity to comment.
Sincerely
Bradley S. Chambers
President MedStar Good Samaritan and MedStar Union Memorial Hospitals
cc: Joseph Antos, Ph.D., Vice Chairman
Adam Kane
Victoria W. Bayless
Jack C. Keane
John M. Colmers
James Elliott, M.D.
Donna Kinzer, Executive Director
Jerry Schmith, Director Revenue and Compliance
P:\m\d\HSCRC\Update Ltr GSH_UMH May 2018


9000 Franklin Square Drive
Baltimore, Maryland
443-777-7850 PHONE 443-777-7904 FAX www.medstarfranklin.org Samuel E. Moskowitz, FACHE President Senior Vice President, MedStar Health
May 25, 2018 Nelson J. Sabatini Chairman, Health Services Cost Review Commission 4160 Patterson Avenue Baltimore, MD 21215 Dear Chairman Sabatini: On behalf of MedStar Franklin Square Medical Center (MFSMC), I am writing to offer my thoughts on the proposed HSCRC update for FY2019. The schedule released by the HSCRC staff shows an average of 2.8% for Maryland hospitals which includes the Global Insights inflation estimate. Unfortunately, it appears as though MFSMC will not receive an adjustment that is close to the Global Insights inflation factor of 2.57%. The reductions to the update factor that raise concern include:
(1) The update of 2.81% provides the add-back for the Quality Based Reimbursement but does not have any
estimates for FY2019 adjustments, including planned reductions for any changes in policy. We estimate this would translate into a hidden statewide reduction of 0.35%;
(2) The additional 0.30% for PAU savings affects MFSMC (and several of our MedStar hospitals)
disproportionally when the methodology was changed to add Ambulatory Care Sensitive Conditions (ASC’s). The inclusion of ASC’s penalizes community hospitals like MFSMC who have a disproportionate share of patients in our communities suffering from chronic conditions (as opposed to hospitals that are more surgically or tertiary care oriented); and,
(3) A set aside for unknown adjustments that is not released to the hospital industry in a formalized process.
I expect other community hospitals will see update factors that are well below existing inflation. Should hospitals see update factors like this moving forward, we will not be able to continue to invest in the transformation necessary to succeed under the new Maryland Model. MFSMC has made significant investments in a wide-range of population health improvements including medication assistance, patient transportation, patient navigators, assignment of transitional care nurses, the use of palliative care, and other care coordination assistance. I hope the HSCRC will strongly consider the MHA request of an additional 0.50% being added to the proposed update factor. This increase, while still below the Global Insights inflation factor, will allow us to continue to serve the communities that call upon us within the goals outlined in the new Maryland Model. Sincerely, Samuel E. Moskowitz, FACHE President


