
Appendix H: HST Alternative Figures and Tables
Figure H-1 HST Alternative – Distribution of Trips to/from Rail Station, AM-Peak Hour, 2020
1. San Francisco – Transbay option
2. San Francisco – 4th & Townsend
34
34
250501
516516
25034
34

3. Millbrae – San Francisco Airport
4. Redwood City
250
217
217
834
584
3434
1313
13 1313
13
13
13
80
80
73
6152
2124
6152
7362
73
62 62
170
145
73
62

5.Palo Alto
6. West Oakland
152129
152129 152
129
152 129
111
111
111
111
186
186
149149
186186
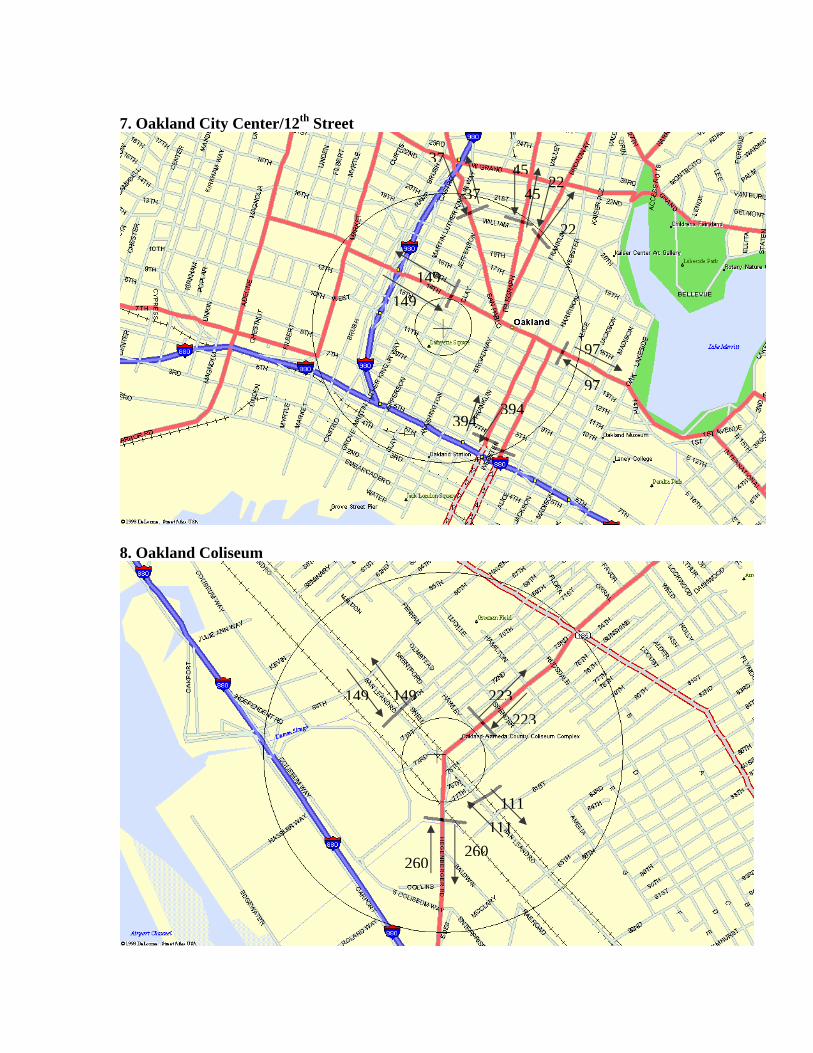
7. Oakland City Center/12th Street
8. Oakland Coliseum
37
3745
4522
22
97
97
149149
394394
223223
260260
111111
149 149

E-9. Union City
10. South Alameda
6551
52 41
41
5291
72
157
123
105
82
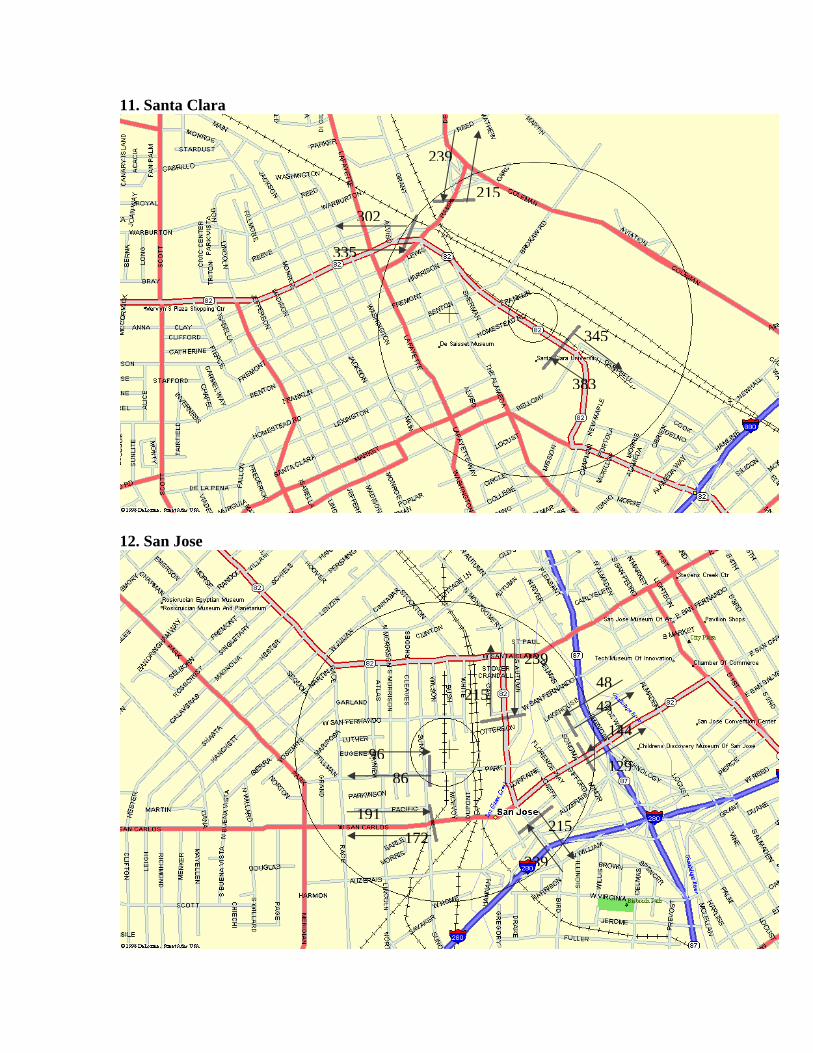
11. Santa Clara
12. San Jose
335
302
239
215
383
345
239
215
9686
191172
215
239 48
129
43144

13. Morgan Hill
14. Gilroy
6652
3140
1310
31
40
53
42
53 42
8062
8062
4031
66
52

15. Los Banos
15
15
15
15
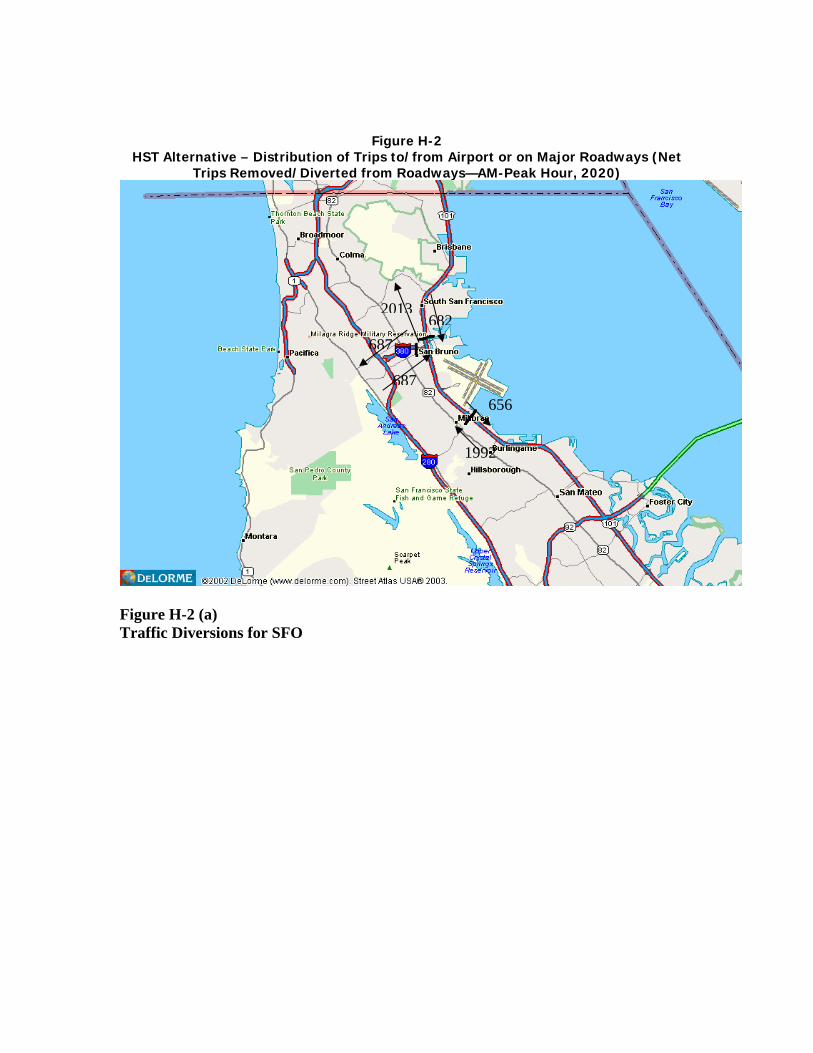
Figure H-2 HST Alternative – Distribution of Trips to/from Airport or on Major Roadways (Net
Trips Removed/Diverted from Roadways—AM-Peak Hour, 2020)
Figure H-2 (a) Traffic Diversions for SFO
1992
656
687
687
6822013
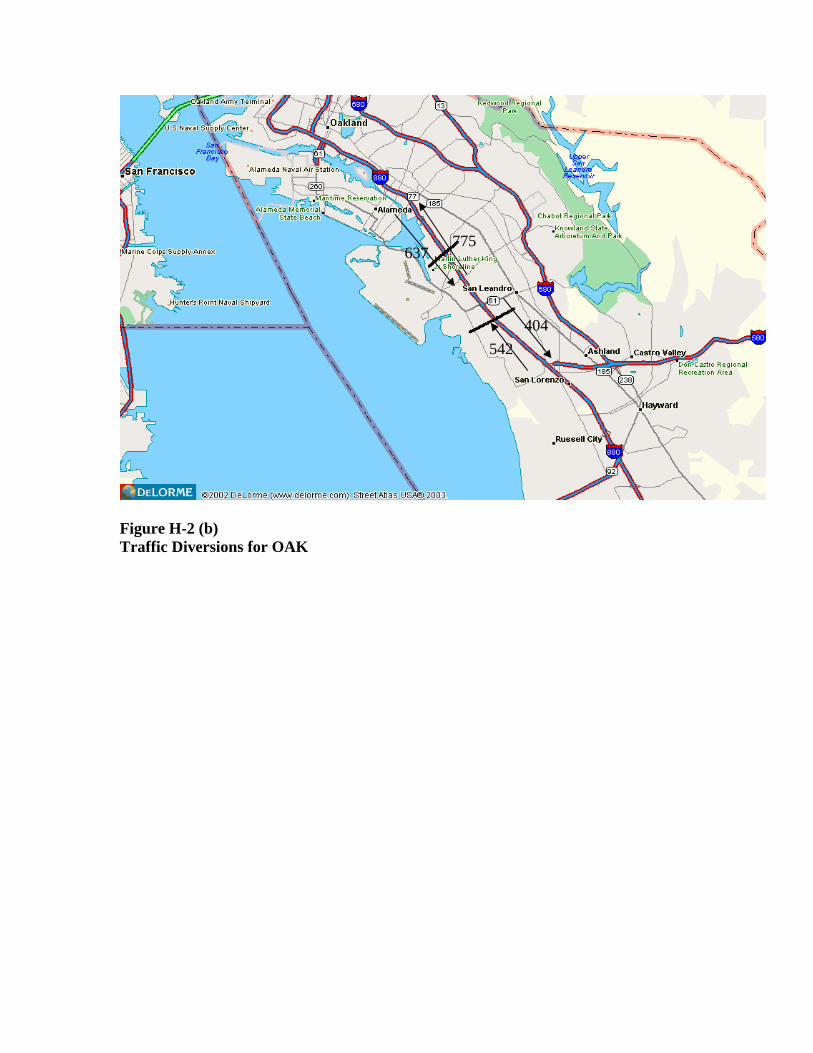
Figure H-2 (b) Traffic Diversions for OAK
542 404
637 775

Figure H-2(c)
641128
151 187
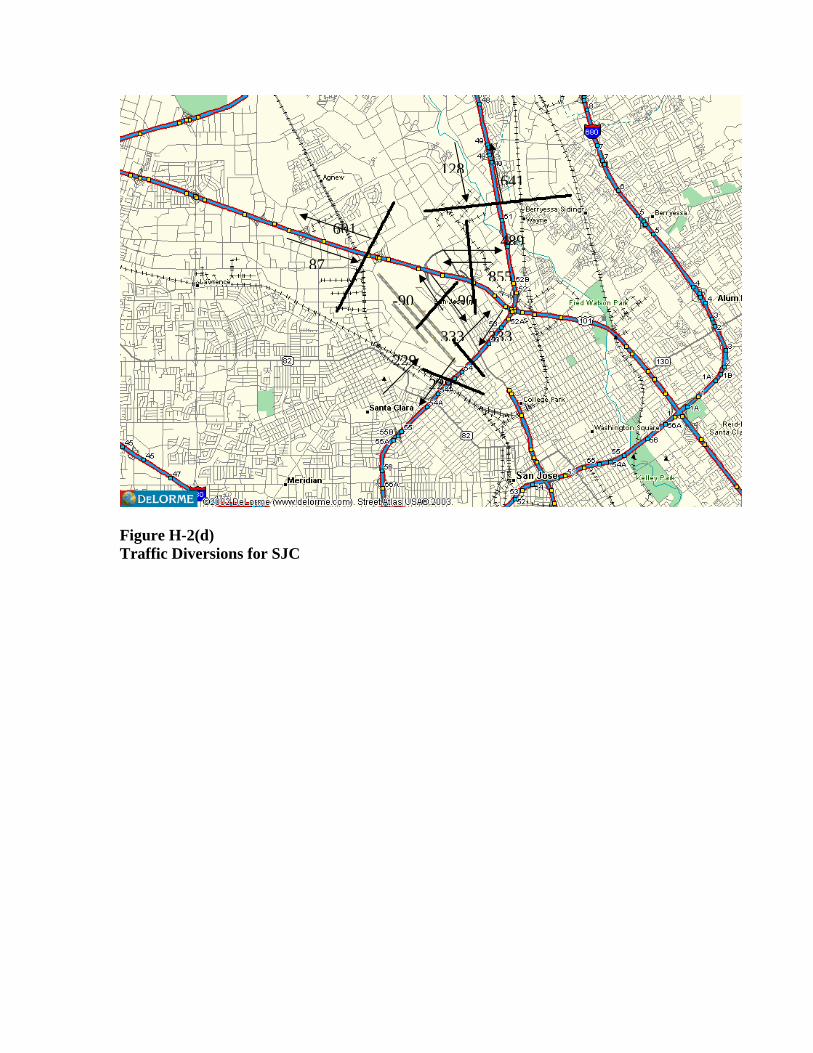
Figure H-2(d) Traffic Diversions for SJC
601
87
641128
229229
489
855
333333
-90 -90
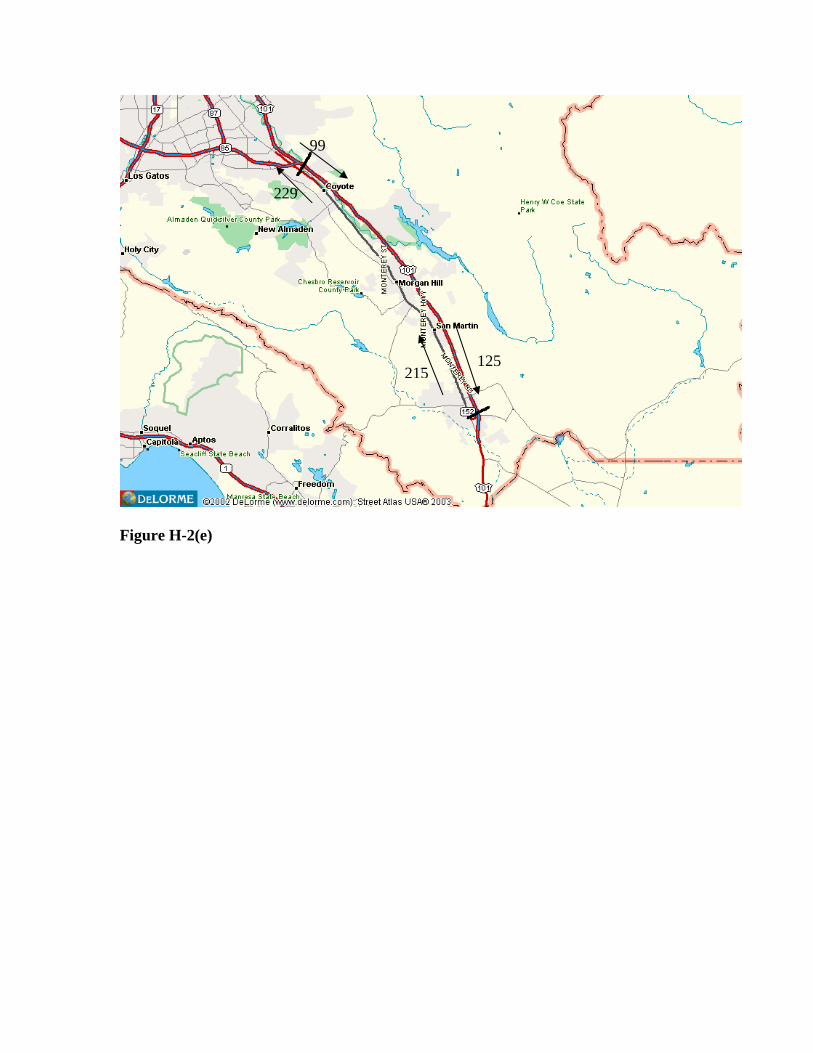
Figure H-2(e)
125 215
99
229
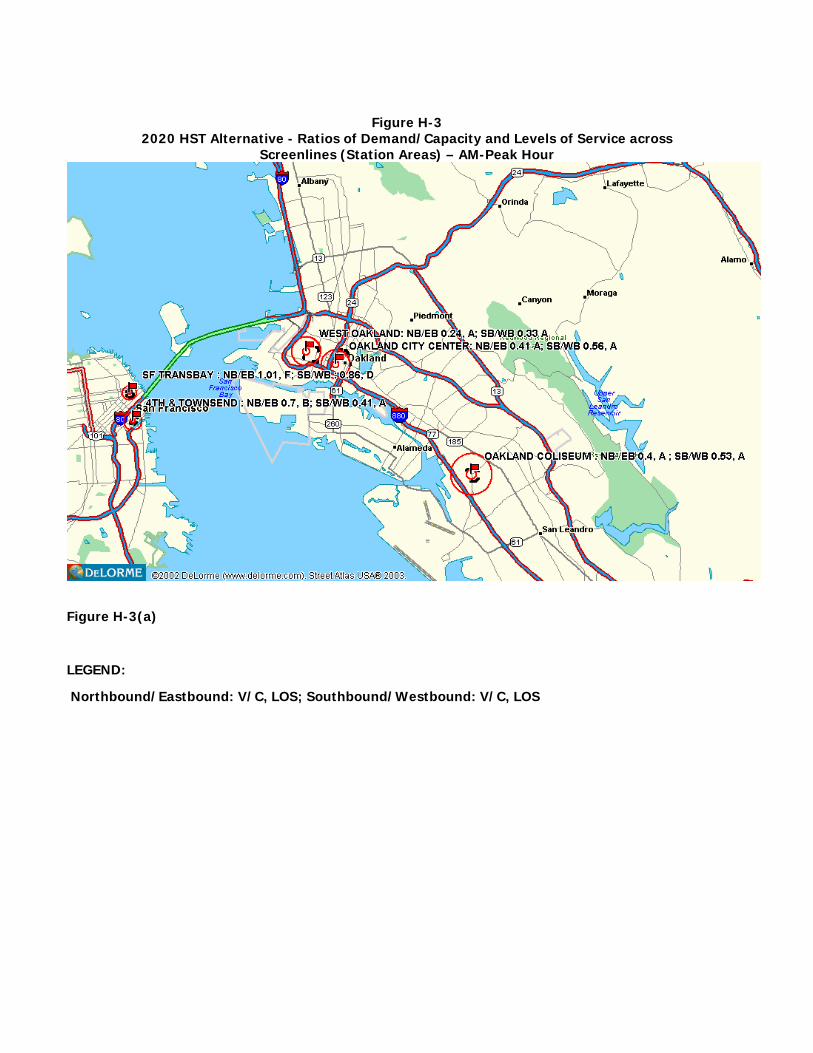
Figure H-3
2020 HST Alternative - Ratios of Demand/Capacity and Levels of Service across Screenlines (Station Areas) – AM-Peak Hour
Figure H-3(a)
LEGEND:
Northbound/Eastbound: V/C, LOS; Southbound/Westbound: V/C, LOS

Figure H-3(b)
LEGEND:
Northbound/Eastbound: V/C, LOS; Southbound/Westbound: V/C, LOS

Figure H-3(c)
LEGEND:
Northbound/Eastbound: V/C, LOS; Southbound/Westbound: V/C, LOS
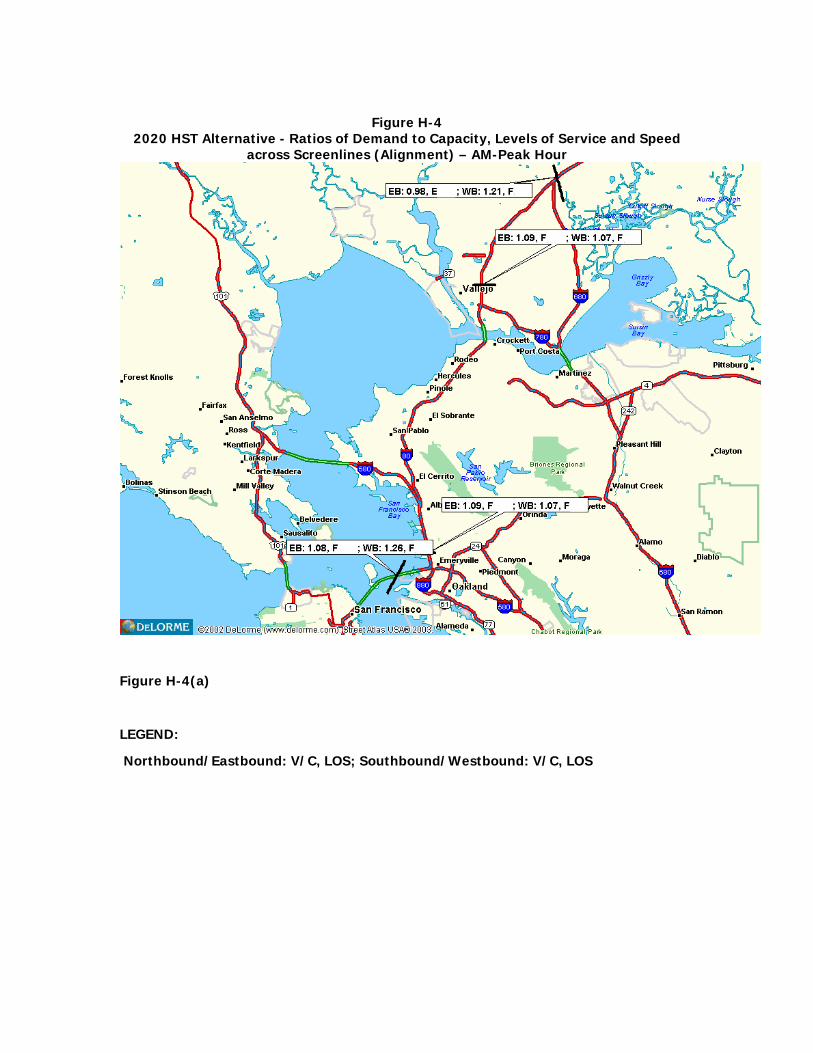
Figure H-4
2020 HST Alternative - Ratios of Demand to Capacity, Levels of Service and Speed across Screenlines (Alignment) – AM-Peak Hour
Figure H-4(a)
LEGEND:
Northbound/Eastbound: V/C, LOS; Southbound/Westbound: V/C, LOS
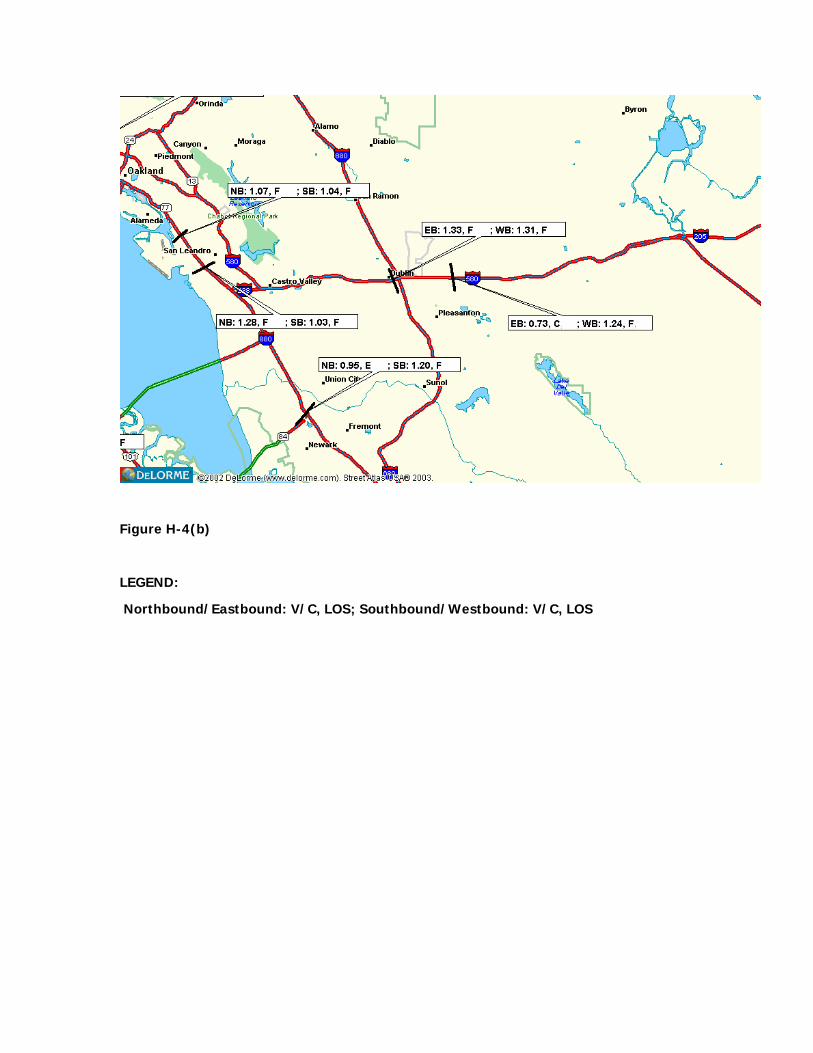
Figure H-4(b)
LEGEND:
Northbound/Eastbound: V/C, LOS; Southbound/Westbound: V/C, LOS
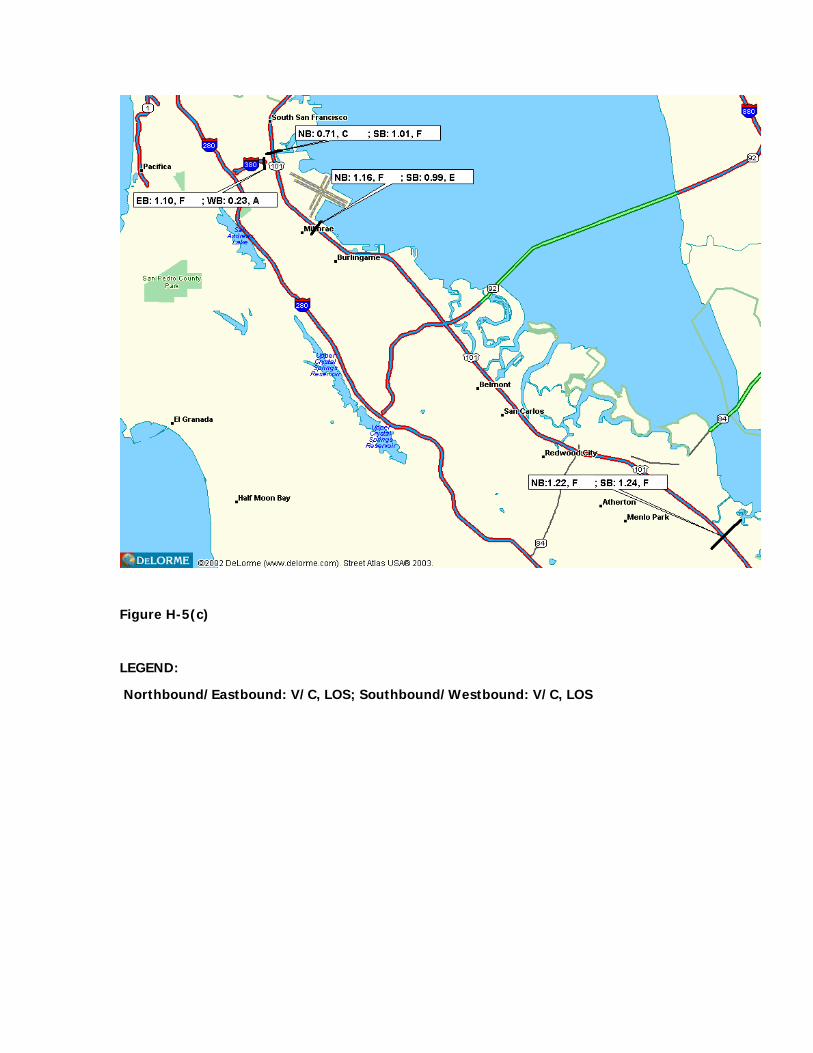
Figure H-5(c)
LEGEND:
Northbound/Eastbound: V/C, LOS; Southbound/Westbound: V/C, LOS
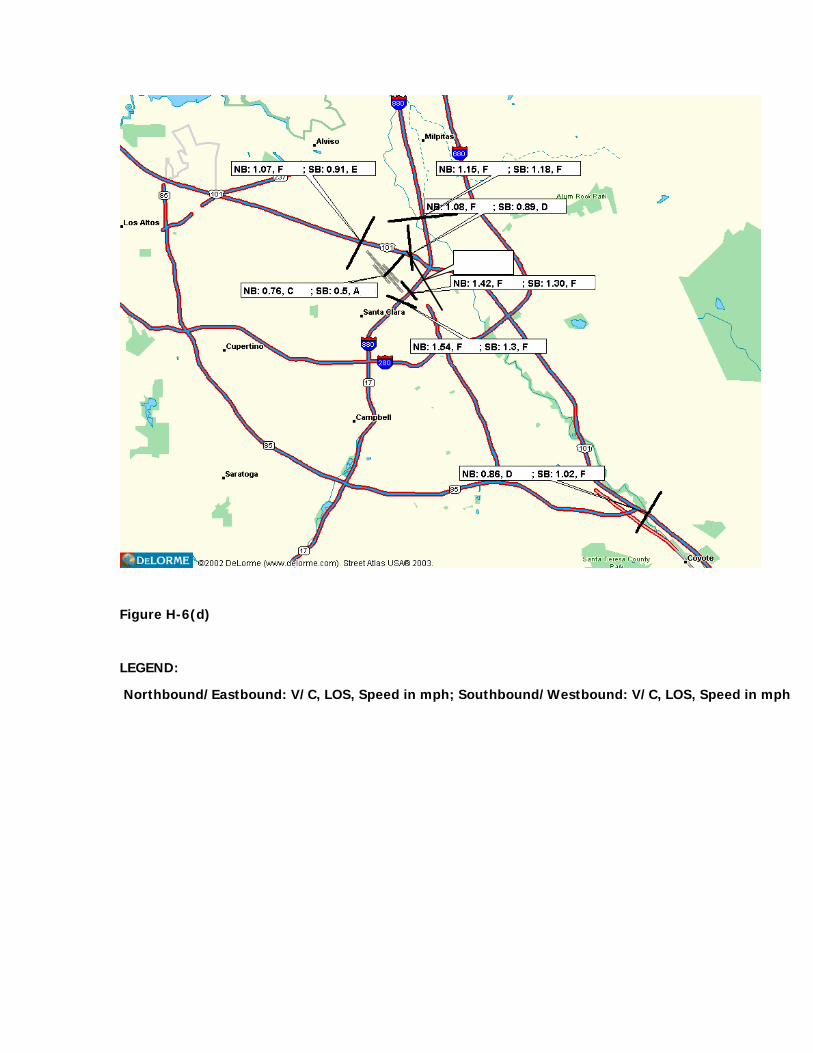
Figure H-6(d)
LEGEND:
Northbound/Eastbound: V/C, LOS, Speed in mph; Southbound/Westbound: V/C, LOS, Speed in mph

Figure H-7(e)
LEGEND:
Northbound/Eastbound: V/C, LOS, Speed in mph; Southbound/Westbound: V/C, LOS, Speed in mph
EB: 1.09, F; WB: 1.68, F

Table H-1
Detailed Analysis - Impacts to Traffic, Circulation and Parking HST Alternative
Bay Area to Merced Region
Roadway Links with Significant Impact-AM Peak at Screenline
(A,B,C,D,E,F)1
Public Transit Links Over
Capacity In Station
Area (H,M,L)
2
Goods Movement
Links Impacted (H,M,L)
2
Parking Facilities with
Significant Impact
(H,M,L) 2
Com-ments/ Notes
ACTUAL (1998) See Table F-2 None HST (2020)
See Table G-2 None The freeways are major
truck routes;
hence the impacts are similar to inter-city
link impacts.
The impacts are based on a qualitative analysis.
HST Corridor and Station Options
San José to San Francisco 1.26(F) M
Alignments 1998
1.29(F)
M
NB/EB SB/WB Stations Arterial V/C LOS V/C LOS
Mission St W. of 1st St 1.38 F 1.29 F Howard St W. of 1st St - - 0.01 A 1st S. of Howard St - - 0.95 E Fremont S. of Howard St 1.44 F - - Howard E. of Fremont
St 0.00 A 0.23 A Mission W. of Fremont St 0.61 B 0.27 A Fremont N. of Mission St 1.12 F - - 1st N. of Mission St - - 1.54 F
-Transbay Terminal (2020 HST)
Total Screenline 1.00 F 0.86 D
M
Most of the public transit links in the station area will operate
above capacity,
during peak hours
L
Since the HST plan does not
identify parking spaces
for the Transbay
Terminal, the impact will be
medium.
Mission St W. of 1st St 0.30 A 0.86 D Howard St W. of 1st St - - 0.07 A 1st S. of Howard St - - 0.91 E Fremont S. of Howard St 1.30 F - - Howard E. of Fremont
St 0.00 A 0.73 C Mission W. of Fremont St 0.29 A 0.01 A Fremont N. of Mission St 1.02 F - - 1st N. of Mission St - - 1.42 F
Transbay Terminal (1998)
Total Screenline 0.81 D 0.87 D
M
Most of the public transit links in the station area
operate above capacity,
during peak hours
L
Even though there are not
many parking spaces
available in the area, a
rough equilibrium is reached based
on the high prices for parking.
Townsend W. of 4th St 0.00 A 0.00 A King W. of 4th St 0.18 A 0.18 A 280 Connector to 4th St 1.07 F - - 4th St S. of King 0.03 A 0.65 B King E. of 4th St 1.97 F - -
-4th and King (2020 HST)
Townsend E. of 4th St 0.02 A 0.02 A
M
Most of the public transit links in the
L
Parking garage for
HST

Table H-1 Detailed Analysis - Impacts to Traffic, Circulation and Parking
HST Alternative Bay Area to Merced Region
Roadway Links with Significant Impact-AM Peak at Screenline
(A,B,C,D,E,F)1
Public Transit Links Over
Capacity In Station
Area (H,M,L)
2
Goods Movement
Links Impacted (H,M,L)
2
Parking Facilities with
Significant Impact
(H,M,L) 2
Com-ments/ Notes
Zone access E. of 4th St 0.36 A 0.01 A 4th St N. of Townsend 0.16 A 0.56 A
Total Screenline
0.70 B 0.41 A
station area will operate
above capacity,
during peak hours
passengers, provided in the plan will reduce the
impact to low.
Townsend W. of 4th St 0.00 A 0.00 A King W. of 4th St 0.01 A 0.01 A 280 Connector to 4th St 0.85 D - - 4th St S. of King 0.01 A 0.40 A King E. of 4th St 0.89 D - - Townsend E. of 4th St 0.00 A 0.00 A Zone access E. of 4th St 0.01 A 0.03 A 4th St N. of Townsend 1.72 F 0.30 A
-4th and King (1998)
Total Screenline 0.54 A 0.14 A
L
L
E. Millbrae Ave W. of 82 1.26 F 0.28 A Murchinson W. of 82 0.17 A 0.00 A Trousdale W. of 82 0.83 D 0.28 A 82 S. of Trousdale 0.51 A 0.85 D California S. of Trousdale 0.32 A 1.37 F Rollins S. of E. Millbrae Ave 0.23 A 0.31 A E. Millbrae Ave W. of Rollins 1.63 F 0.94 E 82 N. of E. Millbrae Ave 0.78 C 1.07 F
-Millbrae (2020 HST)
Total Screenline 0.96 E 0.76 C
L
L
The parking facility that
will be provided for
the HST passengers
near the station, along
with the proposed
BART parking
garage (4000-car garage) reduces the
impact to low.
E. Millbrae Ave W. of 82 1.15 F 0.24 A Murchinson W. of 82 0.00 A 0.00 A Trousdale W. of 82 0.61 B 0.22 A 82 S. of Trousdale 0.41 A 0.49 A California S. of Trousdale 0.23 A 1.20 F Rollins S. of E. Millbrae Ave 0.14 A 0.30 A E. Millbrae Ave W. of Rollins 1.50 F 0.83 D 82 N. of E. Millbrae Ave 0.40 A 0.70 C
Millbrae (1998)
Total Screenline 0.74 C 0.54 A
L
M
The Caltrain parking near the Millbrae
Station is currently
operating at or slightly above
capacity.
Hopkins W. of 82 1.15 F 0.64 B Broadway W. of 82 0.24 A 0.84 D James W. of 82 0.02 A 0.00 A Jefferson W. of 82 0.68 B 0.19 A 82 S. of Jefferson 0.31 A 0.40 A
-Redwood City (2020 HST)
Middlefield S. of Jefferson 0.23 A 0.35 A
L

Table H-1 Detailed Analysis - Impacts to Traffic, Circulation and Parking
HST Alternative Bay Area to Merced Region
Roadway Links with Significant Impact-AM Peak at Screenline
(A,B,C,D,E,F)1
Public Transit Links Over
Capacity In Station
Area (H,M,L)
2
Goods Movement
Links Impacted (H,M,L)
2
Parking Facilities with
Significant Impact
(H,M,L) 2
Com-ments/ Notes
Broadway S. of Jefferson 0.65 B 0.60 A Jefferson E. of Broadway 0.82 D 1.09 F Middlefield N. of Broadway 0.27 A 0.62 B Whipple E. of 82 1.12 F 0.76 C Stafford N. of Whipple 0.20 A 0.30 A 82 N. of Whipple 0.75 C 0.88 D Whipple W. of 82 1.19 F 0.53 A
Total Screenline 0.67 B 0.64 B
L
Required parking spaces
for HST passengers
will be provided near
the station.
Hopkins W. of 82 1.04 F 0.82 D Broadway W. of 82 0.22 A 0.65 B James W. of 82 0.00 A 0.00 A Jefferson W. of 82 0.60 B 0.19 A 82 S. of Jefferson 0.38 A 0.62 B Middlefield S. of Jefferson 0.11 A 0.24 A Broadway S. of Jefferson 0.75 C 0.19 A Jefferson E. of Broadway 0.56 A 0.85 D Middlefield N. of Broadway 0.05 A 0.55 A Whipple E. of 82 0.82 D 0.40 A Stafford N. of Whipple 0.19 A 0.00 A 82 N. of Whipple 1.15 F 1.52 F Whipple W. of 82 1.04 F 0.22 A
Redwood City (1998)
Total Screenline 0.65 B 0.60 A
L
L
Arboretum N. of Palm 1.56 F 0.36 A Palm W. of Arboretum 0.53 A 0.97 E 82 S. of Arboretum 0.24 A 0.17 A Alma S. of Embarcadero 0.93 E 0.93 E Embarcadero E. of Alma 0.48 A 0.76 C University E. of Alma 1.37 F 1.21 F Alma N. of University 0.25 A 0.91 E 82 N. of University 0.20 A 0.31 A
-Palo Alto (2020 HST)
Total Screenline 0.46 A 0.45 A
L
L
Arboretum N. of Palm 1.64 F 0.29 A Palm W. of Arboretum 0.42 A 1.22 F 82 S. of Arboretum 1.13 F 0.98 E Alma S. of Embarcadero 0.51 A 0.03 A Embarcadero E. of Alma 0.26 A 0.64 B University E. of Alma 1.22 F 1.18 F Alma N. of University 0.05 A 0.24 A 82 N. of University 0.67 B 0.99 E
Palo Alto (1998)
Total Screenline 0.89 D 0.84 D
L
L
Benton W. of Lafayette 0.86 D 0.31 A Homestead W. of Lafayette 0.83 D 1.06 F
-Santa Clara (2020 HST)
Market W. of Lafayette 1.07 F - -
L

Table H-1 Detailed Analysis - Impacts to Traffic, Circulation and Parking
HST Alternative Bay Area to Merced Region
Roadway Links with Significant Impact-AM Peak at Screenline
(A,B,C,D,E,F)1
Public Transit Links Over
Capacity In Station
Area (H,M,L)
2
Goods Movement
Links Impacted (H,M,L)
2
Parking Facilities with
Significant Impact
(H,M,L) 2
Com-ments/ Notes
Washington S. of Market 0.92 E 0.56 A Park S. of Alameda 1.01 F 0.18 A Alameda E. of Park 0.13 A 0.76 C 82 N. of Alameda 0.68 B 0.83 D Coleman/Delacruz Ramps 1.51 F 0.90 D 82 E. of Lafayette 0.83 D 0.74 C Lafayette N. of Benton 1.30 F 0.47 A
Total Screenline 0.90 D 0.81 D
L
Required
parking will be provided
for this proposed HST
station.
Benton W. of Lafayette 0.00 A 0.00 A Homestead W. of Lafayette 0.25 A 0.78 C Market W. of Lafayette 0.77 C - - Washington S. of Market 0.76 C 0.43 A Park S. of Alameda 0.60 A 0.03 A Alameda E. of Park 0.13 A 0.36 A 82 N. of Alameda 0.78 C 0.62 B Coleman/Delacruz Ramps 1.26 F 0.44 A 82 E. of Lafayette 0.56 A 0.43 A Lafayette N. of Benton 1.16 F 0.39 A
Santa Clara (1998)
Total Screenline 0.72 C 0.48 A
L L
San José to Oakland
Alignments (not stations)
- Hayward/I-880 (includes Union City Station)
1.36 (F) M
Actual (1998) 1.34 (F) M - Hayward/ Niles/ Mulford1
Actual (1998) NB/EB SB/WB Stations
Arterial V/C LOS V/C LOS
Peralta N. of 8th St 0.01 A 0.00 A
8th St W. of Mandela Pkwy - - 0.74 C
Adeline S. of 8th St 0.24 A 0.09 A
-West Oakland (2020 HST)
8th St W. of Adeline 0.10 A 0.56 A
L
L
The West Oakland
Station area is adjacent to the
Port of Oakland, one of the biggest ports in the
L
1 Includes Auto Mall Pkwy Station.
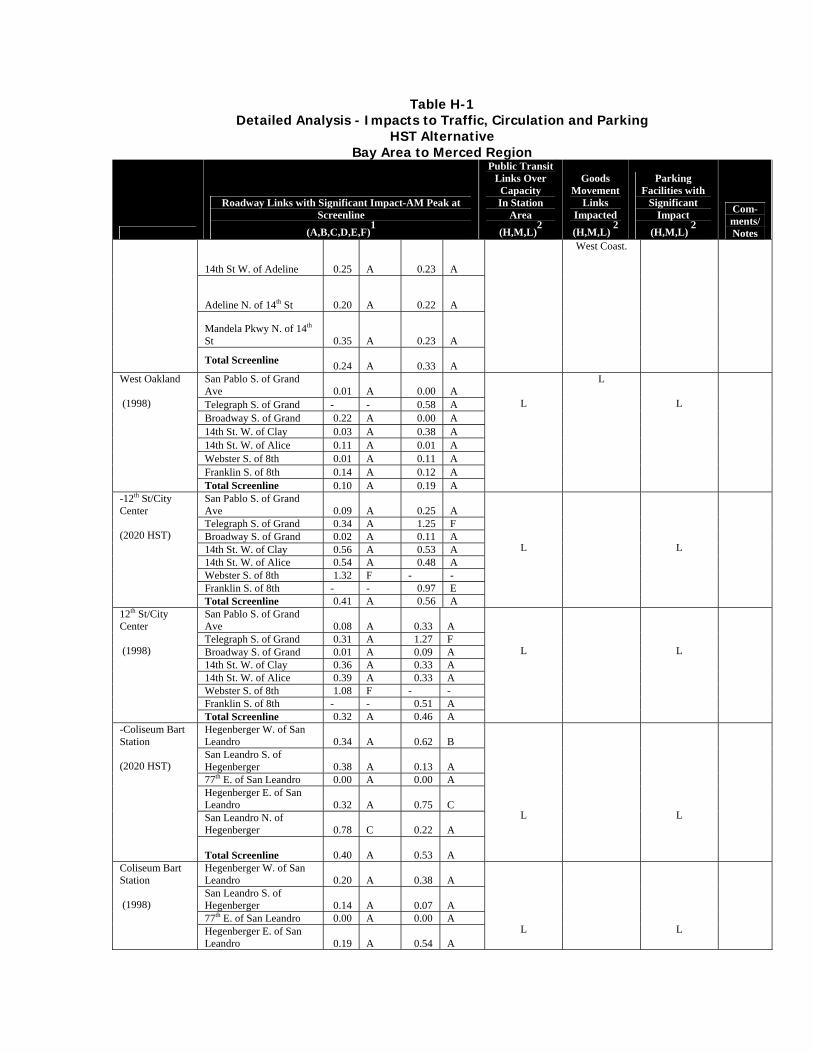
Table H-1 Detailed Analysis - Impacts to Traffic, Circulation and Parking
HST Alternative Bay Area to Merced Region
Roadway Links with Significant Impact-AM Peak at Screenline
(A,B,C,D,E,F)1
Public Transit Links Over
Capacity In Station
Area (H,M,L)
2
Goods Movement
Links Impacted (H,M,L)
2
Parking Facilities with
Significant Impact
(H,M,L) 2
Com-ments/ Notes
14th St W. of Adeline 0.25 A 0.23 A
Adeline N. of 14th St 0.20 A 0.22 A
Mandela Pkwy N. of 14th
St 0.35 A 0.23 A
Total Screenline 0.24 A 0.33 A
West Coast.
San Pablo S. of Grand Ave 0.01 A 0.00 A Telegraph S. of Grand - - 0.58 A Broadway S. of Grand 0.22 A 0.00 A 14th St. W. of Clay 0.03 A 0.38 A 14th St. W. of Alice 0.11 A 0.01 A Webster S. of 8th 0.01 A 0.11 A Franklin S. of 8th 0.14 A 0.12 A
West Oakland (1998)
Total Screenline 0.10 A 0.19 A
L
L
L
San Pablo S. of Grand Ave 0.09 A 0.25 A Telegraph S. of Grand 0.34 A 1.25 F Broadway S. of Grand 0.02 A 0.11 A 14th St. W. of Clay 0.56 A 0.53 A 14th St. W. of Alice 0.54 A 0.48 A Webster S. of 8th 1.32 F - - Franklin S. of 8th - - 0.97 E
-12th St/City Center (2020 HST)
Total Screenline 0.41 A 0.56 A
L
L
San Pablo S. of Grand Ave 0.08 A 0.33 A Telegraph S. of Grand 0.31 A 1.27 F Broadway S. of Grand 0.01 A 0.09 A 14th St. W. of Clay 0.36 A 0.33 A 14th St. W. of Alice 0.39 A 0.33 A Webster S. of 8th 1.08 F - - Franklin S. of 8th - - 0.51 A
12th St/City Center (1998)
Total Screenline 0.32 A 0.46 A
L
L
Hegenberger W. of San Leandro 0.34 A 0.62 B San Leandro S. of Hegenberger 0.38 A 0.13 A 77th E. of San Leandro 0.00 A 0.00 A Hegenberger E. of San Leandro 0.32 A 0.75 C San Leandro N. of Hegenberger 0.78 C 0.22 A
-Coliseum Bart Station (2020 HST)
Total Screenline 0.40 A 0.53 A
L
L
Hegenberger W. of San Leandro 0.20 A 0.38 A San Leandro S. of Hegenberger 0.14 A 0.07 A 77th E. of San Leandro 0.00 A 0.00 A
Coliseum Bart Station (1998)
Hegenberger E. of San Leandro 0.19 A 0.54 A
L
L

Table H-1 Detailed Analysis - Impacts to Traffic, Circulation and Parking
HST Alternative Bay Area to Merced Region
Roadway Links with Significant Impact-AM Peak at Screenline
(A,B,C,D,E,F)1
Public Transit Links Over
Capacity In Station
Area (H,M,L)
2
Goods Movement
Links Impacted (H,M,L)
2
Parking Facilities with
Significant Impact
(H,M,L) 2
Com-ments/ Notes
San Leandro N. of Hegenberger 0.58 A 0.12 A
Total Screenline 0.24 A 0.35 A
Decoto W. of Alvarado Niles 0.35 A 0.74 C Alvarado Niles S. of Decoto 0.52 A 0.50 A 238 S. of 7th 0.30 A 0.66 B 238 N. of Decoto 0.35 A 1.04 F Decoto E. of Alvarado Niles 0.30 A 0.60 A Alvarado Niles N. of Decoto 0.56 A 0.60 B
-Union City (2020 HST)
Total Screenline 0.43 A 0.61 B
L
L
L
Adequate parking spaces
for the HST park-and-ride
passengers will be
provided as part of the HST plan.
Decoto W. of Alvarado Niles 0.41 A 0.93 E Alvarado Niles S. of Decoto 0.58 A 0.43 A 238 S. of 7th 0.14 A 0.62 B 238 N. of Decoto 0.21 A 0.62 B Decoto E. of Alvarado Niles 0.27 A 0.58 A Alvarado Niles N. of Decoto 0.35 A 0.41 A
Union City (1998)
Total Screenline 0.40 A 0.59 A
L
L
Auto Mall Pkwy E. of Boyce 0.26 A 0.23 A Boyce Road N. of Auto Mall 0.07 A 1.30 F
- Auto Mall Pkwy (2020 HST) Total Screenline 0.19 A 0.61 B
L
L
Auto Mall Pkwy E. of Boyce 0.18 A 0.04 A Boyce Road N. of Auto Mall 0.01 A 0.74 C
Auto Mall Pkwy (1998)
Total Screenline 0.12 A 0.29 A
L
L
San José to Merced
Alignments
-Diablo Range Direct
SR 152 - 1.68 (F) H
Actual (1998) SR 152 - 1.53 (F) H Caltrain/Gilroy Pacheco Pass2
Actual (1998) NB/EB SB/WB Stations
Arterial V/C LOS V/C LOS
Park W. of 82 0.26 A 0.32 A San Carlos W. of 82 1.18 F 0.82 D Bird S. of San Carlos 1.05 F 0.35 A San Carlos E. of 82 0.86 D 0.33 A Park E. of 82 0.19 A 0.29 A
-San José (Diridon) (2020 HST)
82 N. of Park 0.32 A 0.19 A
L
L
2 Includes Gilroy and Los Baños Station. The Gilroy ByPass Option includes Morgan Hill and Los Baños Station.
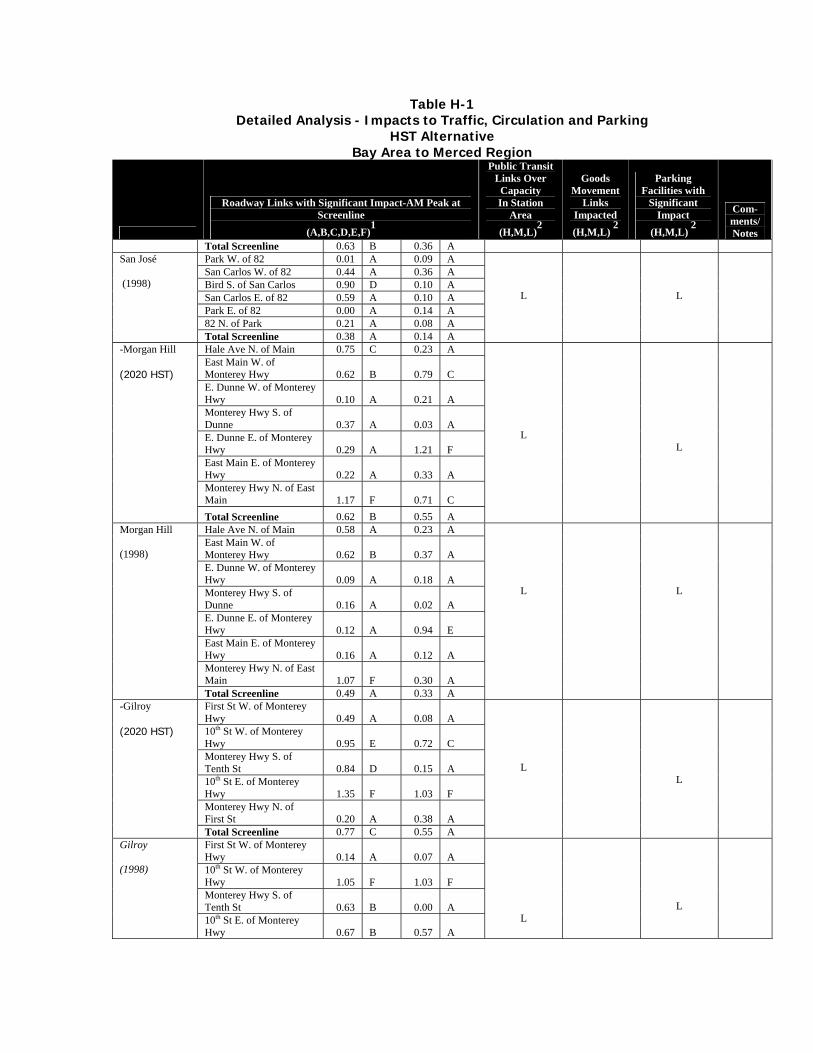
Table H-1 Detailed Analysis - Impacts to Traffic, Circulation and Parking
HST Alternative Bay Area to Merced Region
Roadway Links with Significant Impact-AM Peak at Screenline
(A,B,C,D,E,F)1
Public Transit Links Over
Capacity In Station
Area (H,M,L)
2
Goods Movement
Links Impacted (H,M,L)
2
Parking Facilities with
Significant Impact
(H,M,L) 2
Com-ments/ Notes
Total Screenline 0.63 B 0.36 A Park W. of 82 0.01 A 0.09 A San Carlos W. of 82 0.44 A 0.36 A Bird S. of San Carlos 0.90 D 0.10 A San Carlos E. of 82 0.59 A 0.10 A Park E. of 82 0.00 A 0.14 A 82 N. of Park 0.21 A 0.08 A
San José (1998)
Total Screenline 0.38 A 0.14 A
L
L
Hale Ave N. of Main 0.75 C 0.23 A East Main W. of Monterey Hwy 0.62 B 0.79 C E. Dunne W. of Monterey Hwy 0.10 A 0.21 A Monterey Hwy S. of Dunne 0.37 A 0.03 A E. Dunne E. of Monterey Hwy 0.29 A 1.21 F East Main E. of Monterey Hwy 0.22 A 0.33 A Monterey Hwy N. of East Main 1.17 F 0.71 C
-Morgan Hill (2020 HST)
Total Screenline 0.62 B 0.55 A
L
L
Hale Ave N. of Main 0.58 A 0.23 A East Main W. of Monterey Hwy 0.62 B 0.37 A E. Dunne W. of Monterey Hwy 0.09 A 0.18 A Monterey Hwy S. of Dunne 0.16 A 0.02 A E. Dunne E. of Monterey Hwy 0.12 A 0.94 E East Main E. of Monterey Hwy 0.16 A 0.12 A Monterey Hwy N. of East Main 1.07 F 0.30 A
Morgan Hill (1998)
Total Screenline 0.49 A 0.33 A
L
L
First St W. of Monterey Hwy 0.49 A 0.08 A 10th St W. of Monterey Hwy 0.95 E 0.72 C Monterey Hwy S. of Tenth St 0.84 D 0.15 A 10th St E. of Monterey Hwy 1.35 F 1.03 F Monterey Hwy N. of First St 0.20 A 0.38 A
-Gilroy (2020 HST)
Total Screenline 0.77 C 0.55 A
L
L
First St W. of Monterey Hwy 0.14 A 0.07 A 10th St W. of Monterey Hwy 1.05 F 1.03 F Monterey Hwy S. of Tenth St 0.63 B 0.00 A
Gilroy (1998)
10th St E. of Monterey Hwy 0.67 B 0.57 A
L
L
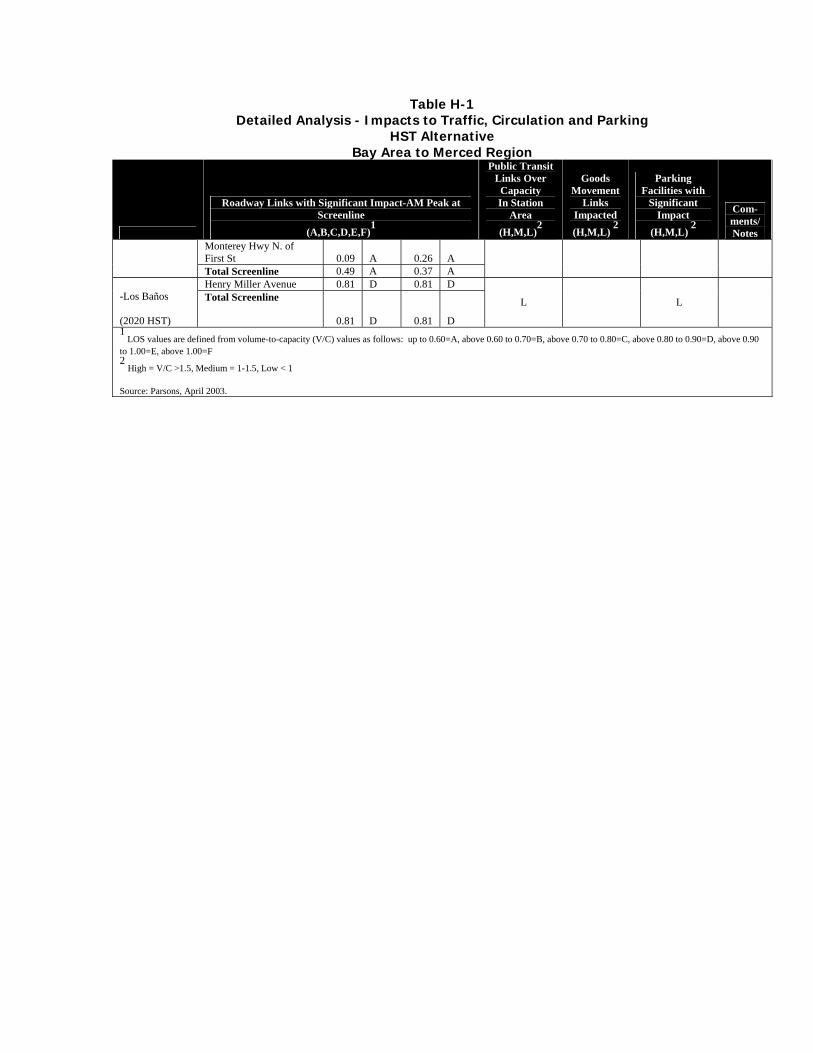
Table H-1 Detailed Analysis - Impacts to Traffic, Circulation and Parking
HST Alternative Bay Area to Merced Region
Roadway Links with Significant Impact-AM Peak at Screenline
(A,B,C,D,E,F)1
Public Transit Links Over
Capacity In Station
Area (H,M,L)
2
Goods Movement
Links Impacted (H,M,L)
2
Parking Facilities with
Significant Impact
(H,M,L) 2
Com-ments/ Notes
Monterey Hwy N. of First St 0.09 A 0.26 A
Total Screenline 0.49 A 0.37 A
Henry Miller Avenue 0.81 D 0.81 D -Los Baños (2020 HST)
Total Screenline
0.81 D 0.81 D
L L
1 LOS values are defined from volume-to-capacity (V/C) values as follows: up to 0.60=A, above 0.60 to 0.70=B, above 0.70 to 0.80=C, above 0.80 to 0.90=D, above 0.90
to 1.00=E, above 1.00=F 2
High = V/C >1.5, Medium = 1-1.5, Low < 1 Source: Parsons, April 2003.


