Download - Female Breast Cancer In California, 2005
FEMALE BREAST CANCER IN CALIFORNIA. 2005
State of California Department of Health Services

This publication was prepared by:
The Cancer Surveillance Section Cancer Control Branch Division of Chronic Disease and Injury Control California Department of Health Services 1700 Tribute Road, Suite 100 Sacramento, CA 95815-4402 (916) 779-0300 http://www.dhs.ca.gov/cdic or http://www.ccrcal.org
Suggested citation:
Harris DH, Bates J, Morris CR, Kwong SL, and Wright WE. Female Breast Cancer in California, 2005. Sacramento, CA; California Department of Health Services, Cancer Surveillance Section, July 2005.
Production and design by Maggie Burgos, California Cancer Registry
Copyright information:
All material in this report is in the public domain and may be reproduced or copied without permission; citation as to source, however, is appreciated.
This and other California Cancer Registr y publications are available on the World Wide Web at http://www.dhs.ca.gov/cdic or http://www.ccrcal.org
Prepared byPrepared byPrepared byPrepared byPrepared by
DAVID H. HARRIS, M.P.H.DDDDAAAAVIDVIDVIDVID H. HH. HH. HH. HARRISARRISARRISARRIS, M.P, M.P, M.P, M.P.H..H..H..H. Public Health Institute
California Cancer Registry
JANET BATES, M.D., M.P.H.JJJJANETANETANETANET BBBBAAAATESTESTESTES, M.D., M.P, M.D., M.P, M.D., M.P, M.D., M.P.H..H..H..H. Public Health Institute
California Cancer Registry
CYLLENE MORRIS, PH.D.CCCCYLLENEYLLENEYLLENEYLLENE MMMMORRISORRISORRISORRIS, P, P, P, PHHHH.D..D..D..D. Public Health Institute
California Cancer Registry
SANDY L. KWONG, M.P.H.SSSSANDYANDYANDYANDY L. KL. KL. KL. KWONGWONGWONGWONG, M.P, M.P, M.P, M.P.H..H..H..H. California Department of Health Services
Cancer Surveillance Section
WILLIAM E. WRIGHT, PH.D., CHIEFWWWWILLIAMILLIAMILLIAMILLIAM E. WE. WE. WE. WRIGHTRIGHTRIGHTRIGHT, P, P, P, PHHHH.D., C.D., C.D., C.D., CHIEFHIEFHIEFHIEF
California Department of Health Services Cancer Surveillance Section
July 2005July 2005July 2005July 2005July 2005

Breast Cancer is the Most CommonBreast Cancer is the Most CommonBreast Cancer is the Most CommonBreast Cancer is the Most CommonBreast Cancer is the Most Common Cancer in California Women, and
the Second Leading Cause of Cancer Death.
Cancer in CaliforCancer in CaliforCancer in CaliforCancer in California Wnia Wnia Wnia Women, andomen, andomen, andomen, andthe Second Leading Cause ofthe Second Leading Cause ofthe Second Leading Cause ofthe Second Leading Cause of
Cancer Death.Cancer Death.Cancer Death.Cancer Death.
Each YEach YEach YEach YEach Year, More Than 25,000 California Women Develop Breast Cancer, and More
Than 4,000 California Women Die From It.
earearearear, Mor, Mor, Mor, More Than 25,000 Califore Than 25,000 Califore Than 25,000 Califore Than 25,000 CalifornianianianiaWWWWomen Develop Bromen Develop Bromen Develop Bromen Develop Breast Cancereast Cancereast Cancereast Cancer, and Mor, and Mor, and Mor, and Moreeee
Than 4,000 CaliforThan 4,000 CaliforThan 4,000 CaliforThan 4,000 California Wnia Wnia Wnia Women Die Fromen Die Fromen Die Fromen Die From It.om It.om It.om It.
55555
MMMMMESSAGE FROM THE CALIFORNIA CANCER REGISTRY ESSAGEESSAGEESSAGEESSAGE FROMFROMFROMFROM THETHETHETHE CCCCALIFORNIAALIFORNIAALIFORNIAALIFORNIA CCCCANCERANCERANCERANCER RRRREGISTREGISTREGISTREGISTRYYYY
This report summarizes information contained in “Breast Cancer in California, 2003”,a special report published in 2004 by the California Cancer Registry (CCR). The information in“Breast Cancer in California, 2003” is based upon cases diagnosed in California women from 1988-1999, and provides a detailed look at breast cancer in the state.
Among women, breast cancer is the most commonly diagnosed cancer and the second most common cause of cancer death. The encouraging news is that the risk of dying from breast cancer has lessened,and the probability of long-term survival after diagnosis has increased. More and more women are having mammograms, and most cancers are now diagnosed at an early stage when treatments work best. Treatments have improved and better options are available to women affected by the disease.
These encouraging developments, however, have not been shared equally among all women. Minority and low-income women are less likely to be diagnosed at early stage, receive effective treatment and to survive the disease. We must ensure that all women in California benefit from early detection and have access to high quality treatment for breast cancer.
It is our hope that this summary booklet will be useful to a wide variety of readers, including policy makers, health care providers, advocates, breast cancer patients and survivors and anyone else in the general public who wants to learn more about breast cancer among California women. The CCR is strongly committed to the search for causes and cures for all cancers,and will continue to serve as both a foundation for research and as an invaluable tool for monitoring the occurrence of cancers in California.
55555
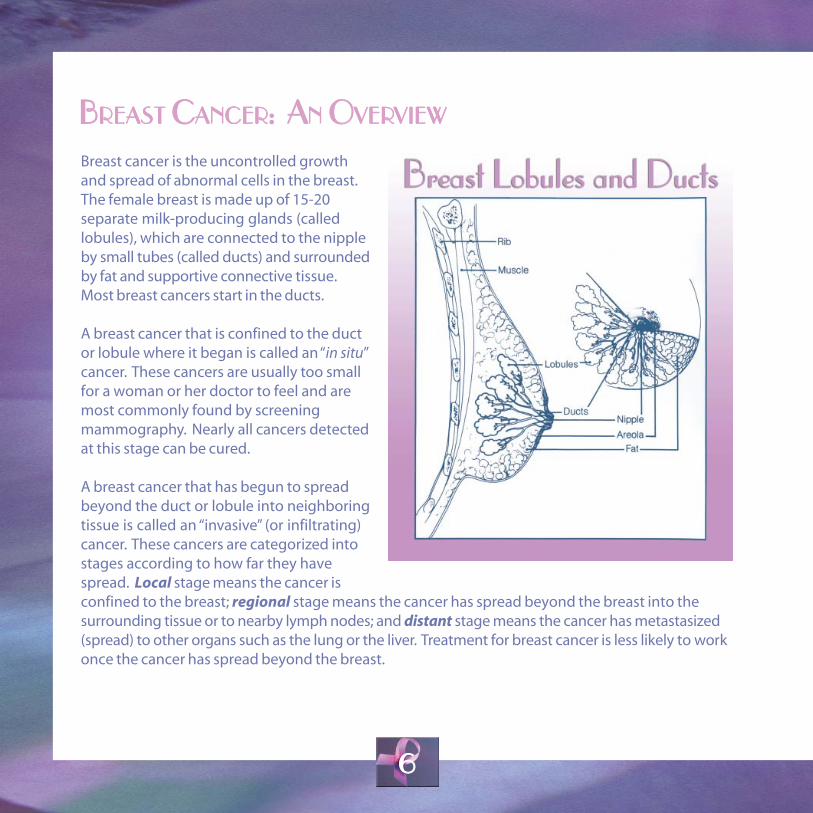
Breast Lobules and Ducts
66666
BBBBBREAST CANCER: AN OVERVIEW REASTREASTREASTREAST CCCCANCERANCERANCERANCER:::: AAAANNNN OOOOVERVERVERVERVIEWVIEWVIEWVIEW
Breast cancer is the uncontrolled growth and spread of abnormal cells in the breast. The female breast is made up of 15-20 separate milk-producing glands (called lobules), which are connected to the nipple by small tubes (called ducts) and surrounded by fat and supportive connective tissue. Most breast cancers start in the ducts.
A breast cancer that is confined to the duct or lobule where it began is called an “in situ” cancer. These cancers are usually too small for a woman or her doctor to feel and are most commonly found by screening mammography. Nearly all cancers detected at this stage can be cured.
A breast cancer that has begun to spread beyond the duct or lobule into neighboring tissue is called an “invasive” (or infiltrating) cancer. These cancers are categorized into stages according to how far they have spread. Local stage means the cancer is confined to the breast; regional stage means the cancer has spread beyond the breast into the surrounding tissue or to nearby lymph nodes; and distant stage means the cancer has metastasized (spread) to other organs such as the lung or the liver. Treatment for breast cancer is less likely to work once the cancer has spread beyond the breast.
66666

77777
CCCCCAUSESAUSESAUSESAUSESAUSES ANDANDANDANDAND RRRRRISKISKISKISKISK FFFFFACTORSACTORSACTORSACTORSACTORS FORFORFORFORFOR BBBBBREASTREASTREASTREASTREAST CCCCCANCERANCERANCERANCERANCER
The reasons why breast cancer occurs in a particular woman are not well understood. We do know, however, about some factors that increase a woman’s chance of getting the disease. Some of these factors can be controlled and others cannot be changed. Women with risk factors do not always develop breast cancer. Most often, women who get breast cancer have no known risk factors.
Some of the things that increase a woman’s chances of getting breast cancer include:
AGE: The majority of breast cancer cases occur in women over the age of 50.
RACE: White women get breast cancer more often than women of other races.
FAMILY HISTORY: Women who have a mother or sister with breast cancer have a greater risk ofgetting the disease than women with no family history.
MENSTRUAL HISTORY: Women who start having menstrual periods early (before age 12) or reach menopause late (after age 55) are more likely to get breast cancer.
PREGNANCY HISTORY: Women who have never had a baby, or who have their first baby after age 30 have a greater risk of getting breast cancer.
HORMONE REPLACEMENT AND BIRTH CONTROL PILLS: Hormone replacement therapy aftermenopause increases the risk of breast cancer. Use of birth control pills also may cause a slight increase in risk.
BODY WEIGHT: After menopause, heavier women have a greater risk of developing breast cancer. Before menopause, thinner women have a somewhat greater risk.
ALCOHOL: Having two or more alcoholic drinks daily increases risk.
EXERCISE: Lack of regular exercise increases breast cancer risk.
77777

age-adjusted
Breast cancer incidence rates describe the number of new breast cancer cases diagnosed each year for every 100,000 women.
Breast cancer mortality rates describe the number of breast cancer deaths each year for every 100,000 women.
Incidence and mortality rates for different ethnic groups are . This means that the rates are calculated as if all
ethnic groups in California had the same age distribution. This is important because older women are more likely to get breast cancer than younger women. Adjusting for age means that differences in breast cancer rates won't be due to one group having more or less older women than another group.
88888
BBBBBREASTREASTREASTREASTREAST CCCCCANCERANCERANCERANCERANCER AAAAAMONGMONGMONGMONGMONG WWWWWOMENOMENOMENOMENOMEN OFOFOFOFOF DDDDDIFFERENTIFFERENTIFFERENTIFFERENTIFFERENT RRRRRACEACEACEACEACE
ANDANDANDANDAND EEEEETHNICTHNICTHNICTHNICTHNIC GGGGGROUPSROUPSROUPSROUPSROUPS INININININ CCCCCALIFORNIAALIFORNIAALIFORNIAALIFORNIAALIFORNIA
Breast cancer is the most commonly diagnosed cancer among California women of all races and ethnic groups. However, the risk of getting breast cancer is higher for some race or ethnic groups than others. Non-Hispanic white women have the highest rates, followed by black women.
Figure 1 Invasive Breast Cancer Incidence Rates and Breast Cancer Mortality Rates by Race/Ethnicity, California, 1995-1999 Asian/Pacific Islander and Hispanic women
160 have lower rates. Although white women have 140 the highest rate of new cases, black women
12
9.4
88
.5
11
8.1
83
.6
14
5.5
26
.4
14.4
35
.8
18
.0
28
.9
have the highest breast cancer death rate.120
100
80
60
40
All Races Asian/Pacific Black Hispanic White Islander
Race/Ethnicity
Ag
e-A
dju
ated
Rat
e p
er1
00
,00
0 W
om
en
20
0
Incidence Mortality
Prepared by the California Department of Health Services, Cancer Surveillance Section.
88888

99999
BBBBBREASTREASTREASTREASTREAST CCCCCANCERANCERANCERANCERANCER AAAAAMONGMONGMONGMONGMONG WWWWWOMENOMENOMENOMENOMEN OFOFOFOFOF DDDDDIFFERENTIFFERENTIFFERENTIFFERENTIFFERENT AAAAAGESGESGESGESGES INININININ
CCCCCALIFORNIAALIFORNIAALIFORNIAALIFORNIAALIFORNIA
Most breast cancers occur among women over theage of 50. From 1995-1999 less than six percent ofall breast cancer cases in California occurred inwomen under the age of 40; nearly 49 percentoccurred among women aged 50-64; and 45percent occurred in women aged 65 and older.
The graph shows that as women get older, invasivebreast cancer rates rise rapidly. Women age 75-79have the highest rate of any age group. Breastcancer mortality rates also increase with age.
Ag
e-Sp
ecif
ic R
ate
per
10
0,0
00
Wo
men
Figure 2 Age-Specific Rates of Invasive Breast Cancer and�Breast Cancer Mortality, California, 1995-1999�
600
500
400
300
200
100
0 20-24 25-29 30-34 35-39 40-44 45-49 50-54 55-59 60-64 65-69 70-74 75-79 80-84 85+
Age Group (Years)
Incidence Mortality
Prepared by the California Department of Health Services, Cancer Surveillance Section.
99999
SSSSSOCIOECONOMICOCIOECONOMICOCIOECONOMICOCIOECONOMICOCIOECONOMIC SSSSSTTTTTAAAAATUSTUSTUSTUSTUS ANDANDANDANDAND BBBBBREASTREASTREASTREASTREAST CCCCCANCERANCERANCERANCERANCER
INININININ CCCCCALIFORNIAALIFORNIAALIFORNIAALIFORNIAALIFORNIA
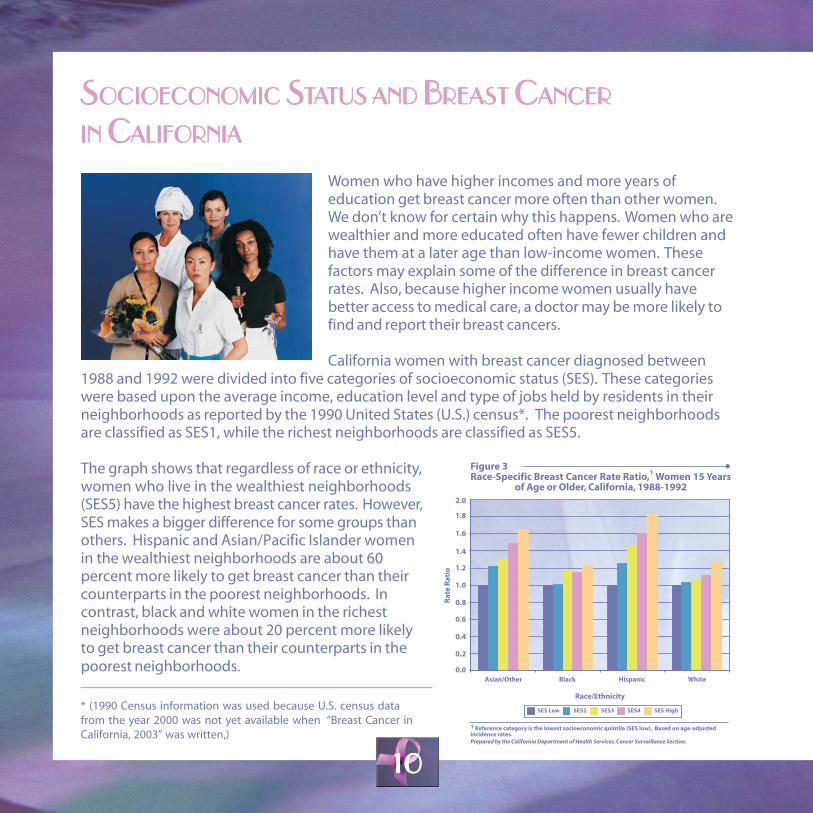
Women who have higher incomes and more years of education get breast cancer more often than other women. We don’t know for certain why this happens. Women who are wealthier and more educated often have fewer children and have them at a later age than low-income women. These factors may explain some of the difference in breast cancer rates. Also, because higher income women usually have better access to medical care, a doctor may be more likely to find and report their breast cancers.
California women with breast cancer diagnosed between 1988 and 1992 were divided into five categories of socioeconomic status (SES). These categories were based upon the average income, education level and type of jobs held by residents in their neighborhoods as reported by the 1990 United States (U.S.) census*. The poorest neighborhoods are classified as SES1, while the richest neighborhoods are classified as SES5.
Figure 3The graph shows that regardless of race or ethnicity, Race-Specific Breast Cancer Rate Ratio,1 Women 15 Years
women who live in the wealthiest neighborhoods of Age or Older, California, 1988-1992
(SES5) have the highest breast cancer rates. However, 2.0
SES makes a bigger difference for some groups than 1.8
others. Hispanic and Asian/Pacific Islander women 1.6
in the wealthiest neighborhoods are about 60 1.4
1.2
percent more likely to get breast cancer than their 1.0
counterparts in the poorest neighborhoods. In 0.8
contrast, black and white women in the richest 0.6
neighborhoods were about 20 percent more likely 0.4
to get breast cancer than their counterparts in the 0.2
poorest neighborhoods. 0.0
Rat
e R
atio
Asian/Other Black Hispanic White
* (1990 Census information was used because U.S. census data from the year 2000 was not yet available when “Breast Cancer in California, 2003” was written,)
Race/Ethnicity
SES Low SES2 SES3 SES4 SES High
1 Reference category is the lowest socioeconomic quintile (SES low). Based on age-adjusted incidence rates. Prepared by the California Department of Health Services, Cancer Surveillance Section.
1010101010

BBBBBREASTREASTREASTREASTREAST CCCCCANCERANCERANCERANCERANCER IIIIINCIDENCENCIDENCENCIDENCENCIDENCENCIDENCE ANDANDANDANDAND MMMMMORORORORORTTTTTALITYALITYALITYALITYALITY TTTTTRENDSRENDSRENDSRENDSRENDS INININININ
CCCCCALIFORNIAALIFORNIAALIFORNIAALIFORNIAALIFORNIA
Figure 4INCIDENCE TRENDS Trends in Invasive Female Breast Cancer Age-Adjusted
Overall, rates of invasive breast cancer in California (2000 U.S. Population) Incidence Rates by Race/Ethnicity,1
California, 1988-1999have been stable between 1988 and 1999. There are 150
more cases of breast cancer each year, but that is because the population has grown. The graph shows that during this time breast cancer rates were highest for white women, intermediate for black women, and lowest for Hispanic and Asian/Pacific Islander women. Rates for white, black and Hispanic women did not increase over the period. In contrast, rates among Asian/Pacific Islander women did increase between 1988 and 1999. The reasons for this are not clear, but it could be partly due to a later increase in mammography use compared to other groups.
TRENDS IN BREAST CANCER DEATHS Since 1970, the death rate for breast cancer among California women has fallen by 26 percent, from 33.8 deaths for every 100,000 women in 1970 to 24.5 deaths per 100,000 women in 1999. However,the death rate has dropped more for some California
Ag
e-A
dju
sted
Inci
den
ce R
ate
per
10
0,0
00
1988 1989 1990 1991 1992 1993 1994 1995 1996 1997 1998 1999 Year of Diagnosis
120
90
60
White Hispanic Black Asian/Pacific Islander
1 Race/ethnicity categories are mutually exclusice. Persons of Hispanic ethnicity may be of any race. Source: California Cancer Registry (August 2002) Prepared by the California Department of Health Services, Cancer Surveillance Section.
Figure 5 Trends in Female Breast Cancer Age-Adjusted (2000 U.S.
Population) Mortality Rates by Race/Ethnicity,1
California, 1970-1999 45
40
women than for others. Among white women, death rates have decreased by 24 percent. Among Hispanic women, who get breast cancer much less often than white women, there has been a five percent decrease in breast cancer death rates. Black women also get breast cancer less often than white women, but their
Ag
e-A
dju
sted
Rat
e p
er 1
00
,00
0 35
30
25
20
15
10
breast cancer death rates are higher and there has 5
been no decrease in their breast cancer death rate. 0
Asian/Pacific Islander had the lowest breast cancer 19
70
19
71
19
72
19
73
19
74
19
75
19
76
19
77
19
78
19
79
19
80
19
81
19
82
19
83
19
84
19
85
19
86
19
87
19
88
19
89
19
90
19
91
19
92
19
93
19
94
19
95
19
96
19
97
19
98
19
99
Year of Diagnosisdeath rates. However, their breast cancer death rate White Black Hispanic Asian/Pacific Islander
increased by 78 percent over the period. 1 Race/ethnicity categories are mutually exclusice. Persons of Hispanic ethnicity may be of any race. Source: California Cancer Registry (August 2002) Prepared by the California Department of Health Services, Cancer Surveillance Section.
1111111111

RRRRRISKISKISKISKISK OFOFOFOFOF DDDDDEVELOPINGEVELOPINGEVELOPINGEVELOPINGEVELOPING BBBBBREASTREASTREASTREASTREAST CCCCCANCERANCERANCERANCERANCER
Based upon CCR data collected from 1995-1999, we expect overall that one out of every eight newborn girls in California will develop breast cancer in her lifetime. Although this lifetime risk statistic is striking, it is important to remember that it applies only to newborn girls and not to adult women. It is true that as a woman gets older, her risk of getting breast cancer in the next five years increases. However, her lifetime risk decreases for every year that she is alive and does not get breast cancer. The table below shows the risk of developing breast
cancer in the next 5, 10 or 20 years based upon a woman’s current age and her race/ethnicity. These predictions only apply to women who have never had breast cancer.
Chance That A California Woman With No Prior History of Breast Cancer Will be Diagnosed With
Invasive Breast Cancer
All Races Asian/Pacific Islander
Current Age Black Hispanic White
IN THE NEXT 5 YEARS
30 1 in 883 1 in 929 1 in 604 1 in 1035 1 in 845 40 1 in 189 1 in 182 1 in 184 1 in 235 1 in 175 50 1 in 84 1 in 99 1 in 89 1 in 128 1 in 73 60 1 in 59 1 in 86 1 in 66 1 in 87 1 in 50 70 1 in 46 1 in 89 1 in 63 1 in 76 1 in 40
IN THE NEXT 10 YEARS
30 40 50 60 70
IN THE NEXT 20 YEARS
30 40 50 60 70
1 in 271 1 in 270 1 in 219 1 in 328 1 in 71 1 in 74 1 in 73 1 in 94 1 in 38 1 in 46 1 in 42 1 in 58 1 in 28 1 in 44 1 in 33 1 in 43 1 in 24 1 in 47 1 in 31 1 in 38
1 in 57 1 in 59 1 in 56 1 in 74 1 in 25 1 in 29 1 in 28 1 in 36 1 in 17 1 in 23 1 in 20 1 in 25 1 in 14 1 in 24 1 in 18 1 in 22
(UNAVAILABLE BECAUSE ESTIMATES STOP AT AGE 85)
1 in 253 1 in 64 1 in 33 1 in 24 1 in 21
1 in 51 1 in 22 1 in 14 1 in 12
Prepared by the California Department of Health Services, Cancer Surveillance Section.
1212121212
1313131313
UUUUUSESESESESE OFOFOFOFOF M M M M MAMMOGRAPHYAMMOGRAPHYAMMOGRAPHYAMMOGRAPHYAMMOGRAPHY BYBYBYBYBY C C C C CALIFORNIAALIFORNIAALIFORNIAALIFORNIAALIFORNIA W W W W WOMENOMENOMENOMENOMEN
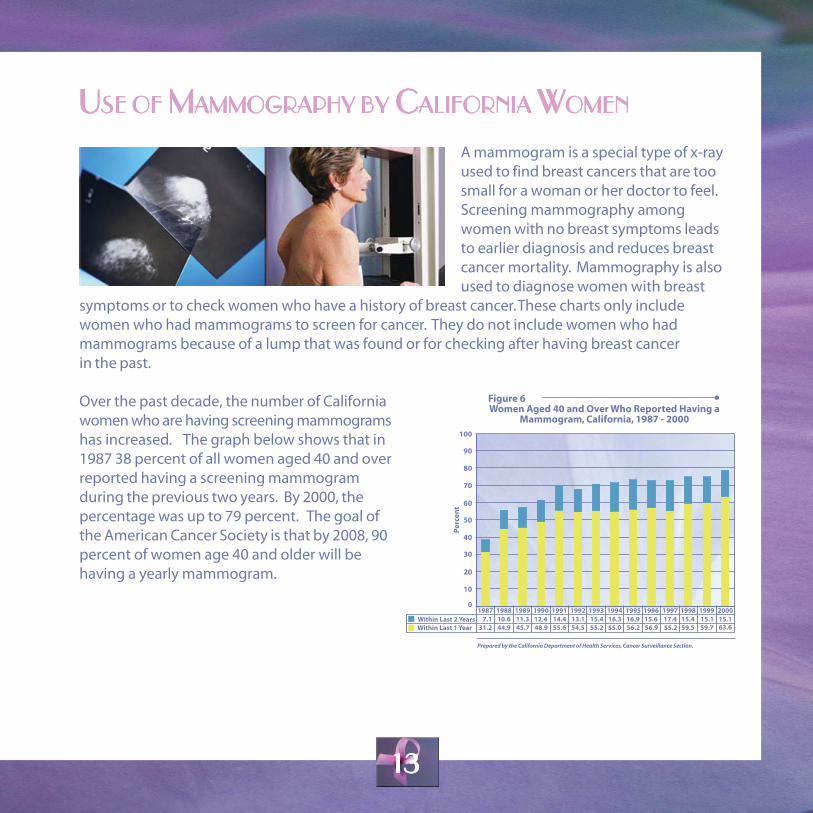
A mammogram is a special type of x-ray used to find breast cancers that are too small for a woman or her doctor to feel. Screening mammography among women with no breast symptoms leads to earlier diagnosis and reduces breast cancer mortality. Mammography is also used to diagnose women with breast
symptoms or to check women who have a history of breast cancer. These charts only include women who had mammograms to screen for cancer. They do not include women who had mammograms because of a lump that was found or for checking after having breast cancer in the past.
Over the past decade, the number of California women who are having screening mammograms has increased. The graph below shows that in 1987 38 percent of all women aged 40 and over reported having a screening mammogram during the previous two years. By 2000, the percentage was up to 79 percent. The goal of the American Cancer Society is that by 2008, 90 percent of women age 40 and older will be having a yearly mammogram.
Figure 6 Women Aged 40 and Over Who Reported Having a
Mammogram, California, 1987 - 2000
7.1 31.2
1987 10.6 11.3 12.4 44.9 45.7 48.9
1988 1989 1990 14.4 55.6
1991 13.1 54.5
1992 15.4 55.2
1993 16.3 55.0
1994 16.9 56.2
1995 17.4 55.2
1997 15.4 59.5
1998 15.1 15.1 59.7
1999
63.6
2000 15.6 56.9
1996 0
10
20
30
40
50
60
70
80
90
100
P er c
en t
Within Last 2 Years Within Last 1 Year
Prepared by the California Department of Health Services, Cancer Surveillance Section.

1414141414
Mammography screening has increased among women of every race and ethnic background, but differences between groups remain. Black and non-Hispanic white women reported having mammograms more frequently than Hispanic and Asian/Pacific Islander women.
UUUUUSESESESESE OFOFOFOFOF M M M M MAMMOGRAPHYAMMOGRAPHYAMMOGRAPHYAMMOGRAPHYAMMOGRAPHY BYBYBYBYBY C C C C CALIFORNIAALIFORNIAALIFORNIAALIFORNIAALIFORNIA W W W W WOMENOMENOMENOMENOMEN (((((CCCCCONTONTONTONTONT.).).).).) Figure 7 Women Age 40+ Who Reported Having a Mammogram During the Last Two Years by Race/Ethnicity,
California, 1987-2000
53.0 69.8 74.2 72.8 74.2 77.6
62.1 65.7 71.5 81.7 75.8 79.5
43.2 56.5 62.5 72.2 70.7 73.8
43.2 60.0 61.3 63.1 73.7 66.3
0
10
20
30
40
50
60
70
80
90
100
P er c
en t
Prepared by the California Department of Health Services, Cancer Surveillance Section.
White
Black
Hispanic
Asian\Other
1987-1989 1990-1992 1993-1994 1995-1996 1997-1998 1999-2000
Figure 8 Women Age 40+ Who Reported Having a Mammogram in the Last Two Years by Educational Attainment, California,
1987-2000
0
10
20
30
40
50
60
70
80
90
100
Pe r c
e n t
< HS grad
HS grad +
1987 1988 1989 1990 1991 1992 1993 1994 1995 1997 1998 1999 20001996
Prepared by the California Department of Health Services, Cancer Surveillance Section.
24.0
42.3
51.0
56.6
46.4
59.4
51.1
64.2
49.8
71.3
56.5
73.2
57.3
74.3
68.4
74.2
71.3
72.7
60.4
75.2
69.3
75.8
62.1
77.5
73.4
79.5
54.6
72.3
Women with more years of education were also more likely to report having mammograms in every time period. However, in recent years mammography screening use among women with less education has been catching up to the use among women with more eduation.
1515151515
SSSSSTTTTTAGEAGEAGEAGEAGE AAAAATTTTT C C C C CANCERANCERANCERANCERANCER D D D D DIAGNOSISIAGNOSISIAGNOSISIAGNOSISIAGNOSIS
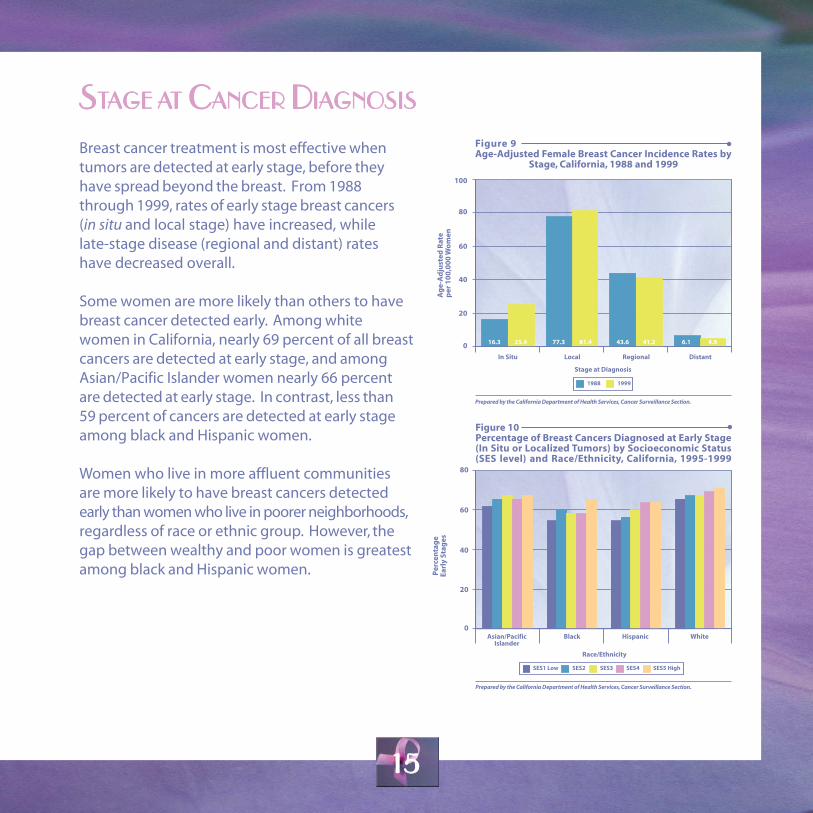
Breast cancer treatment is most effective when tumors are detected at early stage, before they have spread beyond the breast. From 1988 through 1999, rates of early stage breast cancers (in situ and local stage) have increased, while late-stage disease (regional and distant) rates have decreased overall.
Some women are more likely than others to have breast cancer detected early. Among white women in California, nearly 69 percent of all breast cancers are detected at early stage, and among Asian/Pacific Islander women nearly 66 percent are detected at early stage. In contrast, less than 59 percent of cancers are detected at early stage among black and Hispanic women.
Women who live in more affluent communities are more likely to have breast cancers detected early than women who live in poorer neighborhoods, regardless of race or ethnic group. However, the gap between wealthy and poor women is greatest among black and Hispanic women.
Figure 9 Age-Adjusted Female Breast Cancer Incidence Rates by
Stage, California, 1988 and 1999
0
20
40
60
80
100
A ge-
A dj
ust
ed R
a te
per
10
0,0
00
W om
en
In Situ Local Regional Distant
Stage at Diagnosis
1988 1999
16.3 77.3 43.6 6.125.4 81.4 41.2 4.9
Prepared by the California Department of Health Services, Cancer Surveillance Section.
Figure 10 Percentage of Breast Cancers Diagnosed at Early Stage (In Situ or Localized Tumors) by Socioeconomic Status (SES level) and Race/Ethnicity, California, 1995-1999
0
20
40
60
80
Asian/Pacific Islander
Black Hispanic White
Race/Ethnicity
P er c
en ta
ge
Earl
y St
ages
SES1 Low SES2 SES3 SES4 SES5 High
Prepared by the California Department of Health Services, Cancer Surveillance Section.

1616161616
SSSSSURGICALURGICALURGICALURGICALURGICAL T T T T TREAREAREAREAREATMENTTMENTTMENTTMENTTMENT OFOFOFOFOF B B B B BREASTREASTREASTREASTREAST C C C C CANCERANCERANCERANCERANCER INININININ C C C C CALIFORNIAALIFORNIAALIFORNIAALIFORNIAALIFORNIA
Most women with breast cancer have some kind of surgery. In the past, mastectomy (removal of the entire breast) was the most common surgery. Now, women with early stage disease can usually be treated with breast conserving surgery (BCS) in which only the tumor and nearby surrounding tissue are removed. In California, the number of women with breast cancer who had BCS instead of a mastectomy has increased. In 1988, one-third of women with early stage breast cancer had BCS. By 1999, nearly two-thirds of women with early stage disease had BCS.
Although BCS use has increased among all women, some women are more likely to have it than others. A greater percentage of white and black women are treated with BCS compared to Hispanic and Asian/Pacific Islander women. In addition, women with higher education and incomes are more often treated with BCS than mastectomy.
For each woman, there may be clinical and personal reasons why mastectomy would be the preferred choice. BCS typically is followed by up to six weeks of daily radiation therapy to destroy any cancer cells that might be in the remaining breast tissue. Some women may be unable to attend daily therapy due to family, transportation or work factors and choose to have a mastectomy instead, and some women may prefer not to undergo radiation therapy for other reasons and choose mastectomy. It is also possible that some women have a mastectomy because the option of BCS hasn’t been fully presented to them.
0
10
20
30
40
50
60
70
80
P er c
en t
1988 19891990 1991 1992 1993 1994 1995 1996 1997 1998 1999
Year of Diagnosis
Prepared by the California Department of Health Services, Cancer Surveillance Section.
Asian/Pacific Islander
Black Hispanic White
1 Stage 0: in situ tumors; stage I: tumors up to 2 cm without lymph node involvement; stage IIa: tumors up to 2 cm with positive lymph nodes or tumors up to 5 cm, regardless of nodal status.
2 Race/ethnicity categories are mutually exclusive. Persons of Hispanic ethnicity may be of any race.
Figure 11 Breast-Conserving Surgery in Women with Stage 0 – IIa1
Breast Cancer, by Race/Ethnicity2 and Year of Diagnosis, California, 1988-1999

1717171717
BBBBBREASTREASTREASTREASTREAST C C C C CANCERANCERANCERANCERANCER S S S S SURURURURURVIVVIVVIVVIVVIVALALALALAL
The probability of surviving breast cancer is quite good. On average, 86 percent of women diagnosed with breast cancer are alive after five years, and 76 percent live at least ten years after diagnosis.
Women who have breast cancer diagnosed at early stage have better chances of surviving the disease. Based upon information from the San Francisco Bay Area on women diagnosed with invasive breast cancer between 1988 and 1992:
5 A woman diagnosed at local stage (before the disease has spread beyond the breast) has a 97 percent probability of surviving five years, and a 95 percent probability of surviving ten years.
5 If she is diagnosed at a more advanced stage (a tumor larger than 2” that has spread to nearby lymph nodes or a tumor or any size that has invaded into nearby tissue), she has a 50 percent probability of surviving five years, and a 44 percent probability of surviving ten years.
5 If she is diagnosed at the most advanced stage (tumor has spread to distant organs such as the lungs, bones or liver), she has a 26 percent probability of surviving five years and only a 16 percent probability of surviving ten years.

1818181818
OOOOOTHERTHERTHERTHERTHER F F F F FACTORSACTORSACTORSACTORSACTORS I I I I INFLUENCENFLUENCENFLUENCENFLUENCENFLUENCE THETHETHETHETHE C C C C CHANCESHANCESHANCESHANCESHANCES OFOFOFOFOF S S S S SURURURURURVIVINGVIVINGVIVINGVIVINGVIVING
BBBBBREASTREASTREASTREASTREAST C C C C CANCERANCERANCERANCERANCER. T. T. T. T. THESEHESEHESEHESEHESE A A A A ARERERERERE:::::
5 Age: Although young women under the age of 35 years do not get breast cancer often, when they do get it they are less likely to survive than older women. Women under age 35 who do develop cancer have a 72 percent probability of surviving five years, and a 63 percent probability of surviving ten years. After age 35, the probability of surviving five years is over 85 percent, and the probability of surviving ten years is about 80 percent.
5 Socioeconomic Status (SES): Overall, women who live in wealthier neighborhoods have an 87 percent probability of surviving five years after diagnosis, and an 81 percent chance of surviving ten years. Women who live in poor neighborhoods have an 82 percent chance of surviving five years, and a 71 percent chance of surviving ten years. This is mostly likely because women in poor neighborhoods are more often diagnosed at later stage and less likely to have access to medical care after diagnosis.
5 Race and Ethnicity: Black women have a lower probability of surviving breast cancer than women of any other race/ethnic group (see figure 12). Black women are more likely to live in poor neighborhoods, which may explain some of this difference. However, even when black women are compared with women of other races who have similar income, education levels and stage at diagnosis, their survival probability is still lower than that of other women. More research will be needed to fully explain the reasons for these differences in breast cancer survival.
Figure 12 Five and Ten Year Survival Probabilities for Women Diagnosed with Invasive Breast Cancer in the
San Francisco Bay Area, 1988-1992
0% 20% 40% 60% 80% 100%
White
Hispanic
Black
Asian/Pacific Islander
R ac e
/E th
nic
it y
Percentage
82%
77%
70%
80%
88%
86%
78%
86%
10 Year Survival 5 Year Survival
Prepared by the California Department of Health Services, Cancer Surveillance Section.

1919191919
FFFFFOROROROROR M M M M MOREOREOREOREORE I I I I INFORMANFORMANFORMANFORMANFORMATIONTIONTIONTIONTION ONONONONON B B B B BREASTREASTREASTREASTREAST C C C C CANCERANCERANCERANCERANCER:::::
Please visit the following web sites for more information on breast cancer:
California Department of Health Services Cancer Detection Section http://www.dhs.ca.gov/cancerdetection/default.htm
California Breast Cancer Research Program www.cbcrp.org
American Cancer Society www.cancer.org
Center for Disease Control and Prevention Cancer Prevention and Control http://www.cdc.gov/cancer/index.htm
National Cancer Institute www.nci.nih.gov
California Cancer Registry Breast Cancer 2003 report is available at http://www.ccrcal.org/Publications.html
FEMALE BREAST CANCER IN CALIFORNIA, 2005


