
February 9, 2006TransNow Student Conference
Using Ground Truth Geospatial Data to Validate Advanced Traveler Information Systems Freeway Travel Time Messages
2005-2006 TransNow Student Conference, February 9, 2006
Aaron BreakstoneMaster of Urban & Regional Planning CandidateSchool of Urban Studies & Planning Portland State University
Christopher M. Monsere, Ph.D., P.E.Research Assistant ProfessorDepartment of Civil & Environmental EngineeringPortland State University
Robert L. Bertini, Ph.D., P.E. Associate ProfessorDepartment of Civil & Environmental EngineeringSchool of Urban Studies & Planning Portland State University

February 9, 2006TransNow Student Conference
Outline
• Introduction
• Study Area
• Archived Data
• Data Collection
• Data Analysis
• Conclusions
• Next Steps
February 9, 2006TransNow Student Conference
Outline
• Introduction
• Study Area
• Archived Data
• Data Collection
• Data Analysis
• Conclusions
• Next Steps

February 9, 2006TransNow Student Conference
Project Goal
• Evaluation of Oregon Department of Transportation (ODOT)’s travel time estimating and reporting capabilities

February 9, 2006TransNow Student Conference
Real-time Travel Time Estimates
• FHWA policy• Variety of technologies
– Inductive loop detectors– Microwave radar– Automatic vehicle tag matching– Video detection– License plate matching– Cell phone matching
• Past research– General accuracy in free-flow conditions– Recurring congestion & incidents more challenging

February 9, 2006TransNow Student Conference
Portland ATMS• Freeway surveillance
– 485 inductive loop detectors (approximately 175 stations)
Dual loop Mainline lanes Upstream of on-ramps
– 135 ramp meters– 98 CCTV
• ATIS– www.TripCheck.com
Real-time speed map Static CCTV images
– 18 dynamic message signs (DMS) 3 display travel times

February 9, 2006TransNow Student Conference
Outline
• Introduction
• Study Area
• Archived Data
• Data Collection
• Data Analysis
• Conclusions
• Next Steps

February 9, 2006TransNow Student Conference
Study Area
• 15 directional freeway links– I-5 (6)– I-205 (3) – I-84 (2)– US-26 (2)– OR-217 (2)
Downtown Portland

February 9, 2006TransNow Student Conference
Travel Time Calculation
Influence
Area 4Travel Time 4
(at t = 0)
Travel Time 1Influence
Area 1
Travel Time 3
(at t = 0)
Influence
Area 3
Travel Time 2
(at t = 0)
Influence
Area 2
Link Travel Time
(TT1 + TT2 + TT3 + TT4)
Downtown Portland

February 9, 2006TransNow Student Conference
Outline
• Introduction
• Study Area
• Archived Data
• Data Collection
• Data Analysis
• Conclusions
• Next Steps
February 9, 2006TransNow Student Conference
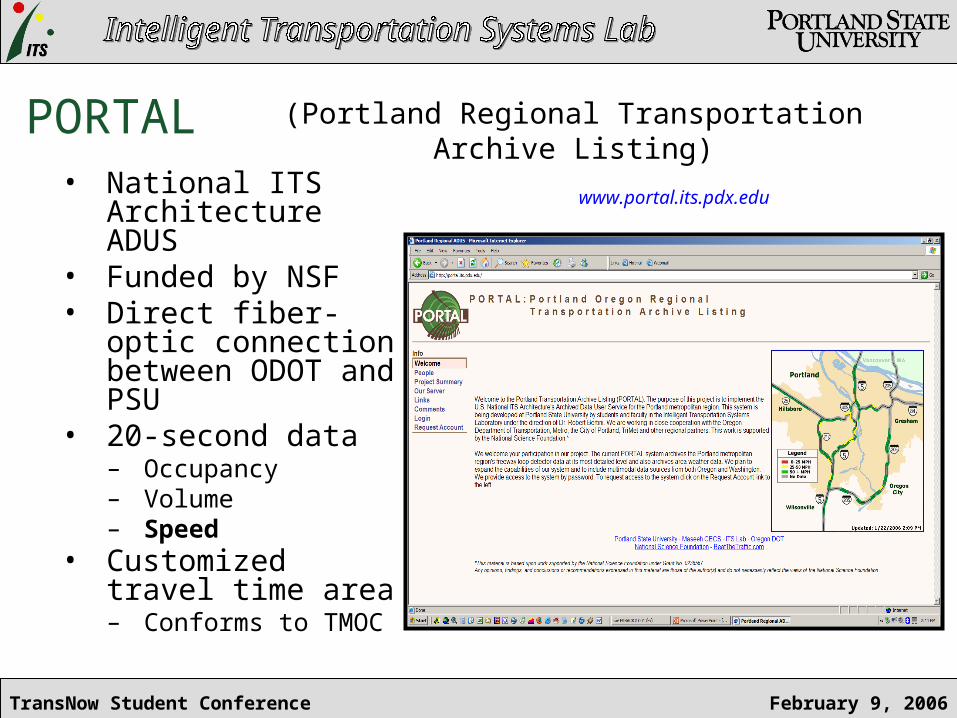
PORTAL• National ITS
Architecture ADUS• Funded by NSF• Direct fiber-optic
connection between ODOT and PSU
• 20-second data– Occupancy– Volume– Speed
• Customized travel time area – Conforms to TMOC
(Portland Regional Transportation Archive Listing)
www.portal.its.pdx.edu
February 9, 2006TransNow Student Conference
Outline
• Introduction
• Study Area
• Archived Data
• Data Collection
• Data Analysis
• Conclusions
• Next Steps

February 9, 2006TransNow Student Conference
Experimental Design• Analysis of estimates
– Plan logical routes– Determine variability
• Data collection plan– 5-10 runs required for
most links– 4 routes designed– Transitional periods
targeted– Groups with 5-7 minute
headways– Standard probe vehicle
instructions (FHWA)
217 Southbound: US26 Interchange to I-5 Interchange [Link 9]
0
10
20
30
40
50
60
0:00 2:00 4:00 6:00 8:00 10:00 12:00 14:00 16:00 18:00 20:00 22:00 0:00
Time
Tra
ve
l T
ime
s
Cu
mu
lativ
e T
rav
el T
ime

February 9, 2006TransNow Student Conference
Data Collection• Hardware
– Palm handheld computers
– Magellan GPS devices
• Software– ITS-GPS
Available at www.its.pdx.edu
• Individual runs and groups of probe vehicles
• Variety of traffic conditions– 45 percent congested
– 2 notable incidents
February 9, 2006TransNow Student Conference
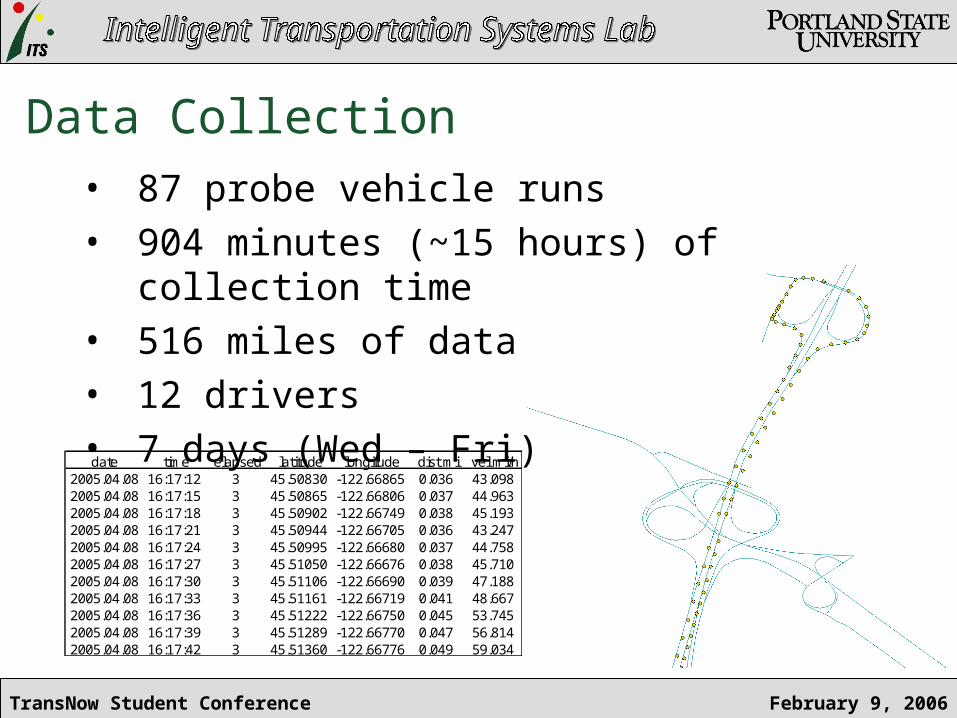
Data Collection• 87 probe vehicle runs• 904 minutes (~15 hours) of collection time• 516 miles of data• 12 drivers• 7 days (Wed – Fri)
date time elapsed latitude longitude dist mi vel mi/h2005.04.08 16:17:12 3 45.50830 -122.66865 0.036 43.0982005.04.08 16:17:15 3 45.50865 -122.66806 0.037 44.9632005.04.08 16:17:18 3 45.50902 -122.66749 0.038 45.1932005.04.08 16:17:21 3 45.50944 -122.66705 0.036 43.2472005.04.08 16:17:24 3 45.50995 -122.66680 0.037 44.7582005.04.08 16:17:27 3 45.51050 -122.66676 0.038 45.7102005.04.08 16:17:30 3 45.51106 -122.66690 0.039 47.1882005.04.08 16:17:33 3 45.51161 -122.66719 0.041 48.6672005.04.08 16:17:36 3 45.51222 -122.66750 0.045 53.7452005.04.08 16:17:39 3 45.51289 -122.66770 0.047 56.8142005.04.08 16:17:42 3 45.51360 -122.66776 0.049 59.034
February 9, 2006TransNow Student Conference
Outline
• Introduction
• Study Area
• Archived Data
• Data Collection
• Data Analysis
• Conclusions
• Next Steps

February 9, 2006TransNow Student Conference
Probe Vehicle Data• Individual runs
downloaded – “run” = several links
+ extraneous data
• Unique ID for each GPS record
• Runs plotted on freeway network
– Links color-coded
• Pertinent data segments extracted
last point on Link 9
last point on Link 2
first point on Link 3
February 9, 2006TransNow Student Conference
Matching Estimates• Nearest 20-second interval
– e.g. 9:15:34 9:15:20
• Aggregation– Averages more realistic to operation of system
Average of nearest interval and 1 minute prior Average of nearest interval and 3 minutes prior

February 9, 2006TransNow Student Conference
Probe vs. Estimated Travel Times
0
5
10
15
20
25
30
35
0 5 10 15 20 25 30 35
Observed Probe Vehicle Trave l Tim e
Est
imat
ed T
rave
l Tim
e
Average of previous 3 minutes

February 9, 2006TransNow Student Conference
-100%
-80%
-60%
-40%
-20%
0%
20%
40%
60%
80%
100%
2 3 4 5 6 7 8 9 10 12 13 14 16 17
Link Num ber
Per
cen
t E
rro
rResults

February 9, 2006TransNow Student Conference
Outline
• Introduction
• Study Area
• Archived Data
• Data Collection
• Data Analysis
• Conclusions
• Next Steps
February 9, 2006TransNow Student Conference
Conclusions • Estimates reasonably accurate given current
system configuration– Many within 20% of probe times– Less so under congested conditions– Incidents produced highest error
• Averaging improves accuracy• Detector density and location critical

February 9, 2006TransNow Student Conference
303.5
304.0
304.5
305.0
305.5
306.0
306.5
307.0
307.5
308.0
8:06:00 8:08:00 8:10:00 8:12:00 8:14:00 8:16:00
Time
Mile
po
st
Run 7292.3
293.3
294.3
295.3
296.3
297.3
298.3
299.3
300.3
8:05:00 8:10:00 8:15:00 8:20:00 8:25:00 8:30:00
Time
Mile
po
stConclusions
• Detector density and location criticalEstimated Travel Time: ~25.5 minutes
Probe Travel Time: ~14.5 minutes
68.9
69.4
69.9
70.4
70.9
71.4
71.9
72.4
72.9
8:17:00 8:18:30 8:20:00 8:21:30 8:23:00 8:24:30 8:26:00 8:27:30
Time
Mile
po
st
Probe
Projection
Influence Area Limit
Probe Travel Time: ~11 minutes
Estimated Travel Time: ~9.5 minutes

February 9, 2006TransNow Student Conference
0.3
1.1
1.9
2.7
3.5
4.3
5.1
5.9
6.7
8:18:00 8:23:00 8:28:00 8:33:00 8:38:00 8:43:00 8:48:00 8:53:00 8:58:00
Time
Mile
po
st
69.7
70.2
70.7
71.2
71.7
72.2
72.7
73.2
73.7
16:26:00 16:28:00 16:30:00 16:32:00 16:34:00 16:36:00 16:38:00 16:40:00 16:42:00
Time
Mile
po
st
Conclusions• Incidents difficult to capture
Δ = ~7 minutesΔ = ~12.5 minutes

February 9, 2006TransNow Student Conference
Outline
• Introduction
• Study Area
• Archived Data
• Data Collection
• Data Analysis
• Conclusions
• Next Steps

February 9, 2006TransNow Student Conference
Next Steps
• More data– Targeted conditions– Fill gaps
Incidents Software/hardware issues
– Up-to-date
• Different algorithms– Historical data– Data from other detectors
February 9, 2006TransNow Student Conference
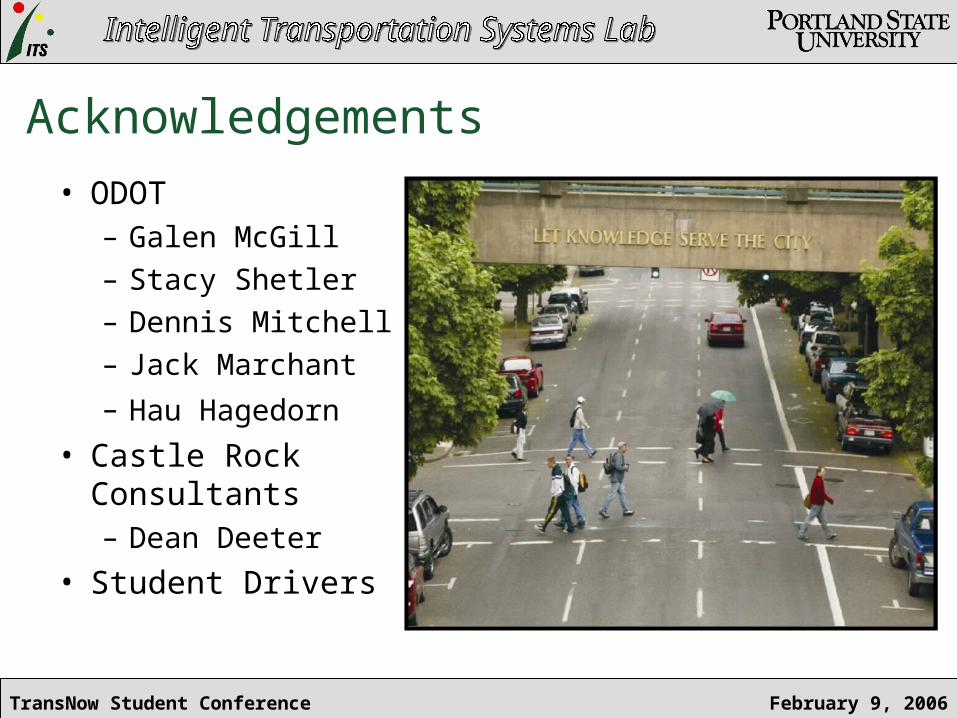
Acknowledgements
• ODOT– Galen McGill– Stacy Shetler– Dennis Mitchell– Jack Marchant
– Hau Hagedorn
• Castle Rock Consultants– Dean Deeter
• Student Drivers


