1
79 Elm Street • Hartford, CT 06106-5127 www.ct.gov/deep Affirmative Action/Equal Opportunity Employer
Factsheet: Town of Avon Water Quality and Stormwater Summary
This document was created for each town that has submitted monitoring data under the current
Small Municipal Separate Storm Sewer System (MS4) General Permit. What follows is
information on how stormwater can affect water quality in streams and rivers and a summary of
data submitted by your town. This factsheet is intended to help you interpret your monitoring
results and assist you in compliance with the MS4 program.
Water Quality in Connecticut
Surface waters are important resources that support numerous uses, including water supply,
recreation, fishing, shellfishing and sustaining aquatic life. Water quality conditions needed to
support these uses are identified within the Connecticut Water Quality Standards (WQS). In
order to protect and restore these uses, we need acceptable environmental conditions (physical,
chemical and biological) to be present within surface waters.
To assess and track water quality conditions, CT DEEP conducts monitoring across the State.
The data is synthesized into a biennial state water quality report called the Integrated Water
Quality Report. Currently, specific water quality monitoring in the state encompasses about 50%
of rivers, 47% of lakes, and 100% of estuary/coastline. In addition, CT DEEP may have
information about certain land uses or discharges which could indicate a potential for water
quality to be impacted, even if the waterbody has not been fully monitored and assessed.
To find more detailed information on water quality in your town, please see the Integrated Water
Quality Report (IWQR) on the CT DEEP website at www.ct.gov/deep/iwqr. Information on
water quality within your town is also presented on the maps included in this fact sheet.
Impacts of Impervious Cover on Water Quality
Impervious cover (IC) refers to hard surfaces across the landscape such as roads, sidewalks,
parking lots and roofs. Studies have focused on the amount of hard surfaces to evaluate the
impacts of stormwater runoff from these hard surfaces on water quality and found that IC affects
both the quantity and quality of stormwater. IC forces rain to runoff the land, carrying pollutants
quickly and directly to lakes and streams instead of soaking into the ground and being filtered by
the soil. For more information on impervious cover, please see the CT DEEP web page
www.ct.gov/deep/imperviouscoverstudies and EPA’s web page
www.epa.gov/caddis/ssr_urb_is1.html.
In general, the higher the percentage of IC in a watershed, the poorer the surface water quality.
Research in Connecticut strongly suggests that aquatic life will be harmed when the IC within a
2
watershed exceeds 12%. Stormwater pollution from IC is a likely cause of impairment for these
waterbodies.
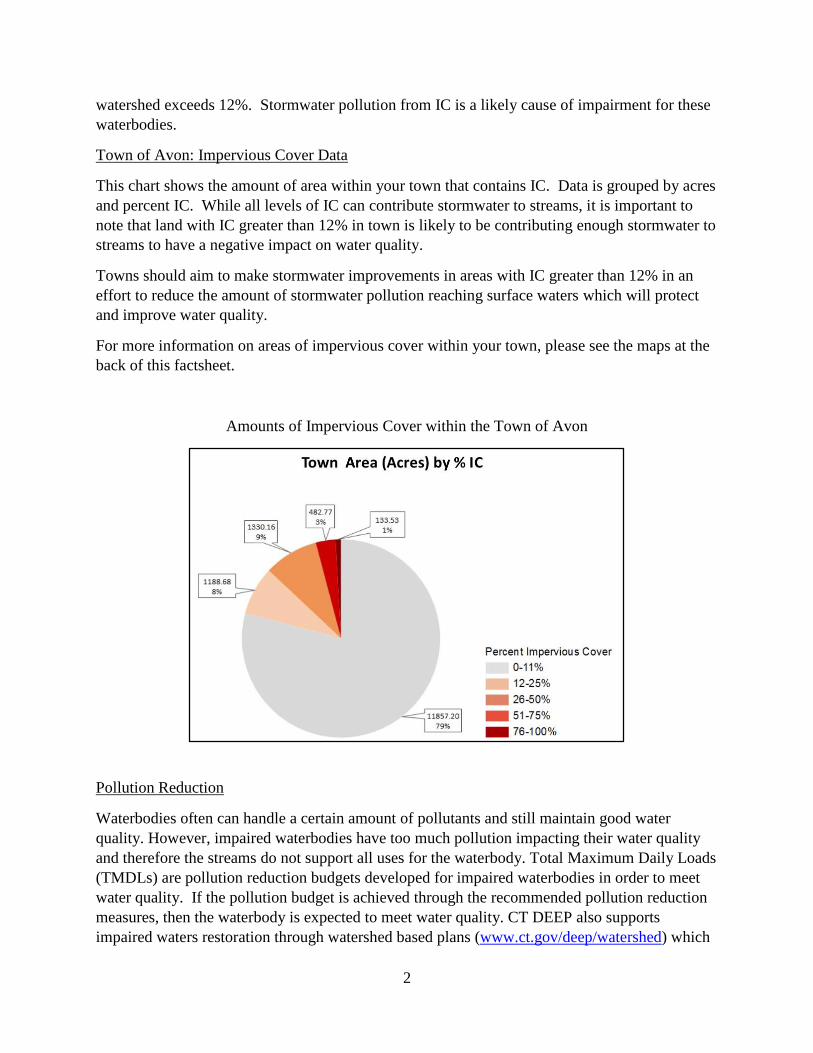
Town of Avon: Impervious Cover Data
This chart shows the amount of area within your town that contains IC. Data is grouped by acres
and percent IC. While all levels of IC can contribute stormwater to streams, it is important to
note that land with IC greater than 12% in town is likely to be contributing enough stormwater to
streams to have a negative impact on water quality.
Towns should aim to make stormwater improvements in areas with IC greater than 12% in an
effort to reduce the amount of stormwater pollution reaching surface waters which will protect
and improve water quality.
For more information on areas of impervious cover within your town, please see the maps at the
back of this factsheet.
Amounts of Impervious Cover within the Town of Avon
Pollution Reduction
Waterbodies often can handle a certain amount of pollutants and still maintain good water
quality. However, impaired waterbodies have too much pollution impacting their water quality
and therefore the streams do not support all uses for the waterbody. Total Maximum Daily Loads
(TMDLs) are pollution reduction budgets developed for impaired waterbodies in order to meet
water quality. If the pollution budget is achieved through the recommended pollution reduction
measures, then the waterbody is expected to meet water quality. CT DEEP also supports
impaired waters restoration through watershed based plans (www.ct.gov/deep/watershed) which

3
provide more specific non-point source pollution control measures. The following TMDLs or
pollution reduction strategies have been developed and apply to areas within your town.
TMDLs or Strategies Applicable to the Town of Avon
Name of TMDL or Strategy
Pollutant Waterbody Name
Link
Statewide Bacteria TMDL
Bacteria Farmington River (02) / Munniskunk Brook / Owens Brook / Russell Brook / Minister Brook
www.ct.gov/deep/lib/deep/water/tmdl/statewidebacteria/farmingtonriver4300.pdf
Statewide Bacteria TMDL
Bacteria Thompson Brook
www.ct.gov/deep/lib/deep/water/tmdl/statewidebacteria/thompsonbrook4316.pdf
Statewide Bacteria TMDL
Bacteria Nod Brook www.ct.gov/deep/lib/deep/water/tmdl/statewidebacteria/nodbrook4317.pdf
Statewide Bacteria TMDL
Bacteria North Branch Park River
www.ct.gov/deep/lib/deep/water/tmdl/statewidebacteria/nbranchparkriver4404.pdf
Statewide Bacteria TMDL
Bacteria Trout Brook www.ct.gov/deep/lib/deep/water/tmdl/statewidebacteria/troutbrook4403.pdf
A TMDL Analysis to Achieve Water Quality Standards for Dissolved Oxygen in Long Island Sound
Nitrogen Long Island Sound and contributing watersheds
www.ct.gov/deep/lib/deep/water/lis_water_quality/nitrogen_control_program/tmdl.pdf
Northeast Regional Mercury TMDL
Mercury All CT Inland waters
www.ct.gov/deep/lib/deep/water/tmdl/tmdl_final/ne_hg_tmdl.pdf
Interim Phosphorus Reduction Strategy
Phosphorus Certain CT Inland waters
www.ct.gov/deep/lib/deep/water/water_quality_standards/p/interimmgntphosstrat_042614.pdf
For more information on these TMDLs or strategies please go to our website
www.ct.gov/deep/tmdl.
4
Stormwater Quality Monitoring
Regular monitoring for targeted pollutants in stormwater provides an indication of potential for
water quality impacts and helps identify sources and unlawful discharges. Annual monitoring at
6 locations from different areas of town has been a requirement of the MS4 permit since 2004.
CT DEEP uses that information to evaluate the quality of stormwater and the potential for
impacts to surface waters as well as to make sure that stormwater is managed properly.
Below are 5 graphs tracking stormwater results submitted by your town for 5 parameters
reported under the current MS4 General Permit. The results of each stormwater test submitted to
CT DEEP by your town is shown. Individual sample results are shown in grey while the average
of the samples collected on a particular day is shown in blue, with a line connecting the averages
for the various sample dates. The bars show the statistical range of samples for each day with
the red squares showing results which are considered to be outliers, that is, very different from
the other samples collected on that day. The chart on the graph lists the sample dates and some
basic statistics:
Statistic Description
N Number of stormwater samples collected on that date
Mean Average of the results reported for that sample date
Standard Deviation (StdDev) A measure of the variability of the results for the sample date
Minimum The lowest sample result for the sample date
Maximum The highest sample result for the sample date
Bacteria
Escherichia coli (E. coli) is a bacteria that lives in the intestines of humans and other warm-
blooded animals and is used to indicate the presence of fecal matter in surface waters. Some
strains of E. coli and other pathogens found in fecal material cause serious illness in people
coming in contact with it. For this reason, high amounts of bacteria will cause authorities to
close beaches for swimming. Bacteria is measured as the number of colony forming units, or
CFU, per 100 ml of water. Any result that was reported as “to numerous to count” is included on
the chart as 800,000 CFU/100 mL.
5
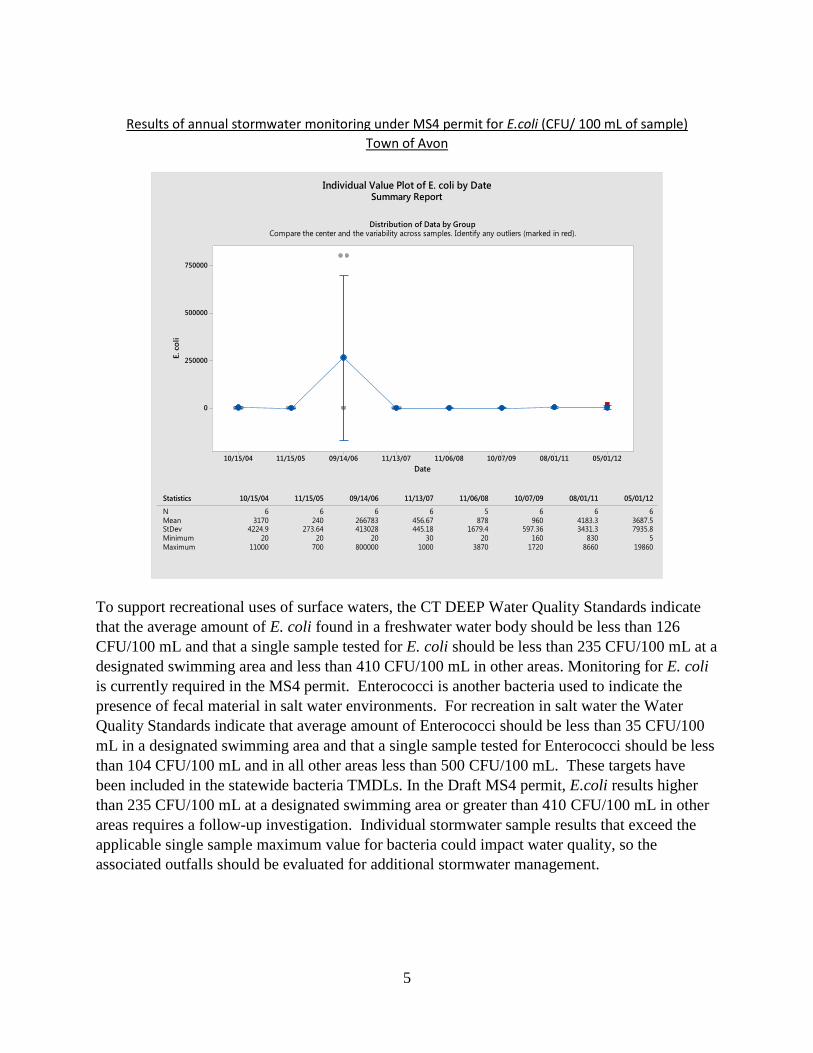
Results of annual stormwater monitoring under MS4 permit for E.coli (CFU/ 100 mL of sample)
Town of Avon
To support recreational uses of surface waters, the CT DEEP Water Quality Standards indicate
that the average amount of E. coli found in a freshwater water body should be less than 126
CFU/100 mL and that a single sample tested for E. coli should be less than 235 CFU/100 mL at a
designated swimming area and less than 410 CFU/100 mL in other areas. Monitoring for E. coli
is currently required in the MS4 permit. Enterococci is another bacteria used to indicate the
presence of fecal material in salt water environments. For recreation in salt water the Water
Quality Standards indicate that average amount of Enterococci should be less than 35 CFU/100
mL in a designated swimming area and that a single sample tested for Enterococci should be less
than 104 CFU/100 mL and in all other areas less than 500 CFU/100 mL. These targets have
been included in the statewide bacteria TMDLs. In the Draft MS4 permit, E.coli results higher
than 235 CFU/100 mL at a designated swimming area or greater than 410 CFU/100 mL in other
areas requires a follow-up investigation. Individual stormwater sample results that exceed the
applicable single sample maximum value for bacteria could impact water quality, so the
associated outfalls should be evaluated for additional stormwater management.
N 6 6 6 6 5 6 6 6
Mean 3170 240 266783 456.67 878 960 4183.3 3687.5StDev 4224.9 273.64 413028 445.18 1679.4 597.36 3431.3 7935.8
Minimum 20 20 20 30 20 160 830 5
Maximum 11000 700 800000 1000 3870 1720 8660 19860
Statistics 10/15/04 11/15/05 09/14/06 11/13/07 11/06/08 10/07/09 08/01/11 05/01/12
05/01/1208/01/1110/07/0911/06/0811/13/0709/14/0611/15/0510/15/04
750000
500000
250000
0
Date
E. co
li
Distribution of Data by GroupCompare the center and the variability across samples. Identify any outliers (marked in red).
Individual Value Plot of E. coli by DateSummary Report

6
Total Suspended Solids
Total Suspended Solids (TSS) is a measurement of the amount of solids (including sand and silt)
found in the stormwater sample. High concentrations of TSS can lower water quality in the
receiving stream by transporting various pollutants to the waterbody where they can directly
affect aquatic life or affect aquatic life by absorbing light, reducing photosynthesis, and by
making the water warmer. TSS can also clog fish gills and smother fish eggs and suffocate the
organisms that fish eat. TSS comes from erosion and is found in agricultural, urban and
industrial runoff. TSS can be reduced by protecting land from erosion and allowing stormwater
time to settle before discharging to surface waters.
Results of annual stormwater monitoring under the MS4 general permit for TSS (mg/L)
Town of Avon
Currently, there is not a water quality based target for TSS in stormwater but TSS is a general
indicator of water quality and, lower amounts of TSS are better. For comparison purposes, the
average MS4 stormwater result reported for TSS by all towns covered by this permit is 48 mg/L.
Areas within your town which have elevated TSS may be places to consider additional
stormwater management efforts.
N 6 6 6 6 6 6 6 6
Mean 74.667 19.167 16.167 68.667 5 9.75 108 31.333StDev 63.383 12.189 14.865 95.002 0 8.1163 94.304 32.770
Minimum 20 5 6 14 5 2.5 5 7
Maximum 191 36 45 260 5 19 220 96
Statistics 10/15/04 11/15/05 09/14/06 11/13/07 11/06/08 10/07/09 08/01/11 05/01/12
05/01/1208/01/1110/07/0911/06/0811/13/0709/14/0611/15/0510/15/04
300
250
200
150
100
50
0
Date
TS
S
Distribution of Data by GroupCompare the center and the variability across samples. Identify any outliers (marked in red).
Individual Value Plot of TSS by DateSummary Report

7
Total Nitrogen
Nitrogen is an important nutrient in marine and estuarine waters such as Long Island Sound, as
well as a concern in fresh water lakes and rivers. High amounts of nitrogen can lead to excessive
growth of water plants and algae which then reduces the amount of oxygen available to living
things in these waters. Unlawful discharges, animal waste, failing septic systems, leaves, litter
and fertilizers are common sources of high nitrogen in stormwater. Responsible use of
fertilizers, maintaining septic systems and proper disposal of pet waste will help reduce nitrogen
in stormwater.
Results of annual stormwater monitoring under MS4 general permit for total nitrogen (Total N mg/L)
Town of Avon
The TMDL for Long Island Sound requires a 10% reduction of nitrogen in stormwater
discharges to prevent low oxygen conditions in Long Island Sound. Each town should be
working to reduce the amount of nitrogen in their stormwater to address this issue. Under the
current draft MS4 permit, any result for total nitrogen greater than 2.5 mg/L will require a
follow-up investigation. Areas within your town which have elevated nitrogen may be places to
consider additional stormwater management activities.
N 6 6 6 6 6 6 6 6
Mean 3.309 3.675 1.9558 2.7417 2.1067 1.2133 3.2283 2.1767StDev 0.98947 2.3460 1.1515 0.85188 1.9859 0.46689 1.2295 0.60856
Minimum 2.48 1.35 0.52 1.34 0.93 0.67 1.84 1.47
Maximum 5.192 6.8 3.3 3.76 6.1 1.94 5.06 3.09
Statistics 10/15/04 11/15/05 09/14/06 11/13/07 11/06/08 10/07/09 08/01/11 05/01/12
05/01/1208/01/1110/07/0911/06/0811/13/0709/14/0611/15/0510/15/04
7.5
6.0
4.5
3.0
1.5
0.0
Date
To
tal
N
Distribution of Data by GroupCompare the center and the variability across samples. Identify any outliers (marked in red).
Individual Value Plot of Total N by DateSummary Report

8
Total Phosphorus
Phosphorus is an important nutrient necessary for growth in plants and animals in freshwater.
Too much phosphorus in the water can throw off the balance of aquatic ecosystems causing
excessive growth of water plants and algae blooms, which reduces the amount of oxygen in the
water, potentially harming the fish. Sometimes these algae blooms can contain toxic forms of
algae which are harmful to people and animals that come into contact with it. Sources of high
phosphorus can be unlawful discharges, fertilizers, litter, leaves, erosion and animal waste.
Results of annual stormwater monitoring under MS4 permit for total phosphorus (mg/L)
Town of Avon
CT DEEP is actively working with many towns to reduce the amount of phosphorus reaching
Connecticut’s streams and rivers. Under the current draft MS4 permit, a total phosphorus result
greater than 0.3 mg/L will require a follow-up investigation. Areas of your town that have
elevated levels of phosphorus in the stormwater are good places to develop additional
stormwater controls.
N 6 6 6 6 6 6 6 6
Mean 0.16483 0.25167 0.29667 0.82333 0.145 0.045 0.063333 0.11667StDev 0.061493 0.13586 0.18162 0.71211 0.20936 0.068044 0.072572 0.084538
Minimum 0.058 0.09 0.16 0.14 0.01 0.01 0.01 0.04
Maximum 0.24 0.44 0.64 1.6 0.43 0.18 0.17 0.26
Statistics 10/15/04 11/15/05 09/14/06 11/13/07 11/06/08 10/07/09 08/01/11 05/01/12
05/01/1208/01/1110/07/0911/06/0811/13/0709/14/0611/15/0510/15/04
1.50
1.25
1.00
0.75
0.50
0.25
0.00
Date
TP
Distribution of Data by GroupCompare the center and the variability across samples. Identify any outliers (marked in red).
Individual Value Plot of TP by DateSummary Report

9
Turbidity
Turbidity measures the clarity of the stormwater sample. It measures how much material (soil,
algae, pollution, microbes etc.) is suspended in the sample. High turbidity lowers the water
quality of a surface water by blocking sunlight for the plants and makes food harder for the fish
to find and may be an indication of a higher amounts of other pollution in the water. Surface
waters with high turbidity are visually less appealing for recreational use. High turbidity can be
caused by erosion, failing septic systems, decaying plants or animals, and excessive algae
growth. Turbidity is reported in Nephelometric Turbidity Units (NTU) which is related to how
easily light passes through the water sample.
Results of annual stormwater monitoring under MS4 permit for turbidity (NTU)
Town of Avon
The Water Quality Standards have a criterion that indicates turbidity should not to exceed 5 NTU
above ambient levels. In the draft MS4 permit, a turbidity result greater than 5 NTU over in-
stream conditions will require a follow-up investigation. While there is not a fixed statewide
criterion for turbidity, lower results are better for the health of the surface waters in town. Areas
with higher levels of turbidity in stormwater would be a good place to develop additional
stormwater controls.
N 6 6 6 6 6 6 6 6
Mean 29.2 13.195 9.4667 27.927 3.1567 13.72 78.138 13.985StDev 28.191 14.159 7.1308 26.117 2.0940 13.736 95.374 16.334
Minimum 6.2 0.19 2.61 8.86 0.85 1.03 3.35 2.36
Maximum 82 38 17 80 5.68 40.5 250 43.9
Statistics 10/15/04 11/15/05 09/14/06 11/13/07 11/06/08 10/07/09 08/01/11 05/01/12
05/01/1208/01/1110/07/0911/06/0811/13/0709/14/0611/15/0510/15/04
250
200
150
100
50
0
Date
Tu
rbid
ity
Distribution of Data by GroupCompare the center and the variability across samples. Identify any outliers (marked in red).
Individual Value Plot of Turbidity by DateSummary Report

10
Town Maps
The following maps were created to show the impervious cover (IC) in your town as well as the
water quality in the rivers, streams, lakes and estuaries in and around your town.
Impervious Cover on the Town Maps
IC is shown in red on the maps. Dark red areas indicate a higher percentage of IC, lighter red
areas have less IC, while the grey areas indicate very little or no IC.
Water Quality on the Town Maps
Separate maps are provided for the different uses of the waterbodies such as Aquatic Life Uses,
Recreation, and Shellfishing (in coastal towns). The waterbodies are colored to show the health
of the waterbody. Green means that the waterbody meets the water quality requirements to fully
support the specified use. Yellow means that water quality is poor and that the specified use is
not met. Blue means that there is not enough information to know whether or not water quality
is good or bad to support the specified use. Additionally, a small map is provided on the left side
of each larger map to show which watersheds are within your town.

11

12


