J. Serb. Chem. Soc. 82 (7–8) 921–931 (2017) UDC 581.45:547.979.7+547.262+ JSCS–5012 66.061:66.021.3 Original scientific paper
921
Extraction of chlorophyll from pandan leaves using ethanol and mass transfer study
MEILANA DHARMA PUTRA1*, AGUS DARMAWAN1, ILHAM WAHDINI1 and AHMED E. ABASAEED2
1Chemical Engineering Department, Lambung Mangkurat University, Banjarmasin 70123, Indonesia and 2Chemical Engineering Department, King Saud University,
Riyadh 11421, Saudi Arabia
(Received 3 December 2016, revised 20 March, accepted 22 March 2017)
Abstract: Green pigments are used in many industrial branches including food, drinks, soap and cosmetics. Chlorophyll can substitute synthetic dyes which may affect health. Chlorophyll can be extracted from pandan leaves; the pan-dan crop grows in many tropical areas. The effects of temperature, 30–70 °C and agitation speed, 100–400 rpm on chlorophyll extraction from pandan leaves, using ethanol and the evaluation of mass transfer coefficient, using dim-ensionless analysis were investigated. The optimal conditions of extraction was obtained at 60 °C and 300 rpm; the chlorophyll concentration was 107.1 mg L-1. The volumetric mass transfer coefficient increased with the temperature and agitation speed. Determination of volumetric mass transfer coefficient and dim-ensionless correlations are useful for further process development or industrial applications.
Keywords: green pigments; chlorophyll; solvent extraction; dimensionless; temperature; agitation.
INTRODUCTION Green pigments have been used in dyeing food, drink, soap, and cosmetics.1,2
Due to their stability, these pigments have been used as coating materials and as anti-knocking agents in gasoline engines.3 However, the excessive use of syn-thetic dyes may destroy the organs and cause poisoning. Natural colorants from plants or algae, e.g., chlorophyll, are safe and could provide health benefits, due to their anti-mutagenic and anti-oxidant contents that play positive roles in avoid-ing chronic diseases.4–6
Pandan crop (Pandanus amaryllfolius Roxb.) is one of the green plants that contain chlorophyll. Pandan grows in the tropical and subtropical islands and the
* Corresponding author. E-mail: [email protected] doi: 10.2298/JSC161203038P
(CC) 2017 SCS. All rights reserved._________________________________________________________________________________________________________________________Available on line at www.shd.org.rs/JSCS/
922 PUTRA et al.
coastlines of the Atlantic, Indian and Pacific Oceans. Pandan leaves contains alcaloids, saponins, flavonoids, tanins, poliphenols, and chlorophyll.7 Chloro-phyll is normally melted in the temperature range of 117–130 °C.8
Some organic solvents, e.g., methanol, ethanol, propan-2-one (acetone) and N,N-dimethyl formamide (DMF) have been used for the extraction of chloro-phyll. Ethanol and methanol were more effective solvents compared to acetone.9–11 However, the use of methanol in chlorophyll extraction produced an unstable sol-ution that degraded the chlorophyll in the product.9,12 The complete extraction was obtained with DMF.9,13 However, DMF is expensive and also toxic; thus its potential use as a solvent has decreased.9,11
The extraction rate is enhanced by increasing the solubility and mass transfer process.14 The extraction temperature enhances the solubility of the solute.15 The agitation by stirring does not essentially affect the solubility of solute. However, higher agitation speeds lead to higher turbulence, thus increasing the spread of the solute material in the solution.
The dimensionless analysis provides correlations that identify the important physical properties;16 hence, it is a useful tool for the further process develop-ment or for industrial applications.17 Sherwood number is commonly used to des-cribe the mass transfer operation.18
The use of pandan plant as a source of chlorophyll has not been investigated in the literature yet. In this study, the chlorophyll was extracted from pandan leaves using ethanol. The effects of temperature and agitation speed on the ext-raction process were investigated and the optimal conditions were determined. The mass transfer coefficient and its related dimensionless correlation were also examined, to facilitate the use of the model in industrial applications.
EXPERIMENTAL Raw materials
Prior to be dried overnight at 50 °C, pandan leaves were cleaned and cut into small pieces of about 0.5 cm2. The dried material was then ground into smaller pieces and sieved at a mesh size of 710 μm. Extraction process
Four hundred mL of 70 vol. % ethanol (to avoid damaging the pigment)19 was poured into a 500 mL three-neck flask equipped with a thermometer and a stirrer. The leaves’ powder was added after the flask was heated up to the system temperature and stirred at the desired agitation speed. The extracted leaves powder was separated from the ethanolic solution by decantation. The filtrate was then analyzed to measure the chlorophyll content. Various tem-peratures and agitation speeds were investigated in the range of 40–70 °C and 100–400 rpm, respectively. Chlorophyll analysis
The content of chlorophyll was analysed using spectrophotometer UV–Vis (Gold Spec-trumlab 53, BEL Engineering, Italy). The peak of chlorophyll was detected at the wavelength
(CC) 2017 SCS. All rights reserved._________________________________________________________________________________________________________________________Available on line at www.shd.org.rs/JSCS/
CHLOROPHYLL EXTRACTION FROM PANDAN LEAVES 923
of 652 nm. The equipment was calibrated to obtain a correlation between chlorophyll content in the solution and the detected peak at the wavelength as follows: Chlorophyll content, mg L-1 = 28.96A652 A652 is defined as the peak of pure chlorophyll that appears at wave length of 652 nm, while 28.96 is a linear coefficient at the range of the investigated concentration of chlorophyll. Characterization
The pandan leaves before and after extraction were characterized using scanning electron microscopy (SEM, Phenom G2 Pro, Phenom, Netherlands) for morphological studies and X-ray diffraction (XRD, XRD-6000, Shimadzu, Japan) for phase identification and crystallinity structure. Mass transfer coefficient
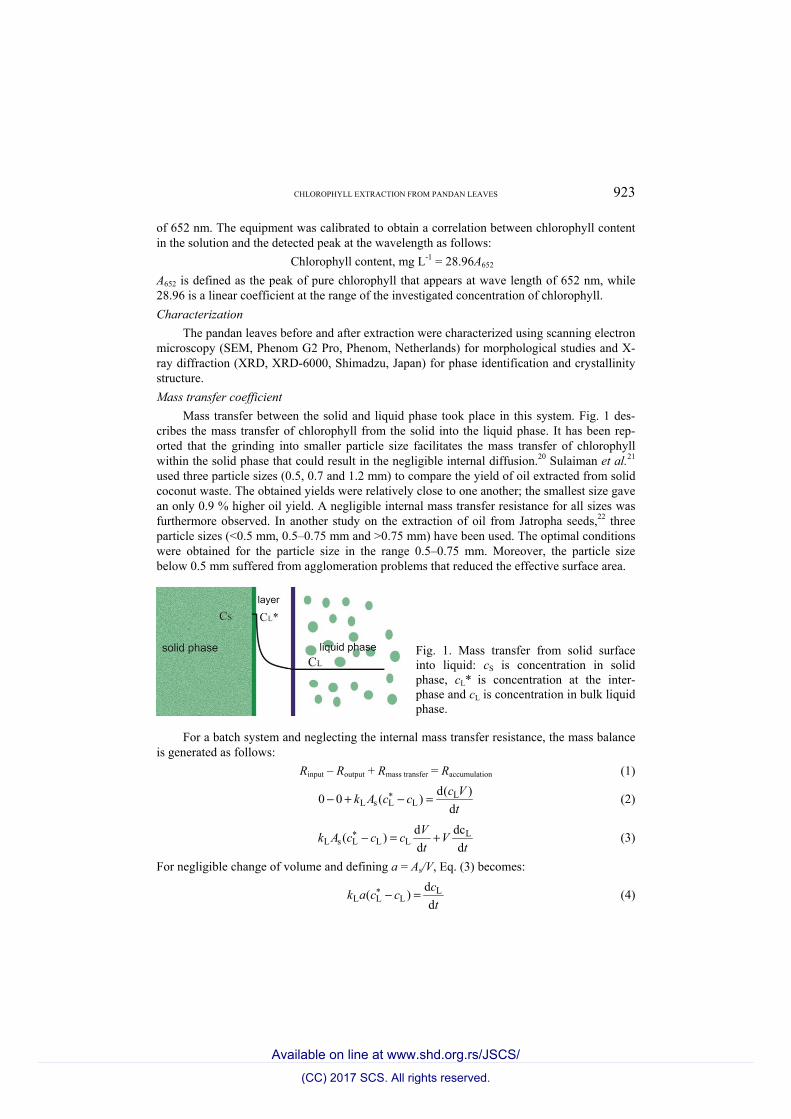
Mass transfer between the solid and liquid phase took place in this system. Fig. 1 des-cribes the mass transfer of chlorophyll from the solid into the liquid phase. It has been rep-orted that the grinding into smaller particle size facilitates the mass transfer of chlorophyll within the solid phase that could result in the negligible internal diffusion.20 Sulaiman et al.21 used three particle sizes (0.5, 0.7 and 1.2 mm) to compare the yield of oil extracted from solid coconut waste. The obtained yields were relatively close to one another; the smallest size gave an only 0.9 % higher oil yield. A negligible internal mass transfer resistance for all sizes was furthermore observed. In another study on the extraction of oil from Jatropha seeds,22 three particle sizes (<0.5 mm, 0.5–0.75 mm and >0.75 mm) have been used. The optimal conditions were obtained for the particle size in the range 0.5–0.75 mm. Moreover, the particle size below 0.5 mm suffered from agglomeration problems that reduced the effective surface area.
Fig. 1. Mass transfer from solid surface into liquid: cS is concentration in solid phase, cL* is concentration at the inter-phase and cL is concentration in bulk liquid phase.
For a batch system and neglecting the internal mass transfer resistance, the mass balance is generated as follows: Rinput – Routput + Rmass transfer = Raccumulation (1)
L*L s L L
d( )0 0 ( )dc Vk A c c
t− + − = (2)
L*L s L L L
d dc( )d dVk A c c c Vt t
− = + (3)
For negligible change of volume and defining a = As/V, Eq. (3) becomes:
L*L L L
d( )dck a c ct
− = (4)
(CC) 2017 SCS. All rights reserved._________________________________________________________________________________________________________________________Available on line at www.shd.org.rs/JSCS/
924 PUTRA et al.
Integrating Eq. (4) from t = 0 to t = t corresponding to cL = 0 to cL = cL, respectively, to give:
*L L
L*L
( ) ln c c k a tc
−− =
(5)
The value of cL* was determined when the equilibrium condition was achieved. The equilib-
rium was evaluated when the value of cL was constant with time.21 Diffusivity
The diffusivity the chlorophyll solute in the solvent was calculated using Stokes–Einstein equation:23
16
m 1/3A
9.96 10 TDVμ
−×= (6)
where Dm is diffusivity of chlorophyll in ethanol, m2 s-1; T is the extraction temperature, K; μ is viscosity of ethanol, kg m-1 s-1; and VA is solute molar volume, m3 kmol-1. Statistical analysis
Anova. single factor of Excel 2010 was used to determine the statistics. Chlorophyll concentrations were tested at 95 % confidence interval, i.e., p = 0.05 level to determine the statistical significance of the effect of temperature and agitation speed.
RESULTS AND DISCUSSION
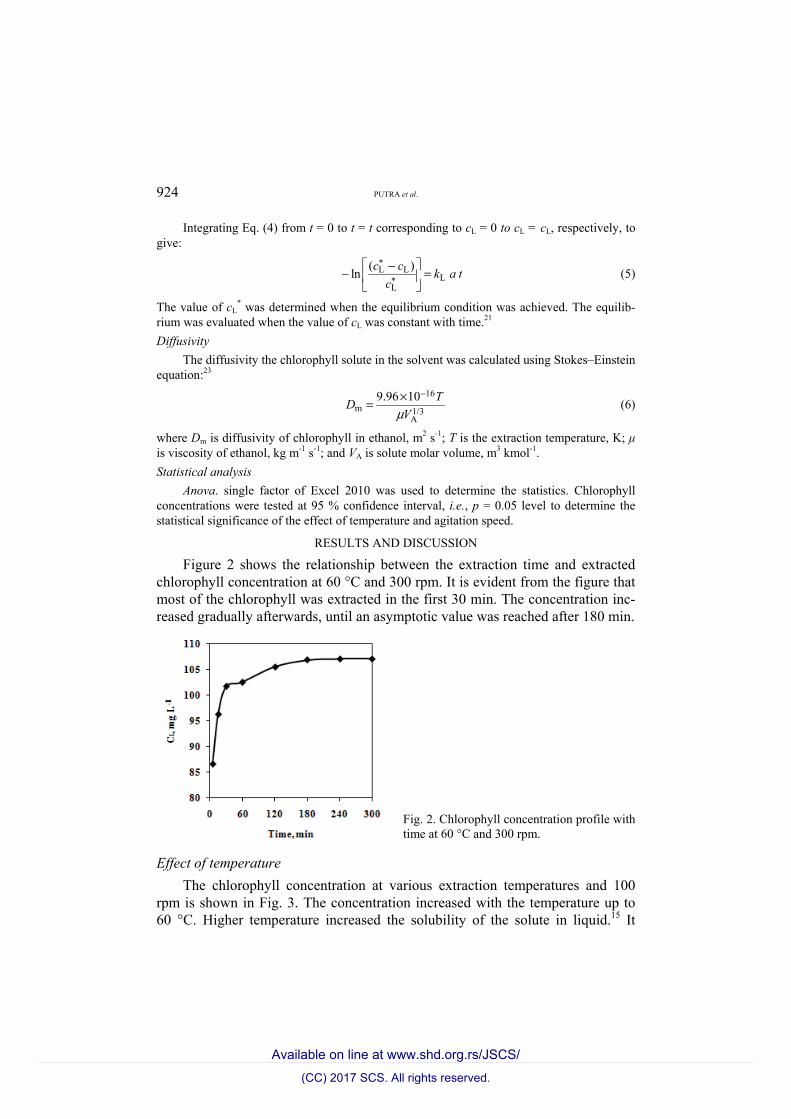
Figure 2 shows the relationship between the extraction time and extracted chlorophyll concentration at 60 °C and 300 rpm. It is evident from the figure that most of the chlorophyll was extracted in the first 30 min. The concentration inc-reased gradually afterwards, until an asymptotic value was reached after 180 min.
Fig. 2. Chlorophyll concentration profile with time at 60 °C and 300 rpm.
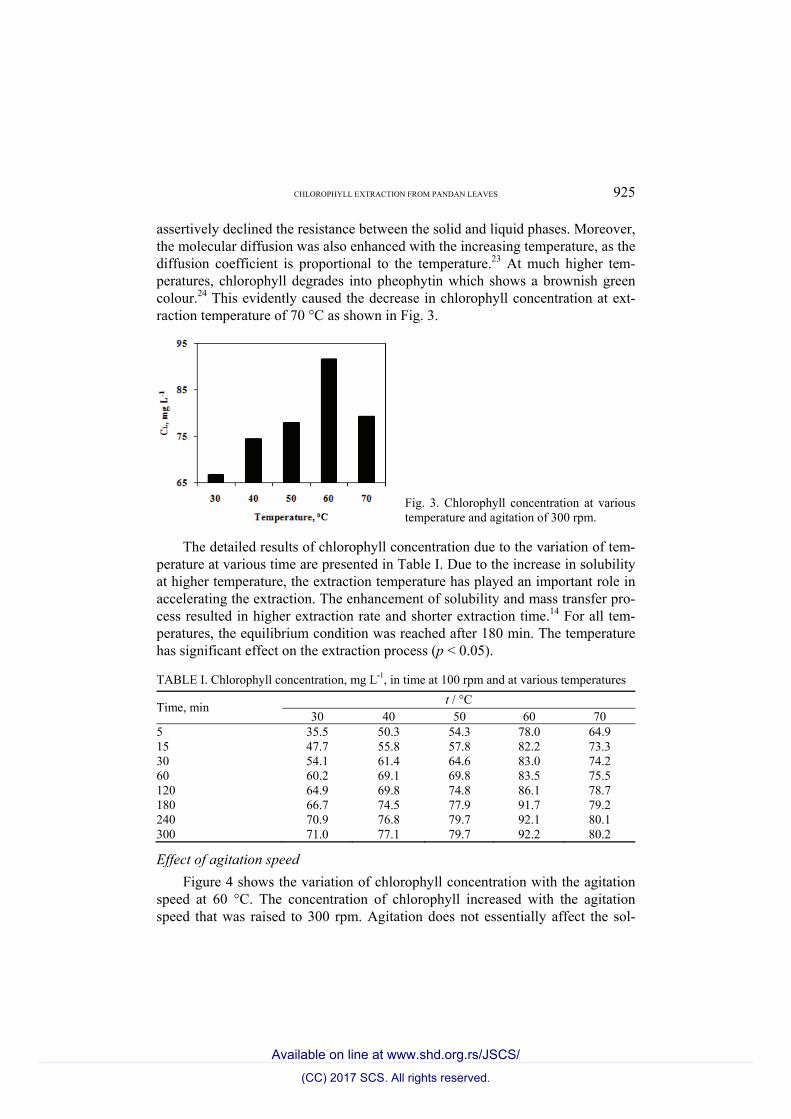
Effect of temperature The chlorophyll concentration at various extraction temperatures and 100
rpm is shown in Fig. 3. The concentration increased with the temperature up to 60 °C. Higher temperature increased the solubility of the solute in liquid.15 It
(CC) 2017 SCS. All rights reserved._________________________________________________________________________________________________________________________Available on line at www.shd.org.rs/JSCS/
CHLOROPHYLL EXTRACTION FROM PANDAN LEAVES 925
assertively declined the resistance between the solid and liquid phases. Moreover, the molecular diffusion was also enhanced with the increasing temperature, as the diffusion coefficient is proportional to the temperature.23 At much higher tem-peratures, chlorophyll degrades into pheophytin which shows a brownish green colour.24 This evidently caused the decrease in chlorophyll concentration at ext-raction temperature of 70 °C as shown in Fig. 3.
Fig. 3. Chlorophyll concentration at various temperature and agitation of 300 rpm.
The detailed results of chlorophyll concentration due to the variation of tem-perature at various time are presented in Table I. Due to the increase in solubility at higher temperature, the extraction temperature has played an important role in accelerating the extraction. The enhancement of solubility and mass transfer pro-cess resulted in higher extraction rate and shorter extraction time.14 For all tem-peratures, the equilibrium condition was reached after 180 min. The temperature has significant effect on the extraction process (p < 0.05).
TABLE I. Chlorophyll concentration, mg L-1, in time at 100 rpm and at various temperatures
Time, min t / °C 30 40 50 60 70
5 35.5 50.3 54.3 78.0 64.9 15 47.7 55.8 57.8 82.2 73.3 30 54.1 61.4 64.6 83.0 74.2 60 60.2 69.1 69.8 83.5 75.5 120 64.9 69.8 74.8 86.1 78.7 180 66.7 74.5 77.9 91.7 79.2 240 70.9 76.8 79.7 92.1 80.1 300 71.0 77.1 79.7 92.2 80.2
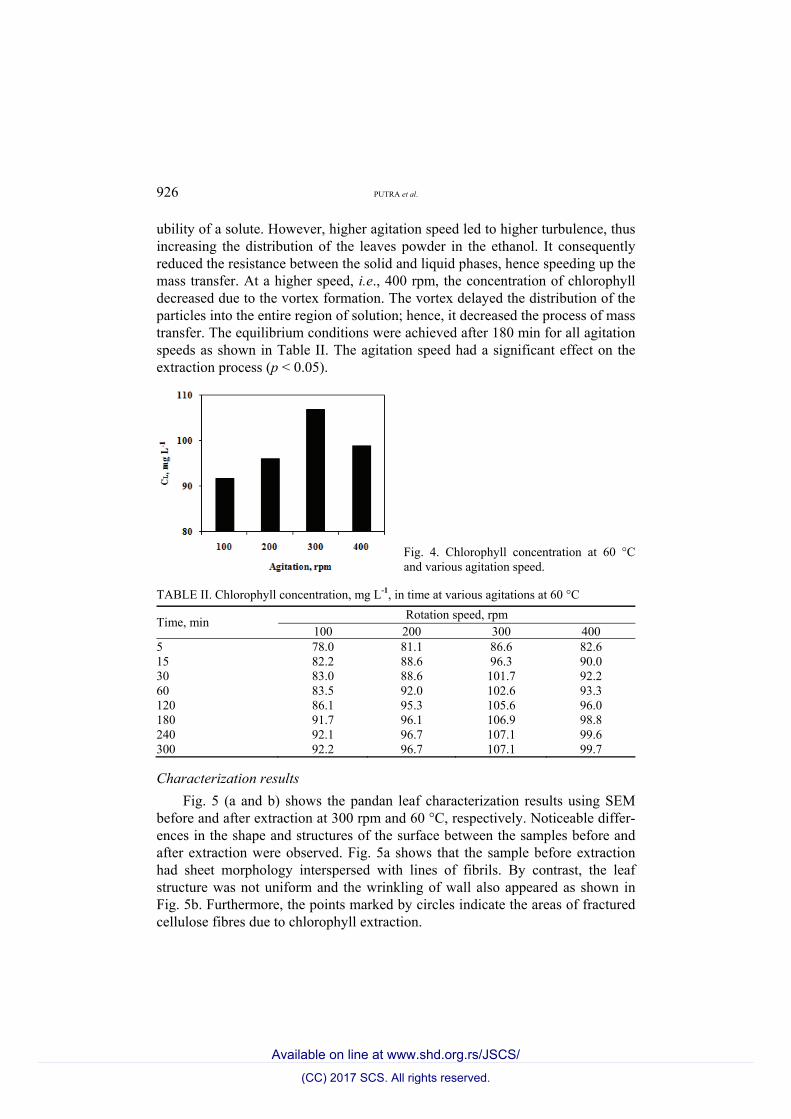
Effect of agitation speed Figure 4 shows the variation of chlorophyll concentration with the agitation
speed at 60 °C. The concentration of chlorophyll increased with the agitation speed that was raised to 300 rpm. Agitation does not essentially affect the sol-
(CC) 2017 SCS. All rights reserved._________________________________________________________________________________________________________________________Available on line at www.shd.org.rs/JSCS/
926 PUTRA et al.
ubility of a solute. However, higher agitation speed led to higher turbulence, thus increasing the distribution of the leaves powder in the ethanol. It consequently reduced the resistance between the solid and liquid phases, hence speeding up the mass transfer. At a higher speed, i.e., 400 rpm, the concentration of chlorophyll decreased due to the vortex formation. The vortex delayed the distribution of the particles into the entire region of solution; hence, it decreased the process of mass transfer. The equilibrium conditions were achieved after 180 min for all agitation speeds as shown in Table II. The agitation speed had a significant effect on the extraction process (p < 0.05).
Fig. 4. Chlorophyll concentration at 60 °C and various agitation speed.
TABLE II. Chlorophyll concentration, mg L-1, in time at various agitations at 60 °C
Time, min Rotation speed, rpm 100 200 300 400
5 78.0 81.1 86.6 82.6 15 82.2 88.6 96.3 90.0 30 83.0 88.6 101.7 92.2 60 83.5 92.0 102.6 93.3 120 86.1 95.3 105.6 96.0 180 91.7 96.1 106.9 98.8 240 92.1 96.7 107.1 99.6 300 92.2 96.7 107.1 99.7
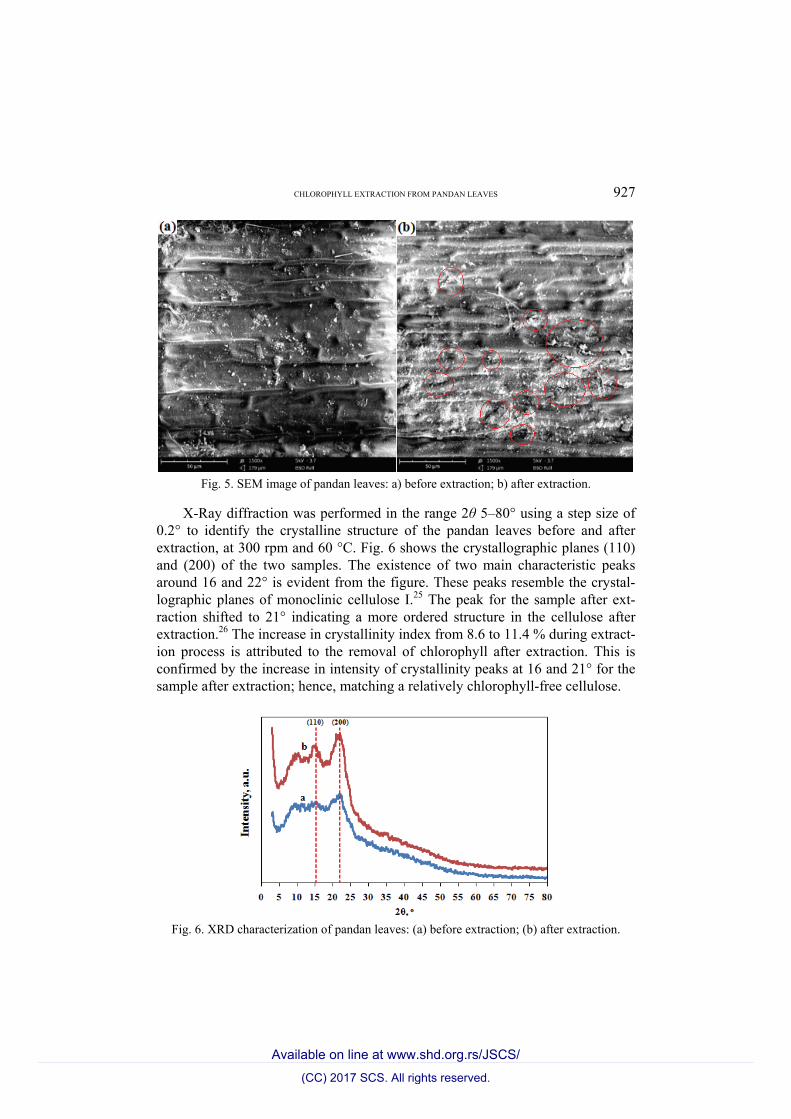
Characterization results Fig. 5 (a and b) shows the pandan leaf characterization results using SEM
before and after extraction at 300 rpm and 60 °C, respectively. Noticeable differ-ences in the shape and structures of the surface between the samples before and after extraction were observed. Fig. 5a shows that the sample before extraction had sheet morphology interspersed with lines of fibrils. By contrast, the leaf structure was not uniform and the wrinkling of wall also appeared as shown in Fig. 5b. Furthermore, the points marked by circles indicate the areas of fractured cellulose fibres due to chlorophyll extraction.
(CC) 2017 SCS. All rights reserved._________________________________________________________________________________________________________________________Available on line at www.shd.org.rs/JSCS/
CHLOROPHYLL EXTRACTION FROM PANDAN LEAVES 927
Fig. 5. SEM image of pandan leaves: a) before extraction; b) after extraction.
X-Ray diffraction was performed in the range 2θ 5–80° using a step size of 0.2° to identify the crystalline structure of the pandan leaves before and after extraction, at 300 rpm and 60 °C. Fig. 6 shows the crystallographic planes (110) and (200) of the two samples. The existence of two main characteristic peaks around 16 and 22° is evident from the figure. These peaks resemble the crystal-lographic planes of monoclinic cellulose I.25 The peak for the sample after ext-raction shifted to 21° indicating a more ordered structure in the cellulose after extraction.26 The increase in crystallinity index from 8.6 to 11.4 % during extract-ion process is attributed to the removal of chlorophyll after extraction. This is confirmed by the increase in intensity of crystallinity peaks at 16 and 21° for the sample after extraction; hence, matching a relatively chlorophyll-free cellulose.
Fig. 6. XRD characterization of pandan leaves: (a) before extraction; (b) after extraction.
(CC) 2017 SCS. All rights reserved._________________________________________________________________________________________________________________________Available on line at www.shd.org.rs/JSCS/
928 PUTRA et al.
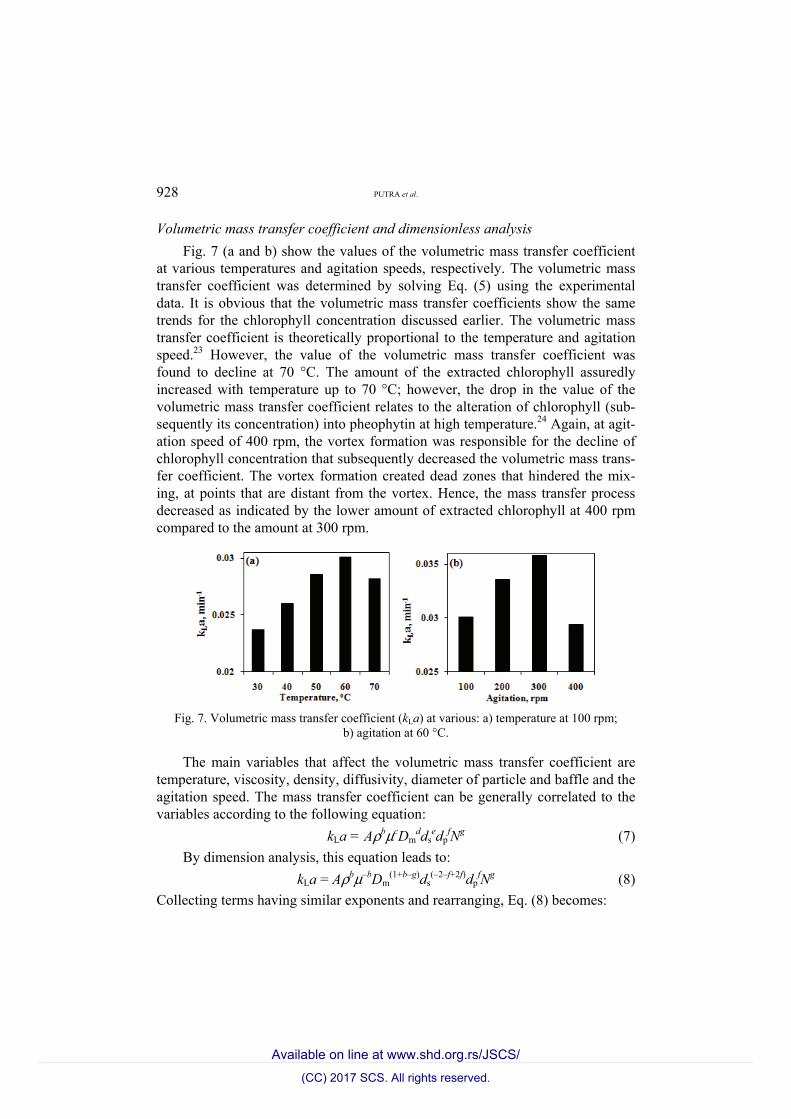
Volumetric mass transfer coefficient and dimensionless analysis Fig. 7 (a and b) show the values of the volumetric mass transfer coefficient
at various temperatures and agitation speeds, respectively. The volumetric mass transfer coefficient was determined by solving Eq. (5) using the experimental data. It is obvious that the volumetric mass transfer coefficients show the same trends for the chlorophyll concentration discussed earlier. The volumetric mass transfer coefficient is theoretically proportional to the temperature and agitation speed.23 However, the value of the volumetric mass transfer coefficient was found to decline at 70 °C. The amount of the extracted chlorophyll assuredly increased with temperature up to 70 °C; however, the drop in the value of the volumetric mass transfer coefficient relates to the alteration of chlorophyll (sub-sequently its concentration) into pheophytin at high temperature.24 Again, at agit-ation speed of 400 rpm, the vortex formation was responsible for the decline of chlorophyll concentration that subsequently decreased the volumetric mass trans-fer coefficient. The vortex formation created dead zones that hindered the mix-ing, at points that are distant from the vortex. Hence, the mass transfer process decreased as indicated by the lower amount of extracted chlorophyll at 400 rpm compared to the amount at 300 rpm.
Fig. 7. Volumetric mass transfer coefficient (kLa) at various: a) temperature at 100 rpm;
b) agitation at 60 °C.
The main variables that affect the volumetric mass transfer coefficient are temperature, viscosity, density, diffusivity, diameter of particle and baffle and the agitation speed. The mass transfer coefficient can be generally correlated to the variables according to the following equation: kLa = AρbμcDm
ddsedp
fNg (7) By dimension analysis, this equation leads to:
kLa = Aρbμ–bDm(1+b–g)ds
(–2–f+2f)dpfNg (8)
Collecting terms having similar exponents and rearranging, Eq. (8) becomes:
(CC) 2017 SCS. All rights reserved._________________________________________________________________________________________________________________________Available on line at www.shd.org.rs/JSCS/
CHLOROPHYLL EXTRACTION FROM PANDAN LEAVES 929
( )2 2
L s s d
m m s
g fg bk a d N d dA
D D dρ μ
μ ρ
− =
(9)
If the coefficients g and g–b are changed to P and Q, respectively and the diameters of particle and stirrer impeller are constant, the equation leads to:
2 2
L s s
m m
P Qk a d N dK
D Dρ μ
μ ρ
= (10)
Expressing Eq. (10) in dimensionless numbers gives: Sh = KRePScQ (11)
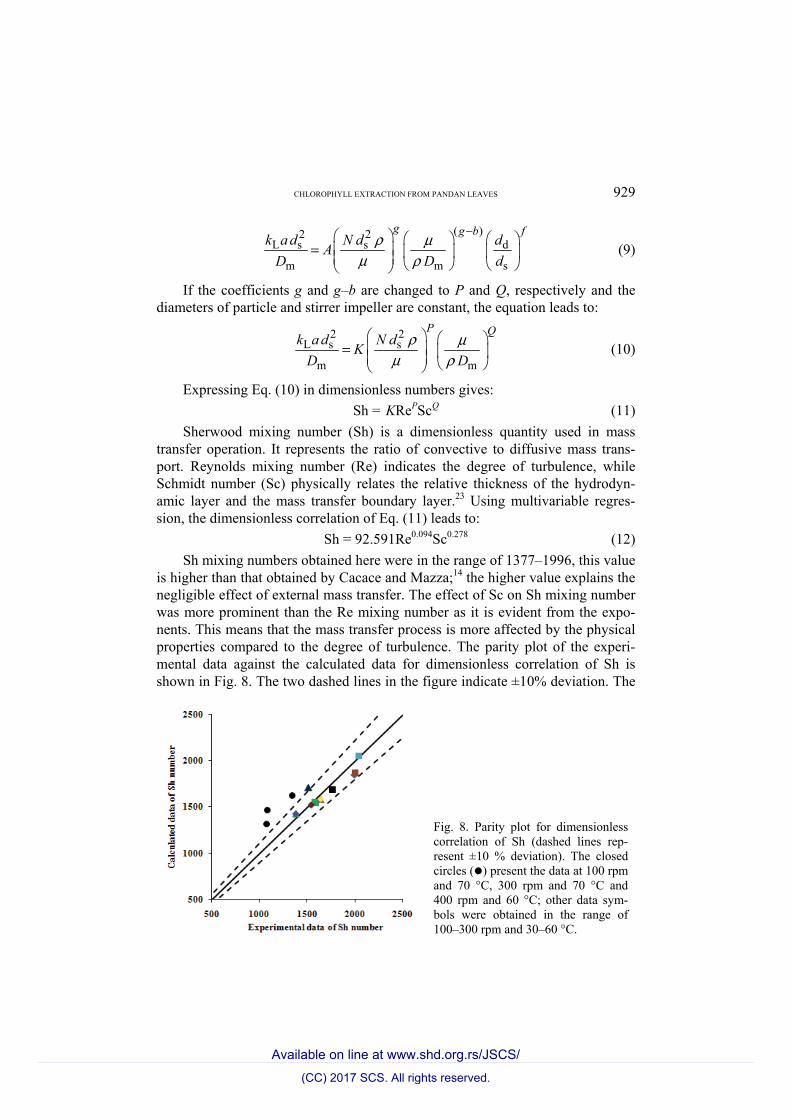
Sherwood mixing number (Sh) is a dimensionless quantity used in mass transfer operation. It represents the ratio of convective to diffusive mass trans-port. Reynolds mixing number (Re) indicates the degree of turbulence, while Schmidt number (Sc) physically relates the relative thickness of the hydrodyn-amic layer and the mass transfer boundary layer.23 Using multivariable regres-sion, the dimensionless correlation of Eq. (11) leads to: Sh = 92.591Re0.094Sc0.278 (12)
Sh mixing numbers obtained here were in the range of 1377–1996, this value is higher than that obtained by Cacace and Mazza;14 the higher value explains the negligible effect of external mass transfer. The effect of Sc on Sh mixing number was more prominent than the Re mixing number as it is evident from the expo-nents. This means that the mass transfer process is more affected by the physical properties compared to the degree of turbulence. The parity plot of the experi-mental data against the calculated data for dimensionless correlation of Sh is shown in Fig. 8. The two dashed lines in the figure indicate ±10% deviation. The
Fig. 8. Parity plot for dimensionless correlation of Sh (dashed lines rep-resent ±10 % deviation). The closed circles () present the data at 100 rpm and 70 °C, 300 rpm and 70 °C and 400 rpm and 60 °C; other data sym-bols were obtained in the range of 100–300 rpm and 30–60 °C.
(CC) 2017 SCS. All rights reserved._________________________________________________________________________________________________________________________Available on line at www.shd.org.rs/JSCS/
930 PUTRA et al.
goodness of fitting is evident from the figure and show that the data fall within the ±10% margin with quadratic regression (R2) of 0.99997. The three closed circles () present the data at 100 rpm and 70 °C, 300 rpm and 70 °C and 400 rpm and 60 °C, i.e., not at optimal conditions. Hence, the application of Eq. (12) is limited to the range of 100–300 rpm and 30–60 °C.
CONCLUSION
The extraction temperature and agitation speed have significant effects (p < < 0.05) on the extraction process. The optimal conditions of chlorophyll extract-ion from the pandan leaves was obtained at a temperature of 60 °C and at the agitation speed of 300 rpm, with a chlorophyll concentration of 107.1 mg L–1. The volumetric mass transfer coefficient increased with the extraction tempe-rature and the agitation speed; however, it dropped after reaching the optimal conditions. At the optimal temperature of 60 °C and the agitation of 300 rpm, the kLa value was 0.0358 min–1. A dimensionless equation that correlates Sherwood number to Reynolds and Schmidt numbers has been presented; the excellent fit was obtained.
NOMENCLATURE As = surface area, m2 ci = concentration of component i, mol m-3 Dm = diffusivity of chlorophyll in ethanol, m2 s-1 dp = diameter of particle, 0.00071 m ds = diameter of stirrer impeller, 0.04 m kLa = volumetric mass transfer coefficient, min-1 N = agitation speed, rpm Ri = rate of process i, mol m-3 min-1 t = time, min T = extraction temperature, K V = volume of solution, m3 VA = solute molar volume, m3 kmol-1 µ = viscosity, kg m-1 s-1 ρ = density, kg m-3
Acknowledgement. The authors extend their appreciation to the Faculty of Engineering at Lambung Mangkurat University for funding this work.
И З В О Д ЕКСТРАКЦИЈА ХЛОРОФИЛА ИЗ ЛИСТОВА ПАНДАНА КОРИШЋЕЊЕМ ЕТАНОЛА И
ИСПИТИВАЊЕ ПРЕНОСА МАСЕ
MEILANA DHARMA PUTRA1, AGUS DARMAWAN1, ILHAM WAHDINI1 и AHMED E. ABASAEED2
1Chemical Engineering Department, Lambung Mangkurat University, Banjarmasin 70123, Indonesia и 2Chemical Engineering Department, King Saud University, Riyadh 11421, Saudi Arabia
Зелени пигмети се користе у многим индустријама, укључујући индустрије хране, пића, сапуна и козметике. Хлорофил може да замени синтетичке боје које могу да утичу на здравље људи. Хлорофил се може екстраховати из листова пандана, биљке која расте
(CC) 2017 SCS. All rights reserved._________________________________________________________________________________________________________________________Available on line at www.shd.org.rs/JSCS/
CHLOROPHYLL EXTRACTION FROM PANDAN LEAVES 931
у многим тропским подручјима. Испитиван је утицај температуре, у опсегу 30–70 °C и брзине мешања, у опсегу 100–400 о/min, на екстракцију хлорофила из листова пандана коришћењем етанола и одређивани су коефицијенти преноса масе коришћењем безди-мензионе анализе. Оптимални услови екстракције су добијени на 60 °C И 300 о/min, при чему је концентрација хлорофила била 107,1 mg L-1. Запремински коефицијент преноса масе се повећава са порастом температуре и брзином мешања. Одређивање запремин-ског коефицијента преноса масе и бездимензионе корелације је корисно за даљи развој процеса и индустријске примене.
(Примљено 3. децембра 2016, ревидирано 20. марта, прихваћено 22. марта 2017)
REFERENCES 1. A. M. Humphrey, J. Food Sci. 69 (2004) C422 2. G. Özkan, S. E. Bilek, Food Chem. 176 (2015) 152 3. R. E. Kirk, D. F. Othmer, M. Grayson, Encyclopedia of Chemical Technology, The
Interscience Encyclopedia Inc., New York, 1998 4. S. M. Hung, B. D. Hsu, S. Lee, J. Food Eng. 128 (2014) 17 5. U. M. Lanfer-Marquez, R. M. C. Barros, P. Sinnecker, Food Res. Int. 38 (2005) 885 6. M. G. Ferruzzi, J. Blakeslee, Nutr. Res. 27 (2007) 1 7. B.-E. V. Wyk, Food Plants of the World, Timber Press, Inc, Portland, OR, 2005 8. F. Salisbury, C. W. Ross, Plant Physiology, Brooks/Cole, Boston, MA, 1991 9. S. W. Jeffrey, R. F. C. Mantoura, S. W. Wright, Phytoplankton Pigments in Oceano-
graphy: Guidelines to Modern Methods, UNESCO, Paris, 1997 10. D. Simon, S. Helliwell, Water Res. 32 (1998) 2220 11. A. Hosikian, S. Lim, R. Halim, M. K. Danquah, Int. J. Chem. Eng. 2010 (2010) 391632 12. R. F. C. Mantoura, C. A. Llewellyn, Anal. Chim. Acta 151 (1983) 297 13. M. D. Macías-Sánchez, C. Mantell, M. Rodríguez, E. Martínez de la Ossa, L. M. Lubián,
O. Montero, Talanta 77 (2009) 948 14. J. E. Cacace, G. Mazza, J. Food Eng. 59 (2003) 379 15. T. C. Frank, J. R. Downey, S. K. Gupta, Chem. Eng. Prog. 95 (1999) 41 16. M. H. Abdel-Aziz, M. Bassyouni, I. A. S. Mansour, A. Nagi, J. Ind. Eng. Chem. 20
(2014) 2650 17. J. Saien, V. Moradi, J. Ind. Eng. Chem. 18 (2012) 1293 18. L. Schrive, G. Lumia, F. Pujol, N. Boussetta, Eur. Food Res. Technol. 239 (2014) 707 19. N. Wasmund, I. Topp, D. Schories, Oceanologia 48 (2006) 125 20. M. T. Fernández-Ponce, B. R. Parjikolaei, H. N. Lari, L. Casas, C. Mantell, E. J. Martínez
de la Ossa, Chem. Eng. J. 299 (2016) 420 21. S. Sulaiman, A. R. Abdul Aziz, M. Kheireddine Aroua, J. Food Eng. 114 (2013) 228 22. S. Sayyar, Z. Z. Abidin, R. Yunus, A. Muhammad, Am. J. Appl. Sci. 6 (2009) 1390 23. C. J. Geankoplis, Transport Processes and Separation Process Principles, Prentice Hall,
Upper Saddle River, NJ, 2003 24. J. Gross, Pigments in Vegetables, Van Nostrand Reinhold, New York, 1991 25. K. Zhang, P. Sun, H. Liu, S. Shang, J. Song, D. Wang, Carbohydr. Polym. 138 (2016)
237 26. H.-M. Liu, F.-Y. Wang, Y.-L. Liu, Food Chem. 202 (2016) 104.
(CC) 2017 SCS. All rights reserved._________________________________________________________________________________________________________________________Available on line at www.shd.org.rs/JSCS/


![Nasi Lemak: Coconut-flavored Rice Meal - is rice cooked in coconut milk made aromatic with pandan leaves [screw pine leaves]. It is typically served with](https://cdn.vdocuments.us/doc/165x107/56649de75503460f94adfedd/nasi-lemak-coconut-flavored-rice-meal-is-rice-cooked-in-coconut-milk-made.jpg)


