
Extraction of Auditory Features and Elicitation of
Attributes for the Assessment of Multichannel
Reproduced Sound*
SYLVAIN CHOISEL,** AES Member, AND FLORIAN WICKELMAIER([email protected]) ([email protected])
Sound Quality Research Unit, Department of Acoustics, Aalborg University, 9220 Aalborg, Denmark
The identification of relevant auditory attributes is pivotal in sound quality evaluation. Twofundamentally different psychometric methods were employed to uncover perceptually rel-evant auditory features of multichannel reproduced sound. In the first method, called reper-tory grid technique (RGT), subjects were asked to assign verbal labels directly to the featureswhen encountering them, and to subsequently rate the sounds on the scales thus obtained. Thesecond method, perceptual structure analysis (PSA), required the subjects to consistently usethe perceptually relevant features in triadic comparisons, without having to assign them averbal label; given sufficient consistency, a lattice representation—as frequently used informal concept analysis (FCA)—can be derived to depict the structure of auditory features.
0 INTRODUCTION
The assessment of sound quality is a multidimensional
problem, in which a crucial part is concerned with the
identification of perceptual dimensions, or auditory attri-
butes. The elicitation of relevant attributes is not straight-
forward, and it has attracted increasing interest in the last
few years. A generalized set of attributes would certainly
help research on sound quality by allowing standardized
assessments and improving comparability between stud-
ies. However, considering the diversity of the applications,
it is more likely that a list of specific attributes will have
to be established for each context.
Recently several studies have addressed the problem of
eliciting auditory attributes in the context of reproduced
sound [1]–[6]. In [1] Bech gives an introduction to de-
scriptive analysis (DA), a technique frequently used in
other sensory research such as food quality [7]. In this
method a panel of trained listeners jointly develops a set of
verbal descriptors. The repertory grid technique (RGT)
[2], [8], on the other hand, is based on individual elicita-
tion and is applicable to expert as well as nonexpert lis-
teners. Various verbalization methods have been used in
other studies (such as [3] or [4]), with the same goal of
arriving at a common descriptive language for auditory
perception, by reducing the redundancy within the sub-
jects’ verbal descriptors.
All of these direct elicitation methods rely on the basic
assumption of a close correspondence between a sensation
on the one hand and its verbal descriptor on the other. This
is problematic in at least two ways. First, the elicitation of
auditory attributes will be dependent on the availability of
an adequate label in the subject’s lexicon. This means that
the verbal abilities of a participant will always bias the
outcome of direct elicitation procedures. Second, it cannot
be ensured that when a listener provides a verbal expres-
sion, it is related to an actual sensation at all. That the
listener had the sensation of, for example, being enveloped
by the sound field, when he or she said that it was “en-
veloping,” is assumed, not justified. This becomes even
more of a problem if the elicitation procedure encourages the
subject to produce many descriptors for a given set of sounds.
Indirect methods have been developed in order to dis-
entangle sensation and verbalization, such as multidimen-
sional scaling (MDS, see for example [9]), which aims at
uncovering salient perceptual dimensions without having
the subject name them, or even be aware of them. MDS is
frequently used as an exploratory analysis tool in sound
quality evaluation (for example, [10]) and only requires a
judgment of perceived distances between stimuli, typically
in the form of dissimilarity ratings. An outcome is a map
of the stimuli in a multidimensional space. The interpre-
*Portions of this work were presented at the 118th Convention
of the Audio Engineering Society, Barcelona, Spain, 2005 May
28–31. Manuscript received 2005 September 22; revised 2006
June 22.
**Also with Bang & Olufsen A/S, 7600 Struer, Denmark.
PAPERS
J. Audio Eng. Soc., Vol. 54, No. 9, 2006 September 815

tation of the dimensions, however, is not straightforward,
but often requires additional knowledge about the stimuli,
for instance, as obtained from (subjective) rating scales.
This paper presents perceptual structure analysis (PSA)
as a novel method to extract auditory features from a set of
sounds. The method is based on Heller [11], who devel-
oped the measurement-theoretical framework for an ex-
perimental procedure to extract semantic features of verbal
concepts. Heller’s approach is based on knowledge space
theory [12], a formalized theory for the representation and
assessment of knowledge, and on formal concept analysis
(FCA) [13], a technique derived from applied set theory,
which results in a graphical representation of data struc-
tures by means of lattice diagrams. Heller’s method was
adapted to the extraction of auditory features and was
tested experimentally with synthetic sounds by Wickel-
maier and Ellermeier [14]. In addition to its mathematical
foundation, the major advantage of PSA lies in the fact
that it strictly separates the identification of auditory sen-
sations from their labeling and allows for testing the iden-
tifiability of the extracted features.
In the present study both RGT and PSA were used as
methods to elicit auditory attributes in the context of mul-
tichannel reproduced sound. Both elicitation methods are
introduced and illustrated using results of an experiment
on the perception of a common set of sounds consisting of
various reproduction modes: mono, stereo, and several
multichannel formats.
1 METHOD
1.1 Setup and Stimuli
1.1.1 Experimental Setup
The loudspeaker configuration (represented in Fig. 1)
consisted of a five-channel surround setup following the
ITU-R BS.775-1 recommendation [15], with two addi-
tional loudspeakers at ±45°. This configuration allows for
the reproduction of mono, stereo, and 5.0 multichannel
formats as well as wide-angle stereo. The loudspeakers
were Genelec 1031A monitors, placed in a listening
room complying with the ITU-R BS.1116 requirements
[16]. It had an area of 60 m2 and a reverberation time
of between 0.25 and 0.45 s. The setup was hidden from
the subject by a curtain. The sounds were played back
by a PC placed in the control room, equipped with an
RME Hammerfall HDSP sound card connected to an
eight-channel digital-to-analog (D/A) converter (RME
ADI-8 DS).
The response interface consisted of a 15-in flat screen
placed in front of the listener, at a height of 0.45 m above
the floor (in its center), a keyboard, and an optical mouse.
A head rest fixed to the armchair ensured that the subject’s
head was always centered during the listening test. This
could be monitored from the control room via a camera
fixed to the ceiling above the listener.
1.1.2 Program Material
Four musical excerpts (two pop, two classical) were
selected from commercially available multichannel mate-
rial (Table 1). Their different musical contents (genre, in-
strumental versus vocal) as well as the varying spatial
information present in the multichannel mix (natural room
reverberation in the classical recordings, distributed instru-
ments in the pop music) made this selection suitable for
eliciting different spatial sensations. The two classical re-
cordings were made with five omnidirectional micro
phones placed in a circular array, and the two pop record-
ings were mixed with a standard surround panning tech-
nique. These excerpts were transfered from their original
medium—Super Audio Compact Disc (SACD) or Digital
Versatile Disc-Audio (DVD-A)—onto a computer (48
kHz, 24 bit) using a Denon 2200 player connected to an
eight-channel A/D converter (RME ADI-8 DS), and care-
fully cut to include a musical phrase, their duration rang-
ing from 4.7 to 5.4 s.
1.1.3 Downmixing and Upmixing
From the original five-channel recordings several for-
mats were derived, as shown in Table 2. When present
Fig. 1. Playback setup consisting of seven loudspeakers: left (L),right (R), center (C), left-of-left (LL), right-of-right (RR), leftsurround (LS), and right surround (RS). Setup was placed sym-metrically with respect to room width and was hidden from sub-ject by an acoustically transparent curtain. A computer flat screenwas used as a response interface.
Table 1. List of musical program material.
Disc Title Medium Track Time
Beethoven: Piano Sonatas Nos. 21, 23 & 26—Kodama Sonata 21, op. 53 (Rondo) SACD 03 1’51Rachmaninov: Vespers—St. Petersburg Chamber Choir/Korniev Blazen Muzh SACD 03 2’04Steely Dan: Everything Must Go Everything Must Go DVD-A 09 0’52Sting: Sacred Love Stolen Car SACD 06 1’55
CHOISEL AND WICKELMAIER PAPERS
J. Audio Eng. Soc., Vol. 54, No. 9, 2006 September816

(only in the pop recordings), the low-frequency effect
(LFE) channel was disregarded.
The original five-channel program material was mixed
down to stereo using Eq. (1), as recommended in [15],
Lst =1
�2�L +
1
�2C +
1
�2LS�
(1)
Rst =1
�2�R +
1
�2C +
1
�2RS�.
From the stereo version, mono and phantom mono were
computed as described by Eqs. (2) and (3), respectively,
Cmo =1
�2�Lst + Rst� (2)
Lph = Rph =1
2�Lst + Rst�. (3)
All processing was done in MATLAB using floating-point
precision, and all intermediate files were stored with 24-bit
resolution. The wide stereo format was identical to stereo,
but played on loudspeakers LL and RR positioned at ±45°.
Finally three upmixing algorithms were used to recon-
struct a multichannel sound from the stereo downmix: two
commercially available algorithms, Dolby Pro Logic II
and DTS Neo:6 (referred to as upmixing 1 and 2, in no
specific order), and a simple matrix decoding algorithm.
Dolby Pro Logic II was implemented on a Meridian 861
surround processor, with parameters defined in Table 3.
The processor was fed with a digital signal (S/PDIF) com-
ing from the RME sound card, and the five analog output
signals were recorded through the RME converter using
24-bit resolution. A Yamaha RX-V 640 receiver was used
as a DTS Neo:6 decoder. The only parameter (C. Image)
was set to default (0.3). The matrix upmixing was imple-
mented in MATLAB. The left and right surround channels
were fed with the difference between the left and right
signals (L − R and R − L, respectively) attenuated by 6 dB
[Eq. (4)],
Lma = L
Rma = R
LSma =1
2�L − R�
(4)
RSma =1
2�R − L�.
1.1.4 Equalization and Calibration
The frequency responses of the seven loudspeakers
were measured in an anechoic chamber by means of a
14th-order maximum-length sequence (MLS) at a sam-
pling frequency of 48 kHz, using a microphone (B&K
4133) placed at 2.5-m distance. After an adjustment of the
sensitivities, the loudspeakers showed differences up to 1
dB at some frequencies. In order to match them further,
FIR filters were designed to equalize for their anechoic
frequency responses. They were calculated based on the
first 7000 samples of the impulse responses and were trun-
cated to 1024 samples. The loudspeaker responses and the
calculated filters can be seen in Fig. 2(a), the resulting
equalized responses are shown in Fig. 2(b).
Each channel of the stimuli was equalized using the
corresponding filter. This equalization was based on the
Table 2. Reproduction modes (see Fig. 1).
Name Abbreviation Loudspeakers Used
Mono mo CPhantom mono ph L,RStereo st L,RWide stereo ws LL,RRMatrix upmixing ma L,R,LS,RSDolby Pro Logic II * L,R,C,LS,RSDTS Neo:6 * L,R,C,LS,RSOriginal 5.0 or L,R,C,LS,RS
* Referred to u1 and u2 (in no specific order) in the rest of thispaper.
Table 3. Parameters for Dolby ProLogic II upmix on Meridian
861 processor.
Parameter Value
Treble +1Bass −2Balance 0Center 0 dBDepth 0.5Width 3Dimension +1Panorama NoRear 0 dBR delay 0.0Lip sync 0.0
Fig. 2. (a) Measured frequency responses of seven loudspeakers(lower curves) and their corresponding equalization filters (uppercurves). (b) Equalized loudspeaker responses.
PAPERS ELICITATION OF AUDITORY ATTRIBUTES
J. Audio Eng. Soc., Vol. 54, No. 9, 2006 September 817
anechoic measurements, and no attempt was made to cor-
rect for the response in the listening room. Floor, wall, and
ceiling reflections, as well as standing waves, might affect
the sound differently for each channel, resulting in inter-
channel level differences. Therefore it is recommended to
align the playback level of the individual channels [17],
[18], but there does not seem to be a general agreement
on what stimulus to use for this purpose. In the present
study, band-limited pink noise (200 Hz to 2 kHz) was used
and recorded for 10 s at the listening position using a
B&K 4134 pressure-field microphone pointing upward.
This signal was equalized for each channel based on
the anechoic loudspeaker responses, in the same way for
all the musical excerpts. The A-weighted sound pressure
level was then calculated from the recordings. The inter-
channel level differences were measured to be within 0.3 dB,
but the differences between left/right pairs did not exceed
0.1 dB. Therefore no additional correction was applied.
1.1.5 Loudness Matching
After the interchannel level alignment the next goal was
to obtain the gains to be applied to the reproduction
modes, in order to eliminate loudness differences as much
as possible between them. Thereby no attempt was made
to match the four types of program material in loudness.
Rather, each of them was adjusted to a comfortable level
by the experimenters.
Eight subjects (six male, two female) performed the
loudness-matching task. All of them were experienced lis-
teners, either professionally involved in acoustics or hav-
ing extensive experience in subjective listening tests, but
were not taking part in the main experiment. The different
reproduction modes in Table 2 were matched in loudness
by using an adaptive procedure (2AFC, 1 up/1 down [19],
[20]). On each trial the task of the subject was to decide
which of the two presented sounds was louder, one being
the standard, the other the comparison, in random order.
When the listener indicated that the comparison was
louder than the standard, the level of the comparison was
reduced; it was increased otherwise. After four reversals
the step size was halved from 1 to 0.5 dB. After eight
reversals the track was completed, and the average level of
the last four reversals yielded an estimate of the loudness
match, or point of subjective equality. The first two sec-
onds of the musical excerpts in the eight reproduction
modes served as stimuli. For all four types of program
material the standard was chosen to be the stereo repro-
duction mode. Its playback level was adjusted beforehand
and measured in the listening position to be 65.8, 59.4,
66.5, and 67.7 dB A-weighted SPL, respectively (averaged
over the duration of the stimuli). In order for the procedure
to be less transparent for the subject, the eight adaptive
tracks were interleaved randomly in a single block, with a
probability proportional to the number of remaining rever-
sals. Each track had a random starting level of between ±3
dB. On average one block lasted 12.7 min for Beethoven.
14.0 min for Rachmanivov, 12.9 min for Steely Dan, and
15.2 min for Sting. Altogether the eight subjects gave
3808 loudness judgments.
The resulting matches (averaged across subjects) were
applied as gains to the final stimuli. After equalization and
loudness matching, all sounds were saved as multichannel
wave files, dithered and quantized to 16-bit (±1 LSB, tri-
angular probability density function) and with a sampling
frequency of 48 kHz.
1.2 Subjects
Thirty-nine listeners (27 male, 12 female) were selected
among 78 candidates, according to their listening abilities
and verbal fluency (see [21] for details on the selection
procedure).1 In summary the selected subjects outper-
formed the rejected ones in their ability to discriminate
sounds varying in stereo width, and in their ability to
promptly produce words belonging to different semantic
categories. The selected participants were all native Dan-
ish speakers, and their ages ranged from 21 to 39 (median
24). Because of their participation in a previous experi-
ment, all subjects were familiar with the stimuli. The sub-
jects were assigned randomly to one of three groups, two
of which took part in the repertory grid technique, the third
in the perceptual structure analysis.
1.3 Repertory Grid Technique
The repertory grid technique (RGT) typically consists
of two parts—an elicitation part, in which the subject de-
scribes in what way the sounds differ or are alike, and a
rating part, in which the stimuli are rated along the elicited
descriptors.
1.3.1 Elicitation of Verbal Descriptors
A triadic elicitation procedure was implemented follow-
ing Berg and Rumsey [2]. On each trial the subject was
presented with a triple of sounds and instructed to indicate
which of the three sounds differed most from the other
two. He or she was then asked in what way the selected
sound differed from the other two, and in what way the
other two were alike. A pair of words or expressions was
thus obtained for each triple, which were used later as
poles of a rating scale. The subject was allowed to reuse
already mentioned descriptors, available in a pull-down
list. He or she also had the possibility to listen to the
sounds as many times as needed.
An advantage of this triadic elicitation method is that it
avoids asking the subjects explicitly for opposite expres-
sions. Rather, it was assumed that asking the subjects to
describe first the similarities between two stimuli and then
the differences from the third one would implicitly elicit
descriptors opposite in meaning. A disadvantage, how-
ever, of using stimulus triples is that salient differences
between two sounds might be overlooked if they are al-
ways presented together with a more dissimilar sound.
Therefore an alternative elicitation method was em-
ployed in addition, using pairs of stimuli. The subjects
were asked to describe the difference between sounds a
and b with a pair of opposite words or expressions. Ten
1One of the 40 participants originally selected had left the
panel before the present experiment.
CHOISEL AND WICKELMAIER PAPERS
J. Audio Eng. Soc., Vol. 54, No. 9, 2006 September818

subjects took part in the triadic elicitation (referred to as
RGT-3), whereas another group of ten took part in the
pairwise elicitation (RGT-2). Because of the higher num-
ber of triples (56) than pairs (28), the subjects in the first
group performed the task on only two types of program
material (balanced across subjects), whereas the second
group completed the task for all four types of music.
A possible problem in the elicitation phase is that, in a
given pair (or triple), a dominant attribute might mask
another, less dominant but yet important attribute. Berg
[22, p. 3] addresses this so-called construct masking by
iteratively querying the listener for a given set of sounds
and, thereby, “exhausting all perceived attributes of the
stimulus, or combination of stimuli, under consideration
by the subject, before the stimuli are changed.” In the
present study the responses were not limited to one word
only, and it was possible to enter several descriptors per
triple. Subjects were not, however, explicitly encouraged
to do so. Nonetheless, it was hypothesized that pairwise
elicitation is less prone to construct masking than is triadic
elicitation, for the reasons mentioned.
1.3.2 Scaling
The scaling procedure remained identical for the two
groups (RGT-3 and RGT-2). For each pair of opposite
descriptors the eight reproduction modes were to be rated
by making a mark on a line using the mouse. The descrip-
tors were shown at the top left- and top right-hand side of
the screen; underneath eight lines were displayed, and
eight buttons (labeled from A to H) placed next to them
allowed for the playback of the sounds. Once all sounds
were rated, the subject could proceed to the next pair of
descriptors. The order of the reproduction modes was ran-
domized on each trial.
1.3.3 Reduction to Fewer Attributes
When a large number of descriptors is obtained, it might
be desirable to reduce them to fewer—ideally indepen-
dent—attributes. Two main approaches are typically used.
The first involves classifying the verbal data into semantic
categories (for example, [3]), the second makes use of the
ratings of the stimuli on the elicited descriptors [2]. For the
latter approach several statistical methods are available to
reduce the dimensionality of a set of variables, the most
common ones being factor analysis, principal component
analysis, and cluster analysis. The latter was used in this
study.
Cluster analysis was performed on the ratings associ-
ated with each descriptor, in a similar way as proposed by
Berg and Rumsey [2]. First, a matrix of distances between
the scales was calculated; the distance between two scales
Xi and Xj was chosen as dij � 1 − |rij|, where rij is the
correlation coefficient between the two scales. Uncorre-
lated scales will therefore be at a distance of 1, while
highly correlated scales, either positively or negatively,
would result in a distance close to 0. From the distances
the cluster analysis derives a treelike representation, the
so-called dendrogram, where the descriptors/scales are
the leaves and the nodes are clusters. The closer to the
bottom two leaves are connected in the dendrogram (the
lower the clustering level), the more similarly the two
corresponding scales were used by the subject. Verbal
descriptors clustering together can then be merged into a
common construct, according to a criterion chosen by the
researcher.
1.4 Perceptual Structure Analysis
Perceptual structure analysis (PSA) attempts to extract
auditory features arising from a set of sounds. A feature
may be defined as some perceptual effect which allows the
subject to categorize the stimuli. In this section the basic
theoretical background is introduced (for more details, the
reader is referred to [11], [14]), and the experimental and
analysis procedures used in this study are presented.
1.4.1 From Triadic Comparisons to a
Feature Representation
Let X denote the total set of sounds under study, the
so-called domain, and � a collection of subsets of X, which
will be interpreted as the set of auditory features of the
sounds in X. In accordance with [11], <X, �> is called a
perceptual structure. Fig. 3 displays the lattice graph of a
hypothetical perceptual structure � � {, {a}, {b}, {c},
{d}, {a, b, c}, X} on the domain X � {a, b, c, d}. Each
node in this graph represents a feature shared by the
sounds connected to it. Let A ⊆ X denote a subset of X, and
�(A) the intersection of all sets in � of which A is a subset,
��A� = ∩A⊆ S, S∈�
S.
This means that �(A) is the smallest set in � which in-
cludes the sounds in A. In the example shown in Fig. 3,
�({a, b}) � {a, b, c}, implying that all features shared by
a and b are also shared by c; and �({a, d}) � X, implying
that a and d do not share any other feature than the one
shared by all sounds in X.
A relation Q that relates the subsets of X to X can be
defined in the following way. The sounds in A are said to
be in relation to a sound x ∈ X, formally AQx, if and only
if the subject answers “No” to the question:
Do the sounds in A share a feature that x does not have?
If the answer is “Yes,” the relation between A and x does
not hold, formally AQx.
Fig. 3. Lattice graph of hypothetical perceptual structure. Soundsare denoted by a, b, c, and d; {a, b, c} represents a feature sharedby a, b, and c, but not by d; X � {a, b, c, d} is the domain.
PAPERS ELICITATION OF AUDITORY ATTRIBUTES
J. Audio Eng. Soc., Vol. 54, No. 9, 2006 September 819

The relation Q is said to be transitive if
AQb��b ∈ B� and BQc ⇒ AQc (5)
for all nonempty A, B ⊆ X, and c ∈ X.
To illustrate this, let us assume that Q has been estab-
lished by querying a subject and that the responses {a,
b}Qc (“No”) and {a, b}Qd (“Yes”) have been observed,
which are in line with the structure in Fig. 3. If in addition,
however, the response {b, c}Qd (“No”) was given—and
assuming {a, b}Qb to hold trivially—it follows from Eq.
(5) that transitivity is violated, since transitivity would
require that
�a, b�Qb, �a, b�Qc and �b, c�Qd ⇒ �a, b�Qd
and consequently a perceptual structure cannot be derived,
given this pattern of responses.
If and only if transitivity holds, Q can be represented by
a perceptual structure � on X such that
AQb if and only if b ∈ ��A� (6)
for all nonempty A ⊆ X and b ∈ X (see [11, theorem 2]).
If the set of all sounds that are in relation to A is de-
fined as
AQ = �x ∈ X : AQx�
then it follows from Eq. (6) that AQ � �(A). In an ex-
periment �(A) will have to be determined from the re-
sponses, and the perceptual structure � can then be con-
structed by
� = ���A� : A ⊆ X�.
In practice the number of questions is usually too large
to be accommodated in an experimental session if all pos-
sible subsets A ⊆ X are presented. For n stimuli, (2n− 1)n
questions are required, which would amount to 2040 ques-
tions for n � 8. For that reason, in the present experiment
the subsets are restricted to containing pairs of sounds
only. The consequence of such an incomplete design is a
potentially nonunique representation [11], [14], meaning
that the subject’s responses might result in more than one
representing perceptual structure. This uniqueness prob-
lem is addressed in a later section.
Single-element subsets are not included in the querying
procedure, assuming that the sounds can be discriminated,
and therefore each has at least one characteristic feature.
Finally Q is assumed to hold for both sounds in each pair
(Q is assumed to be reflexive), that is, {a, b}Qa and {a,
b}Qb, so that each pair will only be presented together
with the remaining |X| − 2 sounds.
1.4.2 Experimental Procedure
Let n be the number of sounds under study in an ex-
periment. For each of the n(n − 1)/2 unordered pairs of
sounds {a, b} and each of the n − 2 remaining sounds c,
the following question was asked:
Do sounds a and b share a feature that c does not have?
The number of such triples {a, b, c} is n(n − 1)(n − 2)/2.
This procedure relies on—and thereby verifies—the abil-
ity of the subject to consistently identify the salient fea-
tures in a certain context given by a set of stimuli. In order
to increase consistency of the judgments, it will help if the
subject develops a clear idea of the features already prior
to proceeding with the triadic comparisons. For that pur-
pose a familiarization session preceded the main experi-
ment, in which the subject was instructed to listen to the
sounds (arranged in a playlist) as many times as needed,
and identify the features characterizing the sounds. Previ-
ous to the familiarization with the sounds, in order to
introduce the participants to the task, they went through a
short tutorial using drawings (simple geometric shapes
having strongly salient visual features) together with the
experimenter before the task was applied to sound stimuli.
Such a tutorial has the advantage that 1) the task is intu-
itive when visual stimuli are used and 2) it avoids intro-
ducing auditory concepts that might bias the judgments.
Each triple of sounds was presented twice, in two dif-
ferent sessions. All triples for which the two responses did
not agree were presented a third time in a third session.
Because of the many questions required by this method,
only n � 7 reproduction modes were included in the ex-
perimental design; the matrix-upmixed format [Eq. (4)]
was removed from the stimuli. With 105 triples each ses-
sion was completed in one hour including breaks. Nine-
teen of the 39 subjects participated in this experimental
procedure, with only one type of program material each.
1.4.3 Fitting Perceptual Structures
In principle a single violation of transitivity [Eq. (5)] in
the responses of a subject prevents their representation by
a perceptual structure. If only a few violations have oc-
curred, it is possible, however, to inspect the pattern of
violations visually and attempt to resolve them by revers-
ing as few responses as possible from “Yes” to “No,” or
vice versa. Often a single response alteration can account
for several violations, which makes it likely that these
violations are the result of a careless error rather than of
systematic inconsistencies. Such a manual procedure,
however, is quite cumbersome, especially if one is inter-
ested in minimizing the number of response alterations, or
evaluate several solutions to resolve the violations.
Therefore a computer program was developed,2 which
searches for the best solution allowing a feature represen-
tation, that is, the structure that best fits the subject’s re-
sponses. A brute-force procedure, such as testing all pos-
sible structures, is not practically viable—with n � 7
stimuli, there are 2n� 128 possible sets. Excluding trivial
sets such as the singletons, the empty set , and the domain
X—which would not affect the goodness of fit—there are
2(2n−n−2)� 2119
� 6.6 × 1035 possible structures. Testing
all possible response alterations might also be a possible
approach, but the complexity of such an algorithm quickly
rises with the number of response alterations. By contrast
the proposed method attempts to infer the features that
potentially underlie the subject’s responses (see [14] for an
2Software is available from the authors upon request.
CHOISEL AND WICKELMAIER PAPERS
J. Audio Eng. Soc., Vol. 54, No. 9, 2006 September820

example). In order to do that, it assumes that violations are
caused by the subject either overlooking a feature or, on
the contrary, erroneously identifying a feature in the local
context of a given triple.
From transitivity [Eq. (5)] it follows that B ⊆ AQ ⇒ BQ
⊆ AQ for all nonempty subsets A, B of X. Consequently a
transitivity violation occurs whenever B ⊆ AQ is true, but
BQ � AQ is observed. The violations can be resolved in
several ways:
1) Replace AQ by AQ ∪ BQ.
2) Remove from BQ the elements that are not in AQ.
3) Remove from AQ one or both elements of B, with the
restriction that AQ must still contain A.
This can be interpreted as follows. Generally, adding
elements to either AQ or BQ corresponds to changing re-
sponses from “Yes” to “No,” suggesting that a feature has
been erroneously identified, whereas removing elements
corresponds to changing responses from “No” to “Yes,”
suggesting that a feature has been overlooked by the
subject.
Once a list of possible sets is created from all AQ plus
all modified versions according to these three rules, a
simulation is performed to estimate the best fitting struc-
ture. For all combinations of these candidate sets, the an-
swers in the triadic comparisons are predicted and com-
pared to the observed answers. The number of answers
differing between these two sets of responses is used as a
measure of fit. The outcome is a list of structures ordered
by the number of reversed answers. A simulation of re-
sponse patterns was not attempted when the observed
judgments were classified as unreliable or inconsistent.
Unfortunately no simple criteria for such a classification
are at hand. Rather, the indices of reliability and consis-
tency (see Table 5), and their development over time (ses-
sions), have to be considered together. Once a potential
structure is found, the number of response alterations
needed to resolve the transitivity violations might serve as
a further index of validity (see Section 2). In the present
application a limit for alterations was set at 10% of the
observed responses.
1.4.4 Uniqueness Problem
Because the relation Q was established with only pairs
of sounds rather than all possible subsets, there is poten-
tially more than one structure representing the responses.
In order not to omit any feature, the largest of these rep-
resenting structures was selected which, according to the
uniqueness theorem [11, theorem 3], contains all the other
solutions. Whether or not all features could actually be
identified by the subject might be inferred from the out-
come of a structured debriefing session described in the
next subsection.
Furthermore, in the case of transitivity violations the
fitting procedure can potentially return several solutions at
the same distance to the subject’s responses, resulting in
another source of uncertainty about the representation. The
task is left to the experimenter to choose among the pos-
sible structures. The strategy applied in the present study
was to choose the structure with most features at minimal
distance. Here again, the descriptions collected during the
debriefing session might help to clarify whether or not all
proposed features had been identified.
1.4.5 Labeling of the Features
When a perceptual structure was obtained, the subject
was asked to label each feature during a debriefing session
after the actual data collection. All seven sounds were
arranged in a play list, some of which—those sharing a
common feature according to the structure—were marked
with a bullet. The question to the subject was, “What
feature do the marked sounds share, which the other
sounds do not have?” On each trial the participant entered
a short description of the common feature using the key-
board. Subsequently the next feature of his or her percep-
tual structure was presented. The subject had the possibil-
ity of giving no description when he or she did not
recognize a feature.
2 RESULTS
2.1 Repertory Grid Technique
The number of verbal descriptors elicited using RGT
are shown in Table 4. Overall a slightly higher number of
descriptors was obtained per subject with the pairwise
(RGT-2) than with the triadic (RGT-3) elicitation, in spite
of the fact that the latter involved more comparisons (there
are more triples than pairs). This might hint at a slight
advantage of RGT-2 over RGT-3 with respect to construct
masking (Section 1.3.1).
In order to reduce the number of descriptors, cluster
analysis was performed on the ratings associated with each
descriptor. This analysis was done individually for each
subject. The result for one subject (92) is depicted in Fig.
4 as an example. The choice of a cutoff level—below
which sounds clustering together are combined into a
single construct—is not straightforward. So far subjects
have been encouraged to use their own descriptors, and a
grouping of these constructs according to similarities in
their ratings requires some interpretation from the re-
searcher. In the present study the same cutoff level was
chosen for all subjects after visual inspection of the clus-
ters. A value of 0.3 was found to represent a compromise
between the ability to group related constructs together
and to discriminate between (at least semantically) unre-
lated constructs. This resulted in an average number of
clusters of 3.6 (Beethoven), 4.2 (Rachmaninov), 5.1
(Steely Dan), and 5.1 (Sting). Berg and Rumsey [2] dis-
cussed the different biases possibly introduced by the re-
Table 4. Number of descriptors elicited by two RGT groups.
ProgramMaterial
RGT-2 RGT-3
Min Max Mean Min Max Mean
Beethoven 3 12 7.9 3 9 5.4Rachmaninov 3 13 8.0 5 13 9.2Steely Dan 2 19 8.8 2 13 8.6Sting 4 15 9.9 3 11 8.2
PAPERS ELICITATION OF AUDITORY ATTRIBUTES
J. Audio Eng. Soc., Vol. 54, No. 9, 2006 September 821

searcher. At this level, in particular, constructs clustering
together might erroneously be interpreted as related to the
same sensation. In order to reduce such biases associated
with cluster labeling, the subsequent attribute selection
was based both on the clusters and on the individual con-
structs. As will be shown in Section 2.3, these two ap-
proaches led to similar results.
In addition to the similarity of the descriptors, the simi-
larity of the reproduction modes can be represented as a
dendrogram (Fig. 5). The distance was calculated as the
correlation between their respective ratings on all scales.
Consequently two reproduction modes rated in a similar
way on all scales will cluster at a low level. This was
generally the case for mono and phantom mono, which
reflects their strong perceptual similarity.
2.2 Perceptual Structure Analysis
From the subject’s binary (yes/no) responses to each
triple of sounds, the simulation attempted to find the best
fitting perceptual structure. A measure of fit �Q(�) is re-
ported in Table 5 for all cases where the fitting of a struc-
ture had been attempted. It is calculated as the relative
number of response alterations necessary to resolve the
transitivity violations in Q in order to be consistent with
the structure �: �Q(�) � c/T, where c is the number of
response alterations and T the total number of triples (105
in the present case). In Table 5 the number of response
changes between the first and second sessions (I–II) and
between the second and third sessions (II–III) are also
reported. This number is an indicator of the subject’s reli-
ability; a value close to 50% would suggest that the subject
was guessing. Finally the number of transitivity violations
is an indicator of how consistently the features were iden-
tified in different contexts (different triples of sounds).
Figs. 6 and 7 show the structures obtained for two sub-
jects, with the corresponding labels (translated from Dan-
Fig. 4. Cluster analysis of RGT constructs for Sting, rated bysubject 92. Distances are derived from absolute correlations.Dashed line indicates cutoff level of 0.3, resulting in three clus-ters. Verbal descriptors are translated from Danish.
Fig. 5. Cluster analysis of reproduction modes for Sting, rated bysubject 92. Distances are derived from correlations.
Fig. 6. Lattice representation of individual perceptual structurefor Beethoven (subject 29). Verbal labels are translated fromDanish.
Table 5. Reliability and consistency of judgments collectedin PSA.*
Subject
Response Changes Transitivity
�Q(�)I–II II–III I II III
Beethoven07 32 14 96 80 98 —
29 13 5 33 70 22 0.03833 20 7 65 43 25 0.04881 33 14 63 75 50 —
Rachmaninov10 17 7 55 59 32 0.09512 22 11 67 71 55 0.08635 39 20 75 81 87 —
74 25 6 132 29 30 0.05788 17 8 49 54 41 0.086
Steely Dan04 29 17 67 98 42 0.07608 18 8 56 74 23 0.05724 33 15 78 94 74 —
32 39 18 174 113 82 —
39 34 15 91 53 48 —
Sting19 33 14 108 138 80 —
27 23 10 46 34 24 0.08649 47 27 151 123 147 —
73 25 4 80 42 37 0.08689 26 14 51 70 9 0.038
* Displayed are, for each subject, response changes from sessionto session, number of transitivity violations in three sessions, anda measure of fit between structures and data. Roman numeralsindicate session numbers.
CHOISEL AND WICKELMAIER PAPERS
J. Audio Eng. Soc., Vol. 54, No. 9, 2006 September822
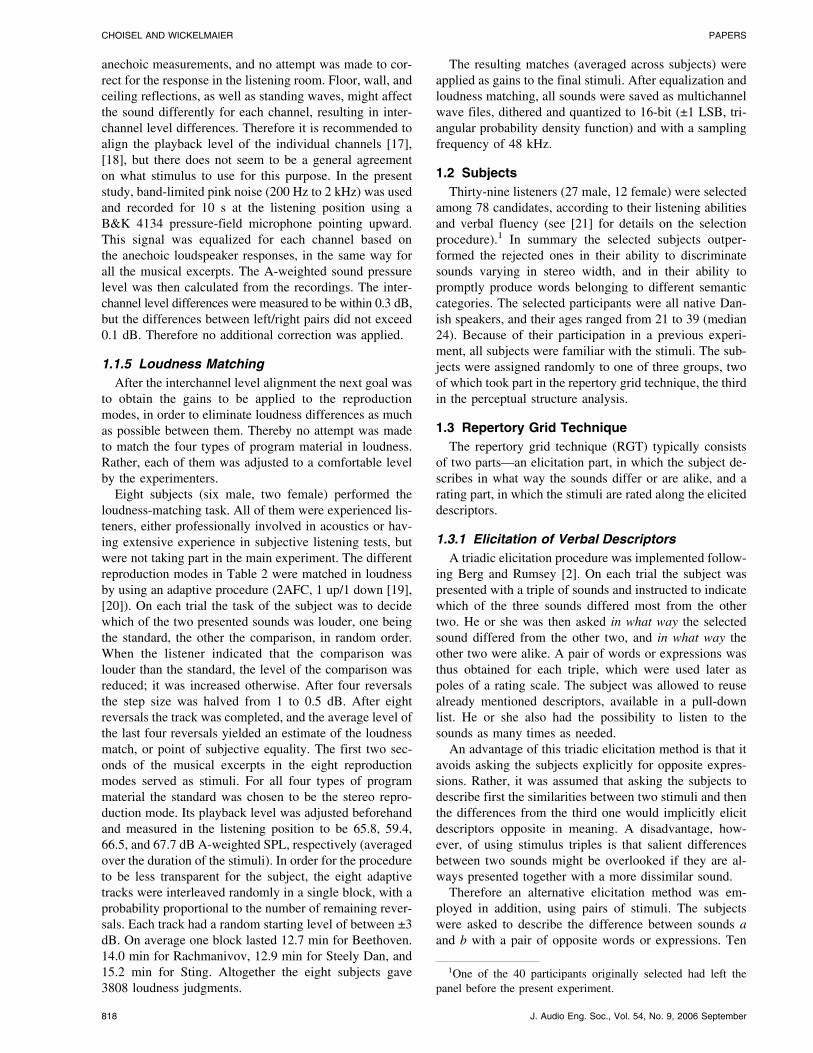
ish) obtained during the debriefing session. Each node of
the lattice represents a perceptual feature common to the
connected reproduction modes. A white node represents a
combination of two features not giving rise to a new sen-
sation. This information is obtained from the debriefing
session. In the case presented in Fig. 7, B referred to the
sensation of a nonelevated sound, C referred to the width,
and the white node deriving from B and C was labeled as
“a wide sound image as well as a sound matching the
listening position,” which was not considered to be a new
feature. From the 19 subjects assigned to this elicitation
method, 11 structures were obtained, fitting from 90 to
96% of their answers, that is, from 4 to 10 alterations
among 105 answers were necessary. The number of dis-
tinct features per structure ranged from 3 to 8.
2.3 Selection of Attributes
So far the elicitation of auditory attributes was per-
formed individually. For each of the 20 listeners assigned
to RGT, and for the 11 listeners for whom a feature-
structure representation was possible, a number of descrip-
tors was obtained. One goal of the present study, however,
was to arrive at a common list of attributes characterizing
the sensations evoked by the selected stimuli. For this
purpose the individual constructs were sorted into 20 se-
mantic categories emerging from the subjects’ descriptors:
twelve categories describing the spatial aspects of the
sounds—width (wi), envelopment (en), spaciousness (sp),
elevation (el), vertical spread (vs), distance (di), depth
(de), homogeneity (ho), focus/blur (fo), skew (sk), stabil-
ity (st), and presence (pr); four categories reflecting the
timbral aspects—brightness (br), spectral balance (sb), sharp-
ness (sh), and bass (ba); and four categories not be longing
specifically to spatial or timbral aspects—naturalness (na),
clarity (cl), loudness (lo), and miscellaneous (mi).
Each labeled feature obtained from PSA was assigned
to one of these categories, and the number of occurences
in each category was counted separately for each of the
four types of program material. For the verbal descriptors
obtained from RGT, two strategies were applied. First, the
individual descriptor pairs were assigned to one of the 20
categories. The results from the pairwise (RGT-2) and
triadic elicitation (RGT-3) were combined for this pur-
pose. The second strategy involved classifying the clusters
obtained from cluster analysis. In doing so, the redun-
dancy in the individual descriptors was reduced before the
categorization.
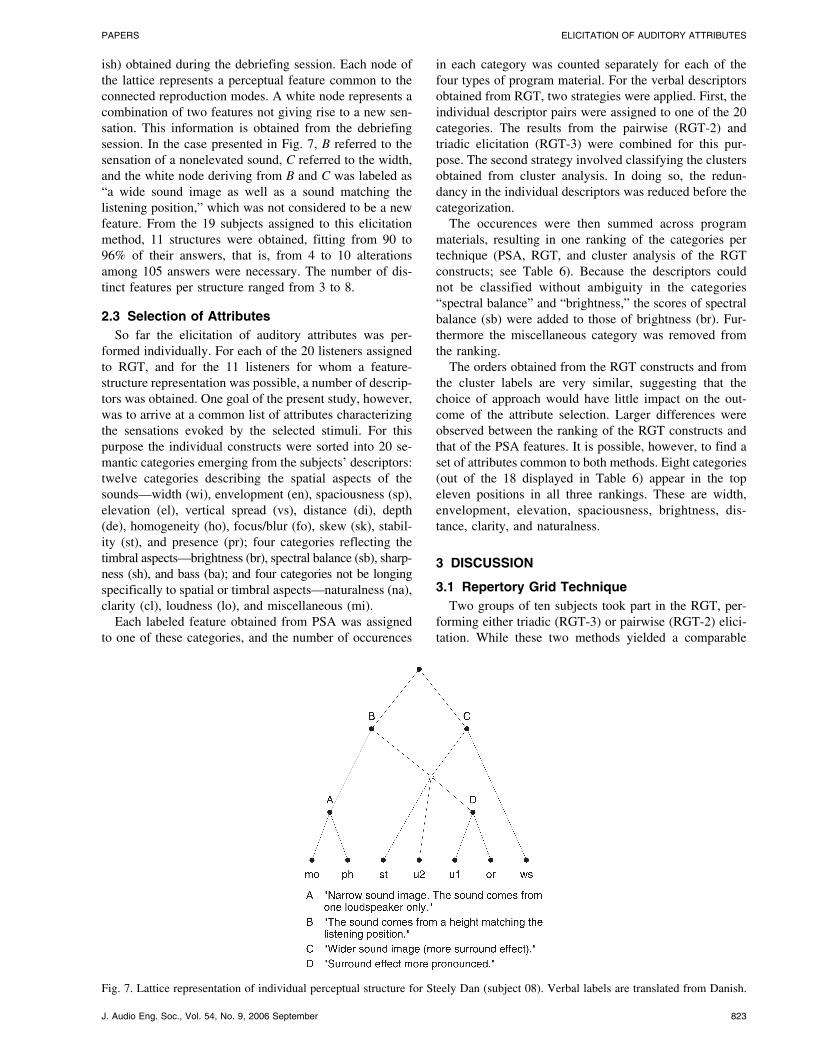
The occurences were then summed across program
materials, resulting in one ranking of the categories per
technique (PSA, RGT, and cluster analysis of the RGT
constructs; see Table 6). Because the descriptors could
not be classified without ambiguity in the categories
“spectral balance” and “brightness,” the scores of spectral
balance (sb) were added to those of brightness (br). Fur-
thermore the miscellaneous category was removed from
the ranking.
The orders obtained from the RGT constructs and from
the cluster labels are very similar, suggesting that the
choice of approach would have little impact on the out-
come of the attribute selection. Larger differences were
observed between the ranking of the RGT constructs and
that of the PSA features. It is possible, however, to find a
set of attributes common to both methods. Eight categories
(out of the 18 displayed in Table 6) appear in the top
eleven positions in all three rankings. These are width,
envelopment, elevation, spaciousness, brightness, dis-
tance, clarity, and naturalness.
3 DISCUSSION
3.1 Repertory Grid Technique
Two groups of ten subjects took part in the RGT, per-
forming either triadic (RGT-3) or pairwise (RGT-2) elici-
tation. While these two methods yielded a comparable
Fig. 7. Lattice representation of individual perceptual structure for Steely Dan (subject 08). Verbal labels are translated from Danish.
PAPERS ELICITATION OF AUDITORY ATTRIBUTES
J. Audio Eng. Soc., Vol. 54, No. 9, 2006 September 823
number of descriptors (Table 4), they differed in the dif-
ficulty of obtaining bipolar scales from the verbal descrip-
tors. Because the triadic elicitation did not require the
subjects to provide opposite words or expressions, some
rearrangement of the words by the experimenter was nec-
essary, followed by a verification by the subjects that the
two words of each pair had an opposite meaning in the
context of the sounds under study. The verbal descriptors
elicited by RGT-2, on the other hand, were easier to in-
terpret as end points of a scale. Because of the large num-
ber of descriptors obtained (up to 19 per subject), and a
certain redundancy among them, a reduction to fewer at-
tributes was performed using cluster analysis. Although
synonymous, or at least semantically related, words often
grouped together in a same cluster (that is, the stimuli were
rated in a similar fashion on the corresponding scales), this
was not always the case, and the difficult choice was left
to the experimenter to label the heterogeneous clusters. A
reason for heterogeneous clusters might be unreliable rat-
ings given by the subjects. Future work should focus on
whether including several repetitions of the ratings will
result in more homogeneous clusters.
3.2 Perceptual Structure Analysis
An indirect elicitation method was presented, which re-
quires the subjects to consistently identify features in the
sounds, without having to name them in the first place.
The strength of this method is that consistency of judg-
ments is required in order to obtain a representation of the
features. In practice, with complex stimuli such as multi-
channel reproduced sound, perfect consistency is rarely
obtained. Of the 19 subjects who underwent this proce-
dure, none gave responses without any transitivity viola-
tions. The difficulty of the task lies in the ability to identify
the features independently of the local context. This means
that the decision whether or not a feature is present in a
sound must not depend on the triple in which this sound is
presented. Some features, however, might not be per-
ceived as either present or not present, but rather as present
to a variable degree. This does not depend solely on the
continuous nature of the sensation, but also on the distri-
bution of the stimuli under study on that given sensation.
In the present study the mono and phantom mono sounds
were easily identified as narrow, whereas the other sounds
could be identified as wide. In the absence of the mono
sounds, the feature “wide” would be much harder to at-
tribute, even though the remaining sounds might still differ
in width. It must be pointed out that answers based on
local similarity in each triple are unlikely to result in a
structure representation.
In order to handle transitivity violations, a procedure
was proposed that searches for the structure(s) that best fit
the subject’s responses. Rather than attempting a brute-
force simulation of all possible response changes, the in-
formation gained from the violations themselves was used
to derive a list of features that might have underlain the
subject’s answers. For eleven of the 19 subjects a structure
representation was obtained, with a fit �Q(�) from 90 to
96%. For those eleven subjects the correlation between the
number of violations and the number of response alter-
ations was significant [r � 0.7; p � 0.016]. From this
correlation it is reasonable to assume that the fit would
have been poorer for the other eight subjects for which no
simulation was attempted because of the high number of
violations. In the absence of a statistical test to accept or
reject the structure representation of the subject’s re-
sponses in case of violations, �Q(�) might serve as a cri-
terion to assess the validity of the structure. Future meth-
odological developments might consider the adaptation of
a probabilistic framework, where response changes and
Table 6. Number of occurrences (Frequency) of PSA features, individual RGTconstructs, and RGT clusters in semantic categories.*
PSA RGT Clusters
Category Frequency Category Frequency Category Frequency
wi 13 wi 60 wi 44en 12 br 57 sp 37el 6 sp 55 br 36ba 5 el 34 el 27br 4 di 25 di 19di 4 sh 23 sh 15sp 4 en 20 cl 11cl 2 na 16 na 11de 2 cl 15 pr 9vs 2 sk 14 sk 9na 1 pr 11 en 8ho 1 de 10 de 7fo — lo 7 lo 4lo — ba 6 ba 2pr — fo 4 fo 2sh — vs 4 ho 2sk — ho 3 vs 2st — st 1 st —
* Categories are explained in text. The eight selected attributes—those having thehighest positions in all three rankings—are indicated in boldface.
CHOISEL AND WICKELMAIER PAPERS
J. Audio Eng. Soc., Vol. 54, No. 9, 2006 September824
inconsistencies could be used to estimate the probability of
making an error when identifying a feature.
Finally it was generally observed during the debriefing
session that the subjects for which no structure was ob-
tained had difficulties producing a list of the features on
which they based their answers. This suggests that they did
not establish a clear set of features before—or even dur-
ing—the triadic-comparison task. This, however, seems to
be a requirement in order to respond consistently, and for
that purpose, the experiment was preceded by a tutorial
with drawings and a familiarization session in which the
participants were explicitly asked to identify features of
the sounds arranged in a play list. One way of increasing
the consistency of the judgments would presumably be to
conduct a more controlled familiarization or, alternatively,
to extend the data collection by including additional ses-
sions until response changes no longer occur. Future ex-
periments should clarify how such an increased exposure
to the sounds affects the judgments. Other possible appli-
cations of PSA are training and assessment of listening
panels. Ideally expert listeners—such as those employed
in descriptive analysis—have a clear idea of what to listen
for beforehand, and PSA can prove very useful in assess-
ing similarities and differences between individual percep-
tual structures.
3.3 Concluding Remarks
In search of a method to elicit auditory attributes in the
context of multichannel reproduced sound, two fundamen-
tally different approaches were investigated. The repertory
grid technique proved a useful technique to elicit verbal
descriptors. However, that these descriptors correspond to
salient attributes that the subjects are able to consistently
identify, can only be assumed. Perceptual structure analy-
sis, on the other hand, verifies the consistency with which
a subject can identify attributes in the sounds. In addition
it makes it possible to uncover auditory features indepen-
dently of the availability of a verbal label in the subject’s
lexicon. While RGT generally resulted in a higher number
of constructs than PSA, the number of clusters obtained
from cluster analysis was comparable to the number of
PSA features. Finally, because of the low number of struc-
tures derived in PSA per program material, a conclusive
comparison of the attributes obtained by the two elicitation
methods cannot be drawn. It was possible, however, to
derive a common set of eight attributes based on both
methods.
4 ACKNOWLEDGMENT
This research was carried out as part of the “Center-
kontrakt on Sound Quality,” which establishes participa-
tion in and funding of the Sound Quality Research Unit
(SQRU) at Aalborg University. The participating com-
panies are Bang & Olufsen, Bruel & Kjær, and Delta
Acoustics & Vibration. Further financial support came
from the Ministry for Science, Technology, and Develop-
ment (VTU) and from the Danish Research Council for
Technology and Production (FTP). The authors would
like to thank Wolfgang Ellermeier for helpful comments
on an earlier version of the manuscript, and Jody Ghani
for helping improve the English style. Furthermore, we
are grateful to the two anonymous reviewers for their
comments.
5 REFERENCES
[1] S. Bech, “Methods for Subjective Evaluation of Spa-
tial Characteristics of Sound,” in Proc. 16th AES Int. Conf.
on Spatial Sound Reproduction (1999), pp. 487–504.
[2] J. Berg and F. Rumsey, “Identification of Quality
Attributes of Spatial Audio by Repertory Grid Technique,”
J. Audio Eng. Soc., vol. 54, pp. 365–379 (2006 May).
[3] C. Guastavino and B. F. G. Katz, “Perceptual Evalu-
ation of Multi-Dimensional Spatial Audio Reproduction,”
J. Acoust. Soc. Am., vol. 116, pp. 1105–1115 (2004).
[4] K. Koivuniemi and N. Zacharov, “Unravelling the
Perception of Spatial Sound Reproduction: Language De-
velopment, Verbal Protocol Analysis, and Listener Train-
ing,” presented at the 111th Convention of the Audio En-
gineering Society, J. Audio Eng. Soc. (Abstracts), vol. 49,
p. 1217 (2001 Dec.), convention paper 5424.
[5] R. Mason, N. Ford, F. Rumsey, and B. De Bruyn,
“Verbal and Nonverbal Elicitation Techniques in the Sub-
jective Assessment of Spatial Sound Reproduction,” J. Au-
dio Eng. Soc. (Engineering Reports), vol. 49, pp. 366–384
(2001 May).
[6] F. Rumsey, “Spatial Quality Evaluation for Repro-
duced Sound: Terminology, Meaning, and a Scene-Based
Paradigm,” J. Audio Eng. Soc., vol. 50, pp. 651–666 (2002
Sept.).
[7] H. Stone and J. L. Sidel, Sensory Evaluation Prac-
tices (Academic Press, London, 1993).
[8] G. Kelly, The Psychology of Personal Constructs
(Norton, New York, 1955).
[9] I. Borg and P. Groenen, Modern Multidimensional
Scaling: Theory and Applications (Springer, Berlin, 1997).
[10] W. L. Martens and C. N. W. Giragama, “Relating
Multilingual Semantic Scales to a Common Timbre
Space,” presented at the 113th Convention of the Audio
Engineering Society, J. Audio Eng. Soc. (Abstracts), vol.
50, p. 974 (2002 Nov.), convention paper 5705.
[11] J. Heller, “Representation and Assessment of Indi-
vidual Semantic Knowledge,” Meth. Psychol. Res., vol. 5,
pp. 1–37 (2000).
[12] J. P. Doignon and J. C. Falmagne, Knowledge
Spaces (Springer, Berlin, 1999).
[13] B. Ganter and R. Wille, Formal Concept Analysis:
Mathematical Foundations (Springer, Berlin, 1999).
[14] F. Wickelmaier and W. Ellermeier, “Deriving Au-
ditory Features from Triadic Comparisons,” Percept. Psy-
chophys., to be published.
[15] ITU-R Rec. BS.775-1, “Multichannel Stereophonic
Sound System with and without Accompanying Picture,”
International Telecommunications Union, Geneva, Swit-
zerland (1994).
[16] ITU-R Rec. BS.1116, “Methods for the Subjective
Assessment of Small Impairments in Audio Systems In-
PAPERS ELICITATION OF AUDITORY ATTRIBUTES
J. Audio Eng. Soc., Vol. 54, No. 9, 2006 September 825
cluding Multichannel Sound Systems,” International Tele-
communications Union, Geneva, Switzerland (1997).
[17] AES TD1001.1.01-10, “Multichannel Surround
Sound Systems and Operations,” AES Technical Council,
New York (2001).
[18] P. Suokuisma, N. Zacharov, and S. Bech, “Multi-
channel Level Alignment, Part I: Signals and Methods,”
presented at the 105th Convention of the Audio Engineer-
ing Society, J. Audio Eng. Soc. (Abstracts), vol. 46, p.
1042 (1998 Nov.), preprint 4815.
[19] H. Levitt, “Transformed Up–Down Methods in
Psychoacoustics,” J. Acoust. Soc. Am., vol. 49, pp.
467–477 (1971).
[20] W. Jesteadt, “An Adaptive Procedure for Subjec-
tive Judgments,” Percept. Psychophys., vol. 28, pp. 85–88
(1980).
[21] F. Wickelmaier and S. Choisel, “Selecting Partici-
pants for Listening Tests of Multichannel Reproduced
Sound,” presented at the 118th Convention of the Audio
Engineering Society, J. Audio Eng. Soc. (Abstracts), vol.
53, p. 703 (2005 July/Aug.), convention paper 6483.
[22] J. Berg, “How Do We Determine the Attribute
Scales and Questions that We Should Ask of Subjects
when Evaluating Spatial Audio Quality?” presented at the
Workshop on Spatial Audio and Sensory Evaluation Tech-
niques, Guilford, UK, 2006 April 6–7.
THE AUTHORS
S. Choisel F. Wickelmaier
Sylvain Choisel received an M.Sc. degree in acous-tics from Aalborg University, Denmark, in 2001, anda degree in electrical engineering with a major insignal processing and telecommunications from ESIEE,Paris.
He has worked on several projects in the field of signalprocessing, psychoacoustics, and computer simulation(BEM). Since 2002 February he has been working withBang & Olufsen in the Sound Quality Research Unit atAalborg University, from which he received a Ph.D. de-gree in 2005. His main research interest is perception ofreproduced sound.
Dr. Choisel is a member of the Audio EngineeringSociety.
Florian Wickelmaier studied experimental psychologyand statistics at the University of Regensburg, Germany,from which he received a master’s degree in psychologyin 2002. Later he joined the Sound Quality Research Unit(SQRU), headed by Wolfgang Ellermeier, at Aalborg Uni-versity, Denmark, and became a Ph.D. student under hissupervision. He was awarded a Ph.D. degree for his thesison “Indirect Scaling Methods Applied to the Identificationand Quantification of Auditory Attributes” in 2005.
Subsequently, Dr. Wickelmaier worked as an assistantprofessor in the Department of Acoustics, Aalborg Uni-versity, Denmark. Since 2006 April he has been employedas a statistician in the Department of Psychiatry, Univer-sity of Munich LMU, Germany.
CHOISEL AND WICKELMAIER PAPERS
J. Audio Eng. Soc., Vol. 54, No. 9, 2006 September826


