External assessment
Multiple choice question book
General MathematicsPaper 1
General instruction• Work in this book will not be marked.

1 of 9
Section 1
QUESTION 1Four linear models have been developed for a data set. Identify the residual plot that indicates that the developed linear model is justified.
(A) (B)
(C) (D)

2 of 9
QUESTION 2The standard Australian time zones are shown on the map.
GMT +9.5GMT +8
WA
NT QLD
SA
NSW
VIC
TAS
GMT +10
All states and territories, except Western Australia (WA), Queensland (QLD) and the Northern Territory (NT), have daylight saving in summer. Daylight saving time is 1 hour ahead of standard time.
When it is 10:00 am daylight saving time in New South Wales (NSW), it is
(A) 9:30 am in South Australia (SA) and 9:00 am in QLD.
(B) 9:30 am in SA and 11:00 am in QLD.
(C) 10:30 am in SA and 9:00 am in QLD.
(D) 10:30 am in SA and 11:00 am in QLD.
QUESTION 3For the sequence 4, 2, 0, –2, –4 … the common difference is
(A) 4
(B) 2
(C) –2
(D) –4
3 of 9
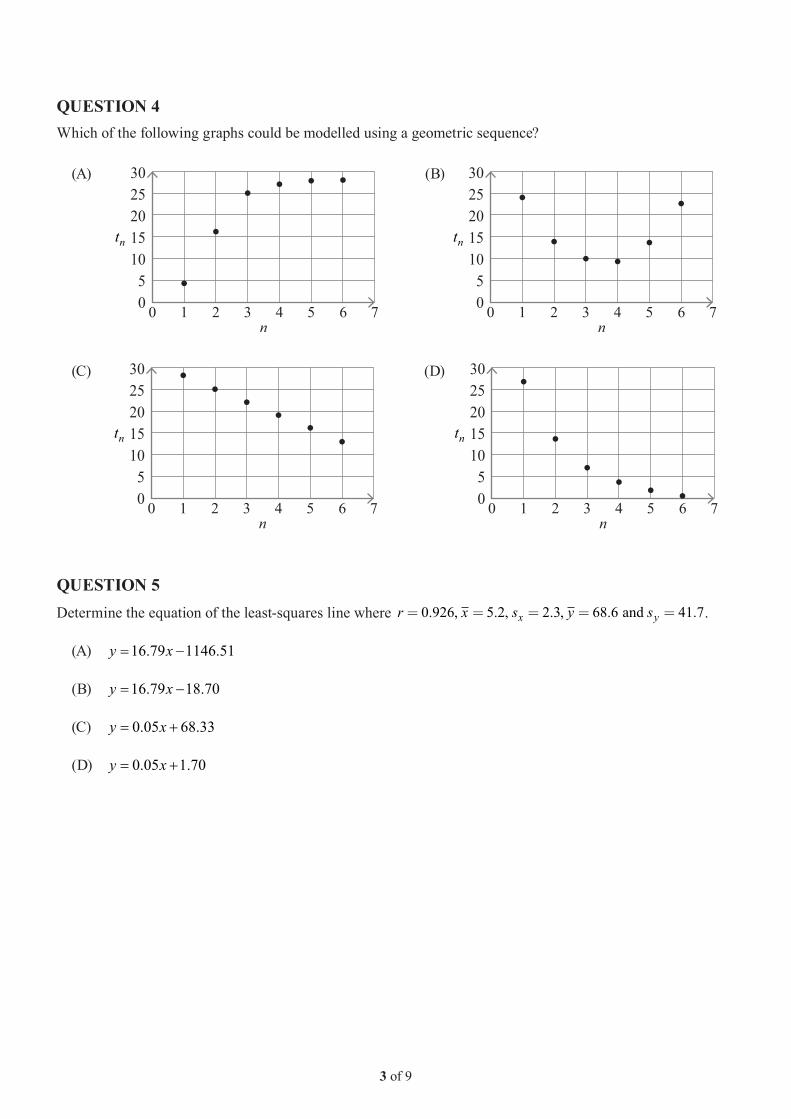
QUESTION 4Which of the following graphs could be modelled using a geometric sequence?
(A) 302520151050 0 1 2 3 4 5 6 7
n
nt
(B) 302520151050 0 1 2 3 4 5 6 7
n
nt
(C) 302520151050 0 1 2 3 4 5 6 7
n
nt
(D) 302520151050 0 1 2 3 4 5 6 7
n
nt
QUESTION 5Determine the equation of the least-squares line where r x s y sx y= = = = =0 926 5 2 2 3 68 6 41 7. . . . ., , , and .
(A) y x� �16 79 1146 51. .
(B) y x� �16 79 18 70. .
(C) y x� �0 05 68 33. .
(D) y x� �0 05 1 70. .

4 of 9
QUESTION 6A loan of $10 000 has interest charged on a reducing balance at 6% p.a. compounding quarterly with quarterly repayments of $700. The balance after 6 months is
(A) $8696.75
(B) $8891.75
(C) $8900.00
(D) $9794.00
QUESTION 7What is the length of the minimum spanning tree for this network? All distances are in kilometres (km).
Q
R
S
P
5
45
5
3
(A) 22 km
(B) 14 km
(C) 12 km
(D) 3 km

5 of 9
QUESTION 8The following scatterplot shows a linear association between two numerical variables.
0
5
10
15
20
y
x
25
30
0 2 4 6 8 10 12
Choose the best description for the direction and strength of the association.
(A) strong positive
(B) strong negative
(C) weak positive
(D) weak negative
QUESTION 9It is observed that as the number of ice blocks sold each month increases, the number of fans sold also increases. Which of these statements is therefore true?
(A) There is a negative causation between the number of ice blocks sold and the number of fans sold each month.
(B) There is a positive causation between the number of ice blocks sold and the number of fans sold each month.
(C) There is a negative association between the number of ice blocks sold and the number of fans sold each month.
(D) There is a positive association between the number of ice blocks sold and the number of fans sold each month.
6 of 9
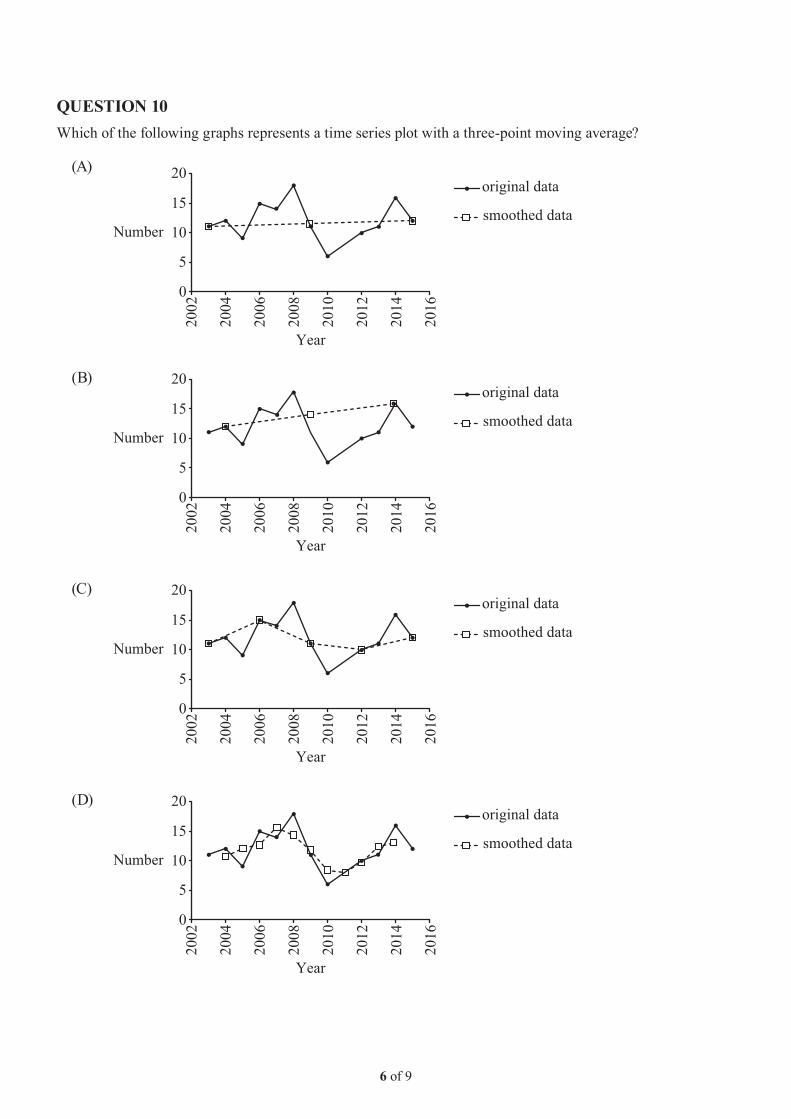
QUESTION 10Which of the following graphs represents a time series plot with a three-point moving average?
(A)
0
5
10
15
20
Year
Number
2002
2004
2006
2008
2010
2012
2014
2016
original data
smoothed data
(B)
0
5
10
15
20
Year
Number
2002
2004
2006
2008
2010
2012
2014
2016
original data
smoothed data
(C)
0
5
10
15
20
Year
Number
2002
2004
2006
2008
2010
2012
2014
2016
original data
smoothed data
(D)
0
5
10
15
20
Year
Number
2002
2004
2006
2008
2010
2012
2014
2016
original data
smoothed data

7 of 9
QUESTION 11Determine the adjacency matrix that represents this graph.
T
R
SQ
(A)Q 0 1 1
1 0 11 1 0
Q R S
RS
(B)Q 0 1 1 0
1 0 1 01 1 0 00 0 0 0
Q R S T
RST
(C)Q 0 1 1 0
1 0 1 01 1 0 10 0 1 0
Q R S T
RST
(D)Q 0 2 2 0
2 0 2 02 2 0 00 0 0 0
Q R S T
RST
QUESTION 12The activity times in the project network shown are in days.
Start
Finish
A, 6
E, 5 G, 5
B, 5
C, 4
D, 3
F, 30 0 6 6
11 11
14 14
17 1710 12 22 22
10 12E, 5
Key (for activity E)
Time to complete
Latest start time
Earliest start time
The greatest float time for a non-critical activity in this network is
(A) 2 days.
(B) 4 days.
(C) 5 days.
(D) 12 days.

8 of 9
QUESTION 13Which of the following is a planar graph with 5 vertices and 4 faces?
(A) (B)
(C) (D)
QUESTION 14A sample of university staff and students was asked whether they preferred catching public transport or driving their own car to university. The data collected is shown in the table.
Public transport Drive own car
Staff 2 18
Students 48 12
What percentage of university students prefer to drive their own car?
(A) 12%
(B) 15%
(C) 20%
(D) 40%

9 of 9
QUESTION 15The graph shows the value of three different annuities over time.
00
500
1000
1500
2000
2500
3000
Number of terms
Val
ue o
f inv
estm
ent (
$)
1 2 3 4 5 6 7 8
Annuity 1Annuity 1
Annuity 2Annuity 2
Annuity 3Annuity 3
Which of the following statements gives a plausible explanation for the different values after seven terms?
(A) Annuity 1 and Annuity 2 have higher regular deposits than Annuity 3.
(B) Annuity 1 and Annuity 2 have shorter interest terms than Annuity 3.
(C) Annuity 2 and Annuity 3 have a lower initial value than Annuity 1.
(D) Annuity 2 and Annuity 3 have higher interest rates than Annuity 1.

THIS PAGE IS INTENTIONALLY BLANK THIS PAGE IS INTENTIONALLY BLANK

AttributionQuestion 2
(c) State of Queensland (QCAA) 2021, CC BY-SA 4.0
Adapted from Australia-Timezones-Standard by Haywire~commonswiki at https://commons.wikimedia.org/wiki/File:Australia-Timezones-Standard.png#/media/File:Australia-Timezones-Standard.png CC BY-SA 3.0 Unported
© State of Queensland (QCAA) 2020Licence: https://creativecommons.org/licenses/by/4.0 | Copyright notice: www.qcaa.qld.edu.au/copyright — lists the full terms and conditions, which specify certain exceptions to the licence. |Third-party materials referenced above are excluded from this licence.| Attribution: © State of Queensland (QCAA) 2020


