ICCAE Military Technical College 7th International Conference, Kobry Elkobbah, On Civil & Architecture Cairo, Egypt Engineering
Extensive review for urban climatology: definitions, aspects and scales. Mohamad Fahmy
School of Architecture, University of Sheffield, Sheffield, UK
and Department of Architecture, Military Technical Collage, Cairo, Egypt
Steve Sharples Head of the Environmental research group, School of architecture, University of Sheffield, Sheffield, UK
Abdul-Wahab Al-Kady Department of Architecture, Military Technical Collage, Cairo, Egypt
Abstract;
There are many energy budget models and classifications of urban climate layers,
field measurements, simulations and researches in the field of urban climatology that
concerns about the mutual impact of climate and urban form, (Landsberg, 1973), (Oke,
1984), (Mayer and Hoppe, 1987), (Golany, 1996), (Schiller and Evans, 1996), (Eliasson,
2000), (Arnfield, 2003) and (Oke, 2006). Although there is a magnificent progress in the
field, but some few promising world wide projects (Oke, 2006), and some design studies
and methodologies (Bitan, 1988), (Pearlmutter et al., 1999) and (Ali-Toudert and Mayer,
2007), the application for that knowledge still away from the urban form sensitive design,
because they have been done from the physical, mathematical and meteorological points
of view but haven't been investigated till now from the applied urban planning and design
point of view specially at local scale of a neighborhood climate. The need is for all
parties of the urban field as in real process, the scientific circle won't be closed without
the architects, urban designers, planners, Econo-sociologists and psychologists'
participation in the model. However this extensive paper is prepared to introduce this
large field of knowledge about how to design urban fabric and patterns in accordance to
climate aspects and its scales of application along with definitions concerning human
thermal comfort in the field.
Introduction: Briefing for literature and research approaches;
Yet it is complex relations to investigate that of the climatology, meteorology,
built form, with the microclimate scale of urban planning patterns, consequently how can
we imagine solving that complexity of a local climatology scale to assess urban thermal
comfort which has been illustrated to be certainly unachievable 100% from any single
mean point of view without broadening the scope of research due to urban mobility of
climate conditions. It is not only from physiology calculation of heat balance, not only
from human thermal regulatory with metabolism and clothing adjustments, not only with
the behavioral adjustments, not only by physical environmental adjustments and passive
sensitive design, but with all of these techniques, methodologies, sequences and
applications that have to apply specific interdisciplinary geometrized tools of Pysio-
Psychological thermal comfort adaptation to form a fabric.
Such a definition of model defines at the same time the objective of the great
work in urban climatology-meteorology fields, from the microclimate scale to mesoscale.
Proceedings of the 7th ICCAE Conf. 27 -29 May, 2008
550
The need is for a model utilized tools to translate all of this knowledge to the realm, an
ordinance to regulate the fabric form that is capable of controlling the canopy layer
climate by delivering opportunities for people to obtain their own thermal comfort and
indices, the need is for an urban planning and design model.
Although a lot of researches studied before about the built and the natural
environment, the fact that environmental control means all of environmental criteria,
planning and design, thermal comfort design still an important branch of the total
environmental design and planning.
1- Urban thermal performance:
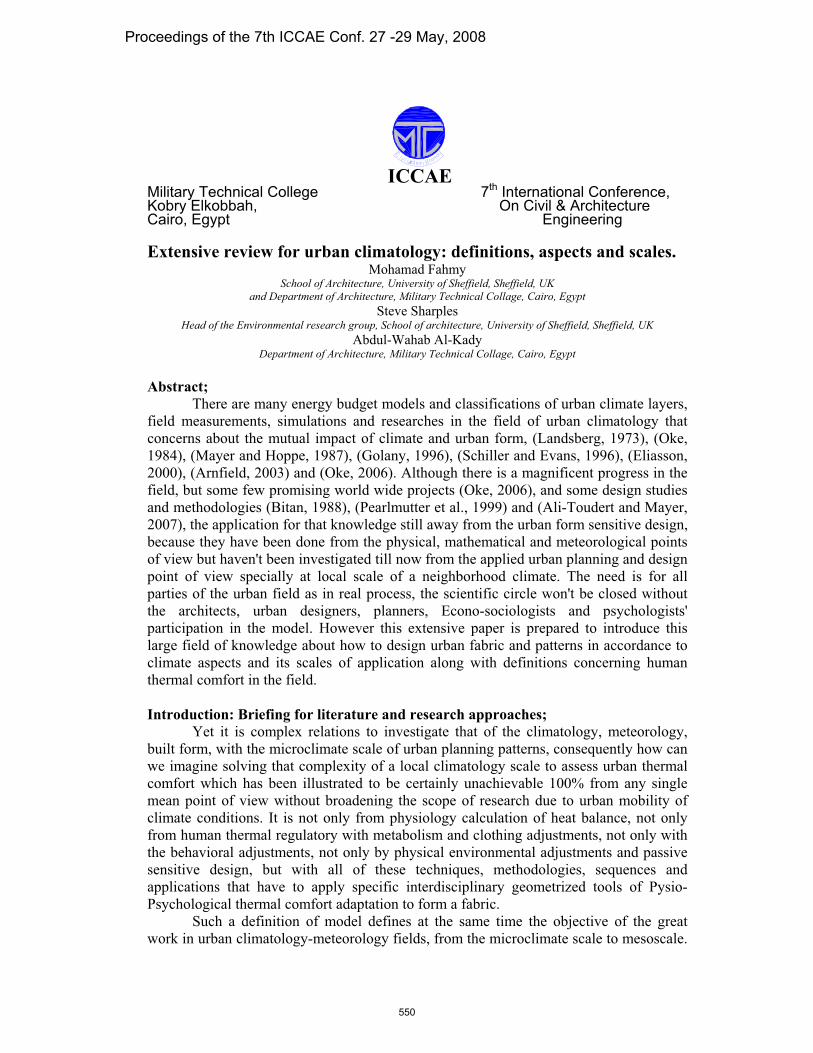
The urban structure (built form + pattern) interacts with its climatic circumstances
in a behavior due to outdoor heat transfer and heat exchange in between urban canyons
and its interior elements. And the urban form is acting like the building acts in such an
action we can call it breathing, it has incident sun rays then heat absorbed or reflected,
the absorbed amount of heat has another amount to be emitted after certain time in which
the air flow temperature come down, this is the physical thermal motion which can be
called the breathing of the urban canyon, figure (1) illustrates the motion of heat. The
compliance of this physical behavior of built fabric is the thermal interactions of human
and vegetation.
S o la r h e a t g a inT r a n s m is s io n o f a c tu a l
M a te r ia l
R e f le c t io n
E m is s io n
S o la r r a d ia t io n
( I n s ta n ta n e u o s S o la r g a in )
Figure (1): The heat transfer routes through materials, (Fahmy, 2001)
2- Review for thermal comfort evaluation indices:
There are many evaluation indices for the thermal state of interior or exterior
places for human comfort as it is a need to know the place where in door or outdoor
design is far from perfection. Some of those indices are optimum to be used indoor and
others to be used outdoor (Givoni, 1998) , they are more than 100 thermal comfort
indices, (Jendritzky et al., 2002) , some of them are just indices of relations between
meteorology parameters such as air temperature plus wind speed in cold climates or air
temperature plus humidity in hot climates but are criticized as the bioclimatic chart for
Olgyay that has some differences for the limits of comfort zone if applied outdoor and
can’t be used correctly at all of the climatic regions because Olgyay experienced his field
measurements at indoor circumstances in a humid region. Other indices are considering a
total thermo physiological heat exchange and balance models to be indexed. Those later
can be divided into two parts; first is so called steady state heat budget models that have
been introduced for indoor purposes (Hoppe, 2002) but doesn't consider for example air
speed in model calculation and revealed in non-compatible field measurements indices
like PMV (Brager and De Dear, 1998) and (Humphreys ad Nicol, 2002) . Second type
that are models for passive indoor or outdoor circumstances evaluation and considering
Proceedings of the 7th ICCAE Conf. 27 -29 May, 2008
551

part of or the total budget [all net fluxes and exchange within fabric starting from (Nunez
and Oke, 1977), human heat exchange (Pearlmutter, 1999), vegetation heat exchange
(Kum, Bretz, Huang and Akbari, 1994), urban anthropogenic heat gain (Taha, 1997)] of
an urban space represented in a symmetric or an asymmetric urban street canyon field
measurements, simulations or metreological referencing to indoor comfort conditions
with some transient conditions such as OUT_SET, PET, introducing air speed of 0.1 m/s
or similar (Mayer and Hoppe, 1987), that is called numerical models as modifications to
the PMV heat balance model and index rather than a canyon total heat budget model
calculation such as ENVI-met (Bruse and Fleer, 1998)1 and (Bruse, 2008) that is capable
of calculating all heat transfer interactions, wind flow turbulences of the built
environment and human heat exchanges in terms of the mean radiant temperature despite
its dependence on the modified PMV index of climate evaluation (Jendritzky and Nubler,
1981) and despite some overestimations because of un-calculating soil heat storage (Ali-
Toudert, 2005) that make this model also less estimating the nocturnal cooling or earth
long wave radiation. Fortunately, an urban comfort index should be redefined as thermal
comfort model itself has to be redefined (Nikolopoulou and Lykoudis, 2006) in terms of a
design model that combines approaches, tools, techniques and applications of urban
fabric design parties, specializations and design details. A briefing for most known
thermal comfort indices is tabulated as following:
Table (1): Briefing for some of thermal comfort indices:
a- Meteorology parameters indices:
Index name Brief
1 Bioclimatic chart A graphical tool for plotting meteorology and assigning comfort
zones for different regions in terms of and RH (Olgyay and
Olgyay, 1957) and (Olgyay, 1967), figure (2).
aT
Mahoney
bioclimatic tables
They are for recording and recommendation as following: (1) The
max, min, and mean air temperature for each month. (2) The max,
min, and mean figures for each month RH, Rainfall, and Wind and
the conditions for each month classified into a humidity group. (3)
Comparison of Comfort Conditions and Climate. The desired
max/min temperatures are entered, and compared to the climatic
values from table 1. A note is made if the conditions create heat
stress or cold stress. (4) Indicators (of humid or arid conditions).
Rules are provided for combining the stress (table 3) and humidity
groups (table 2) to check a box classifying the humidity and aridity
for each month. For each of six possible indicators, the number of
months where that indicator was checked is added up, giving a yearly
total. (5) Schematic Design Recommendations. The yearly totals in
table 4 correspond to rows in this table, listing schematic design
recommendations, e.g. 'buildings oriented on east-west axis to reduce
sun exposure', 'medium sized openings, 20%-40% of wall area'. (6)
Design Development Recommendations. Again the yearly totals
from table 4 are used to read off recommendations, e.g. 'roofs should
be high-mass and well insulated', (Koenigsberger, et al., 1970).
2 Effective
Temperature (ET)
It is presented in Monograms and represents the instantaneous
thermal sensation estimated experimentally as a combination of ,
RH and v, ASHRAE (Ashrae-55, 1981).
aT
3 Psychrometric chart A graphical tool for plotting meteorology and assigning comfort
zones for different regions in terms of DBT, WBT, RH, VP,…etc
(Givoni, 1969).
4 Comfort triangle A graphical tool for evaluating temperature variations, (Evans, 2003)
Proceedings of the 7th ICCAE Conf. 27 -29 May, 2008
552

and (Evans, 2007), figure (3).
5 wind shell index,
(WCI)Combining and V for outdoor cold conditions, (Siple and Passel,
1945), (Osczevski and Bluestein, 2005) and (Shitzer, 2007), figure
(4).
aT
b- heat balance indices:
1- steady state indices:
Index name Brief
Fanger equation,
(PMV)
PMV expresses the variance of comfort on a scale from -3 to +3 for
an indoor balanced human heat budget, (Fanger, 1972).
2- transient state PMV based heat balance indices:
a
Index of thermal
sensation ITS and
TS, the thermal
sensation index
It considers the heat exchanges, metabolism and clothes, where it
wasn't Originally considering the radiation exchanges assuming that
within the range of conditions where it is possible to maintain
thermal equilibrium, sweat is secreted at sufficient rate to achieve
evaporative cooling, later the TS proposed a modified Thermal
Sensation Index for outdoors, (Givoni, 1963), (Givoni, 1969) and
(Givoni et al., 2003).
b
Perceived
temperature (PT),
The new effective
temperature (ET*),
The Standard
Effective
Temperature
(SET*),
The Outdoor
Standard Effective
Temperature
(OUT_SET*),
Physiologically
Equivalent
Temperature (PET).
The thermo-physiological assessment is made for a standard male
whom has varying clothing and activity or work within a
standardized environment and depending on the base of PMV,
based on a complete heat budget model describing the physiological
processes that provide reference environment in which heat fluxes
would be the same as in the actual environment. Mean radiation
temperature is equal to air temperature and calm with varying wind
speed from 0.1 m/s of the PET to 0.15 of the ET*, SET* and
OUT_SET*, 50% RH with a temperature of 20 °C. PT and PET are
closely correlated with r = 0,995, (Jendritzky and Nubler, 1981),
(Gagge et al., 1986), (Mayer and Hoppe, 1987), (Hoppe, 1999), (Ali-
Toudert, 2005) and (Monteiro and Alucci, 2006). The Universal
Thermal Climate Index UTCI is an ongoing project considering the
UBIKLIM model based on a Physiologically Significant Terms to
achieve urban thermal comfort, (Jendritzky et al., 2002) and (Hoppe,
2002).
Figure (2): The bioclimatic
chart, (Olgyay, 1967).
Proceedings of the 7th ICCAE Conf. 27 -29 May, 2008
553
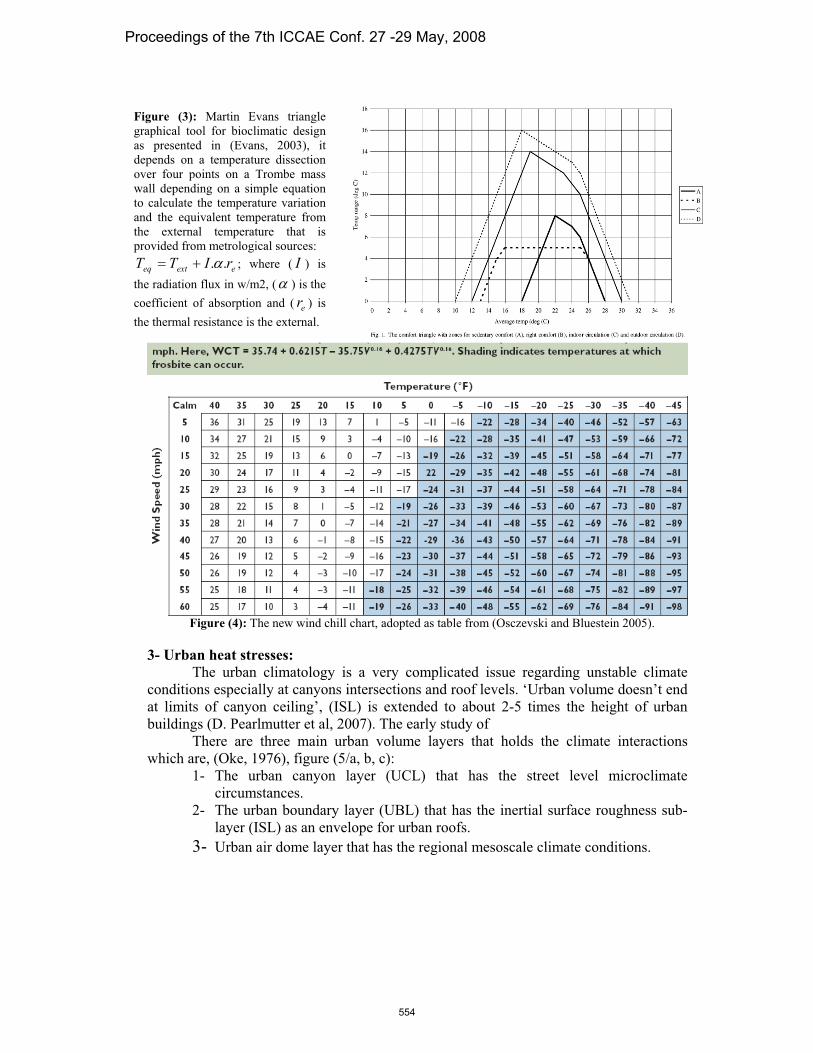
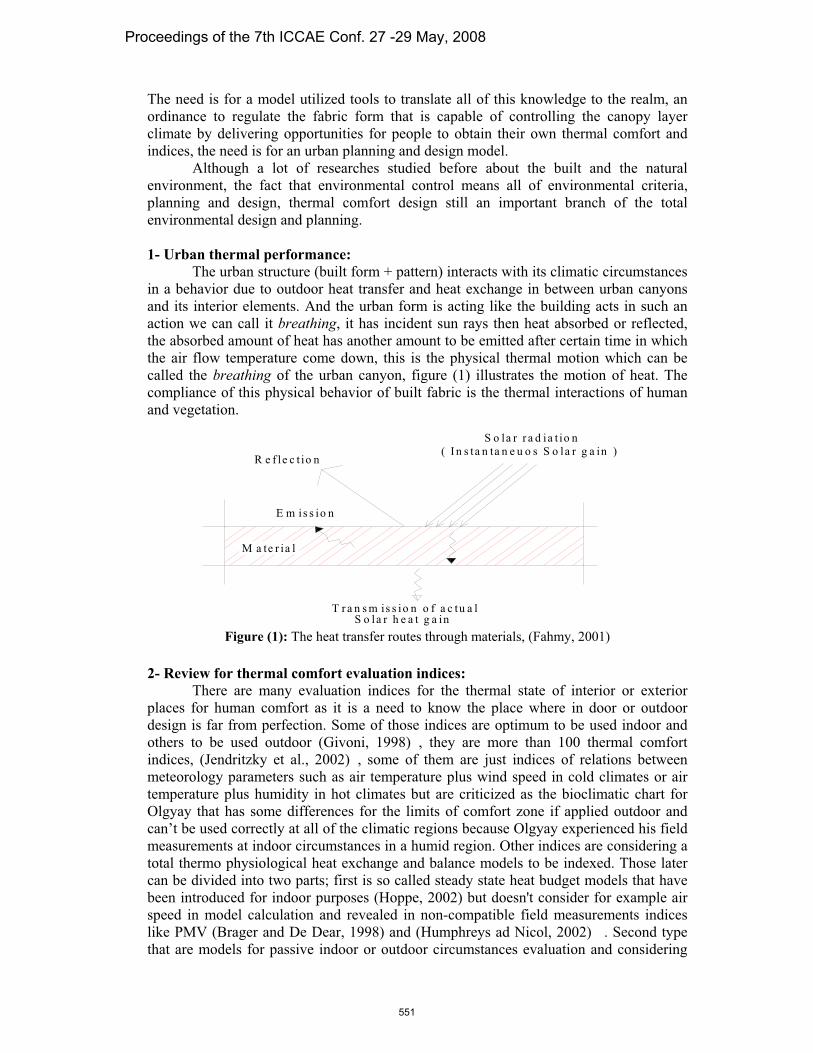
Figure (3): Martin Evans triangle
graphical tool for bioclimatic design
as presented in (Evans, 2003), it
depends on a temperature dissection
over four points on a Trombe mass
wall depending on a simple equation
to calculate the temperature variation
and the equivalent temperature from
the external temperature that is
provided from metrological sources:
Ieexteq rITT .. ; where ( ) is
the radiation flux in w/m2, ( ) is the
coefficient of absorption and ( ) is
the thermal resistance is the external.
er
Figure (4): The new wind chill chart, adopted as table from (Osczevski and Bluestein 2005).
3- Urban heat stresses:
The urban climatology is a very complicated issue regarding unstable climate
conditions especially at canyons intersections and roof levels. ‘Urban volume doesn’t end
at limits of canyon ceiling’, (ISL) is extended to about 2-5 times the height of urban
buildings (D. Pearlmutter et al, 2007). The early study of
There are three main urban volume layers that holds the climate interactions
which are, (Oke, 1976), figure (5/a, b, c):
1- The urban canyon layer (UCL) that has the street level microclimate
circumstances.
2- The urban boundary layer (UBL) that has the inertial surface roughness sub-
layer (ISL) as an envelope for urban roofs.
3- Urban air dome layer that has the regional mesoscale climate conditions.
Proceedings of the 7th ICCAE Conf. 27 -29 May, 2008
554
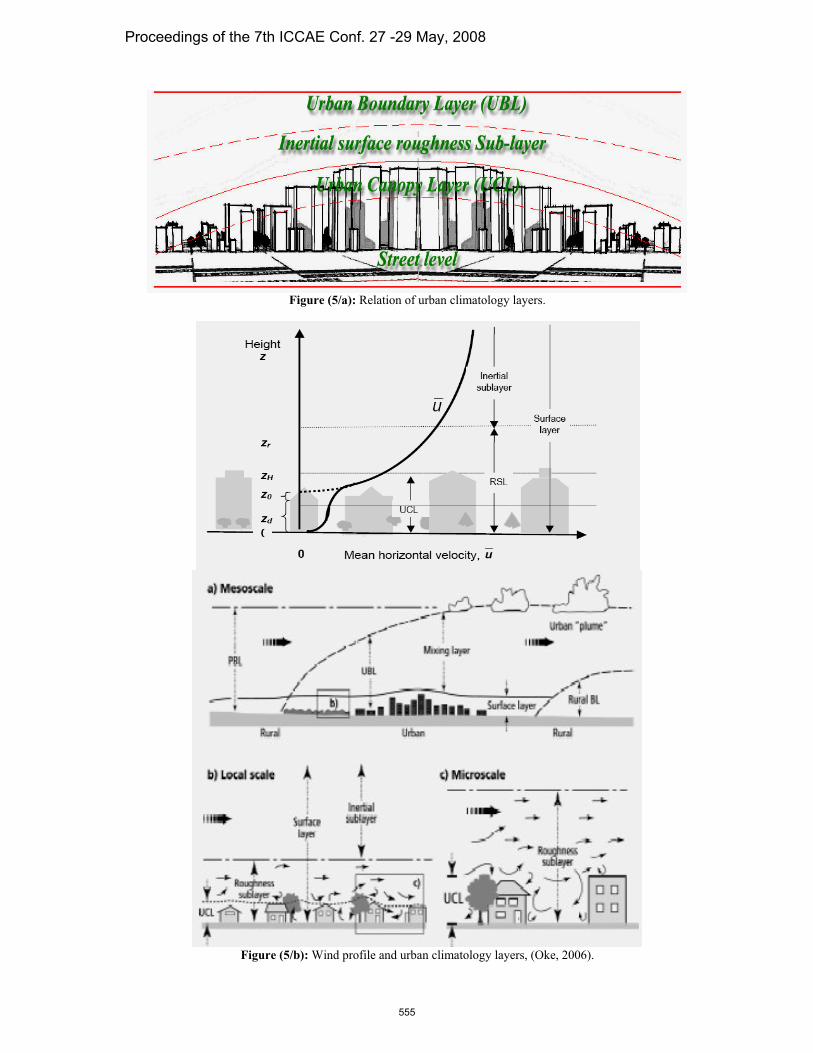
Figure (5/a): Relation of urban climatology layers.
Figure (5/b): Wind profile and urban climatology layers, (Oke, 2006).
Proceedings of the 7th ICCAE Conf. 27 -29 May, 2008
555
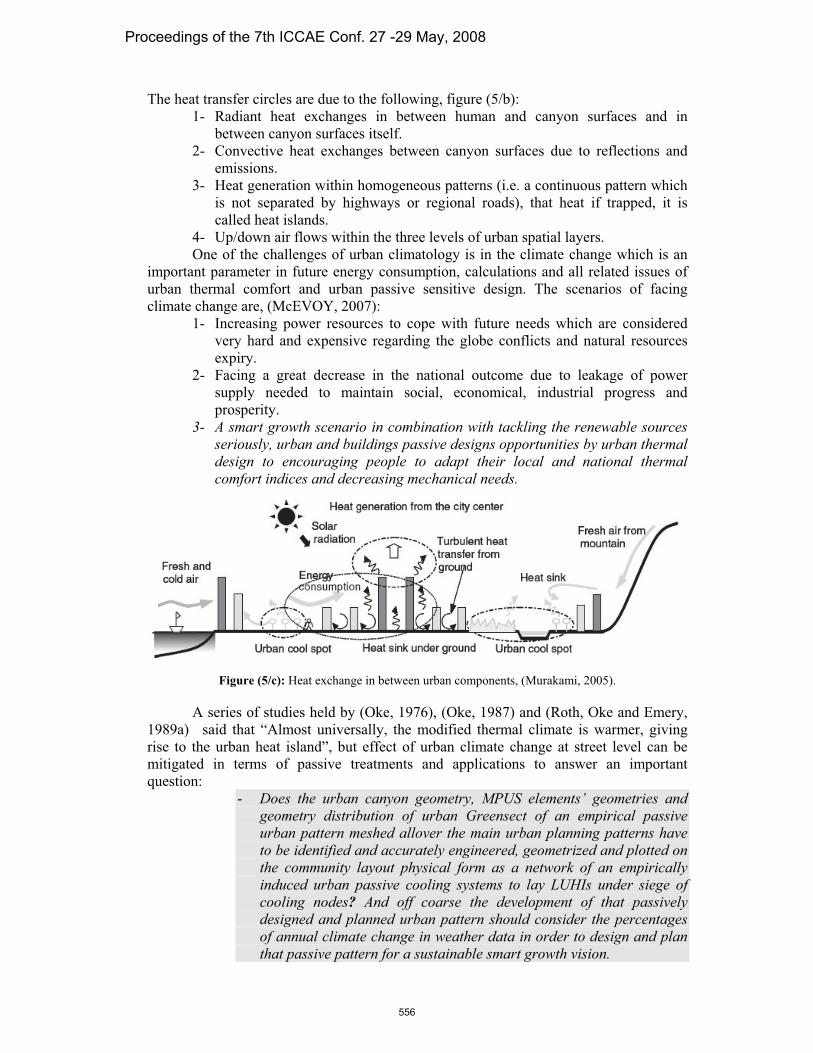
The heat transfer circles are due to the following, figure (5/b):
1- Radiant heat exchanges in between human and canyon surfaces and in
between canyon surfaces itself.
2- Convective heat exchanges between canyon surfaces due to reflections and
emissions.
3- Heat generation within homogeneous patterns (i.e. a continuous pattern which
is not separated by highways or regional roads), that heat if trapped, it is
called heat islands.
4- Up/down air flows within the three levels of urban spatial layers.
One of the challenges of urban climatology is in the climate change which is an
important parameter in future energy consumption, calculations and all related issues of
urban thermal comfort and urban passive sensitive design. The scenarios of facing
climate change are, (McEVOY, 2007):
1- Increasing power resources to cope with future needs which are considered
very hard and expensive regarding the globe conflicts and natural resources
expiry.
2- Facing a great decrease in the national outcome due to leakage of power
supply needed to maintain social, economical, industrial progress and
prosperity.
3- A smart growth scenario in combination with tackling the renewable sources
seriously, urban and buildings passive designs opportunities by urban thermal
design to encouraging people to adapt their local and national thermal
comfort indices and decreasing mechanical needs.
Figure (5/c): Heat exchange in between urban components, (Murakami, 2005).
A series of studies held by (Oke, 1976), (Oke, 1987) and (Roth, Oke and Emery,
1989a) said that “Almost universally, the modified thermal climate is warmer, giving
rise to the urban heat island”, but effect of urban climate change at street level can be
mitigated in terms of passive treatments and applications to answer an important
question:
- Does the urban canyon geometry, MPUS elements’ geometries and
geometry distribution of urban Greensect of an empirical passive
urban pattern meshed allover the main urban planning patterns have
to be identified and accurately engineered, geometrized and plotted on
the community layout physical form as a network of an empirically
induced urban passive cooling systems to lay LUHIs under siege of
cooling nodes? And off coarse the development of that passively
designed and planned urban pattern should consider the percentages
of annual climate change in weather data in order to design and plan
that passive pattern for a sustainable smart growth vision.
Proceedings of the 7th ICCAE Conf. 27 -29 May, 2008
556
4- Canyon heat exchange, balance and wind flow:
The heat exchange happening between a human body and other surrounding
bodies in regard to the climatic conditions is responsible for the human heat balance in
his environment which has been studied as a radiant and convective energy balances
firstly by (Monteith, 1973) whom had provided a vertical cylinder to simulate a man
standing on the ground level of an urban canyon to account the exchange between it and
the environment where all fluxes were in w/m2 of the cylindrical (still conditions i.e.
body is not moving) body to measure and calculate the instantaneous net radiant heat
exchange (Rn).(Nunez and Oke, 1977) investigated the basic knowledge on the energy balance of
urban canyon in their experiment in Vancouver.
The study dealt with a street located in Vancouver (49° N), N-S oriented, with an
aspect ratio (H1/W = 0.86 and H2/W= 1.15). The net all-wave radiation of both walls and
floor were explained as sensible heat fluxes , latent heat fluxes and energy stored
in materials explained by (Ali-Toudert, 2005) as follows:
HQ EQ
SQ
(1) SHWall QQQ*
(2)SEHFloor QQQQ*
The main conclusion was that orientation is responsible for canyon heat budget. All
energy components were measured during three days, but the sensible heat flux which
was obtained as residual. The main results were:
1- Canyon geometry has an influence on the radiation exchanges affecting the
timing and magnitude of the energy mechanism of the individual canyon
surfaces and was very different from each other.
2- The orientation had an evident importance on the energy balance where the air
turbulence affects the heat storage.
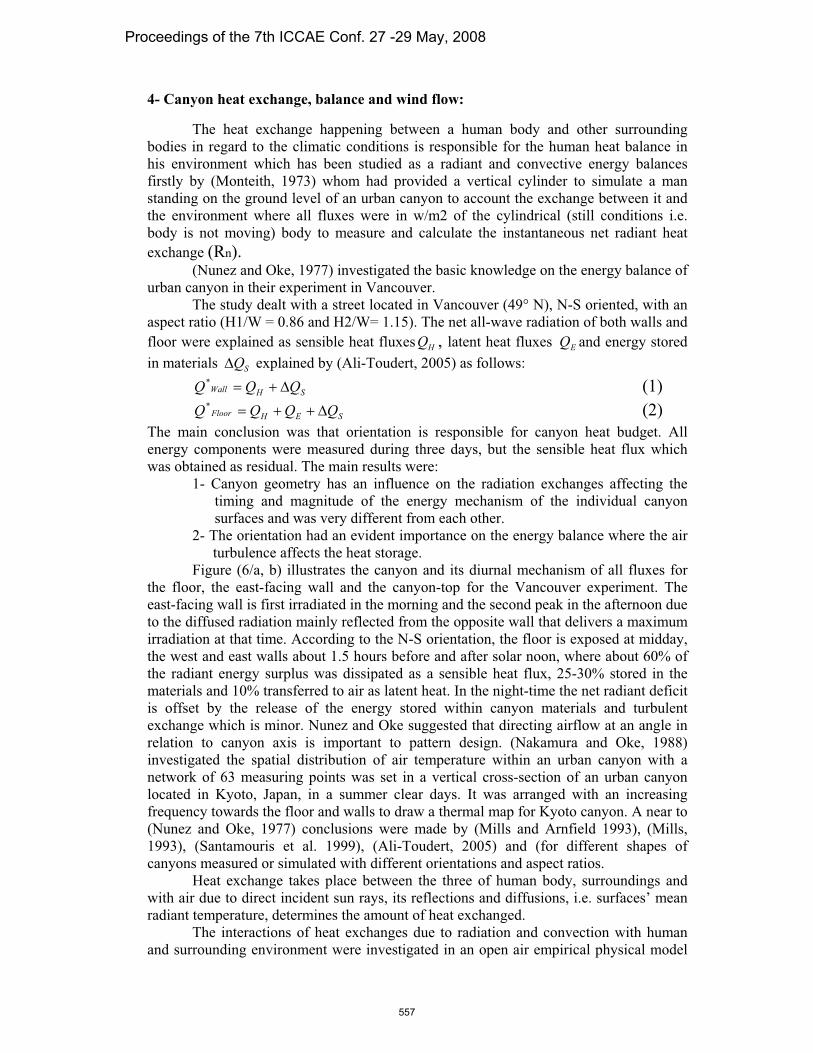
Figure (6/a, b) illustrates the canyon and its diurnal mechanism of all fluxes for
the floor, the east-facing wall and the canyon-top for the Vancouver experiment. The
east-facing wall is first irradiated in the morning and the second peak in the afternoon due
to the diffused radiation mainly reflected from the opposite wall that delivers a maximum
irradiation at that time. According to the N-S orientation, the floor is exposed at midday,
the west and east walls about 1.5 hours before and after solar noon, where about 60% of
the radiant energy surplus was dissipated as a sensible heat flux, 25-30% stored in the
materials and 10% transferred to air as latent heat. In the night-time the net radiant deficit
is offset by the release of the energy stored within canyon materials and turbulent
exchange which is minor. Nunez and Oke suggested that directing airflow at an angle in
relation to canyon axis is important to pattern design. (Nakamura and Oke, 1988)
investigated the spatial distribution of air temperature within an urban canyon with a
network of 63 measuring points was set in a vertical cross-section of an urban canyon
located in Kyoto, Japan, in a summer clear days. It was arranged with an increasing
frequency towards the floor and walls to draw a thermal map for Kyoto canyon. A near to
(Nunez and Oke, 1977) conclusions were made by (Mills and Arnfield 1993), (Mills,
1993), (Santamouris et al. 1999), (Ali-Toudert, 2005) and (for different shapes of
canyons measured or simulated with different orientations and aspect ratios.
Heat exchange takes place between the three of human body, surroundings and
with air due to direct incident sun rays, its reflections and diffusions, i.e. surfaces’ mean
radiant temperature, determines the amount of heat exchanged.
The interactions of heat exchanges due to radiation and convection with human
and surrounding environment were investigated in an open air empirical physical model
Proceedings of the 7th ICCAE Conf. 27 -29 May, 2008
557
using varieties of canyons combinations and orientation with manikin for human and it
was mainly concluded that compact forms of canyons deliver cooled environment and
dramatically modifies pedestrian comfort by the canyon geometry.
Figure (6/a, b): c; The actual conditions of the canyon experiment held by (Nunez and Oke, 1977)
illustrating the structure that carried the sensors, d; Diurnal energy balances for each of the canyon surfaces
in three days.
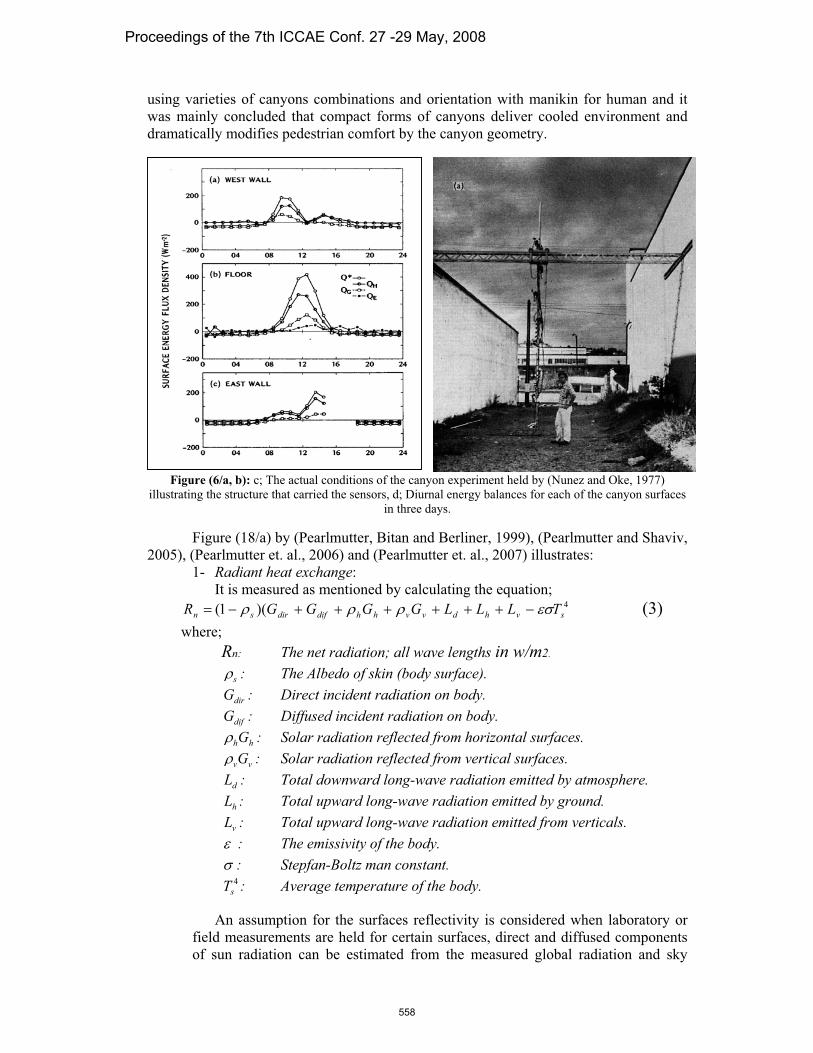
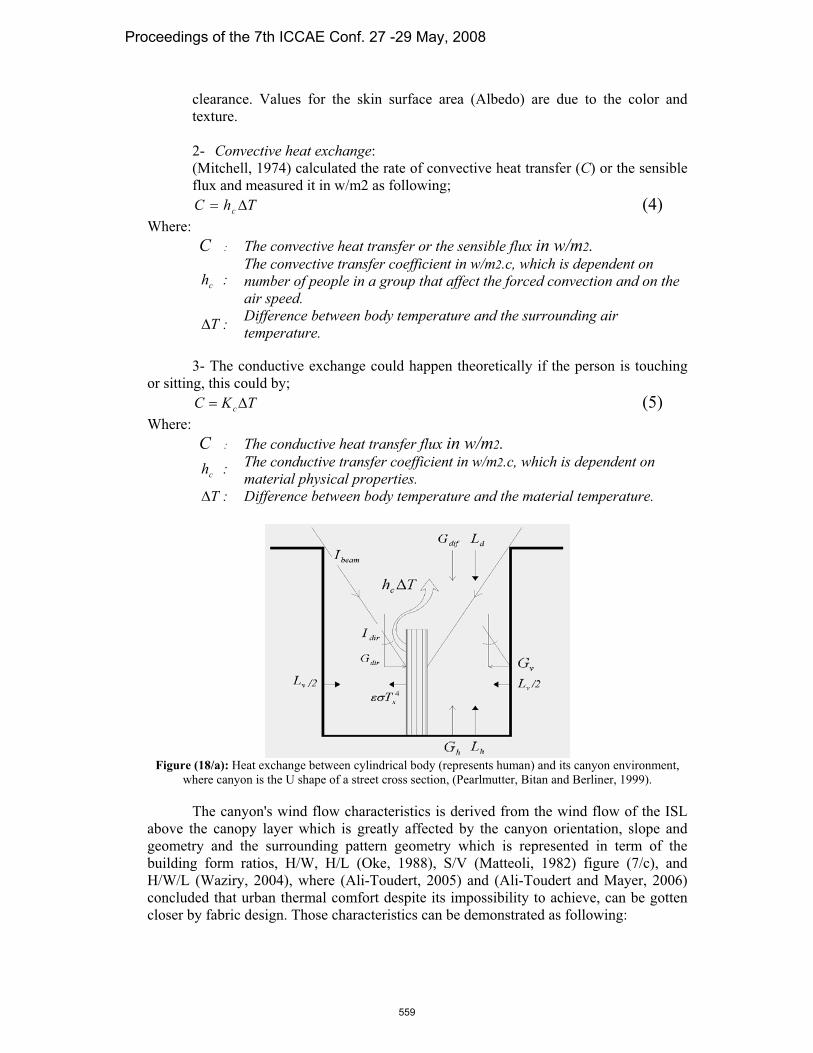
Figure (18/a) by (Pearlmutter, Bitan and Berliner, 1999), (Pearlmutter and Shaviv,
2005), (Pearlmutter et. al., 2006) and (Pearlmutter et. al., 2007) illustrates:
1- Radiant heat exchange:
It is measured as mentioned by calculating the equation; 4)(1( svhdvvhhdifdirsn TLLLGGGGR (3)
where;
Rn: The net radiation; all wave lengths in w/m2.
s : The Albedo of skin (body surface).
dirG : Direct incident radiation on body.
difG : Diffused incident radiation on body.
hhG : Solar radiation reflected from horizontal surfaces.
vvG : Solar radiation reflected from vertical surfaces.
dL : Total downward long-wave radiation emitted by atmosphere.
hL : Total upward long-wave radiation emitted by ground.
vL : Total upward long-wave radiation emitted from verticals.
: The emissivity of the body.
: Stepfan-Boltz man constant. 4
sT : Average temperature of the body.
An assumption for the surfaces reflectivity is considered when laboratory or
field measurements are held for certain surfaces, direct and diffused components
of sun radiation can be estimated from the measured global radiation and sky
Proceedings of the 7th ICCAE Conf. 27 -29 May, 2008
558
clearance. Values for the skin surface area (Albedo) are due to the color and
texture.
2- Convective heat exchange:
(Mitchell, 1974) calculated the rate of convective heat transfer (C) or the sensible
flux and measured it in w/m2 as following;
ThC c (4)
Where:
C : The convective heat transfer or the sensible flux in w/m2.
ch :The convective transfer coefficient in w/m2.c, which is dependent on number of people in a group that affect the forced convection and on the
air speed.
T :Difference between body temperature and the surrounding air temperature.
3- The conductive exchange could happen theoretically if the person is touching
or sitting, this could by;
TKC c (5)
Where:
C : The conductive heat transfer flux in w/m2.
ch :The conductive transfer coefficient in w/m2.c, which is dependent on material physical properties.
T : Difference between body temperature and the material temperature.
Figure (18/a): Heat exchange between cylindrical body (represents human) and its canyon environment,
where canyon is the U shape of a street cross section, (Pearlmutter, Bitan and Berliner, 1999).
The canyon's wind flow characteristics is derived from the wind flow of the ISL
above the canopy layer which is greatly affected by the canyon orientation, slope and
geometry and the surrounding pattern geometry which is represented in term of the
building form ratios, H/W, H/L (Oke, 1988), S/V (Matteoli, 1982) figure (7/c), and
H/W/L (Waziry, 2004), where (Ali-Toudert, 2005) and (Ali-Toudert and Mayer, 2006)
concluded that urban thermal comfort despite its impossibility to achieve, can be gotten
closer by fabric design. Those characteristics can be demonstrated as following:
Proceedings of the 7th ICCAE Conf. 27 -29 May, 2008
559
1- Air flows over an urban pattern near to the normal direction over street axis
are three types of flow systems depending on the buildings and pattern
geometry and their specific combinations; figure (7/b).
2- Those three air flow mechanisms can be described when H/W is large,
medium or small magnitude; (a) the first case called isolated roughness flow
due to non-interaction of air, (b) by increasing of H/W interaction begins by
slight separation of canyon's air from the (ISL) wind and a single vortex
appears, (c) double vortices produced due to increasing H/W and high
separation from the (ISL), (Santamouris et. al., 1999) and (Nakamura and
Oke, 1988).
3- Air flow mechanisms are formatted upon the aspect ratio of canyon geometry,
the construction density of whole surrounding urban pattern that is represented
by construction density a/A or by describing the distances between buildings
L1………Ln, orientation Z, street level slope P, and the latitude T.
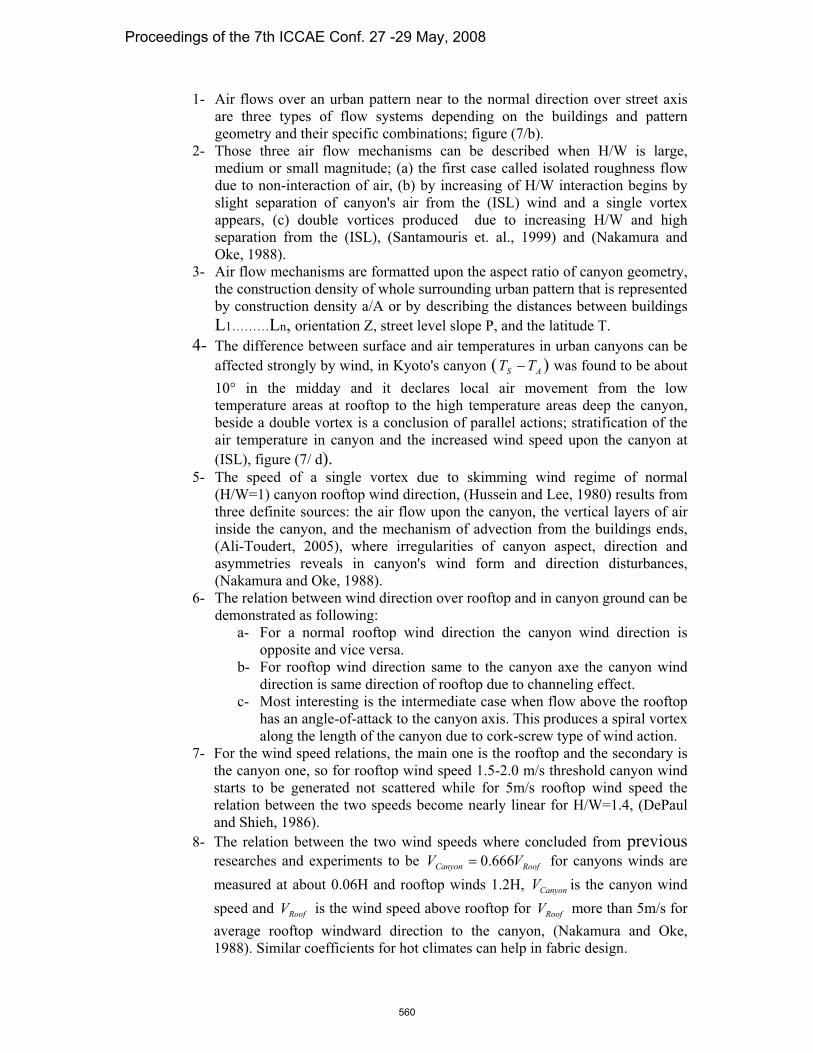
4- The difference between surface and air temperatures in urban canyons can be
affected strongly by wind, in Kyoto's canyon ( AS TT ) was found to be about
10 in the midday and it declares local air movement from the low
temperature areas at rooftop to the high temperature areas deep the canyon,
beside a double vortex is a conclusion of parallel actions; stratification of the
air temperature in canyon and the increased wind speed upon the canyon at
(ISL), figure (7/ d).5- The speed of a single vortex due to skimming wind regime of normal
(H/W=1) canyon rooftop wind direction, (Hussein and Lee, 1980) results from
three definite sources: the air flow upon the canyon, the vertical layers of air
inside the canyon, and the mechanism of advection from the buildings ends,
(Ali-Toudert, 2005), where irregularities of canyon aspect, direction and
asymmetries reveals in canyon's wind form and direction disturbances,
(Nakamura and Oke, 1988).
6- The relation between wind direction over rooftop and in canyon ground can be
demonstrated as following:
a- For a normal rooftop wind direction the canyon wind direction is
opposite and vice versa.
b- For rooftop wind direction same to the canyon axe the canyon wind
direction is same direction of rooftop due to channeling effect.
c- Most interesting is the intermediate case when flow above the rooftop
has an angle-of-attack to the canyon axis. This produces a spiral vortex
along the length of the canyon due to cork-screw type of wind action.
7- For the wind speed relations, the main one is the rooftop and the secondary is
the canyon one, so for rooftop wind speed 1.5-2.0 m/s threshold canyon wind
starts to be generated not scattered while for 5m/s rooftop wind speed the
relation between the two speeds become nearly linear for H/W=1.4, (DePaul
and Shieh, 1986).
8- The relation between the two wind speeds where concluded from previous researches and experiments to be RoofCanyon VV 666.0 for canyons winds are
measured at about 0.06H and rooftop winds 1.2H, CanyonV is the canyon wind
speed and RoofV is the wind speed above rooftop for RoofV more than 5m/s for
average rooftop windward direction to the canyon, (Nakamura and Oke,
1988). Similar coefficients for hot climates can help in fabric design.
Proceedings of the 7th ICCAE Conf. 27 -29 May, 2008
560

9- From the above standing points, research can reintroduced the idea of a court
yarded pattern in terms of clustered fabric that is arranged in a shaded and
irradiated surfaces of canyons same as the double court ventilation concept of
the Arabian housing to stimulate air movement while orienting canyons' axes
angled to the prevailing wind, so that an assumption of this angle to be 30, 45
and 60 degrees is preferable and will be examined in chapter four in parallel to
passive urban fabric and pattern design tools, refer back to figure viii/a and b
of the introduction.
Figure (7/b): (a) Wind flow regimes (Oke, 1988), and (b) corresponding threshold lines dividing air flow
into three regimes as function of canyon (H/W) and building geometry that can be defined either by
construction density a/A where a is the roof area of a building and A its total plot area, or by S/V where S is
the building surface area and V is the building volume (Matteoli, 1982).
Figure (7/c): Illustration of the ratio S/V effect in shaping the urban form, an example for three ratios for the same volume, (Matteoli, 1982).
Proceedings of the 7th ICCAE Conf. 27 -29 May, 2008
561
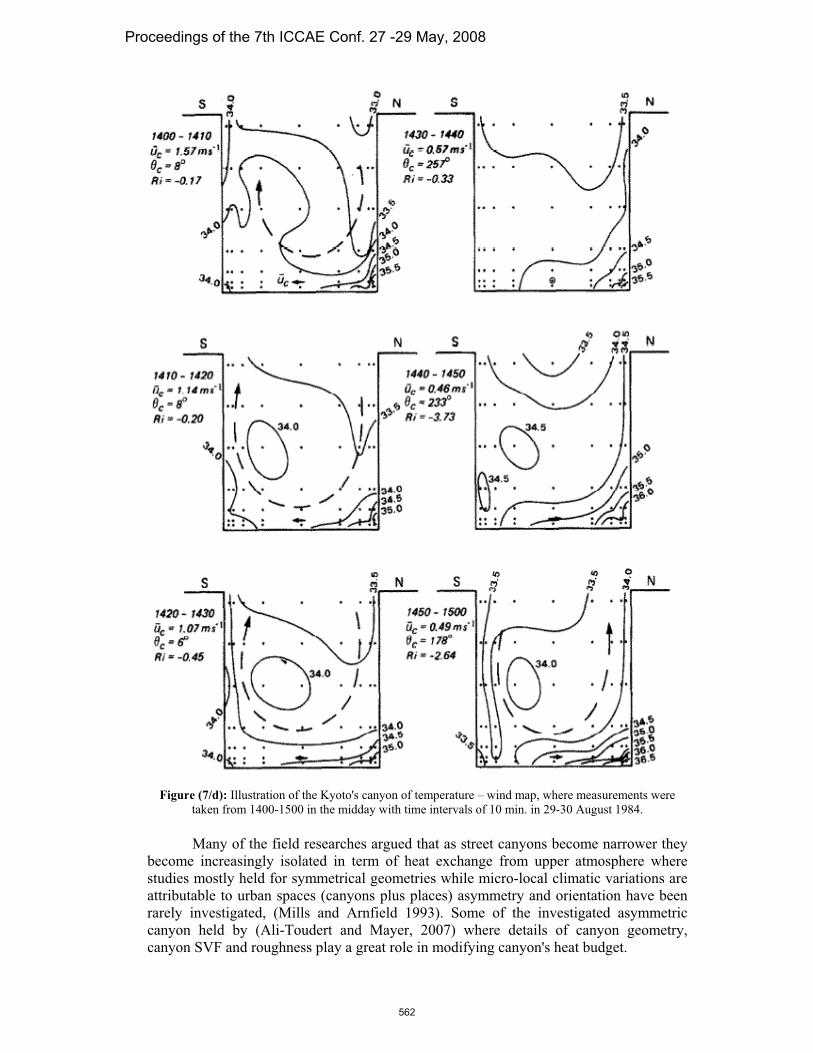
Figure (7/d): Illustration of the Kyoto's canyon of temperature – wind map, where measurements were
taken from 1400-1500 in the midday with time intervals of 10 min. in 29-30 August 1984.
Many of the field researches argued that as street canyons become narrower they
become increasingly isolated in term of heat exchange from upper atmosphere where
studies mostly held for symmetrical geometries while micro-local climatic variations are
attributable to urban spaces (canyons plus places) asymmetry and orientation have been
rarely investigated, (Mills and Arnfield 1993). Some of the investigated asymmetric
canyon held by (Ali-Toudert and Mayer, 2007) where details of canyon geometry,
canyon SVF and roughness play a great role in modifying canyon's heat budget.
Proceedings of the 7th ICCAE Conf. 27 -29 May, 2008
562

Another issue is the relations between wind directions and speed with the urban density, the effect of roughness on passive cooling by urban design and planning of local scales to generate wind breezes as one of the research concerns. (Grimond and Oke, 1999), and (Oke, 2006) have discussed those issues and classified the city urban form, figure (18/e), from the climatology application's point of view, and in fact one can observe some matching to the CNU Transect tool of urban design.
Figure (7/e): Illustration of simplified urban climate zones arranged in deceasing order of their ability to impact local climate, (Oke, 2004), based on (Ellefsen, 1990/1991).
4- Mitigating local urban heat island effect (LUHI):
(A. J. Arnfield, 2003) has investigated and recorded UHIs research till 2003 in a
historical review for urban climatology. A heat island is a phenomenon characterizing
urban climate where an area of land whose ambient temperature is higher than the land
surrounding it and it is produced due to the trapped heat by the built environment where
UHI studies display common characteristics in which temperature difference between
urban core and rural make it as a pool of warm air with largest values when closing to the
urban centre and a distinction between canopy and boundary-layer UHI should be
considered, (Oke, 1976), in another word “it is the difference between temperatures
measured in the urban space and hose in the non-urban space surrounding it” said (Oke,
1976).
Proceedings of the 7th ICCAE Conf. 27 -29 May, 2008
563
(Oke, 1981) studied the relation between the aspect ratio of urban canyon, UHI
intensity and found that UHI extends in contribution to cities extensions, figure (8/a).
(Landsberg and Maisel, 1972), (Balling and Brazel, 1986), (Grimmound and Oke, 2002)
and (Sharon L. Harlen et al, 2006) showed that construction density, intensity of
activities, urban canopy morphology and population of a city are the main reasons of the
heat island effect. The UHI intensity is the temperature difference of urban core than the
urban rural reserve of an urban planning community that can be measured in field along
with a specific traverse or Transect which is expressed in the following equation, (Oke,
1976):
(6)minmax TTTUHII u
Where; HII is UHI intensity.
is the urban difference in temperature. uT
is the maximum urban temperature usually measured in urban core. maxT
is the minimum urban temperature usually measured in urban rural.minT
(Grimmound and Oke, 1999) and (Holmer and Eliasson, 1999) discussed the role
of relative humidity in producing Heat Islands which is best illustrated as an interactive
relation between all of the local urban climatic conditions. (Robaa, 2003) discussed the
urban relative humidity intensity (URHI) which is demonstrated by the difference
between the measured humidity in urban core and at rural urban areas.
The factors affecting urban humidity intensity are:
1- Surface roughness or urban texture.
2- Moisture resources.
3- Thermal performance and heat exchange of urban canopy.
minmax RHRHRHURHI u (7)
Where; is UHI intensity.URHI
is the urban difference in relative humidity. uRH
maxRH is the maximum urban temperature usually measured in urban rural
reserve of cities.
minRH is the minimum urban temperature measured in urban core.
Figure (8/a): Right; Relationship between heat island intensity and H/W, left; triple relation between
aspect ratio h/b, SVF and presented by (Kanda, 2006), both graphs for the study of (Oke, 1981). RUT
Proceedings of the 7th ICCAE Conf. 27 -29 May, 2008
564
Higher urban temperatures increase the demand for electricity for cooling and air
conditioning in warm climates revealing an increase in air pollution which in turn
contribute to global warming due to the greenhouse effect (Saaroni et al, 2000) and
(Sofer and Potchter, 2005) hypothesized that:
1- UHI’s are close to the human intensive activities, i.e. at the urban core
or cities centers.
2- It is influenced by site topography and wind conditions.
3- Stronger at night or early evening due to heat emissions.
They suggested three main questions of (a) where are the UHI’s are located? i.e.
what is the spatial form of UHI’s and research is asking also if there is an ability for
many UHI’s to make a UHI network regarding the production of local urban heat islands?
(b) What is the time of UHI production during the day? (c) What are the main factors
affecting UHI?, and the study cited a map detailing routes across Eilat and Tel-Aviv
cities to monitor the climatic conditions along it. The measurement of urban structural
morphological heat stresses and climatic conditions or monitoring the climatic conditions
and the intensity of LUHIs which are (Voogt and Oke, 1997), (Voogt and Oke, 2003) and
(Chudnovsky et al, 2004):
1- Manual or computer based and data loggers with site sensors measuring and
monitoring instruments that have to be used on the street canyons and rooftop
levels of the urban canopy layer (UCL).
2- Radiometers thermal photography using video cameras installed upon the
highest buildings, towers, planes or choppers allover the measuring area.
3- Satellite remote sensing for thermal Photogrammetry imaging.
The complication in the second and third method that it is not specifically known
what the measured temperature represents, is it the air temperature, the aerodynamic
temperature near the surfaces after immediate irradiance or the mean radiant temperature
that is responsible of net all wave radiation exchanges at certain time?
The answer for the question (c) is:
a- Natural aspects:
1- Topography of the site.
2- Climatology of the climatic region.
3- Season.
4- Time of the day.
5- Wind behavior, where Low effect of airflow and humidity caused by
the sheltering effect of buildings which absorb heat vastly and emits it
slowly, i.e. the intensity of UHI increases with decreased wind speed.
6- The intensity of UHI production increases with clear sky.
b- Physical built environment aspects:
1- Geographical location regarding site selection
2- Urban pattern type and urban canyons detailed intensity of form and
construction densities.
3- Air pollution and heat production from buildings and traffic at many
roads and streets that cause a siege of heat in between built form.
4- Buildings and finishing materials’ physical properties that provides the
thermal performance of urban canyon where surfaces absorb solar
radiation during daytime and reflect heat to urban canyons that traps
the emitted heat at night, (Oke et al., 1992).
5- High Population densities of urban communities and settlements
delivering high automobiles numbers owning rates per community,
and the increasing rates of mechanical cooling devices at certain
Proceedings of the 7th ICCAE Conf. 27 -29 May, 2008
565

public canyon on some conditions of canyon spatial form encourages
trapping of heat due to the heat transferred from those devices to
urban canyons. “Between 2000 and 2030, the urban population in
Africa and Asia is set to double.” Said (PRB, 2007).
6- Non-homogenous and not designed urban pattern and canyons
geometry which are mostly haven’t any open spaces or scales of parks
and gardens related to the planning communities’ scales delivering
continues heat waves in street level of urban canyon.
7- Un-designed urban planning chain of green spaces that has to be placed
into urban form concludes in parse of public urban canyons’ natural
passive cooling applications as vegetation.
8- Changing land-usages reveal in high rates of population, pollution, cars,
energy demands and consumptions …etc., i.e. anthropogenic heat
fluxes, (Oke et al., 1992) and (Fan and Sailor, 2005).
9- Low individual and national income, poverty, infra declination,
unsustainable developments or undoing urban developments at all,
social ethnic discrimination (Sharon L. Harlen et al, 2006) and
inequity of resources distribution.
By extension of urbanization, “the energy consumption for electricity,
transportation, cooking, and heating are much higher in urban areas than in rural villages.
For example, urban populations have many more cars than rural populations per capita.
The urbanization of the world’s populations will increase aggregate energy use. And the
increased consumption of energy is likely to affect the environment. Urban consumption
of energy creates heat islands that can change local weather patterns and weather
downwind from the heat islands. The heat island phenomenon is created as cities radiate
less heat back into the atmosphere than rural areas, making cities warmer than rural
areas.” (PRB, 2007).
The answer of question (b) is due to field measurements of the microclimate
condition of a place. It is obvious that most of these factors can be found at city centers,
i.e. the urban core of a city, so that question (a) is answered but also that phenomenon
can be noticed in wide non-shaded urban canyons that maximizes the thermal sensation
for people in local places of urban patterns, that is what can distribute UHI over a wide
land use area and in close places to form what research hypothesizing to be called
Network of Local Urban Heat Islands (LUHI ). Strategies of mitigating UHI effects are depending on studies of urban heat
balance and heat circulation within canyons, (Rosenfeld et. al., 1995), (Akbari et. al.,
2001) and (Sailor, 2007). Particularly, by mean of:
1- Albedo modification; Albedo is the ratio of incident to reflected radiation,
(EPA, 2005).
2- Vegetation modification; increasing area, urban trees type selection…etc,
3- Combined Albedo and vegetation modification.
4- Decreasing population densities or increasing networks areas at street levels
but should be studied from the Albedo point of view.
5- Increasing urban wind speed at street level.
6- Deformations for finishing materials geometry and physical properties.
5- Urban comfort:
Thermal comfort is defined by (ASHRAE-55, 1981) and (ISO-7730, 1984) as
"that condition of mind which expresses satisfaction with the thermal environment". The
urban comfort is about to achieve the state of equilibrium and welcoming for being in
Proceedings of the 7th ICCAE Conf. 27 -29 May, 2008
566

between the urban environmental content regarding physiological and psychological heat
stresses. No doubt that users of urban spaces are more tolerant for wider temperature
variations, plenty of clothing insulation levels, as in cold conditions they can use coats,
scarves and gloves and vice versa. Consequently, users of urban spaces can adjust
activity levels over a temperature range to adapt themselves for lower or higher
temperatures where it is not expected to find climate conditions with in the physical
comfort zone, (Evans, 2003). Conventional thermal comfort studies have had the issue
from the physical thermal balance equation’s point of view as considering the
environmental conditions in a steady state not in a transient one.
There are large number extensive studies, discussions and arguments have been
held through the last century from the work of ASHVE Laboratory (1924-1948), (Gagge
et. al., 1967), till now through many researchers, scientists and organizations whom have
involved thermal comfort into their work, because of two main reasons which are:
1- All of the international standards and publications assume a fixed model of
predictions based on calculating the heat exchange between human as a
passive element to achieve the equilibrium with environment accounting on
some inputs of the model undertaking laboratory measurements assuming
European or American subjects with definite age not too old not a child, cloth
insulation, fixed kinds of activities to measure subjects PMV and PPD of
thermal sensation to base the energy requirements in buildings thermal design
on that output data measured and standardized.
2- All of the field measurements and questionnaire studies allover the world
revealed that the AMV and APD are matching the physical predictions for
PMV and PPD, (Oseland, 1994), (Oseland, 1995), (Humphreys and Nicol,
2002) , (Humphreys, Nicol and raja, 2007) and (due to not only the actual
subjects in the actual environment are examined but also there were a
psychological factors involved in debate which has its arising voice in the last
twenty years, that is the human psychological adaptation seeking to achieve
thermal comfort.
we aren't here in a place to evaluate which point of view is correct and which is
not, it was obvious that thermal comfort achievement must have both considerations to be
studied in parallel with the urban design and planning criteria to know how urban form,
pattern and spatial structure design can be optimized to serve human thermal comfort in
urban spaces because theoretical thermoregulatory models are inadequate for describing
urban conditions due to human mobility and the great complexity, interrelations,
interactions, transiently, variability, temporally and spatiality of the urban environment.
5-1 Physical based theory for thermal comfort:
(Monteiro and Alucci, 2006) have made extensive calibration for outdoor a large
number of models to investigating the suitable one for microclimatic assessment for
outdoor spaces of Grande Sao Paulo, a Brazilian metropolitan area. For example Fanger
has found thermal sensation of human body heat balance to be a guide in making scales
for comfort depending on the PMV and PPD that are the mean value of the votes of a
large group of people upon which ISO made seven point scale of thermal comfort
sensation where (Givoni, 1963) made his index of thermal sensation ITS upon five
scales which considers the heat exchanges, metabolism and clothes. The later has been
amended by (Givoni et al., 2003) to be seven scale thermal index TS but considering the
rates of sweating determined by the balance between metabolic heat production and the
heat loosed by radiation and convection. A scale of seven degrees for sweating produced
upon heat stress is (Givoni, 1998):
Proceedings of the 7th ICCAE Conf. 27 -29 May, 2008
567
0- Forehead and body completely dry.
1- Skin clammy but moisture invisible.
2- Moisture invisible.
3- Forehead and body wet.
4- Clothing partially wet.
5- Clothing almost completely wet.
6- Clothing soaked.
7- Sweat dripping off clothing.
The perspiration heat transfer is depending on the ratiomaxE
E (8)
Where; Emax is the evaporative capacity of the air.
E is the required evaporative cooling. However, (ISO7730, 1994) and (B. W. Olesen and K. C. Parsons, 2002) are
stating some regulations for depending on any of those indices in real design, those
regulations are:
1- Validity of standards to match the real or actual thermal sensation.
2- Reliability of standards if measurements have been held many times at the
same time of the year.
3- Usability of standards considering the persons whom are going to hold those
measurements for thermal comfort.
4- Scope of subjects whom are the measurements held for.
Experiments had many criticisms considering the field measurements upon the
criteria based from ISO 7730 itself because the PMV and PPD experiments were held in
a closed chamber over a group of people in the same ethnicity and in a static environment
assuming fixed area of 1.8 m2 for 70kg male and 1.6m2 for 60kg female where 1 met =
58 W/m2 and 1 clo = 0.155 m2.K/W, sedentary action on the metabolism scale that have
been measured by indirect calorimetric calculations, assuming a fixed manikin model to
measure the effect of thermal insulation from clothes and a sweating rate scale without
considering the true dynamics properties of clothing that people wear i.e. excluding the
effect of absorption, buffering, textile kind and comfort….etc.
Scale of clothing thermal insulation includes the following:
1- Naked; 0 clothing.
2- Under pants only; 0.2 clothing.
3- Short and T-shirt; 0.4 clothing.
4- Trousers and shirt; 0.6 clothing.
5- Light business suit; 1.0 clothing.
6- Business suit and thermals; 1.5 clothing.
7- Jacket and overcoat; 2.0 clothing.
8- Heavy winter gear; 2.5 clothing.
9- Arctic-type clothing; 3.0 clothing.
Those former assumptions what makes the result overestimates the design
considerations and needs.
Its general equation is (ISO 8996, 1990):
H=M-W (9)
And M+W+C+R+P=0 (10)
Where; H is the total metabolic heat production,
W is the performed mechanical work by the body,
Proceedings of the 7th ICCAE Conf. 27 -29 May, 2008
568
M is the rate of metabolic action at which body utilizes oxygen and food to
produce energy is measured in w/m2 and 1 Met is 50 kcal/m2/hr = 58.15
w/m2 and is said to be the metabolic rate of a seated person at rest.
C is the convective heat exchange.
R is the radiant heat exchange.
P is the heat transferred due to perspiration.
The most promising project towards a Universal Thermal Comfort Index led by
the German meteorological service sponsored by COST, ISB and WMO is trying to
consider many inputs to validate the index and to make it reliable , (Hoppe, 2002),
(Jendritzky and Havenith, 2005). Their equation is considering as shown down the
parameters of the physical model from a general point of view:
M + W + Q* (Tmrt,v) + QH (Ta,v) + QL (e,v) + QSW (e,v) + QRe (Ta,e) + S= 0 (11)
Where: M Metabolic rate (activity)
W Mechanical power (kind of activity)
Q* Radiation budget
QH Turbulent flux of sensible heat
QL Turbulent flux of latent heat (diffusion water vapor)
QSW Turbulent flux of latent heat (sweat evaporation)
QRe Respiratory heat flux (sensible and latent)
S Storage
The meteorological data that this equation's model, UBIKLIM, depends on are
air temperature Ta, water vapor pressure e, wind velocity v, mean radiant temperature
Tmrt including short- and long-wave radiation exchanges considering walking speed of
human as 1.1 m/s with an adaptive clothing insulation values between 0.4 and 2.6 clo
and subsets of environmental parameters that included 3 different levels of ambient
temperature (mean radiant temperature was set equal to air temperature), 5 different air
velocities, and 50% RH in a multi node simulations can predict the human comfort state
based on the PMV model, (Jendritzky and Havenith, 2005), and (Fiala et. al., 2005)
5-2 Psychological adaptation for thermal comfort: The confusion that has been found regarding the field measurements held by
many researchers for many case studies allover the world proved that the theoretical
physical balance model of human thermal comfort can’t been relied on when studying the
human thermal (Heidari and Sharples, 2002) specially in urban spaces and more over in
the arid or humid climatic regions.
The psychological adaptation is about human natural and subconscious
perceptions and responses beyond the physics of the body that made in a repeated diurnal
and annual normal way in harsh environment using the biological sensation to minimize
the heat stress felt. ‘the adaptive model reflects a give and take relationship between the
environment and the user’ (Brager and De Dear, 1998) and (De Dear and Brager, 1998)
The understanding that urban design and planning details supports climate sensitive
planning and design has been widely spreaded in field of and realization of what can the
physical elements or MPUS do for people and influence their microclimate perception is
being ascending nowadays, (Eliasson et. al., 2007).
Proceedings of the 7th ICCAE Conf. 27 -29 May, 2008
569
Adaptation can not be measured but just noticed and recorded because it is a
human self action to improve comfort conditions and to make a reduction in thermal
sensation and energy consumption. After many deep studies to define how human can
adapt comfort, there are nowadays three main ways of that self control as following:
1- Behavioral adjustments or physical adaptation, that is concerning what is
made by someone personality or in the built environment and is divided into
three points:
a- Personal adjustments or reactive (Brager and De Dear, 1998) and
(Marialena and Steemers, 2003) adaptation that are changing personal
variables that one make like change clothing, activity, posture, eating
or drinking hot or cold.
b- Technological or environmental adjustment or interactive
environmental adaptation, which is the design considerations and
modification to be done with the urban spaces’ details in order to adapt
a people behavior.
c- Cultural and social adjustments including the organizational activities,
siestas and dressings of each gender.
2- Physiological acclimatization or adaptation is a human response to the
repeated circumstances considering the following points:
a- The approved acclimatization behavior in sensory studies is more
significant to be based on a group response rather than individuals, and
the relative response to different environments is more significant than
the absolute response.
b- It has been explained as an autonomic nervous system that directly
affects the physiological thermoregulation set points and flow rate of
blood. For example in hot arid zones the heat stress response is
inducing a regime of work in heat and increasing sweating capacity for
a given heat load and metabolic factor (Brager and De Dear, 1998),
consequently a fall in the body’s temperature set points happens to
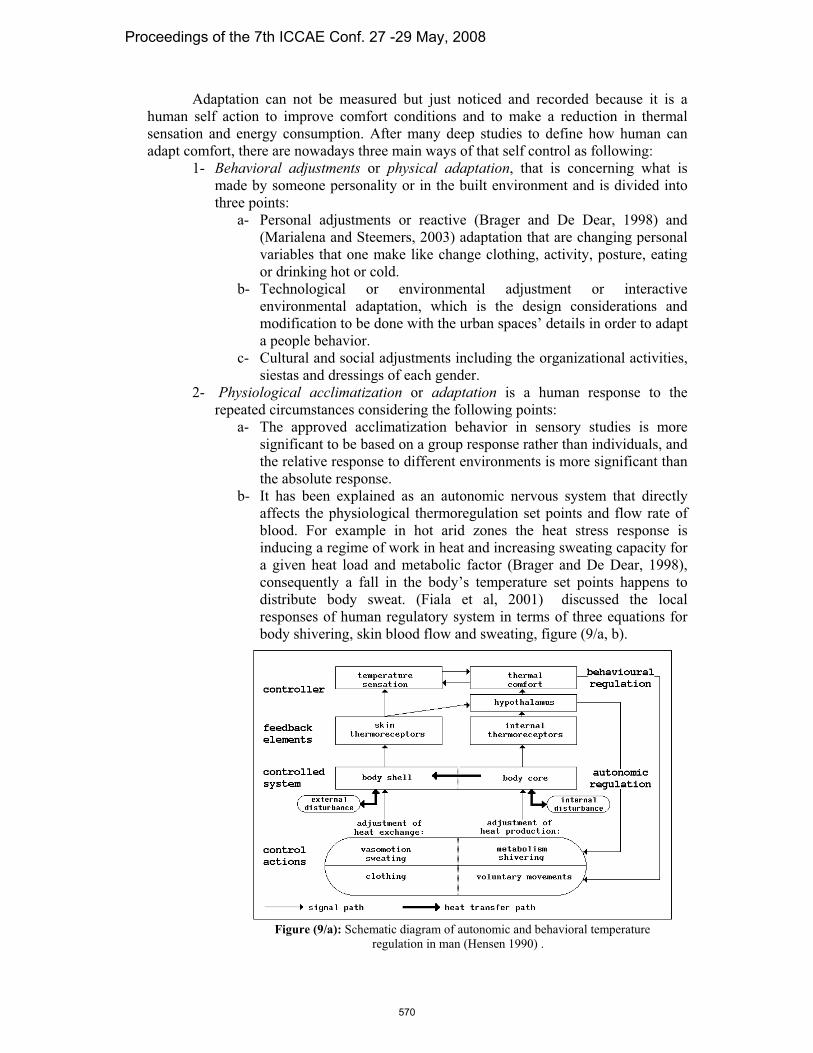
distribute body sweat. (Fiala et al, 2001) discussed the local
responses of human regulatory system in terms of three equations for
body shivering, skin blood flow and sweating, figure (9/a, b).
Figure (9/a): Schematic diagram of autonomic and behavioral temperature
regulation in man (Hensen 1990) .
Proceedings of the 7th ICCAE Conf. 27 -29 May, 2008
570
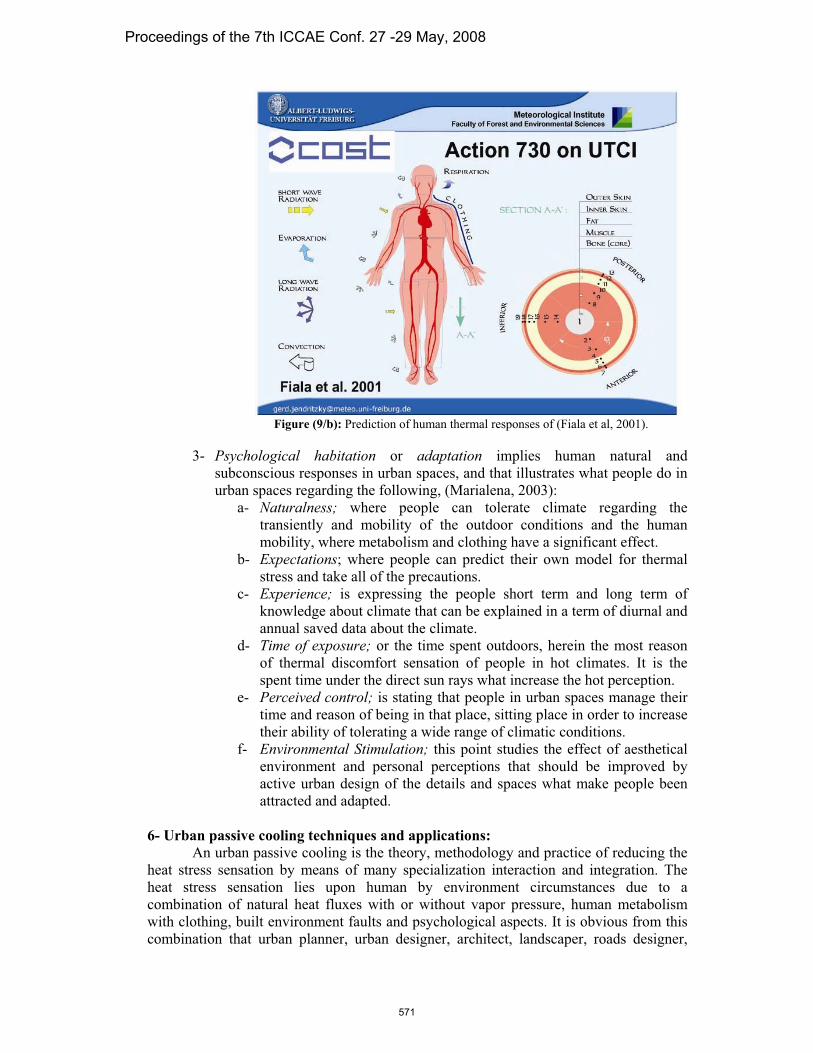
Figure (9/b): Prediction of human thermal responses of (Fiala et al, 2001).
3- Psychological habitation or adaptation implies human natural and
subconscious responses in urban spaces, and that illustrates what people do in
urban spaces regarding the following, (Marialena, 2003):
a- Naturalness; where people can tolerate climate regarding the
transiently and mobility of the outdoor conditions and the human
mobility, where metabolism and clothing have a significant effect.
b- Expectations; where people can predict their own model for thermal
stress and take all of the precautions.
c- Experience; is expressing the people short term and long term of
knowledge about climate that can be explained in a term of diurnal and
annual saved data about the climate.
d- Time of exposure; or the time spent outdoors, herein the most reason
of thermal discomfort sensation of people in hot climates. It is the
spent time under the direct sun rays what increase the hot perception.
e- Perceived control; is stating that people in urban spaces manage their
time and reason of being in that place, sitting place in order to increase
their ability of tolerating a wide range of climatic conditions.
f- Environmental Stimulation; this point studies the effect of aesthetical
environment and personal perceptions that should be improved by
active urban design of the details and spaces what make people been
attracted and adapted.
6- Urban passive cooling techniques and applications:
An urban passive cooling is the theory, methodology and practice of reducing the
heat stress sensation by means of many specialization interaction and integration. The
heat stress sensation lies upon human by environment circumstances due to a
combination of natural heat fluxes with or without vapor pressure, human metabolism
with clothing, built environment faults and psychological aspects. It is obvious from this
combination that urban planner, urban designer, architect, landscaper, roads designer,
Proceedings of the 7th ICCAE Conf. 27 -29 May, 2008
571
comfort designer, developer, owner, user, administrator and decision maker are the
paradigm of urban passive cooling methodology which is an iterating way flow chart of
gathering those specializations.
The theory of urban passive cooling is the art of designing the built environment
form to improving alleviative opportunities for human to adapt his local and national
comfort conditions due to the control of urban pattern type and geometry of spaces,
public urban canyon geometry with orientation and site slope, shading trees’ scaping
with its natural properties and urban infill geometry and finally, roofs green coverage and shading by roof plants.
The urban opportunities are the physical and psychological thermal perception
tools used underneath a specific cooling technique as following:
1- Urban shading tools to reduce heat gain and time of exposure; urban
compactness, trees and street light shading elements like arches, tents….etc. A
term of urban shading performance to reduce radiant heating has to be
introduced in terms of urban shaded area to its canyon’s type area, i.e.
When; (12)TAUQ ..
So; At
AIP i. (13)
Where: is incident area of direct radiant gain at peak time of solar
intensity of the maximum SVA.
iA
is the total urban canyon ground area. At
..IP percentage of incidency is a suggested ratio for irradiance
acts as a scale to identifying the capability of an urban
canyon to reduce thermal sensation due to radiation by
shading elements regarding the methodologies of
mitigating UHI. A total passive cooling evaluation for an
arid city urban planning can refer to the ratio of incident
area to the total exposed area, percentage of incidency,
(PI) that can be considered as an item of the passive
cooling evaluation for the unit urban planning of a city
urban planning and smart growth.
2- Urban ventilation for developing people expectations and perceived control;
urban spaces pressure difference, linear and compact groups for wind
guidance.
3- Urban evaporation for developing people expectations and perceived control;
fountains for plazas, piazzas and squares, pools, lagoons and even falls for
plots canyons and parks as a private urban canyons.
4- Psychological perception elements to improve naturalness, people experience
and stimulate environment:
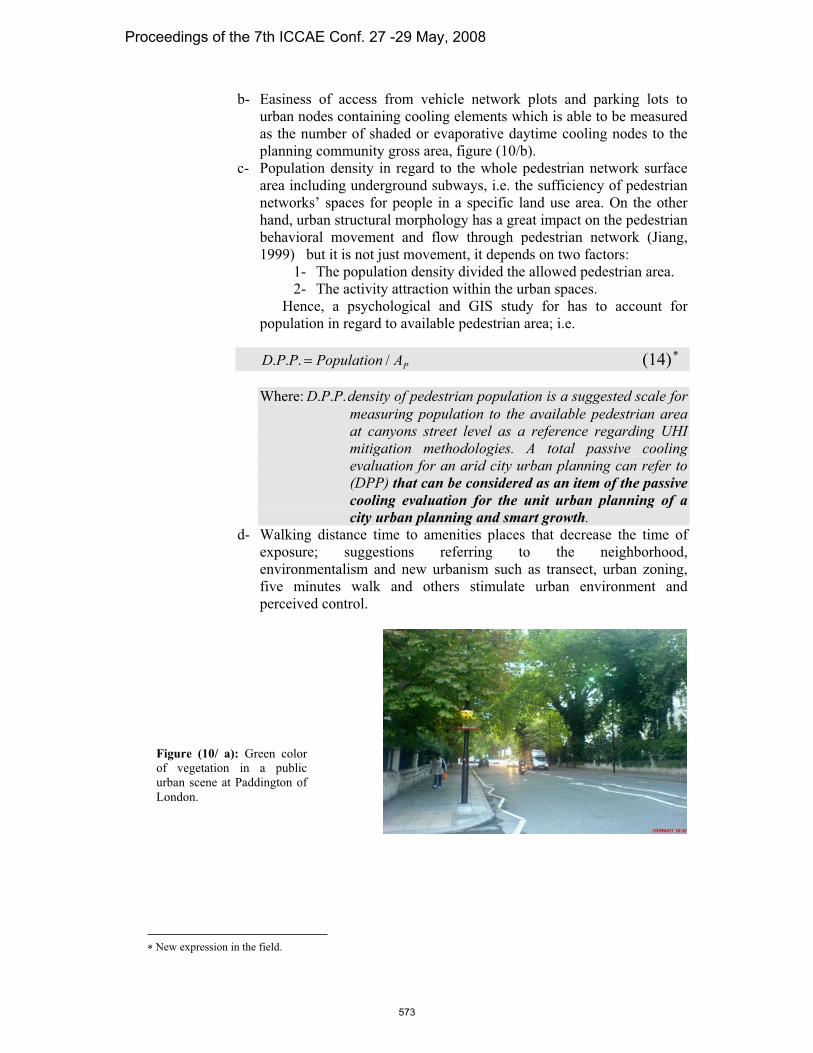
a- Percentage of green color in the urban scene on daytime, sound
comfort and cleanness of urban canyons as visual elements to decrease
heart rate as physical drawback self regulatory of thermal stress, hence
increasing human anti-vulnerability, stimulating environment for him
or we can say giving him an urban environmental psychological
vaccine that improves perceived control, figure (10/a).
New expression in the field.
Proceedings of the 7th ICCAE Conf. 27 -29 May, 2008
572
b- Easiness of access from vehicle network plots and parking lots to
urban nodes containing cooling elements which is able to be measured
as the number of shaded or evaporative daytime cooling nodes to the
planning community gross area, figure (10/b).
c- Population density in regard to the whole pedestrian network surface
area including underground subways, i.e. the sufficiency of pedestrian
networks’ spaces for people in a specific land use area. On the other
hand, urban structural morphology has a great impact on the pedestrian
behavioral movement and flow through pedestrian network (Jiang,
1999) but it is not just movement, it depends on two factors:
1- The population density divided the allowed pedestrian area.
2- The activity attraction within the urban spaces.
Hence, a psychological and GIS study for has to account for
population in regard to available pedestrian area; i.e.
PA (14)PopulationPPD /...
Where: density of pedestrian population is a suggested scale for ... PPD
measuring population to the available pedestrian area
at canyons street level as a reference regarding UHI
mitigation methodologies. A total passive cooling
evaluation for an arid city urban planning can refer to
(DPP) that can be considered as an item of the passive
cooling evaluation for the unit urban planning of a
city urban planning and smart growth.d- Walking distance time to amenities places that decrease the time of
exposure; suggestions referring to the neighborhood,
environmentalism and new urbanism such as transect, urban zoning,
five minutes walk and others stimulate urban environment and
perceived control.
Figure (10/ a): Green color
of vegetation in a public
urban scene at Paddington of
London.
New expression in the field.
Proceedings of the 7th ICCAE Conf. 27 -29 May, 2008
573
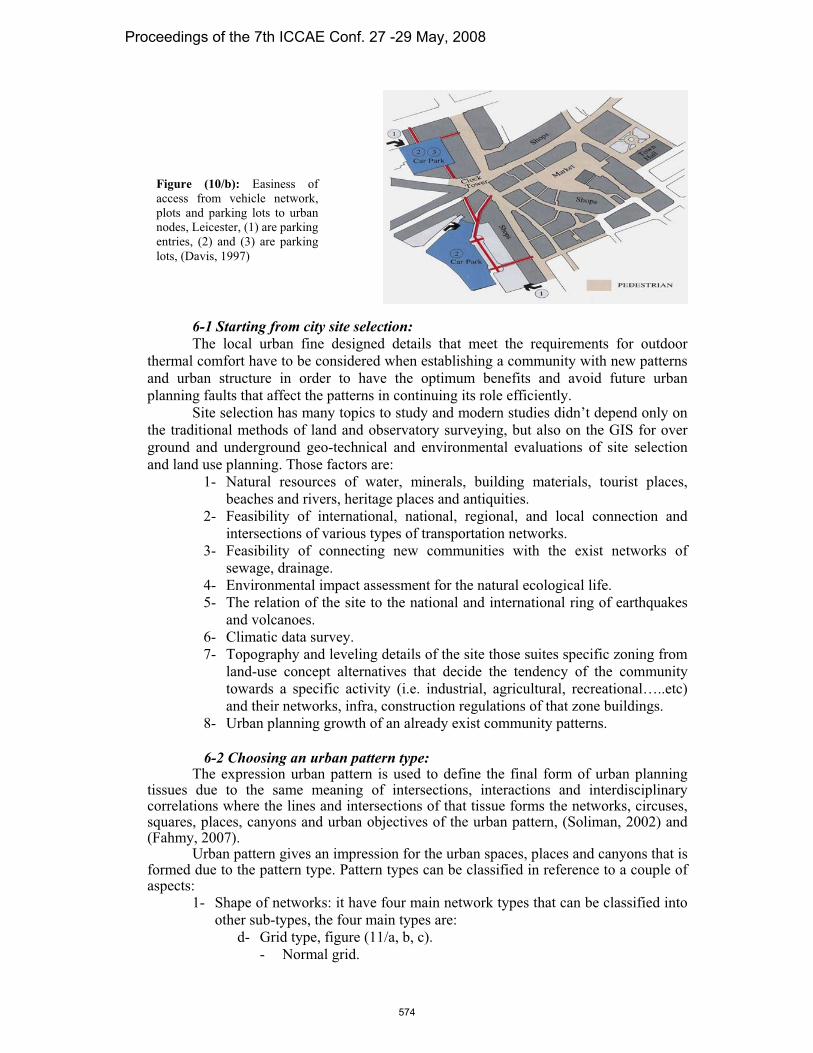
Figure (10/b): Easiness of
access from vehicle network,
plots and parking lots to urban
nodes, Leicester, (1) are parking
entries, (2) and (3) are parking
lots, (Davis, 1997)
6-1 Starting from city site selection:
The local urban fine designed details that meet the requirements for outdoor
thermal comfort have to be considered when establishing a community with new patterns
and urban structure in order to have the optimum benefits and avoid future urban
planning faults that affect the patterns in continuing its role efficiently.
Site selection has many topics to study and modern studies didn’t depend only on
the traditional methods of land and observatory surveying, but also on the GIS for over
ground and underground geo-technical and environmental evaluations of site selection
and land use planning. Those factors are:
1- Natural resources of water, minerals, building materials, tourist places,
beaches and rivers, heritage places and antiquities.
2- Feasibility of international, national, regional, and local connection and
intersections of various types of transportation networks.
3- Feasibility of connecting new communities with the exist networks of
sewage, drainage.
4- Environmental impact assessment for the natural ecological life.
5- The relation of the site to the national and international ring of earthquakes
and volcanoes.
6- Climatic data survey.
7- Topography and leveling details of the site those suites specific zoning from
land-use concept alternatives that decide the tendency of the community
towards a specific activity (i.e. industrial, agricultural, recreational…..etc)
and their networks, infra, construction regulations of that zone buildings.
8- Urban planning growth of an already exist community patterns.
6-2 Choosing an urban pattern type: The expression urban pattern is used to define the final form of urban planning tissues due to the same meaning of intersections, interactions and interdisciplinary correlations where the lines and intersections of that tissue forms the networks, circuses, squares, places, canyons and urban objectives of the urban pattern, (Soliman, 2002) and (Fahmy, 2007). Urban pattern gives an impression for the urban spaces, places and canyons that is formed due to the pattern type. Pattern types can be classified in reference to a couple of aspects:
1- Shape of networks: it have four main network types that can be classified into
other sub-types, the four main types are:
d- Grid type, figure (11/a, b, c).
- Normal grid.
Proceedings of the 7th ICCAE Conf. 27 -29 May, 2008
574
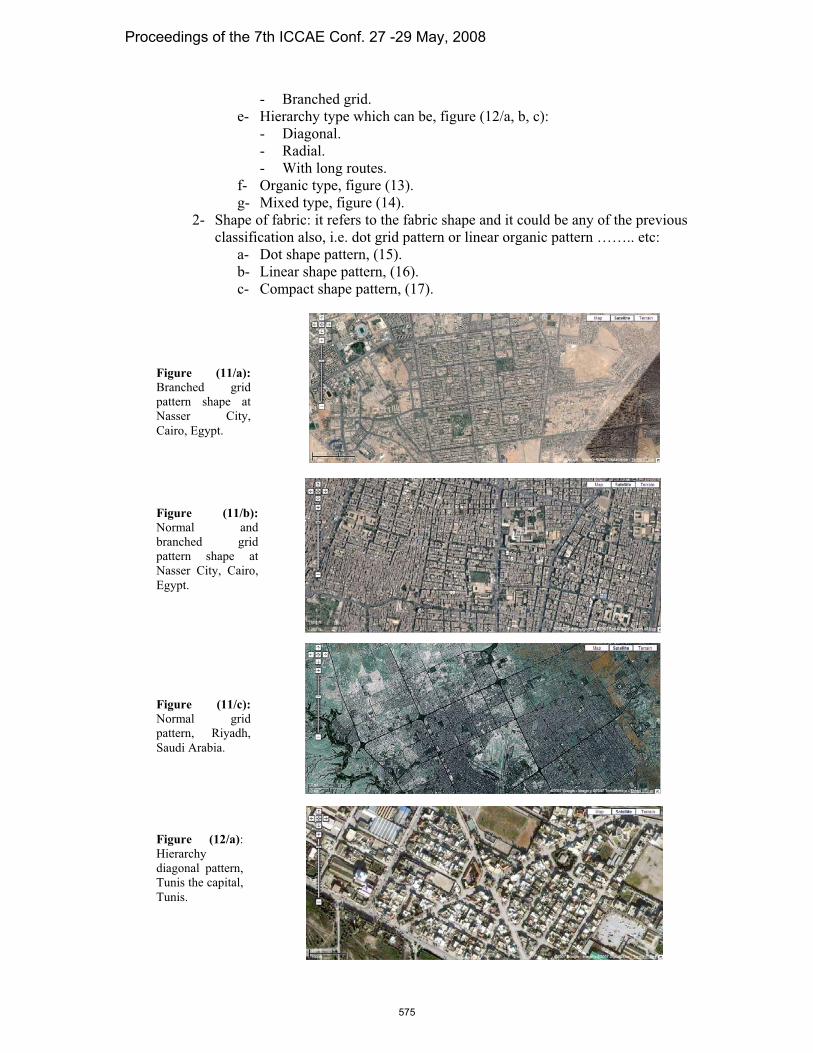
- Branched grid.
h can be, figure (12/a, b, c):
g routes.
3).
bric shape and it could be any of the previous
).
.
e- Hierarchy type whic
- Diagonal.
- Radial.
- With lon
f- Organic type, figure (1
g- Mixed type, figure (14).
2- Shape of fabric: it refers to the fa
classification also, i.e. dot grid pattern or linear organic pattern …….. etc:
a- Dot shape pattern, (15).
b- Linear shape pattern, (16
c- Compact shape pattern, (17)
Figure (11/a):
Branched grid
pattern shape at
Nasser City,
Cairo, Egypt.
Figure (11/b):
Normal and
branched grid
pattern shape at
Nasser City, Cairo,
Egypt.
Figure (11/c):
Normal grid
pattern, Riyadh,
Saudi Arabia.
Figure (12/a):
Hierarchy
diagonal pattern,
Tunis the capital,
Tunis.
Proceedings of the 7th ICCAE Conf. 27 -29 May, 2008
575

Figure (12/b):
Hierarchy radial
pattern, Misr Al-
gadida, Cairo,
Egypt.
Figure (12/c):
Hierarchy with
long route
pattern, Heritage
Cairo, Egypt.
Figure (13):
Organic pattern,
Rade burn, Fair
Lawn, New Jersey,
USA.
Figure (14): Mixed
pattern, Al-
Mohandseen, Cairo,
Egypt.
Figure (15): Dot
branched grid
pattern beside the
Military Academy
stadium, Cairo,
Egypt.
Proceedings of the 7th ICCAE Conf. 27 -29 May, 2008
576
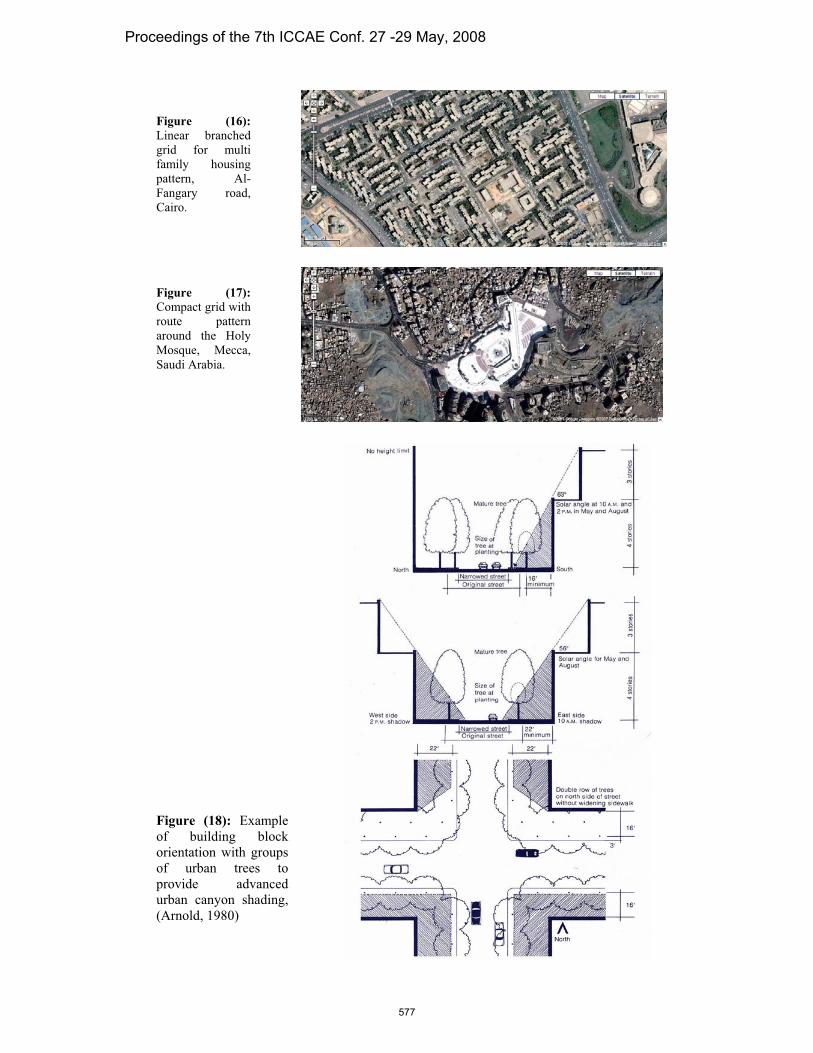
Figure (16):
Linear branched
grid for multi
family housing
pattern, Al-
Fangary road,
Cairo.
Figure (17):
Compact grid with
route pattern
around the Holy
Mosque, Mecca,
Saudi Arabia.
Figure (18): Example
of building block
orientation with groups
of urban trees to
provide advanced
urban canyon shading,
(Arnold, 1980).
Proceedings of the 7th ICCAE Conf. 27 -29 May, 2008
577
Proceedings of the 7th
ICCAE Conf. 27 -29 May, 2008
29
6-4 Potential to having urban green cooling nodes:
Although all of the urban planning theories are citing and stating that each urban
planning community has to have its public green and vegetated land use area, because
“parks and green areas are known to create park cool islands (PCI)” said, (Saaroni and
Ziv, 2003), same meaning said (Givoni, 1998), (Spronken-Smith and Oke, 1998) found
that PCI intensity could be 3-5 C in Sacramento and (Spronken-Smith and Oke, 1999)
investigated diurnal PCI where wittedness is essential after sunset to daytime PCI to take
effect while dimensions of the park have to be 2.2-3.5 the height of the border trees at
minimum, (Chudnovsky et al, 2004), (Waziry, 2004) argued for same, where cooling
effect from shading decreases the energy demand for mechanical cooling at day time and
stimulates nocturnal cooling effect and long wave radiation depending on the sky view
factor SVF and the open area exposed to open air, as SVF increases radiant cooling effect
increases (Rosenfeld et. al., 1995) specially at residential areas (Huang, Akbari, Taha
and Rosenfeld, 1987), to generate cooling breezes from parks to the near fabric (Eliasson
and Upmanis, 2000), to improve air quality, (Akbari et. al., 2001), and (Murakami, 2006)
demonstrated that parks and vegetation have a magnificent role in increasing health
quality, thermal stress reductions and aesthetic benefits. (Lam, et al, 2005) found that
parks and open spaces in Hong Kong have their effect in reducing the noise effect and
increasing air quality and (Gidlof-Gunnarsson and Ohrstrom, 2007) found in a
questionnaire analysis the potential of noise reduction while increasing quality of life
near green spaces.
d gardens are related to the planning communities’ scales, (Oke,
1989), i.e. city has to have its park/s, Town has to have its park/s, Community/district has
to have its garden/s, each group of buildings
blocks has to have its garden /s and each block or single building has to have its garden/s,
figure (19/a, b) which introduces a shape of cooling nodes network allover the urban
planning community. Values of Urban parks are many:
vides urban spaces and canyon types with ordered modules.
2- Cleans environment and upgrade air quality.
3- Acts as wind barriers regarding the kid of trees used.
Scales of parks an
have its park/s, neighborhood/village has to
1- It pro
4- It is an important element for shading, direct gain diffusion, evaporative and
nocturnal cooling. In total as cooling node.
5- Stimulates the environment for human psychological adaptation.
A total passive cooling evaluation for an arid city urban planning can refer to
that as green equity distribution on the transect tool (Greensect) F that can be
considered as an item of the passive cooling evaluation for the unit urban planning of
a city urban planning and smart growth.
New expression in field.
Proceedings of the 7th ICCAE Conf. 27 -29 May, 2008
578
ty
l.,
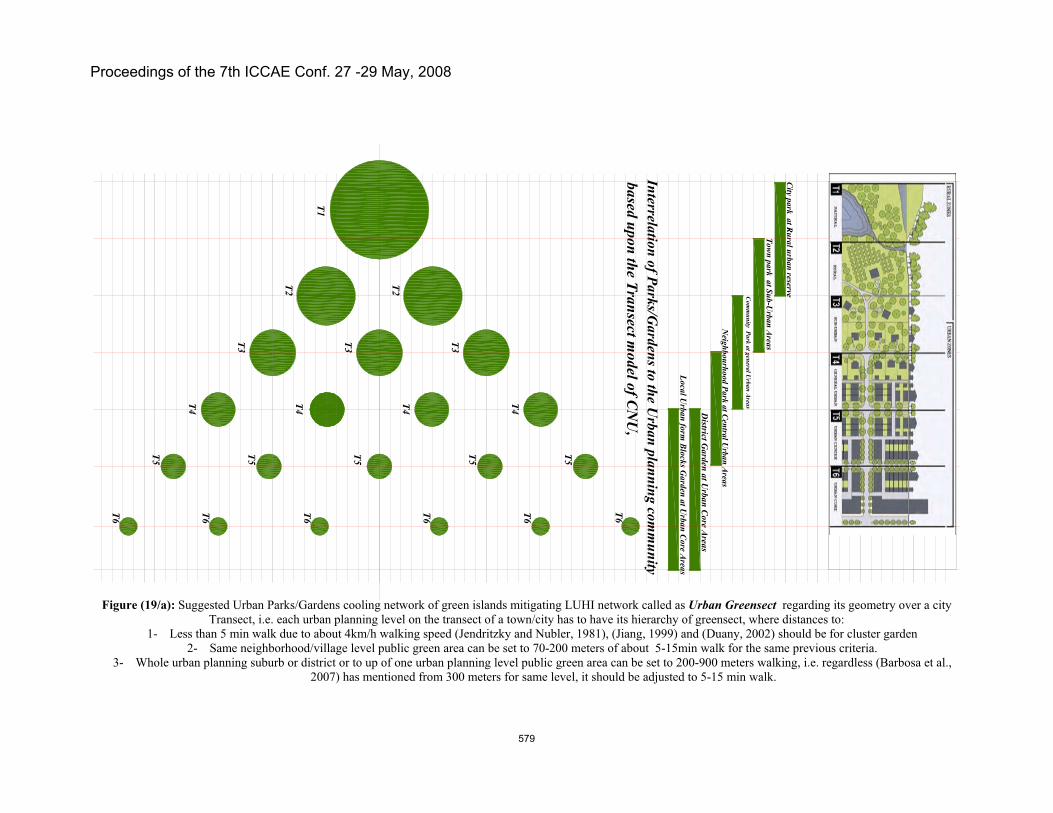
Figure (19/a): Suggested Urban Parks/Gardens cooling network of green islands mitigating LUHI network c a e rega i ci
Transect, i.e. each urban planning level on the transect of a town/city has to have its hie ens dist to
1- Less than 5 min walk due to about 4km/h walking speed (Jendritzky and Nubler, 1981), (Jiang, Duany, 2 should be fo
2- Same neighborhood/village level public green area can be set to 70-200 meters of abou alk for th me previous
3- Whole urban planning suburb or district or to up of one urban planning level public green area can be s 00 meters king, i.e. reg a
2007) has mentioned from 300 meters for same level, it should be a 15 min
alled as Urb
rarchy of gre
1999) and (
t 5-15min w
et to 200-9
djusted to 5-
n Gre nsect
ect, where
002)
e sa
wal
walk.
rding
ances
ts geometry over a
:
r cluster garden
criteria.
ardless (Barbosa et
Proceedings of the 7th ICCAE Conf. 27 -29 May, 2008
579
Proceedings of the 7th
ICCAE Conf. 27 -29 May, 2008
31
4- Small town/community level public green area; double to the previous level, i.e. about 2000 meters, i.e. in about 30 min that shouldn't be walked after this level.
5- Town level public park area; up to double to the previous level of 5000 meters.
6- City level Public Park double to the previous level of 10000 meters.
7- Capital or regional park level up to double to the previous level of 20000 meters.
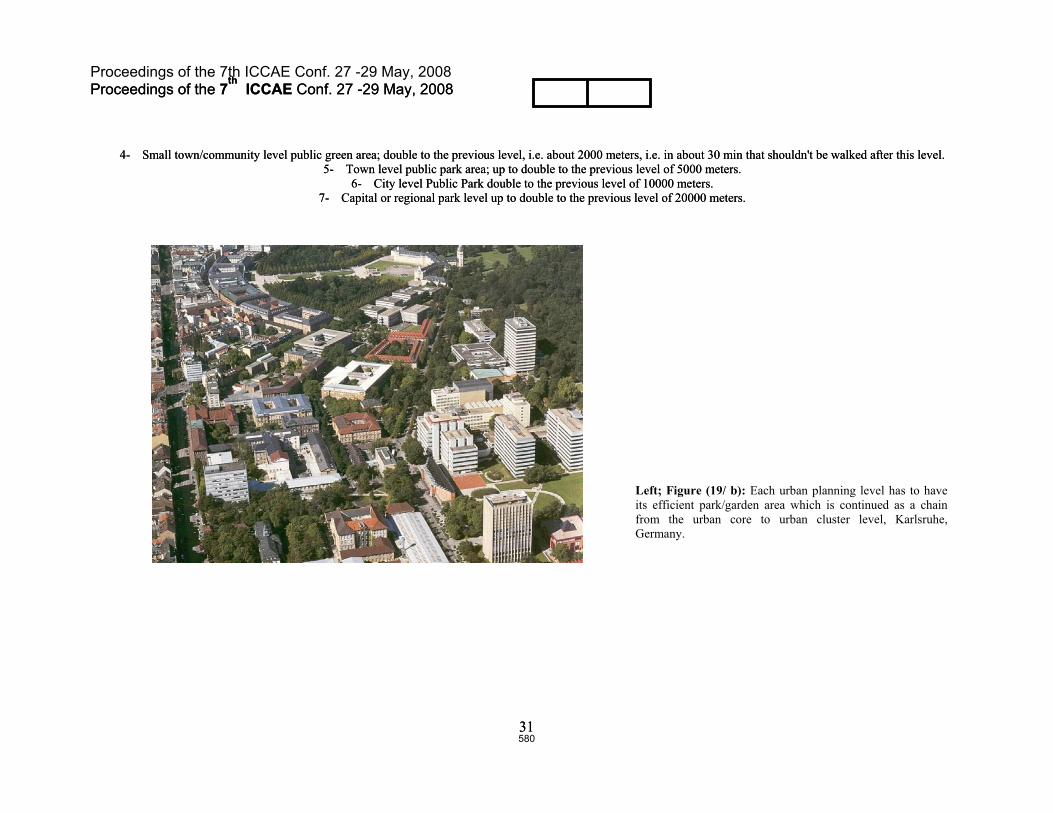
Left; Figure (19/ b): Each urban planning level has to have
its efficient park/garden area which is continued as a chain
from the urban core to urban cluster level, Karlsruhe,
Germany.
Proceedings of the 7th ICCAE Conf. 27 -29 May, 2008
580
6-5 Minor urban cooling nods:
It is meant that a small cooling node within building block (not a
le building) can provide a local cooling for that blo h can be considered as
minor unit of the urban cooling pattern allover the urban planning pattern.
voni, 1998) citied that attached open spaces, enclos i enclosed, patios and
rnal courtyards enhance the interactions between indoor and outdoor (which is
led positive negative spaces and could be due to the design details of buildings cks in contact to a local urban space). Those minor cooling nodes are the roof
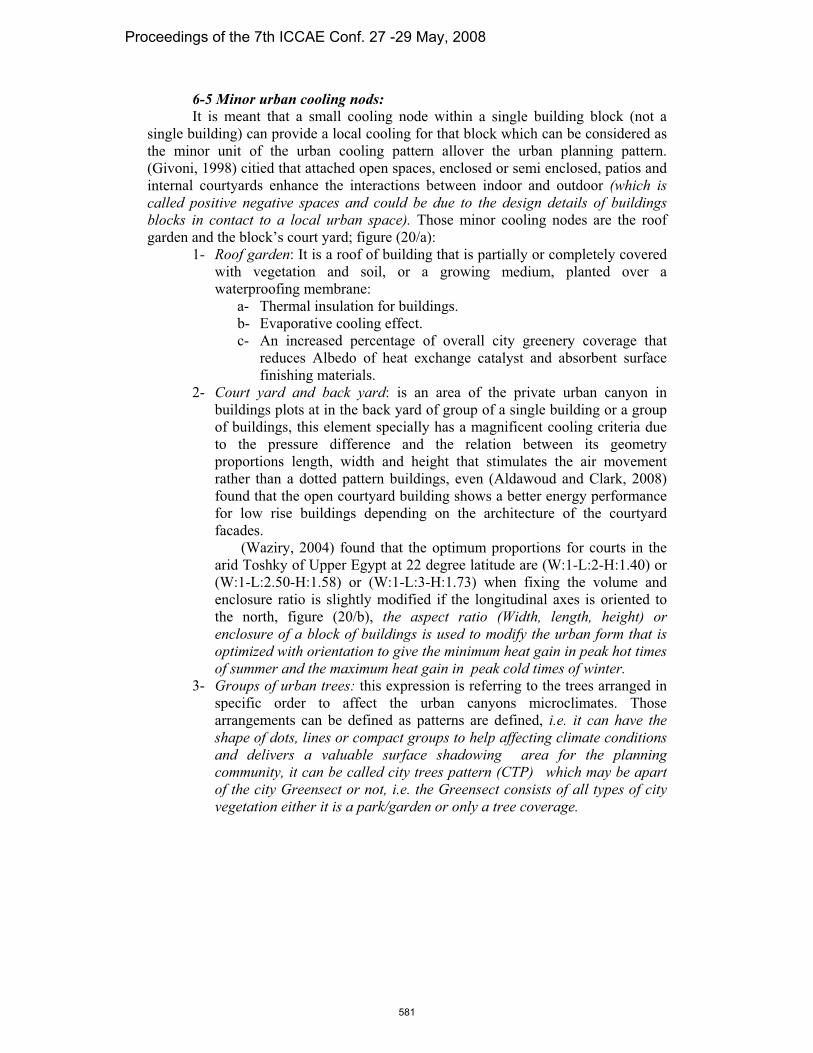
den and the block’s court yard; figure (20/a):
1- Roof garden: It is a roof of building that is or completely covered
with vegetation and soil, or a growin um, planted over a
waterproofing membrane:
a- Thermal insulation for buildings.
b- Evaporative cooling effect.
c- An increased percentage of overall city greenery coverage that
reduces Albedo of heat exchange and absorbent surface
finishing materials.
Court yard and back yard: is an area of the private urban canyon in
buildings plots at in the back yard of group of a single building or a group
of buildings, this element specially has a magnificent cooling criteria due
to the pressure difference and the relation between its geometry
proportions length, width and height that stimulates the air movement
rather than a dotted pattern buildings, even (Aldawoud and Clark, 2008)
found that the open courtyard building shows a better energy performance
for low rise buildings depending on the architecture of the courtyard
facades.
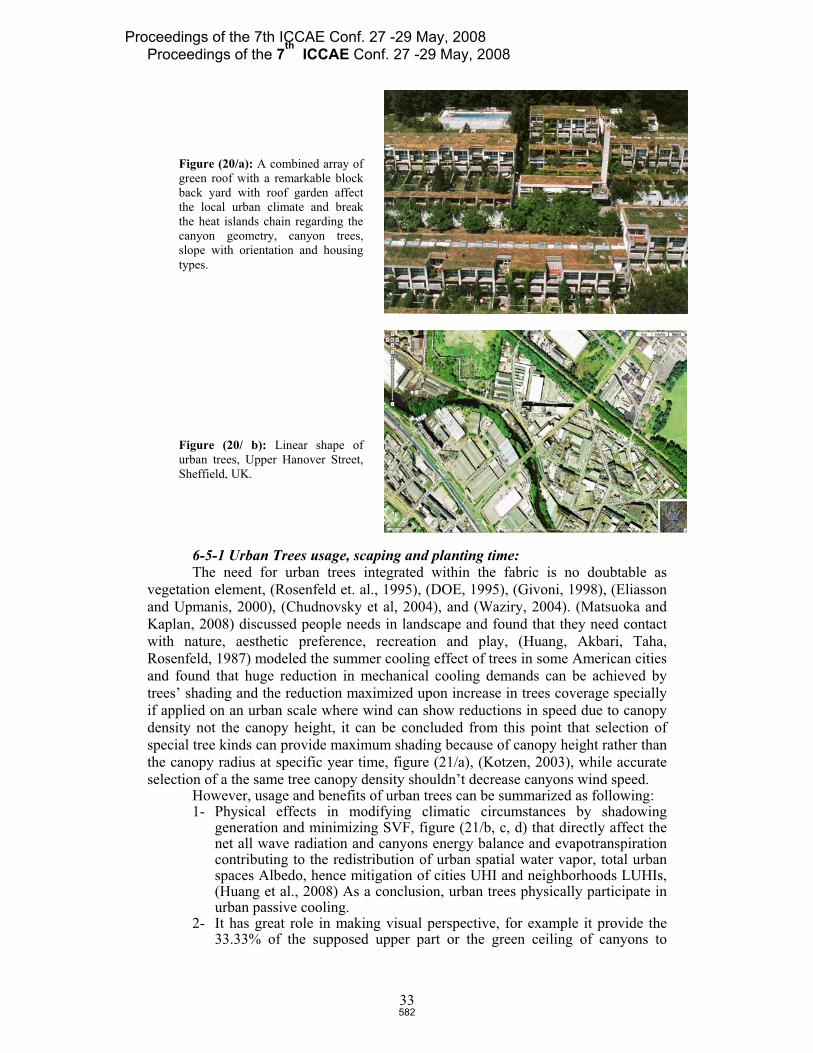
(Waziry, 2004) found that the optimum proportions for courts in the
arid Toshky of Upper Egypt at 22 degree latitude are (W:1-L:2-H:1.40) or
(W:1-L:2.50-H:1.58) or (W:1-L:3-H:1.73) when fixing the volume and
enclosure ratio is slightly modified if the longitudinal axes is oriented to
the north, figure (20/b), the aspect ratio (Width, length, height) or
enclosure of a block of buildings is used to modify the urban form that is
optimized with orientation to give the minimum heat gain in peak hot times
of summer and the maximum heat gain in peak cold times of winter.Groups of urban trees: this expression is referring to the trees arranged in
specific order to affect the urban canyons microclimates. Those
arrangements can be defined as patterns are defined, i.e. it can have the
shape of dots, lines or compact groups to help affecting climate conditions
and delivers a valuable surface shadowing area for the planning
community, it can be called city trees pattern (CTP) which may be apart
of the city Greensect or not, i.e. the Greensect consists of all types of city
vegetation either it is a park/garden or only a tree coverage.
si
a single
ck whic
ed or sem
partially
g medi
catalyst
ng
the
(Gi
inte
calblo
gar
2-
3-
Proceedings of the 7th ICCAE Conf. 27 -29 May, 2008
581
Proceedings of the 7th
ICCAE Conf. 27 -29 May, 2008
33
Figure (20/a): A combined array of
green roof with a remarkable block
back yard with roof garden affect
the local urban climate and break
the heat islands chain regarding the
canyon geometry, canyon trees,
slope with orientation and housing
types.
Figure (20/ b): Linear shape of
urban trees, Upper Hanover Street,
Sheffield, UK.
6-5 The
vegetation
and Upma
Kaplan, 20
with natu
Rosenfeld,
if
de
sp
the
sel
y shadowing generation and minimizing SVF, figure (21/b, c, d) that directly affect the net all wave radiation and canyons energy balance and evapotranspiration contributing to the redistribution of urban spatial water vapor, total urban spaces Albedo, hence mitigation of cities UHI and neighborhoods LUHIs, (Huang et al., 2008) As a conclusion, urban trees physically participate in urban passive cooling.
2- It has great role in making visual perspective, for example it provide the 33.33% of the supposed upper part or the green ceiling of canyons to
-1 Urban Trees usage, scaping and planting time: need for urban trees integrated within the fabric is no doubtable as
element, (Rosenfeld et. al., 1995), (DOE, 1995), (Givoni, 1998), (Eliasson
nis, 2000), (Chudnovsky et al, 2004), and (Waziry, 2004). (Matsuoka and
08) discussed people needs in landscape and found that they need contact
re, aesthetic preference, recreation and play, (Huang, Akbari, Taha,
1987) modeled the summer cooling effect of trees in some American cities
and found that huge reduction in mechanical cooling demands can be achieved by
trees’ shading and the reduction maximized upon increase in trees coverage specially
applied on an urban scale where wind can show reductions in speed due to canopy
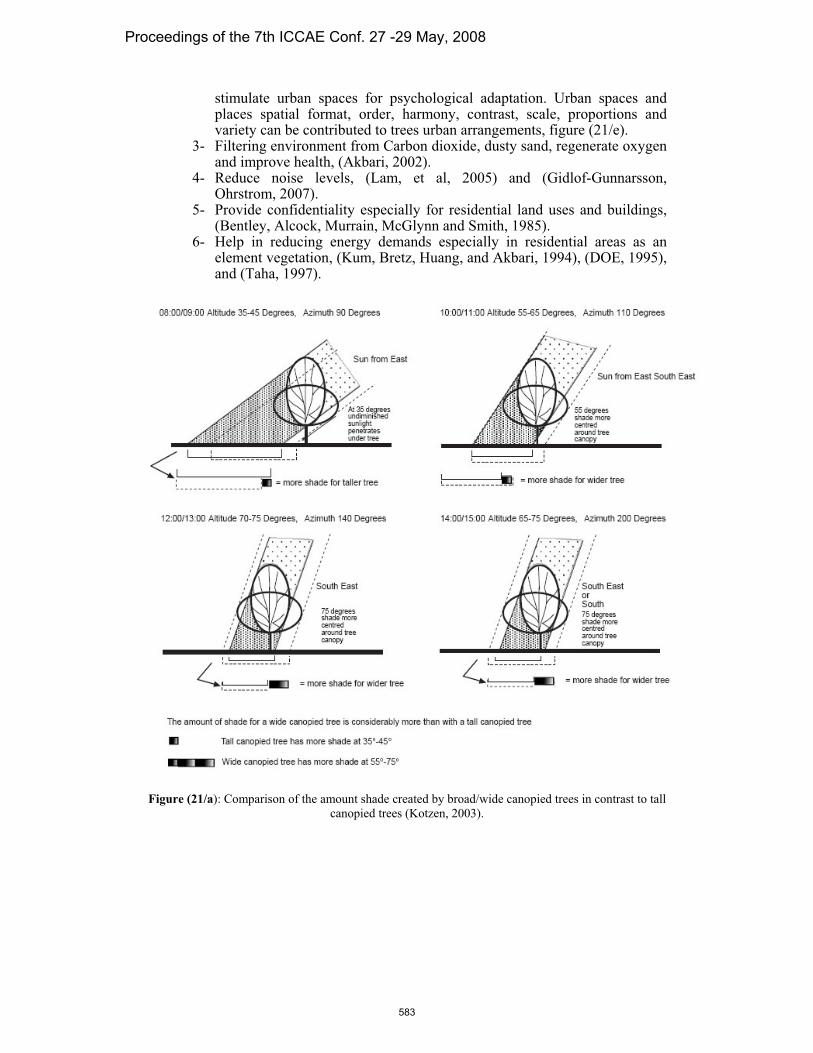
nsity not the canopy height, it can be concluded from this point that selection of
ecial tree kinds can provide maximum shading because of canopy height rather than
canopy radius at specific year time, figure (21/a), (Kotzen, 2003), while accurate
ection of a the same tree canopy density shouldn’t decrease canyons wind speed. However, usage and benefits of urban trees can be summarized as following: 1- Physical effects in modifying climatic circumstances b
Proceedings of the 7th ICCAE Conf. 27 -29 May, 2008
582
stimulate urban spaces for psychological adaptation. Urban spaces and places spatial format, order, harmony, contrast, scale, proportions and variety can be contributed to trees urban arrangements, figure (21/e).
3- Filtering environment from Carbon dioxide, dusty sand, regenerate oxygen ari, 2002). Lam, et al, 2005) and (Gidlof-Gunnarsson,
pecially for residential land uses and buildings, McGlynn and Smith, 1985). demands especially in residential areas as an
, Bretz, Huang, and Akbari, 1994), (DOE, 1995), and (Taha, 1997).
and improve health, (Akb4- Reduce noise levels, (
Ohrstrom, 2007). 5- Provide confidentiality es
(Bentley, Alcock, Murrain,6- Help in reducing energy
element vegetation, (Kum
F 21/a): Comparison of the amount shade created by broad/wide canopied trees in contrast to taligure ( l
canopied trees (Kotzen, 2003).
Proceedings of the 7th ICCAE Conf. 27 -29 May, 2008
583
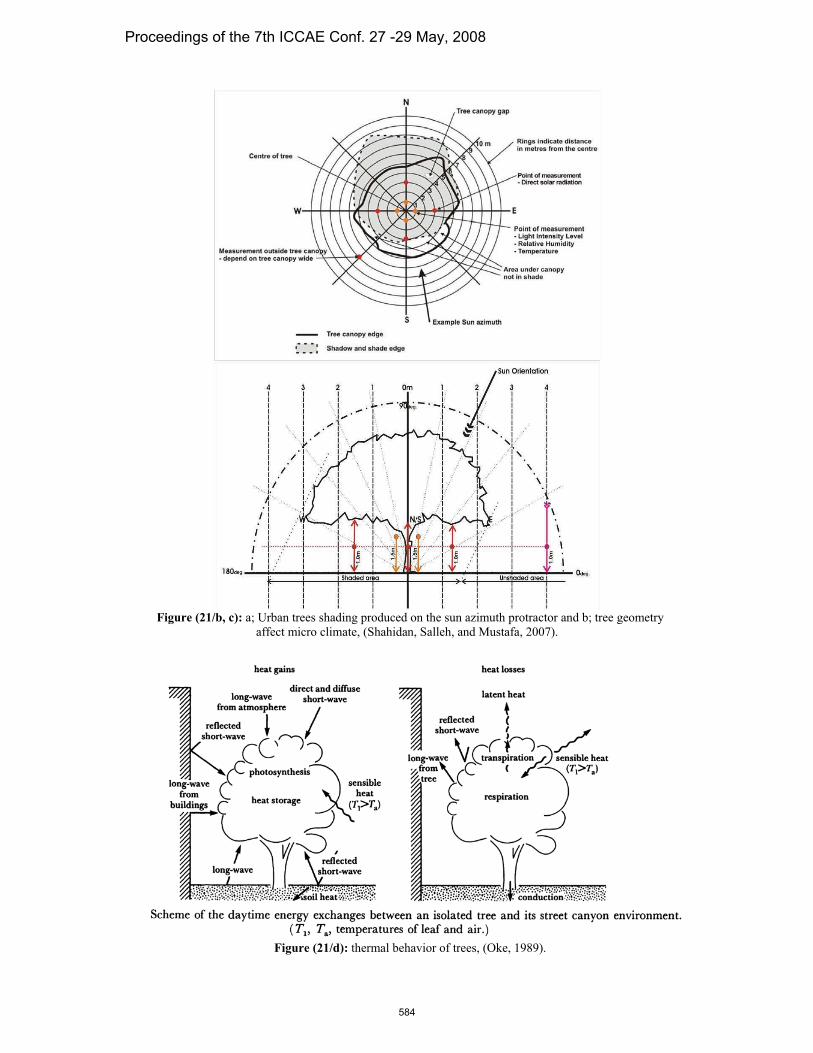
Figure (21/b, c): a; Urban trees shading produced on the sun azimuth protractor and b; tree geometry
affect micro climate, (Shahidan, Salleh, and Mustafa, 2007).
Figure (21/d): thermal behavior of trees, (Oke, 1989).
Proceedings of the 7th ICCAE Conf. 27 -29 May, 2008
584
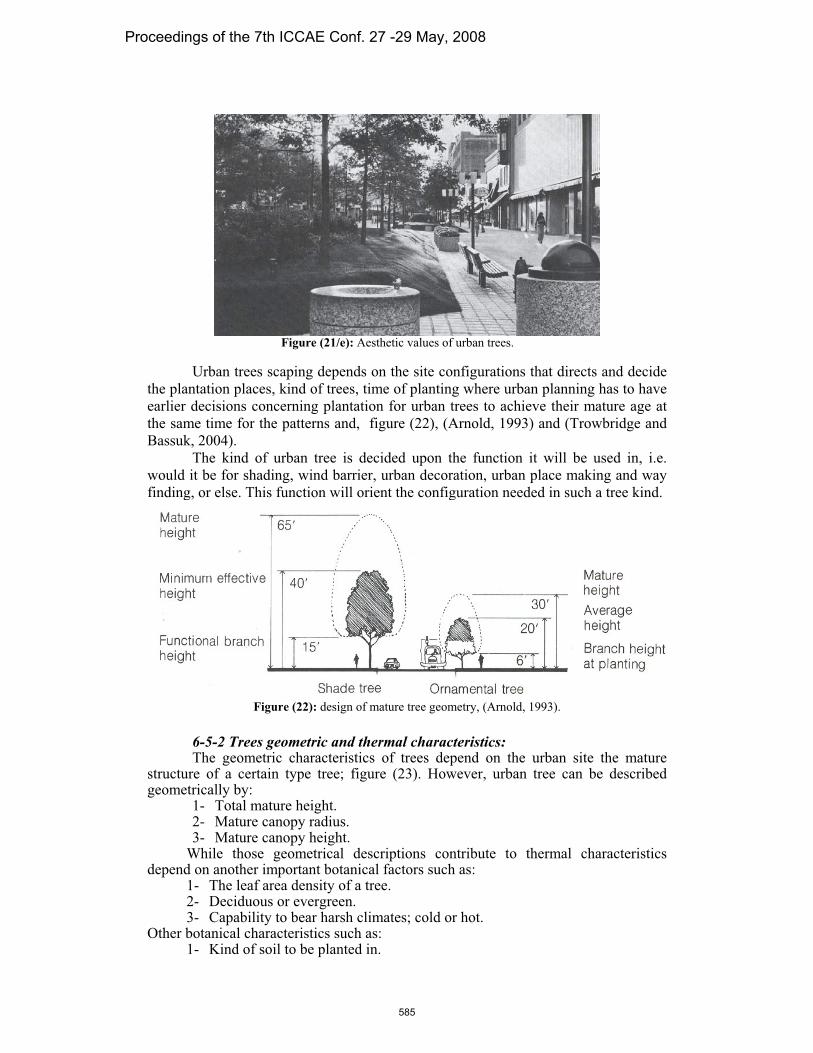
Figure (21/e): Aesthetic values of urban trees.
Urban trees scaping depends on the site configurations that directs and decide
the plantation places, kind of trees, time of planting where urban planning has to have
earlier decisions concerning plantation for urban trees to achieve their mature age at
the same time for the patterns and, figure (22), (Arnold, 1993) and (Trowbridge and
Bassuk, 2004).
The kind of urban tree is decided upon the function it will be used in, i.e.
would it be for shading, wind barrier, urban decoration, urban place making and way
finding, or else. This function will orient the configuration needed in such a tree kind.
Figure (22): design of mature tree geometry, (Arnold, 1993).
6-5-2 Trees geometric and thermal characteristics: The geometric characteristics of trees depend on the urban site the mature structure of a certain type tree; figure (23). However, urban tree can be described geometrically by:
1- Total mature height. 2- Mature canopy radius. 3- Mature canopy height.
While those geometrical descriptions contribute to thermal characteristics depend on another important botanical factors such as:
1- The leaf area density of a tree. 2- Deciduous or evergreen. 3- Capability to bear harsh climates; cold or hot.
Other botanical characteristics such as: 1- Kind of soil to be planted in.
Proceedings of the 7th ICCAE Conf. 27 -29 May, 2008
585
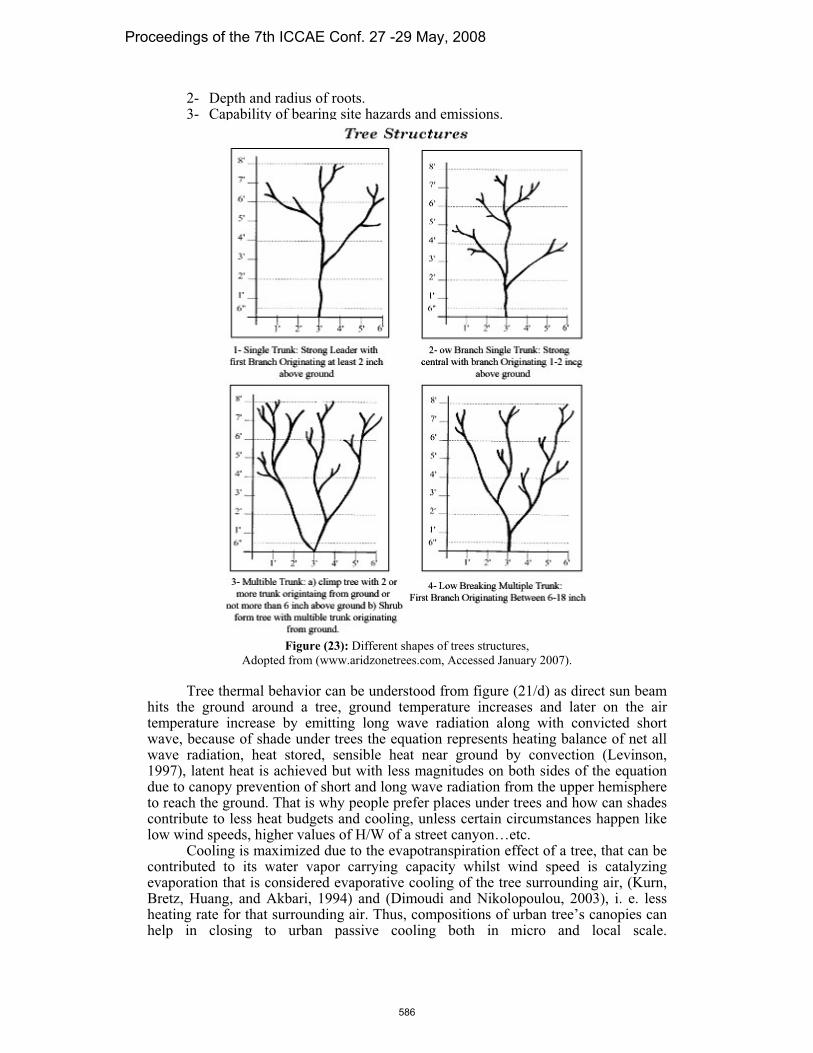
2- Depth and radius of roots. 3- Capability of bearing site hazards and emissions.
Figure (23): Different shapes of trees structures,
Adopted from (www.aridzonetrees.com, Accessed January 2007).
Tree thermal behavior can be understood from figure (21/d) as direct sun beam hits the ground later on the air temperature increase by emitting long wave radiation along with convicted short wave, b heating balance of net all
people prefer places under trees and how can shades cooling, unless certain circumstances happen like /W of a street canyon…etc.
ilst wind speed is catalyzing e cooling of the tree surrounding air, (Kurn,
nd (Dimoudi and Nikolopoulou, 2003), i. e. less of urban tree’s canopies can
around a tree, ground temperature increases and
ecause of shade under trees the equation represents wave radiation, heat stored, sensible heat near ground by convection (Levinson, 1997), latent heat is achieved but with less magnitudes on both sides of the equation due to canopy prevention of short and long wave radiation from the upper hemisphere to reach the ground. That is whycontribute to less heat budgets andlow wind speeds, higher values of H
Cooling is maximized due to the evapotranspiration effect of a tree, that can be contributed to its water vapor carrying capacity whevaporation that is considered evaporativBretz, Huang, and Akbari, 1994) aheating rate for that surrounding air. Thus, compositions
cooling both in micro and local scale. help in closing to urban passive
Proceedings of the 7th ICCAE Conf. 27 -29 May, 2008
586
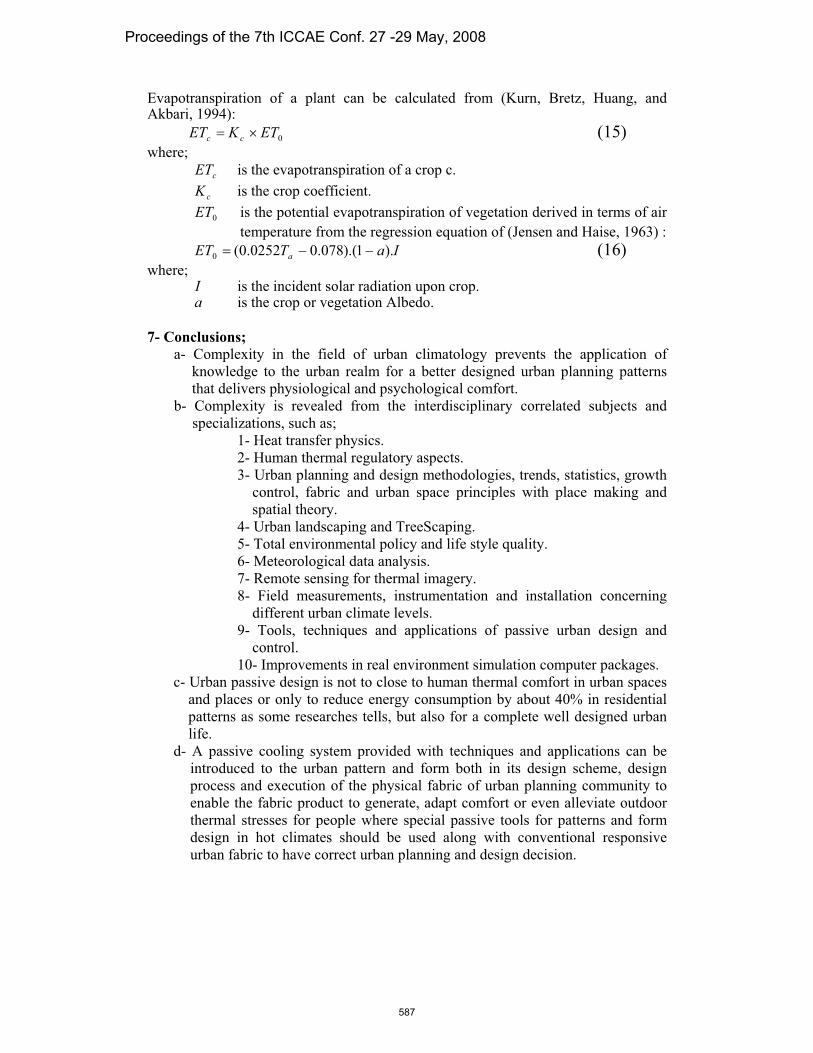
Evapotranspiration of a plant can be calculated from (Kurn, Bretz, Huang, and
(15) where;
is the evapotranspiration of a crop c.
is the crop coefficient.
is the potential evapotranspiration of vegetation derived in terms of air
temperature from the regression equation of (Jensen and Haise, 1963) :
Akbari, 1994):
0ETKET cc
cET
cK
0ET
IaTET a ).1).(078.00252.0(0 (16)where;
Ia
is the incident solar radiation upon crop. is the crop or vegetation Albedo.
7- Conclusions;
a- Complexity in the field of urban climatology prevents the application of
knowledge to the urban realm for a better designed urban planning patterns
that delivers physiological and psychological comfort.
b- Complexity is revealed from the interdisciplinary correlated subjects and
specializations, such as;
1- Heat transfer physics.
2- Human thermal regulatory aspects.
3- Urban planning and design methodologies, trends, statistics, growth
control, fabric and urban space principles with place making and
spatial theory.
4- Urban landscaping and TreeScaping.
5- Total environmental policy and life style quality.
6- Meteorological data analysis.
7- Remote sensing for thermal imagery.
8- Field measurements, instrumentation and installation concerning
different urban climate levels.
9- Tools, techniques and applications of passive urban design and
contr
1 ter packages.
c-
ol.
0- Improvements in real environment simulation compu
Urban passive design is not to close to human thermal comfort in urban spaces
and places or only to reduce energy consumption by about 40% in residential
patterns as some researches tells, but also for a complete well designed urban
life.
d- A passive cooling system provided with techniques and applications can be
introduced to the urban pattern and form both in its design scheme, design
process and execution of the physical fabric of urban planning community to
enable the fabric product to generate, adapt comfort or even alleviate outdoor
thermal stresses for people where special passive tools for patterns and form
design in hot climates should be used along with conventional responsive
urban fabric to have correct urban planning and design decision.
Proceedings of the 7th ICCAE Conf. 27 -29 May, 2008
587
Proceedings of the 7th
ICCAE Conf. 27 -29 May, 2008
39
8- References:
Aben, R. (2001). "The E
ott dkbari, H. (2 0 use and CO2 emissions from power
plants." 16, S119-S126. kbari, H., P m
Ener y UAldawoud, A., a
courtyard and atrium in buildings." Enert, F. (2005). "Dependence of Out
any. the effects of aspect ratio and
or ntatclimate." Building and Environment, 41, 94-108.
d Mayer, H. (2007). "Thermal comfort in an east-west oriented street
ArnfieldInternational Journal of
Arnold, H. F. (1980). "Trees in urban design." Asaeda, T., and Ca, V. T. (1993). "The subsurface transport of heat and moisture and its
effect o Boundary-Layer Meteorology, 65, 159-179
Asaeda, T., Ca,lower atmo
ASHRAE (1981). "ASHRAE Standard 55-1981; Theroccupa efrigerating, and Air-Conditioning Enginee
Barbosa, O., Tr ., Johnson, P., and GastonSheffiel -3), 187-195.
Bitan, A. (1988)and Bui
Brager, G. S., areview."
Brazel, W. S., and Balling, R. J. (1986). "Temporal analysis of long term atmospheric moisture levels in
Brus
Bruse,n Climate Model." www.envi-met.com.
Chu
Davis, Cde-Dea
DePaul
imoud Environments:Microclimatic Analysis and Benefits." Energy and Buildings, 35, 69-76.
uany, A. (2002). "Introduction to the Special Issue: The Transect." Journal of Urban Design,7(3), 251–260.
liasson, I. (2000). "The use of climate knowledge in urban planning." Landscape and urban planning 48(1-2), 31-44.
nclosed Garden, history and development of the hortus conclusus urban landscape." Book, 010 Publishers, and its reintroduction into the present-day
R er am.A 0 2). "Shade trees reduce building energy
Environmental Pollution 1A o erantz, M., and Taha, H. (2001). "Cool surfaces and Shade Trees to Reduce
g se and Improve Air Quality in Urban Areas." Solar Energy, 70(3), 295-310. nd Clark, R. (2008). "Comparative analysis of energy performance between
ergy and Buildings, 40, 209-214. Door Thermal Comfort on the Street Design inAli-Toud
Hot and Dry Climate." PhD Thesis, Institute of Meteorology, Freiburg, GermAli-Toudert, F., and Mayer, H. (2006). "Numerical study on
ie ion of an urban street canyon on outdoor thermal comfort in hot and dry
Ali-Toudert, F., ancanyon in Freiburg (Germany) under hot summer conditions." Theoretical and Applied Climatology, 87(1-4), 223-237. , A. J. (2003). "Two Decades of Urban Climate Research: A review of Turbulence, Exchange of Energy, Water and the urban heat islands."Climatology, 23(1), 1-26.
Book, Van Nostrand Reinhold, New York.
n the environment: A numerical model." . V. T., and Wake, A. (1996). "Heat Storage of Pavement and its effect on the
sphere." Atmospheric Environment, 30, 413-427. mal environmental conditions f or human
ncy." Atlanta: American Society of Heating, rrs Inc.
atalos, J. A., Armsworth, P. R., Davies, R. G., Fuller, R. A, K. J. (2007). "Who benefits from access to green space? A case study from d, UK." Landscape and Urban Planning, 83(2. "The Methodology of Applied Climatology in Planning and Building." Energyldings, 11(1), 1-10.
Dear, R. J. d. (1998). "Thermal adnd aptation in built environment: a literature Energy and Buildings, 27, 83-96.
Phoenix, Arizona." Journal of Applied Meteorology, 25(2), 112-117. e, M., and Fleer, H. (1998). "Simulating Surface-Plant-Air Interactions inside Urban
Environments with a Three Dimensional Numerical Model." Environmental Software and Modeling, 13(3-4), 373-384.
M. (2008). "ENVI-met V3.1 © Michael Bruse 1997-2008 Build 3.1.0.9; A Microscale Urba
dnovsky, A., Dor, E. B., and Saaroni, H. (2004). "Diurnal thermal behavior of selected urban objects using remote sensing measurements." Energy and Buildings, 36(11), 1063-1074.. J. (1997). "Improving Design in High Street." Book, Architectural Press, Oxford.
r, R. J., and Brager, G. S. (1998). "Developing an Adaptive Model of Thermal Comfort and Preference." ASHRAE Transactions 104 (part no.1a), 145-167.
, F. T., and Shieh, C. M. (1986). "Measurements of wind velocity in a street canyon." Atmospheric Environment, 20(3), 455-459. i, A., and Nikolopoulou, M. (2003). "Vegetation in the Urban D
D
E
Proceedings of the 7th ICCAE Conf. 27 -29 May, 2008
588
Proceedings of the 7th
ICCAE Conf. 27 -29 May, 2008
40
Eliasson, I., Knez, I., and Westerberg, U. (2007). "Climate and Behavior in a Nordic City."
on." Theoretical and Applied Climatology, 66, 95-107.
(3-4), 1025-1049.
cture
Fahmy,
: a comparison of implementations in two PBL
Fanger,
Gagge, A. P., Fobelets, A. P., and Berglund, L. G. (1986). "Standard Predictive Index of
Gagge,
, 35(1), 77-86.
Golany,
rnal of Applied Meteorology, 38(9), 1262-
Grimmo s: Local-scale
al-Scale Urban Meteorological Parameterization Scheme , 41(7), 792-810.
Landscape and urban Planning, 82, 72-84. Eliasson, I., and Upmanis, H. (2000). "Nocturnal Airflow from Urban Parks-Implications for
City VentilatiEllefsen, R. (1990/1991). "Mapping and measuring buildings in the urban canopy boundary
layer in ten US cities." Energy and Buildings, 15-16Evans, J. M. (2003). "Evaluating comfort with varying temperatures: a graphic design tool."
Energy and Buildings, 35(1), 87-93. Evans, J. M. (2007). "The Comfort Triangles: A New Tool for Bioclimatic Design." PhD Thesis,
Technische Universiteit Delft.Fahmy, M. (2001). "Integration of Solar Energy Applications with the Architecture Design of
Residential Buildings at Hot Arid Zones." M. Sc. Thesis in Arabic, ArchiteDepartment, Military Technical Collage MTC, Cairo. M. (2007). "Urban and Architectural Conservation for Historical Commercial Avenues in Cairo " M. Sc. Thesis in Arabic, Department of Architecture, Ain Shams University, Cairo.
Fan, H., and Sailor, D. J. (2005). "Modeling the impacts of anthropogenic heating on the urban climate of Philadelphiaschemes." Atmospheric Environment, 39(1), 73-84. P. O. (1972). "Thermal comfort; Analysis and applications in environmental engineering." Book, McGraw-Hill, New York, first published in 1970, Danish Technical Press, Copenhagen.
Fiala, D., Laschewski, G., and Jendritzky, G. (2005). "Comparison of human thermal and regulatory responses predicted by simple and multi-node complete heat budget models." 17th International Congress of Biometeorology, ICB2005, Garmisch-Partenkirchen, Bavaria, Germany, 5-9 September.
Fiala, D., Lomas, K. J., and Stohrer, M. (2001). "Computer prediction of human thermoregulatory and temperature responses to a wide range of environmental conditions." International journal of biometreology, 45(143-159).
Human Response to the Thermal Environment." ASHRAE Transactions, 92 (part no.2B), 709-731.
A. P., Stolwijk, J. A., and Hardy, J. D. (1967). "Comfort and Thermal Sensations and Associated Physiological Responses at Various Ambient Temperatures." Journal of Environmental Research, 1(1), 1-20.
Givoni, B. (1963). "Estimation of the effect of climate on man; development of a new thermal index." M. Sc. Thesis, Hebrew University, Jerusalem.
Givoni, B. (1969). "Man, Climate and Architecture." Book, Elsevier Ltd., London.Givoni, B. (1987). "The effect of heat capacity in direct gain buildings." Passive Solar Energy,
4(1), 25-40. Givoni, B. (1998). "Climate consideration in urban and building design." Book, Van Nostrand
Reinhold, New York.Givoni, B., Noguchi, M., Saaroni, H., Pochter, O., Yaacov, Y., Feller, N., and Becker, S.
(2003). "Outdoor comfort research issues." Energy and BuildingsGivoni, B. (2007). "Cooled soil as a cooling source for buildings." Solar Energy Science and
Engineering, 81(3), 316-328. G. (1978). "Editor of; Planning Urban Sites in Arid Zones, the basic considerations." Book, John Wiley & Sons, New York.
Golany, G. (1996). "Urban design morphology and Thermal performance." Atmospheric Environment, 30(3), 455-465.
Grimmound, C. S. B., and Oke, T. R. (1999). "Aerodynamic Properties of Urban Areas Derived from Analysis of Surface Form." Jou1292.und, C. S. B., and Oke, T. R. (1999). "Heat storage in urban areaobservations and evaluation of a simple model." Journal of Applied Meteorology,38(7), 922-940.
Grimmound, C. S. B., and Oke, T. R. (2002). "Turbulent Heat Fluxes in Urban Areas - Observations and a Loc(LUMPS)." Journal of Applied Meteorology
Proceedings of the 7th ICCAE Conf. 27 -29 May, 2008
589
Proceedings of the 7th
ICCAE Conf. 27 -29 May, 2008
41
Gunnarsson, A. G., and Ohrstrom, E. (2007). "Noise and well-being in urban residential
environments: The potential role of perceived availability to nearby green areas." Landscape and Urban Planning, 83, 115-126.
S. L., Brazel, A. J., Prashad, L., Stefanov, W. L., and LHarlan, arsen, L. (2006). d
rgy and Buildings, 34(6), 607-614.
4), 309-316.
eorology, 43(2), 71-75.
Huang, study on the diurnal changes of
Huang, Y. J., Akbari, H., Taha, H., and Rosenfeld, A. H. (1987). "The Potential of Vegetation
Humphd Buildings, 34, 667-684.
ionalpart
Arrays of identical roughness elements and the effect of the frontal
ISO773 nments determination of the PMV and PPD
International
ISOStandard7730. (1994). "Moderate thermal environments determination of the PMV and
n, Geneva, Switzerland.
s of
" 15th Conf. Biomet. Aerobiol. and 16th ICB02,
Jendritz "A model analysing the urban thermal environment in
Jensen, R., and Haise, H. (1963). "Estimating evapotranspiration of a plant from Solar
Jiang, B. (1999). "Sim Ped: Simulating pedestrian Flows in a virtual Urban Environment."
"Neighborhood microclimates and vulnerability to heat stress." Social science anMedicine, 63(11), 2847-2863.
Heidari, S., and Sharples, S. (2002). "A comparative analysis of short-term and long-term thermal comfort surveys in Iran." Ene
Hensen, J. L. M. (1990). "Literature review on thermal comfort in transient conditions." Building and Environment, 25(
Holmer, B., and Eliasson, I. (1999). "Urban-rural vapor pressure differences and their role in the development of urban heat islands." International Journal of Climatology, 19(9), 989-1009.
Hoppe, P. (1999). "The physiological equivalent temperature - a universal index for the biometeorological assessment of the thermal environment." International Journal of Biomet
Hoppe, P. (2002). "Different aspects of assessing indoor and outdoor thermal comfort." Energy and Buildings, 34(6), 661-665.
L., Li, J., Zhao, D., and Zhu, J. (2008). "A fieldworkurban microclimate in four types of ground cover and urban heat island of Nanjing, China." Building and Environment 43(1), 7-17.
in Reducing Summer Cooling Loads in Residential Buildings." Journal of Climate and Applied Meteorology, 26, 1103-1116.
reys, M. A., and Nicol, J. F. (2002). "The validity of ISO-PMV for predicting comfort votes in everyday thermal environments." Energy an
Humphreys, M. A., Nicol, J. F., Raja, I. A., and (2007). "Field Studies of Indoor Thermal Comfort and the Progress of the Adaptive Approach." Journal of Advances in Building Energy Research, 1, 55-88.
Hussain, M., and Lee, B. E. (1980). "An investigation of wind forces on three dimensroughness elements in a simulated atmospheric boundary layer flow variations, II: Flow over Largeand side aspect ratio." PhD Thesis, Department of Building Science, Faculty of Architectural Studies, University of Sheffield.0. (1984). "Moderate thermal enviroindices and specifications of the conditions for thermal comfort." InternationalStandards Organization, Geneva, Switzerland.
ISO8996. (1990). "Ergonomics - determination of metabolic heat production." Standards Organization, Geneva, Switzerland.
PPD indices and specifications of the conditions for thermal comfort." InternationalStandards Organizatio
Jendritzky, G., Havenith, G., and (2005). "The Thermal Environment of the Human Being - A subjective retrospection on methodologies." 17th International CongresBiometeorology, ICB2005, Garmisch-Partenkirchen, Bavaria, Germany, 5-9 September.
Jendritzky, G., Maarouf, A., Fiala, D., and Staiger, H. (2002). "An Update on the Development of a Universal Thermal Climate Index.Kansas City 27 Oct - 1 Nov.ky, G., and Nübler, W. (1981).physiologically significant terms." Meteorology and Atmospheric Physics, 29(4), 313-326.
Radiation." Irrigation drainage division, American Society of Civil Engineers, 89, 15-41.
Geographic Information and Decision Analysis, 3, 21-29.
Proceedings of the 7th ICCAE Conf. 27 -29 May, 2008
590
Proceedings of the 7th
ICCAE Conf. 27 -29 May, 2008
42
Johansson, E. (2006). "Influence of Urban Geometry on Outdoor Thermal Comfort in a Hot
Dry Climate: A Case Study in Fez, Morocco." Building and Environment, 41(10), 1326-1338.
Kanda, M. (2006). "Progress in the scale modeling of urban climate: Review." Theoretical and Applied Climatology, 84(1), 23-33.
Koenigsberger, O. H., Mahoney, K., and Evans, J. M. (1970). "Climate and house design."
Kotzen, of the Negev
al of Arid environments, 55, 231-274.
rgy & Environment Division, Lawrence Berkeley Laboratory, University of
Lam, Kg Kong." Environmental Monitoring and Assessment
Landsb y Utopian City." Bulletin of the American
Landsb
awrence Berkeley Laboratory, University of
Mayer, ents."
McEVOMills, G. M. (1993). "Simulation of the Energy Budget of an Urban Canyon - I. Model Structure
Mills, G
Mitchell n and other animals. In: Monteith, J.L.,
Monteir of outdoor thermal comfort models."
Mought . (2000). "Urban Design: Method and
Muraka
Nahar, N. M., Sharma, P., and Purohit, M. M. (2003). "Performance of different passive
Nakamu 8). "Wind, Temperature and Stability Conditions in an
Nikolops: Understanding the Human parameter." Solar energy in the urban
Nikolop guide for designing urban spaces." Energy and Buildings, 35(1), 95-101.
and Environment, 41(11), 1455–1470.
Book, United Nations, New York. B. (2003). "An investigation of shade under six different tree species desert towards their potential use for enhancing micro-climatic conditions in landscape architectural development." Journ
Kum, D. M., Bretz, S. E., Huang, B., and Akbari, H. (1994). "The Potential for Reducing Urban Air Temperatures and Energy Consumption Through Vegetative Cooling." Heat Island Project EneCalifornia, Berkeley, CA 94720.
. C., Ng, S. L., Hui, W. C., and Chan, P. K. (2005). "Environmental Quality of Urban parks and open spaces in Hon111(1-3), 55-73.
erg, H. (1973). "The MeteorologicallMeteorological Society, 54(2), 86-89.
erg, H. E., and Maisel, T. N. (1972). "Micrometeorological Observations in an Area of Urban Growth." Boundary - Layer Meteorology, 2(1), 1-6.
Levinson, R. M. (1997). "Near-ground cooling efficacies of trees and high-Albedo surfaces." PhD Thesis, Department of Mechanical Engineering, University of California and Energy & Environment Division, LCalifornia, Berkeley, CA 94720.H., and Hoppe, P. (1987). "Thermal Comfort of Man in Different Urban EnvironmTheoretical and Applied Climatology, 38, -49. Y, D. (2007). "Climate Change and Cities." Built Environment, 33(15-9).
and Sensitivity Test,." Atmospheric Environment, 27B(2), 157-170. . M., and Arnfield, A. J. (1993). "Simulation of the Energy Budget of an Urban Canyon - II. Comparison of the Model Results with Measurements." Atmospheric Environment, 27B(2), 171-181. , D. (1974). "Convective heat transfer from maMount, L. E. (Eds.), "Heat Loss from animals and Man: Assessment and Control." Book, Butterworths, London.o, L. M., and Alucci, M. P. (2006). "CalibrationThe 23rd Conference on Passive and Low Energy Architecture, PLEA2006. Geneva, Switzerland, 6-8 September.
Monteith, J. L. (1973). "Principles of environmental physics." Book, Edward Arnold Publishers, London.in, C., Cuesta, R., Sarris, C., and Signoretta, PTechnologies." Book, Architectural Press, London.mi, S. (2006). "Environmental design of outdoor climate based on CFD." FluidDynamics Research, 38, 108-126.
techniques for cooling of buildings in arid regions." Building and Environment, 38, 109-116.ra, Y., and Oke, T. R. (198East-West Oriented Urban Canyon." Atmospheric Environment, 22(12), 2691-2700. oulou, M., Baker, N., and Steemers, K. (2001). "Thermal comfort in outdoor urban spaceenvironment, 70(3), 227-235. oulou, M., and Steemers, K. (2003). "Thermal comfort and psychological adaptation as a
Nikolopoulou, M., and Lykoudis, S. (2006). "Thermal comfort in outdoor urban spaces: Analysis across different European countries." Building
Proceedings of the 7th ICCAE Conf. 27 -29 May, 2008
591

Proceedings of the 7th
ICCAE Conf. 27 -29 May, 2008
43
Nunez, M., and Oke, T. R. (1977). "The Energy Balance of an Urban Canyon." Journal of
Applied Meteorology, 16(1), 11-19. Oke, T. R. (1976). "The distinction between canopy and boundary-layer heat islands."
Oke, T. the nocturnal heat island: comparison of scale
Oke, T. R. (1984). "Towards a prescription for the greater use of climatic principles in
Oke, T.Oke, T. gs,
Oke, T.
Oke, T. representative meteorological observations at
Oke, T. R. (2006). "Towards better scientific communication in urban climate." Theoretical and
Oke, T. R., Zeuner, G., and Jauregui, E. (1992). "The Surface Energy Balance in Mexico
Olesen, l comfort standards and to
Olgyay,
Olgyay, ion method for buildings." International Journal of
Osczev d Chill Equivalent Temperature Chart."
-54.
Pearlmutter, D., Berliner, P., and Shaviv, E. (2006). "Physical modeling of pedestrian energy
Pearlmurt in urban street canyons." Building and Environment,
Pearlmuspheric Environment, 33(24-25), 4143 - 4150.
Scale Model." Journal of applied Meteorology, 44(4), 532-545.
,
Robaa, S. M. (2003). "Urban-Suburban/Rural differences over Greater Cairo, Egypt."
Rosenfeitigation of urban heat islands: materials, utility programs, updates." Energy
Roth, M
Saaron , O. (2000). "Spatial distribution and microscale
Atmosphere 14, 268-277. R. (1981). "Canyon geometry andmodel and field observations." Journal of Climatology, 1(3), 237-254.
settlement planning." Energy and Buildings, 7(1), 1-10. R. (1987). "Boundary layer climates." Book, Taylor &Francis e-Library, 2002. R. (1988). "Street Design and Urban Canopy Layer Climate." Energy and Buildin11(1-3), 103-113. R. (1989). "The Micrometeorology of Urban Forest." Philosophical Transactions of the Royal Society of London, Biological Sciences, 324(B), 335-349. R. (2004). "Initial guidance to obtain urban sites." IOM Report No. 81, WMO=TD No. 1250, Geneva: World Meteorological Organization.
Applied Climatology, 84, 179-190.
City." Atmospheric Environment, 26B(4), 433-444. B. W., and Parsons, K. C. (2002). "Introduction to thermathe proposed new version of EN ISO 7730." Energy and Buildings, 34, 537-548. V. (1963). "Design with climate; bioclimatic approach and architectural regionalism." Book, Princeton University Press, Princeton, New Jersey. V. (1967). "Bioclimatic orientatBiometeorology, 11(2), 163-174. ski, R., and Bluestein, M. (2005). "The New WinBulletin of American Metreological Society 86(10), 1453-1458.
Oseland, N. A. (1994). "A comparison of the predicted and reported thermal sensation vote in homes during winter and summer." Energy and Buildings, 21(1), 45
Oseland, N. A. (1995). "Predicted and reported thermal sensation in climate chambers, offices and homes." Energy and Buildings, 23, 105-115.
exchange within the urban canopy." Building and Environment, 41(6), 783-795. tter, D., Berliner, P., and Shaviv, E. (2007). "Integrated modeling of pedestrian energy exchange and thermal comfo42(6).tter, D., Bitan, A., and Berliner, P. (1999). "Microclimatic analysis of compact urban canyon in an arid zone." Atmo
Pearlmutter, D., and Shaviv, E. (2005). "Evaluation of Urban Surface Energy Fluxes Using an Open-Air
PRB. (2007). "World Population Highlights; Key findings from PRB's 2007 world population data sheet." Population Bulletin; a publication of the Population Reference Bureau62(3).
Atmosfera, Universidad Autonoma del Estado de Mexico, 16, 157-171. ld, A. H., Akbari, H., Bretz, S., Fishman, B. L., Kurn, D. M., Sailor, D., and Taha, H. (2001). "Mand Buildings, 22(3), 255-265. ., Oke, T. R., and Emery, W. J. (1989a). "Satellite derived urban heat islands fromthree coastal cities and the utilization of such data in urban climatology." Internationaljournal of remote sensing, 10 (11), 1699-1720.
i, H., Dor, E. B., Bitan, A., and Potchtercharacteristics of the urban heat island in Tel-Aviv." Landscape and Urban planning,48(1-2), 1-18.
Saaroni, H., and Ziv, B. (2003). "The impact of a small lake on heat stress in a Mediterranean urban park: the case of Tel Aviv." International journal of Biometeorology, 47, 156-165.
Proceedings of the 7th ICCAE Conf. 27 -29 May, 2008
592

Proceedings of the 7th
ICCAE Conf. 27 -29 May, 2008
44
Sailor, D. J., and Dietch, N. (2007). "The Urban heat island Mitigation Impact Screening Tool
(MIST)." Environmental Modeling Software, 22, 1529-1541.
acteristics in a deep pedestrian canyon under hot weather
Schiller to design with
Shahida s of Tree Canopies on Solar ence on
Shashu man, M. E. (2006). "Quantitative evaluation of passive cooling of
99.
1(3), 343-354.
ction 730 of UTCI.
" Proceedings of the American
Sofer, M case
Soliman egulations on the urban
Spronke . "The thermal regime of urban parks in two
-103.
y.
Voogt, nd Oke, T. R. (2003). "Thermal remote sensing of urban climates." Remote
Waziry, udies of
Waziry, wait national
"US Deable Energy Laboratory NREL.
Santamouris, M., Papanikolaou, N., Koronakis, I., Livada, I., and Asimakopoulos, D. (1999). "Thermal and air flow charconditions." Atmospheric Environment 33, 4503-4521.
, S. D., and Evans, J. M. (1996). "Training architects and plannersurban microclimates." Atmospheric Environment 30(3), 449-454. n, M. F., Salleh, E., and Shariff, K. M. (2007). "EffectRadiation Filtration In a Tropical Microclimatic Environment." The 24th ConferPassive and Low Energy Architecture, Singapore 22-24 November. a-Bar, L., and Hoffthe UCL microclimate in hot regions in summer, case study: urban streets and courtyards with trees." Building and Environment 39(9), 1087 - 10
Shashua-Bar, L., Hoffman, M. E., and Tzamir, Y. (2006). "Integrated thermal effects of generic built forms and vegetation on the UCL microclimate." Building and Environment, 4
Shitzer, A. (2007). "Assessment of the Effects of Environmental Radiation on Wind Chill Equivalent Temperatures." COST A
Siple, P. A., and Passel, C. F. (1945). "Reports on Scientific Results of the United States Antarctic Service Expedition No. 1, 1939-1941.Philosophical Society, 89, 177-199. ., and Potchter, O. (2006). "The urban heat island of a city in an arid zone: the of Eilat." Theoretical and Applied Climatology 85(1-2), 81-88. , M. (2002). "Influence of Construction and Housing Rpattern." PhD thesis in Arabic, Department of Architecture, Cairo University, Cairo.n-Smith, R. A., and Oke, T. R. (1998)cities with different summer climates." International journal of Remote Sensing, 19, 2085 - 2104.
Spronken-Smith, R. A., and Oke, T. R. (1999). "Scale Modeling of Nocturnal Cooling in Urban Parks." Boundary-Layer Meteorology, 93, 287-312.
Taha, H. (1997). "Urban climates and heat islands: Albedo, evapotranspiration, and anthropogenic heat." Energy and Buildings, 25, 99
Trowbridge, P. J., and Bassuk, N. L. (2004). "Trees in the Urban Landscape; Site Assessment, Design and Installation." Book, John Wiley & Sons, Inc., New Jerse
Voogt, J. A., and Oke, T. R. (1997). "Complete Urban Surface Temperatures." Journal of Applied Meteorology, 36(9), 1117-1132. J. A., aSensing of Environment, 86 (3), 370-384. Y. (2002). "Application on Environmental Architecture: Solar Design StCourtyard in Cairo and Toshky." Book in Arabic, Madbuli Publishing, Cairo. Y. (2004). "Islamic Architecture and Environment." Book in Arabic, Kucouncil for Culture, Literature and Arts, Kuwait City. partment of Energy DOE (1995), Landscaping for Energy Efficiency." NationalRenew
"US Environmental Protection Agency (2005), Cool Pavement Report" EPA Cool Pavements Study - Task 5 for Heat Island Reduction Initiative.
Proceedings of the 7th ICCAE Conf. 27 -29 May, 2008
593


