Webology, Volume 17, Number 2, December, 2020
44 http://www.webology.org
Export Determinants: A Function for Competitive Advantages An
Applied Study in Jordanian Medicament Companies
Dr. Abed Alsttar Mustafa Assayah*
Department of Financial and Administrative Sciences, Irbid University College, Al-Balqa Applied
University, Jordan. E-mail: [email protected]
Received May 12, 2020; Accepted July 15, 2020
ISSN: 1735-188X
DOI: 10.14704/WEB/V17I2/WEB17015
Abstract
The study aimed at testing the effect of export determinants on the competitive advantages
from the point of view of a sample that consists of (194) personnel working for Jordanian
medicament companies. In order to achieve the objectives of the study, a sample clarifying the
relations and the effects between the variants of the study was designed, from which two
hypotheses were derived: one is concerned with correlations and the other is related to the
effects. The relations were tested based on Spearman Correlation Coefficient and the effect of
the Multiple Linear Regression with a confidence interval estimations of about P≤0.05. An
analysis of the results and its interpretation has proved that:
1- There is a strong inverse relation with a moral correlation coefficient (rs = 0.91) between
export determinants and competitive advantages.
2- Counting on the export determinants as a function for the competitive advantages as the
Regression sample R2 has showed that 74.8% of contrast of the competitive advantages is
attributed to the export determinants.
Keywords
Export Determinants, Competitive Advantages, Foreign Medicament Companies.
Introduction
Competitive strategies are necessarily built on some sources of competitive advantages.
Due to the growing interest in business strategies, the rules of competitive advantages and
their spread are now an important part of the study of the strategic theory. Export
activities are getting an increasing care because of the global economic interdependence,
the contribution of foreign trade to the social growth, as well as the growing trade deficit
for both developed and developing countries alike. Focus is on stimulating exports, rather
than restricting imports. Export activities involve globalization of production and markets;
and this requires that the company manufactures its products in its home country and then
Webology, Volume 17, Number 2, December, 2020
45 http://www.webology.org
exports those products to foreign markets. Its success depends on the ability to build and
defend competitive advantages against competitors.
Competitive advantages unfold in a unique position developed by the company over its
competitors, and that the virtual evidence of competitive advantage is the point of
preference in a particular industry or market. In order to create and sustain competitive
advantages (Kraaijenbrink et. al, 2010, pp: 349-372), companies deploy and develop their
resources and quality skills (Distinctive Competences). In this paper we use the term
“multi- skills” (as a competitive force - and a tool for competitive advantage) to describe
the capabilities, skills, technologies and resources that enable the company to differentiate
itself from its competitors and use them in the development of its competitive advantages
(Fernandez et al, 2018, p:29). Ideally speaking, the company’s competence or skill
becomes distinct and different when competitors are not able to imitate. Valuable
capabilities and skills include activities such as product designing and manufacturing at a
lower cost, advanced technology, high quality and superior distribution.
The essence of organizational strategy lies in the convergence of strengths and distinctive
competences with opportunities in the various activities in a way that enables businesses
to enjoy competitive advantages as compared to competitors who are dealing with those
same activities. In contrast, the competitive strategies aim at achieving preferred
convergence between distinctive competences of the company and opportunities available
in local and international markets in which the company intends to compete. But this
convergence producing competitive advantages, and their nature quickly change due to
environmental changes, and because of these changes, competitive advantages change as
well - this is what we call Punctuated Competitive Advantages, which means that the long
periods of balanced competitive advantages when distinctive competences and industry
structure are stable are interrupted by periods of rapid change when distinctive
competences and industry structure change (Voigt et al., 2017,pp:25-26).
The theme of this paper is to deepen understanding about the punctuated competitive
advantages through conducting a theoretical and experimental analysis of the export
capabilities as one of the multiple competences of the competitive advantages. We will
show how companies in different industries, situations and cases develop their specific
competences and efficiencies to build and defend competitive advantages. These activities
form the basis of SOWT analysis.
Webology, Volume 17, Number 2, December, 2020
46 http://www.webology.org
One: Multiple Competences
Root of Competitive Advantages
Distinctive Competences allow the company to differentiate its products or achieve
significant reduction in costs compared to its competitors, and thus gains a competitive
advantage. Distinctive Competences come from two sources, one supports the other:
tangible and intangible resources, and capabilities which refer to the company's skills in
mixing their resources and put it to productive use. In order for the company to acquire
distinctive competence, it must have at least either high-value unique resources in
addition to the necessary capabilities to make use of these resources and invest them or a
unique ability in the management of various resources (John Ackerman & Colin, 2007,
pp: 708 - 709). The distinctive competence of the company is at its strongest status when
having unique resources of high value and unique capabilities in the management of those
resources. However, businesses win and lose competitive advantages; what is the reason
for this?.
Is marketing poor? Is Quality poor? We do not think so. It is true that a focus on quality
leads to success, however that companies bridge the quality gap, the competition
foundations turned so that the quality and price have become self-evident in the market
which competitors are good at. In spite of the importance of quality, but it is a condition
that is not sufficient for differentiation though its absence brings failure. The defensive
response towards competitor innovations often fails to provide a profound competitive
advantage and this means following the competition rather than leading it. From here,
contradiction is seen in industries whose leadership requires differentiation; as
differentiation may soon be imitated by capable competitors who attack the point of
difference or differentiation of the leader which weakens this differentiation. Excellence,
therefore, requires creation of new sources of competitive advantage, rather than imitating
industry leaders. This is done through superior efficiency, superior quality, superior
modernization, and superior response to customers (Hill & Jones, 2013, pp: 183: 195).
When bases and rules of competition turn, competitors win and lose relative advantage
and are forced to search for new sources of differentiation (Miller, 2003, pp: 10-13).
Rationality requires to transform the bases of the competition to new dimensions, rather
than seeking costly excellence in productivity and quality, but the conversion of
competition bases requires new competitive skills and not only deepening the current
skills (Whiteney & Cooperider, 2009, pp: 25-32). So innovations per worker would create
efficient one that is more likely to be subject to rapid imitation by the competent
Webology, Volume 17, Number 2, December, 2020
47 http://www.webology.org
competitors, whereas the multi-competences serve to strengthen the multiple dimensions
of the company’s competitive position and enable it to compete effectively so that
competitors cannot easily imitate or undermine it. To achieve this, building and defending
competitive advantages require production of competitive strategies based on multi-
competences that lead to deep synergy that will strengthen and consolidate the existing
competitive advantages (Smith, 2010, pp: 115 - 116).
When multi competences interact, they produce unique advantages not available to those
competitors competing over competence dimension as being reactive and supporting each
other (Fernandeza, et al, 2018, p:31). Each competence evolves and remains at a lower
cost than if they were alone. When there is a strategy based on the multi-competences of
multiple and economies of scale resulting from the interaction of multi competences, a
competitive advantage would be solid, hard to imitate and more likely to continue and
stay (Rose, et al, 2010, PP: 493 – 494).
When a mixture of multi-competences, the foundations of competition would change, and
these changes will push competitors to compete in the new dimensions or face the risk of
declined market share in favour of innovator. In spite of the importance of created
advantages, they will be weak due to new forms of competition, and this is the reason for
the interruption and unsustainability of competitive advantages. However, the ability to
convert competition based on multi-competences requires identification and then
development and investment of the necessary strategies (McFarland, 2008, P: 2030). In
order to strengthen the multi-competences that would lead to a sustainable competitive
advantage, the company should determine the added value expected by the customer. The
strategies should include the weaknesses of the leader and identify the mixture of
competences required to attack or defend areas of weakness (Julian, yoo & Hanssens,
2008, pp: 50-53). The process of developing new competences requires constant search
for new ways to add value not only in the centre of areas of the company and technology,
but also across the wide range of activities that make up its business. This involves
prediction, expectation and even creativity to the needs of customers and not responding
to them when demand becomes apparent (Doris & Guler, 2011, p: 339). The company's
ability to perceive, merge and absorb the new valuable information is a key to survival
because a competitive advantage can be derived from any of the various activities of the
company.
In spite of the relentless pursuit of companies to achieve multi- competences, but it should
be confirmed that they are not ends by themselves, but means used to build good
strategies. In recent years, foundations of competition turned cumulatively from
Webology, Volume 17, Number 2, December, 2020
48 http://www.webology.org
productivity to quality to service and flexible manufacturing and that this change in
competences has turned the foundations of competition to a new set of rules and
frameworks. In brief, multi-competences enable the company and its strategies to become
“Moving Targets” and therefore they will be difficult to identify and attack by
competitors. Dynamic strategies and mix of skills would force competitors to adapt or
amend competences on which they base; while well- planned transition strategies offer
permanently a quick advantage even though competitors own equal competences; and if
there is a shortage of equal competences the strategic advantage will last long and till
competitors develop those skills or new ones, then foundations of competition will
entirely turn into the industry (Thomas & James, 1999, P: 145).
Because a strategy is unable to provide a sustainable competitive advantage, the search for
new strategies will be more virulent, and industry leaders and challengers will try to
surprise competitors by moving from a combination of competences to another in ways
that will exploit their strengths and the weaknesses of and thus weak competitors will lose
their foothold in the market and be forced to retreat to small market shares and compete in
less competitive sectors and industries (Polad, 2010, P: 6253).
The company should consider offensively or defensively about how they could turn the
pattern of current competition for the industry, and learn how to develop multi-
competences. Defensively, a company needs to expand the boundaries of their industry
and identify current situation of the state of productive art in the areas of performance,
price, quality, service, and other dimensions of competitiveness to ensure that competitors
do not offer superior value over them. The learned companies contribute to transforming
the promising idea into a new competitive advantage competitive; therefore, learning must
be disseminated in all aspects of the company because it provides the skills needed to
make competitive strategies, and without learning the combination competences become
obsolete and competitive advantages are quickly matched by competitors (Naveed,
Rasheed & Bahaudin, 2013, PP: 90 – 91). A company has to learn how to respond to
consumers, accelerate the introduction of new products to different markets, and seek to
continuous improvement not only in the areas of its historical strength, but also in any
activity that would make differentiation an advantage for it. Effect of learning is usually
cumulative. Customers expect new forms of value that must be added to the forms already
developed. The balance cycle (Innovation - Imitation) refers to the fact that industry
leaders should educate customers about what they demand, and this is through the
identification of the current state of performance, price, service, and other dimensions,
and customers must learn also how to judge competitive offerings under these criteria
(David, 2010, P: 173).
Webology, Volume 17, Number 2, December, 2020
49 http://www.webology.org
Two: Methodology
Problem of the Study
Companies in all industries are facing pressures towards internationalization, so that the
world has become a small place, and businesses need to think about the production and
sale of goods to consumers regardless of where they are, and here internationalization is
an interesting opportunity for many companies. However, the globalization of production
and markets involves a lot of risks and threats. The more markets become open feel, the
more a lot of businesses will feel competition and severely snapping up markets by the
most efficient companies abroad, and consequently they gain and lose their competitive
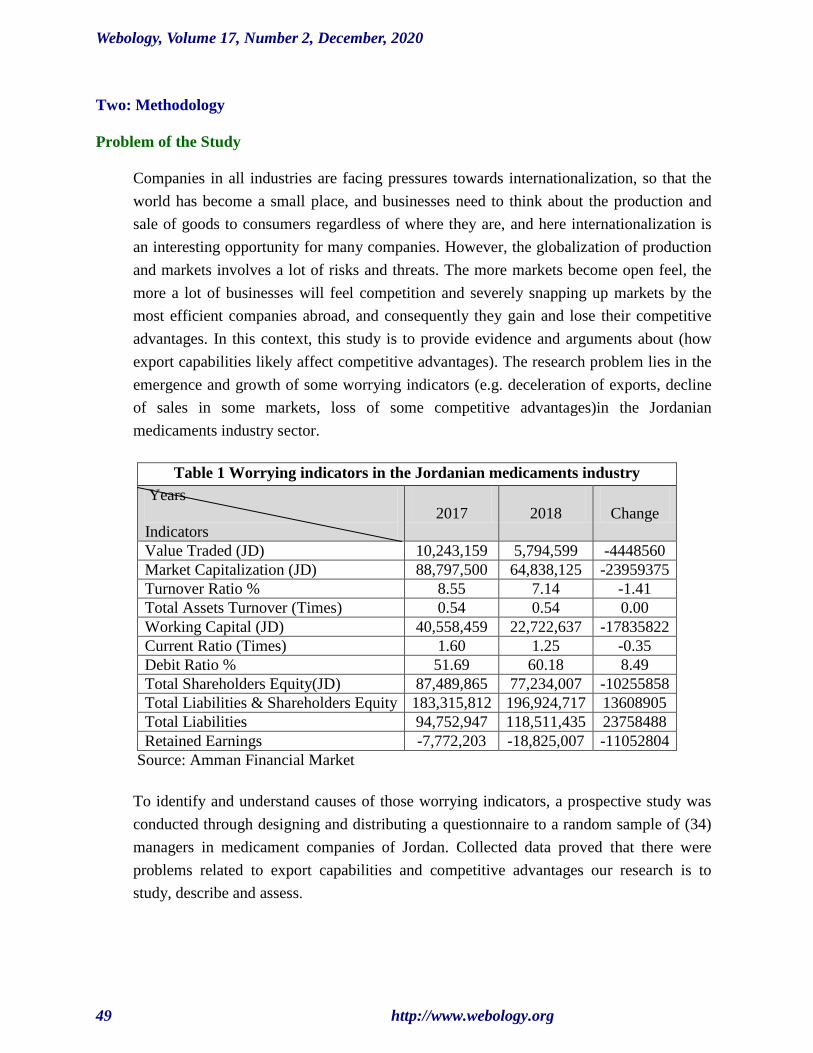
advantages. In this context, this study is to provide evidence and arguments about (how
export capabilities likely affect competitive advantages). The research problem lies in the
emergence and growth of some worrying indicators (e.g. deceleration of exports, decline
of sales in some markets, loss of some competitive advantages)in the Jordanian
medicaments industry sector.
Table 1 Worrying indicators in the Jordanian medicaments industry
Change
2018
2017
Years
Indicators
-4448560 5,794,599 10,243,159 Value Traded (JD)
-23959375 64,838,125 88,797,500 Market Capitalization (JD)
-1.41 7.14 8.55 Turnover Ratio %
0.00 0.54 0.54 Total Assets Turnover (Times)
-17835822 22,722,637 40,558,459 Working Capital (JD)
-0.35 1.25 1.60 Current Ratio (Times)
8.49 60.18 51.69 Debit Ratio %
-10255858 77,234,007 87,489,865 Total Shareholders Equity(JD)
13608905 196,924,717 183,315,812 Total Liabilities & Shareholders Equity
23758488 118,511,435 94,752,947 Total Liabilities
-11052804 -18,825,007 -7,772,203 Retained Earnings
Source: Amman Financial Market
To identify and understand causes of those worrying indicators, a prospective study was
conducted through designing and distributing a questionnaire to a random sample of (34)
managers in medicament companies of Jordan. Collected data proved that there were
problems related to export capabilities and competitive advantages our research is to
study, describe and assess.
Webology, Volume 17, Number 2, December, 2020
50 http://www.webology.org
Thus, the research problem is clarified by answering the following questions:
1. Are there correlations and moral impact between export determinants and competitive
advantages? What is the nature of those correlations and impacts? What is their
direction?
2. What are the export determinants that affect competitive advantages? What is the relative
importance of those determinants? Our focus have been on the examination of
determinants in the internal environment: organizational (company size, resources, and
experience) and administrative (management ambitions, expectations, and desire); and
the determinants in the external environment: industry (its kind, structure, and intensity of
competition), and markets (their saturation, area, depth, attractiveness, and the cultural
similarity).
3. What is the nature of the prevailing competitive advantages? Our focus has been to
examine the price competitive advantages in terms of (direct cost of raw materials, direct
cost of labor, indirect production costs, and other costs) and non-price competitive
advantages represented by (quality, delivery, flexibility, and creativity).
Model of the Study
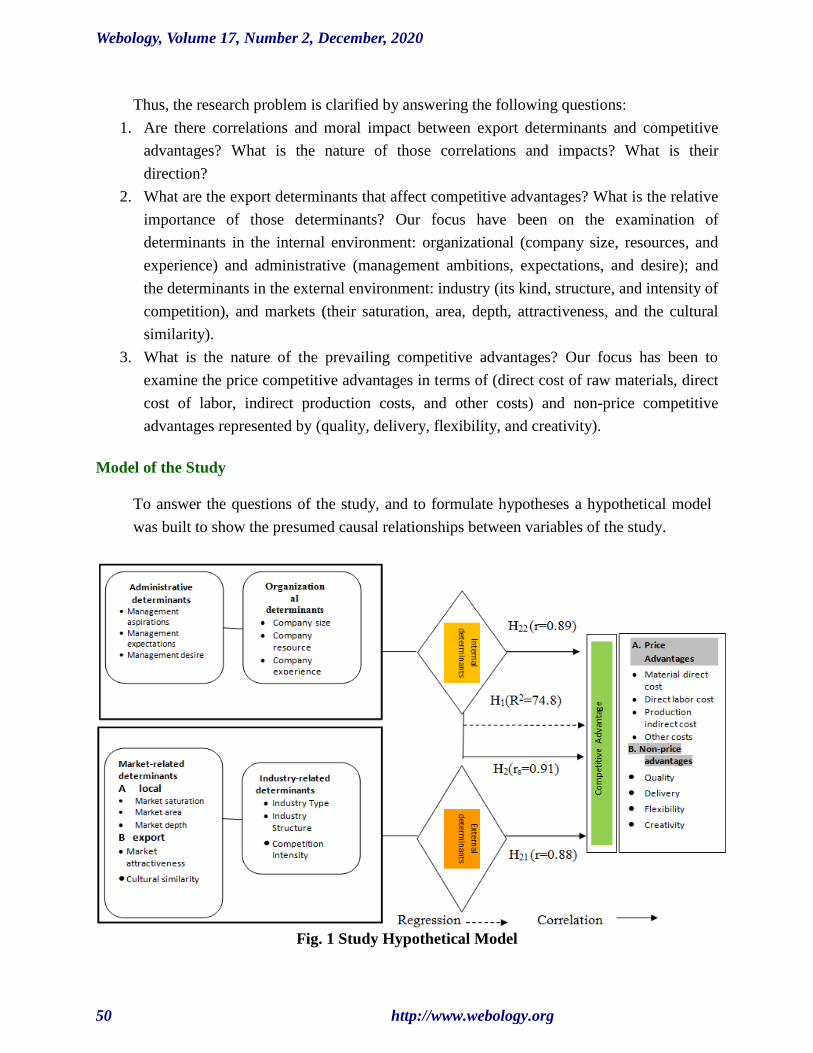
To answer the questions of the study, and to formulate hypotheses a hypothetical model
was built to show the presumed causal relationships between variables of the study.
Fig. 1 Study Hypothetical Model
Webology, Volume 17, Number 2, December, 2020
51 http://www.webology.org
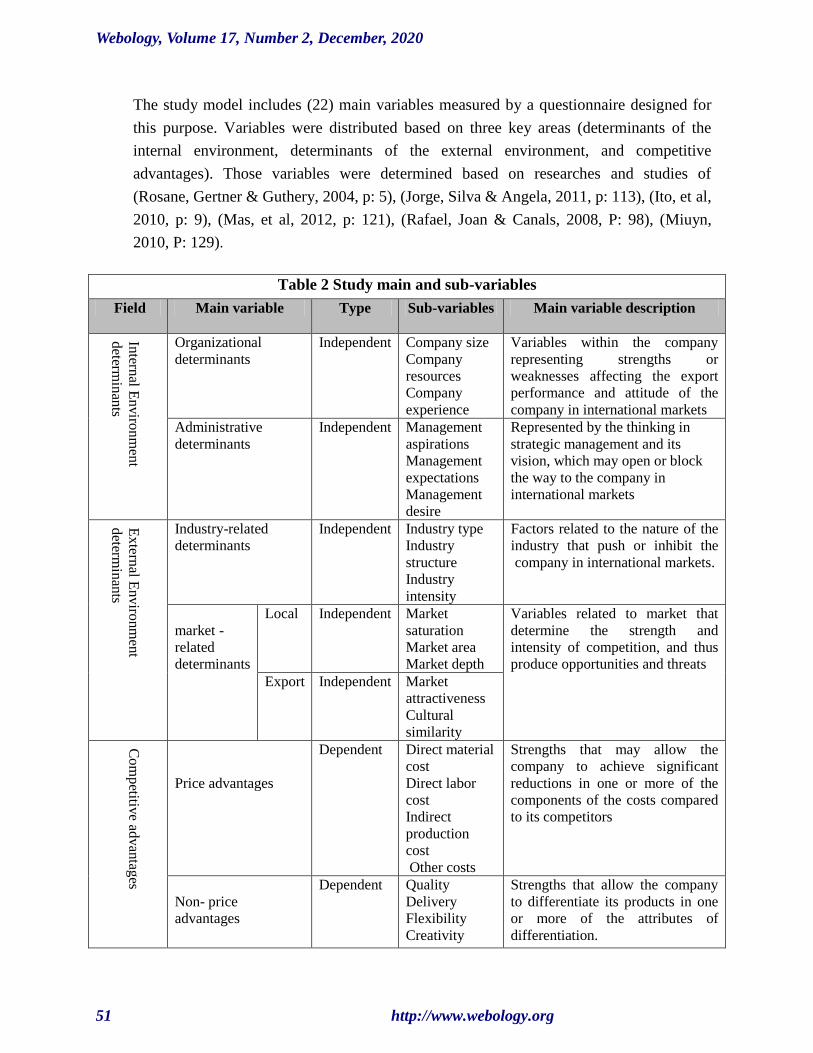
The study model includes (22) main variables measured by a questionnaire designed for
this purpose. Variables were distributed based on three key areas (determinants of the
internal environment, determinants of the external environment, and competitive
advantages). Those variables were determined based on researches and studies of
(Rosane, Gertner & Guthery, 2004, p: 5), (Jorge, Silva & Angela, 2011, p: 113), (Ito, et al,
2010, p: 9), (Mas, et al, 2012, p: 121), (Rafael, Joan & Canals, 2008, P: 98), (Miuyn,
2010, P: 129).
Table 2 Study main and sub-variables
Field Main variable Type Sub-variables Main variable description
Intern
al Enviro
nm
ent
determ
inan
ts
Organizational
determinants
Independent Company size
Company
resources
Company
experience
Variables within the company
representing strengths or
weaknesses affecting the export
performance and attitude of the
company in international markets
Administrative
determinants
Independent Management
aspirations
Management
expectations
Management
desire
Represented by the thinking in
strategic management and its
vision, which may open or block
the way to the company in
international markets
Extern
al Enviro
nm
ent
determ
inan
ts
Industry-related
determinants
Independent Industry type
Industry
structure
Industry
intensity
Factors related to the nature of the
industry that push or inhibit the
company in international markets.
market -
related
determinants
Local Independent Market
saturation
Market area
Market depth
Variables related to market that
determine the strength and
intensity of competition, and thus
produce opportunities and threats
Export Independent Market
attractiveness
Cultural
similarity
Co
mpetitiv
e advan
tages
Price advantages
Dependent Direct material
cost
Direct labor
cost
Indirect
production
cost
Other costs
Strengths that may allow the
company to achieve significant
reductions in one or more of the
components of the costs compared
to its competitors
Non- price
advantages
Dependent Quality
Delivery
Flexibility
Creativity
Strengths that allow the company
to differentiate its products in one
or more of the attributes of
differentiation.
Webology, Volume 17, Number 2, December, 2020
52 http://www.webology.org
Study Hypotheses
The study is based on a set of hypotheses that aim to examine the nature of the
relationships and impacts between the independent variable (export determinants) and its
contained sub-variables, and the dependent variable (competitive advantages) and its
contained sub-variables.
First Main Hypothesis (H1): Export determinants (as well as their variants) morally affect
competitive advantages at the level (α = 0.05) in Jordanian medicament companies.
Second Main Hypothesis (H2): An inverse relationship is expected with moral
significance between export determinants and competitive advantages at the level (α =
0.05) in Jordanian medicament companies.
The following sub-hypotheses were derived:
(H21): Export determinants in the internal environment of the company are associated with
inverse relations of moral significance with the competitive advantages at the level (α =
0.05).
(H22): Export determinants in the external environment of the company are associated
with inverse relations of moral significance with the competitive advantages at the level
(α = 0.05).
Data were collected by a questionnaire developed and judged to cover all study variables
and dimensions.
To ensure measurement validity and reliability, the questionnaire were distributed to (27)
managers working in the companies being the community of the study, and then
redistributed after two weeks, and validity and reliability were based on the equation of
Cronbach – Alpha.
The results showed high reliability that can be adopted when analysing and drawing
conclusions.
Webology, Volume 17, Number 2, December, 2020
53 http://www.webology.org
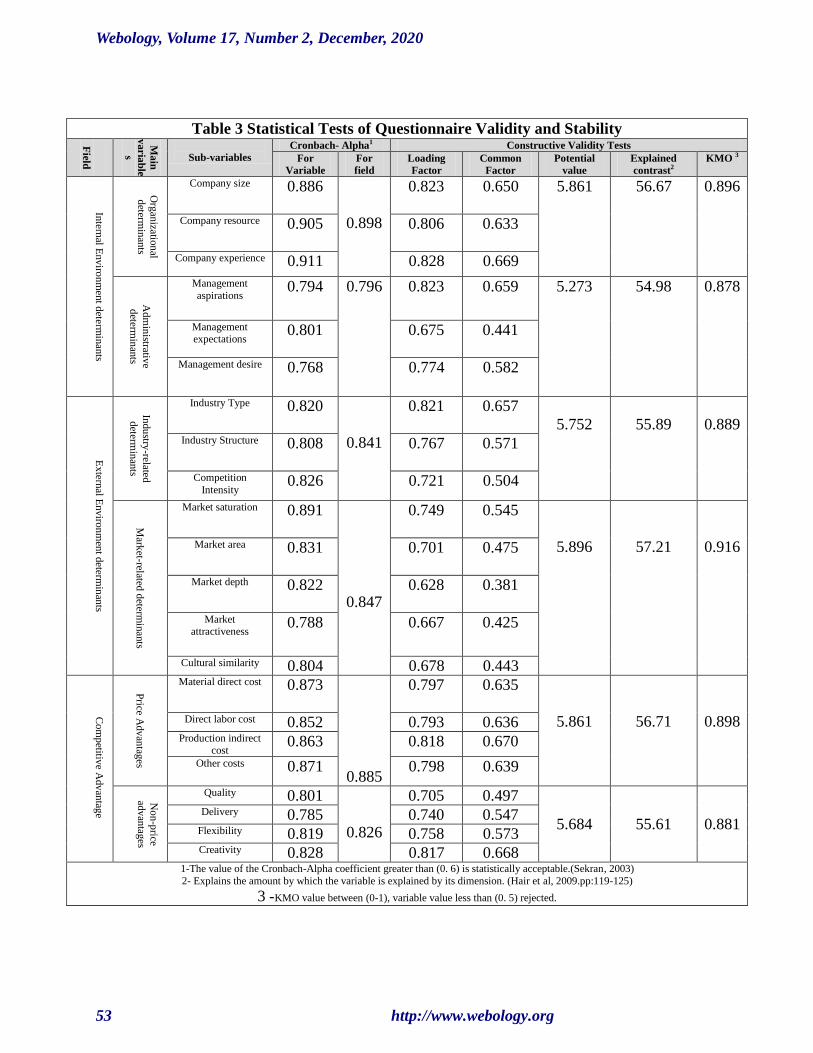
Table 3 Statistical Tests of Questionnaire Validity and Stability
Constructive Validity Tests Cronbach- Alpha1
Sub-variables
Ma
in
varia
ble
s
Field
KMO 3 Explained
contrast2 Potential
value Common
Factor Loading
Factor For
field For
Variable 0.896 56.67
5.861
0.650 0.823
0.898
0.886 Company size
Org
anizatio
nal
determ
inan
ts
Intern
al Env
iron
men
t determ
inan
ts
0.633
0.806 0.905 Company resource
0.669 0.828 0.911 Company experience
0.878 54.98
5.273
0.659
0.823
0.796
0.794
Management
aspirations
Ad
min
istrative
determ
inan
ts
0.441
0.675
0.801
Management
expectations
0.582 0.774 0.768 Management desire
0.889
55.89
5.752
0.657
0.821
0.841
0.820
Industry Type
Indu
stry-related
determ
inan
ts
Ex
ternal E
nviro
nm
ent d
etermin
ants
0.571
0.767 0.808
Industry Structure
0.504 0.721 0.826 Competition
Intensity
0.916
57.21
5.896
0.545
0.749
0.847
0.891
Market saturation M
arket-related
determ
inan
ts
0.475 0.701
0.831
Market area
0.381
0.628
0.822
Market depth
0.425 0.667 0.788 Market attractiveness
0.443 0.678 0.804 Cultural similarity
0.898
56.71
5.861
0.635
0.797
0.885
0.873
Material direct cost
Price A
dv
antag
es
Co
mp
etitive A
dv
antag
e
0.636 0.793 0.852 Direct labor cost
0.670 0.818 0.863 Production indirect cost
0.639 0.798 0.871 Other costs
0.881 55.61 5.684
0.497 0.705
0.826
0.801 Quality
No
n-p
rice
adv
antag
es
0.547 0.740 0.785 Delivery
0.573 0.758 0.819 Flexibility
0.668 0.817 0.828 Creativity
1-The value of the Cronbach-Alpha coefficient greater than (0. 6) is statistically acceptable.(Sekran, 2003) 2- Explains the amount by which the variable is explained by its dimension. (Hair et al, 2009.pp:119-125)
KMO value between (0-1), variable value less than (0. 5) rejected. -3

Webology, Volume 17, Number 2, December, 2020
54 http://www.webology.org
Constructive Validity Test was performed to verify that the questionnaire measures the
variables to be measured using the Principle Components Factor Analysis. Kaiser Mayers
Olkin (KMO) analysis shows a strong correlation and high validity of research variables.
The highest value reached (0.916) with the determinants associated with the markets and
the lowest value (0.878) with variable of administrative determinants. Common factor
values shows contrast shared by each variable with the other variables included in the
analysis, which ranged between (0.381 -0.669). The loading factor values ranged between
{(0.675 -0.823) by an explained contrast (55.8 %) of the internal environment
determinants, and (0.628 - 0.821) by an explained contrast (56.6 %) of the external
environment determinants, and (0.705 -0.818) by an explained contrast (56.16 %) of the
competitive advantages} and these are statistically acceptable values being greater than
(0.40).
Study Population and Sample
The study population consisted of 568 individuals who deal with export activities in the
Jordanian medicament companies whose stocks are listed on the Amman Financial
Market. The sample size was determined by the following equation (Ali Mia et al, 2007)
1)1( 2
BN
Nn
Where n is the sample size required, assuming that:
N = the size of the research population 568.
B = allowable error in estimating the size of the sample, including 5.5% of the sample
size.
The following equation summarizes the process:
209
1(5.5) )1568(
5682
n single
209 questionnaires were distributed to the study sample, 198 questionnaires were
received, 4 questionnaires were excluded because they were invalid, and so the response
rate was (92.8) of the sample.
Third: Hypotheses Testing and Data Analysis
1) Testing the First Main Hypothesis (Effect)
The results in Table (4) indicate to the ability of whole export determinants
(organizational, administrative, industry-related, and markets-related) in affecting the
Webology, Volume 17, Number 2, December, 2020
55 http://www.webology.org
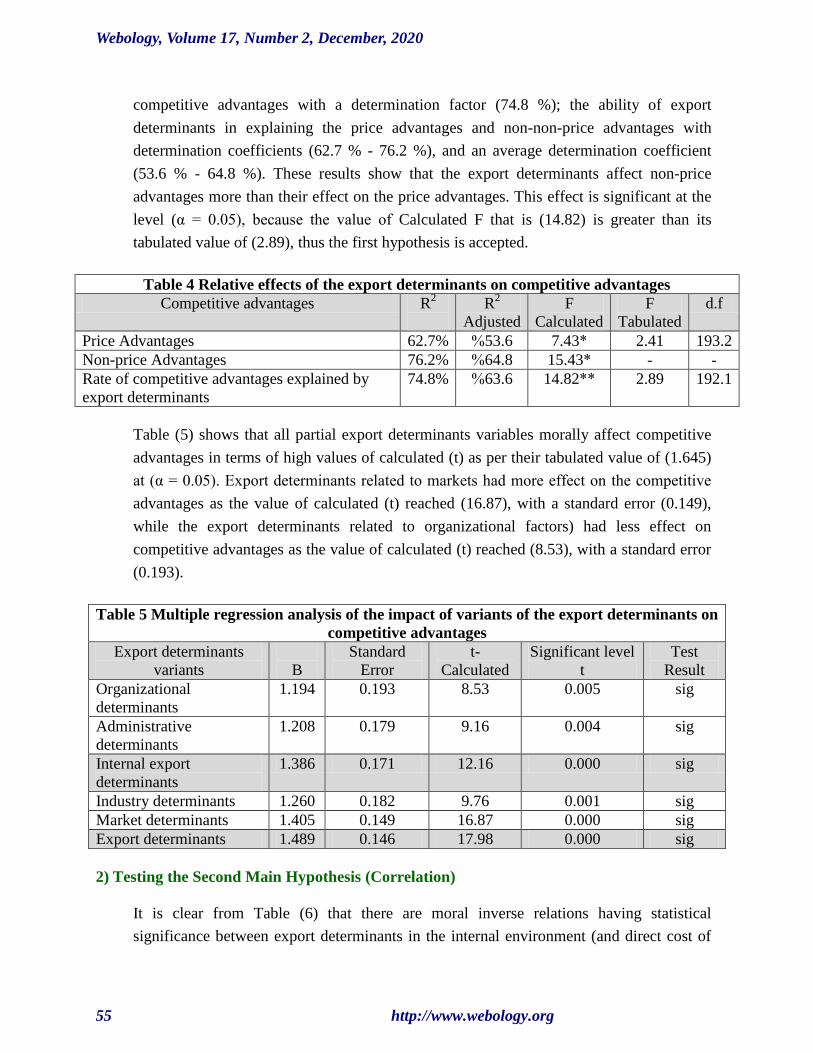
competitive advantages with a determination factor (74.8 %); the ability of export
determinants in explaining the price advantages and non-non-price advantages with
determination coefficients (62.7 % - 76.2 %), and an average determination coefficient
(53.6 % - 64.8 %). These results show that the export determinants affect non-price
advantages more than their effect on the price advantages. This effect is significant at the
level (α = 0.05), because the value of Calculated F that is (14.82) is greater than its
tabulated value of (2.89), thus the first hypothesis is accepted.
Table 4 Relative effects of the export determinants on competitive advantages
d.f F
Tabulated
F
Calculated
R2
Adjusted
R2
Competitive advantages
193.2 2.41 *7.43 53.6 %62.7% Price Advantages
- -*15.43 64.8 %76.2% Non-price Advantages
192.1 2.89 **14.82 63.6 %74.8% Rate of competitive advantages explained by
export determinants
Table (5) shows that all partial export determinants variables morally affect competitive
advantages in terms of high values of calculated (t) as per their tabulated value of (1.645)
at (α = 0.05). Export determinants related to markets had more effect on the competitive
advantages as the value of calculated (t) reached (16.87), with a standard error (0.149),
while the export determinants related to organizational factors) had less effect on
competitive advantages as the value of calculated (t) reached (8.53), with a standard error
(0.193).
Table 5 Multiple regression analysis of the impact of variants of the export determinants on
competitive advantages
Test
Result
Significant level
t
t-
Calculated
Standard
Error
B
Export determinants
variants
sig 0.005 8.53 0.193 1.194 Organizational
determinants
sig 0.004 9.16 0.179 1.208 Administrative
determinants
sig 0.000 12.16 0.171 1.386 Internal export
determinants
sig 0.001 9.76 0.182 1.260 Industry determinants
sig 0.000 16.87 0.149 1.405 Market determinants
sig 0.000 17.98 0.146 1.489 Export determinants
2) Testing the Second Main Hypothesis (Correlation)
It is clear from Table (6) that there are moral inverse relations having statistical
significance between export determinants in the internal environment (and direct cost of
Webology, Volume 17, Number 2, December, 2020
56 http://www.webology.org
raw materials, quality, creativity - very strong correlation), (and direct labor cost, indirect
production costs, flexibility, other costs, delivery – strong correlation). These correlations
are supported by moral inverse correlations between export determinants variables in the
internal environment and competitive advantages, where the highest correlation
coefficient was (0.82) with the Creativity and the lowest correlation coefficient (0.67)
with the Delivery. Partial correlation coefficients between the internal export determinants
and competitive advantages showed contrast in the level of strength, in that they were
(8.33% - very strong correlations), (77.08 – strong correlations) and (14.58 – middle
correlations). Thus, the whole correlation between the internal export determinants and
competitive advantages was inverse and very strong (0.88) and significant at the level (α =
0.01). Based on this result, (H21) is accepted.
Table (6) shows there are significant inverse correlations between export determinants in
the external environment (and direct cost of raw materials, direct labor cost, indirect
production costs, quality, flexibility, creativity - very strong correlation), (and other costs,
delivery – strong correlation). These correlations are supported by significant inverse
correlations between export determinants in the external environment and competitive
advantages, where the highest correlation was (0.87) with the Quality and the lowest
correlation coefficient (0.77) with the Other costs. Partial correlation coefficients between
external export determinants and competitive advantages reflected differences in their
level of strength, in that they were (15.63% - very strong correlation), (82.82% - strong
correlation) and (1.57 – middle correlation).The whole correlation between external
export determinants and competitive advantages showed inverse and very strong
correlation (0.89) and was significant at the level (α = 0.01). Based on these results, (H22)
is accepted.
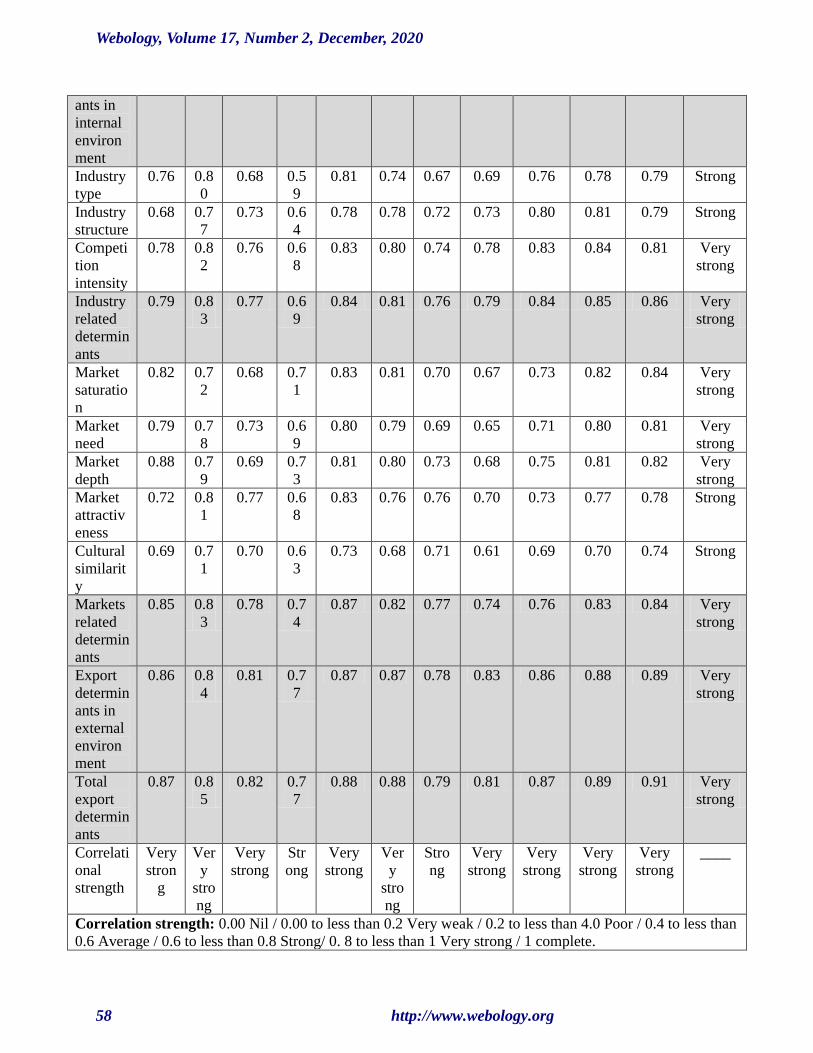
Correlation coefficients in Table (6) indicate that there are significant inverse correlation
relationships between the total export determinants and (cost of raw materials, direct labor
costs, indirect production costs, quality, flexibility, creativity - very strong correlation),
(other costs, delivery - strong correlation). These relationships confirm significant
correlations between the export determinants in the internal and external environment and
price and non- price competitive advantages; where the highest correlation coefficient was
(0.88) between the export determinants in the external environment and non- price
advantages, and the lowest correlation coefficient was (0.82) between the export
determinants in the internal environment and price advantages. Partial correlation
coefficients between the variables of export determinants and variables of competitive
advantages showed obvious differences in terms of their strength, where: (12.5 % of them
were very strong correlations), (80.36 % were strong correlations), and (7.14 % were
Webology, Volume 17, Number 2, December, 2020
57 http://www.webology.org
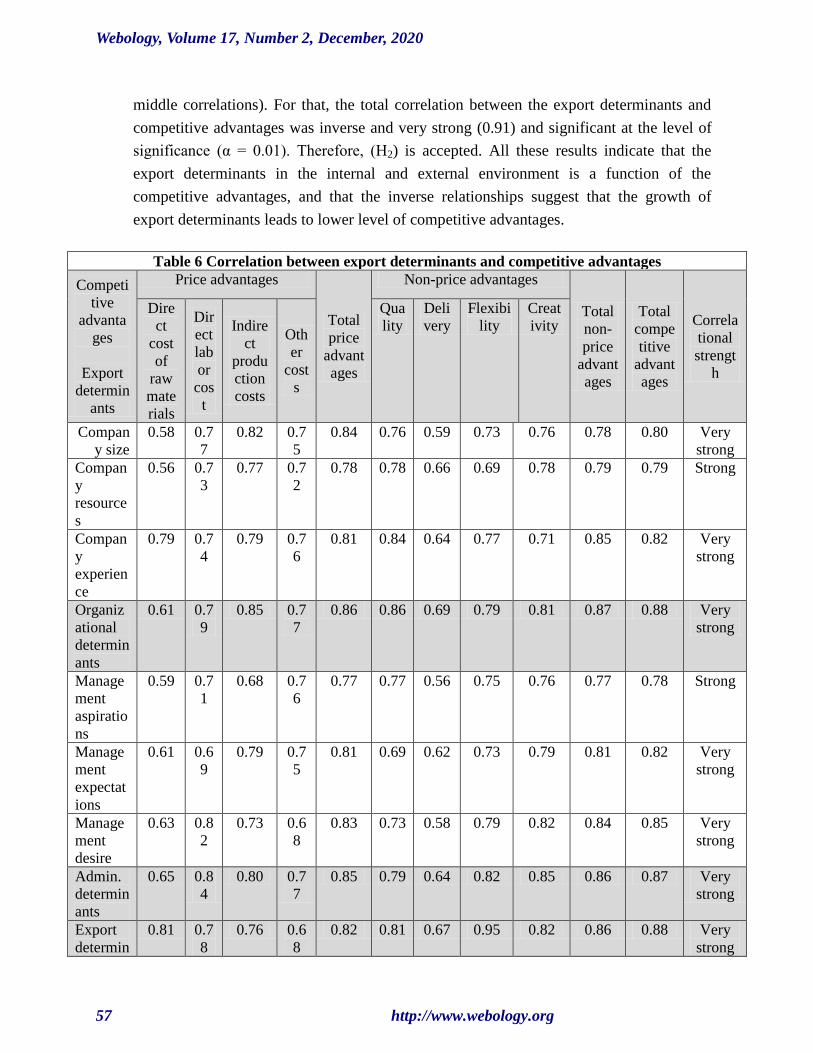
middle correlations). For that, the total correlation between the export determinants and
competitive advantages was inverse and very strong (0.91) and significant at the level of
significance (α = 0.01). Therefore, (H2) is accepted. All these results indicate that the
export determinants in the internal and external environment is a function of the
competitive advantages, and that the inverse relationships suggest that the growth of
export determinants leads to lower level of competitive advantages.
Table 6 Correlation between export determinants and competitive advantages
Correla
tional
strengt
h
Total
compe
titive
advant
ages
Total
non-
price
advant
ages
Non-price advantages
Total
price
advant
ages
Price advantages Competi
tive
advanta
ges
Export
determin
ants
Creat
ivity
Flexibi
lity
Deli
very
Qua
lity Oth
er
cost
s
Indire
ct
produ
ction
costs
Dir
ect
lab
or
cos
t
Dire
ct
cost
of
raw
mate
rials
Very
strong
0.80 0.78 0.76 0.73 0.59 0.76 0.84 0.7
5
0.82 0.7
7
0.58 Compan
y size
Strong 0.79 0.79 0.78 0.69 0.66 0.78 0.78 0.7
2
0.77 0.7
3
0.56 Compan
y
resource
s
Very
strong
0.82 0.85 0.71 0.77 0.64 0.84 0.81 0.7
6
0.79 0.7
4
0.79 Compan
y
experien
ce
Very
strong
0.88 0.87 0.81 0.79 0.69 0.86 0.86 0.7
7
0.85 0.7
9
0.61 Organiz
ational
determin
ants
Strong 0.78 0.77 0.76 0.75 0.56 0.77 0.77 0.7
6
0.68 0.7
1
0.59 Manage
ment
aspiratio
ns
Very
strong
0.82 0.81 0.79 0.73 0.62 0.69 0.81 0.7
5
0.79 0.6
9
0.61 Manage
ment
expectat
ions
Very
strong
0.85 0.84 0.82 0.79 0.58 0.73 0.83 0.6
8
0.73 0.8
2
0.63 Manage
ment
desire
Very
strong
0.87 0.86 0.85 0.82 0.64 0.79 0.85 0.7
7
0.80 0.8
4
0.65 Admin.
determin
ants
Very
strong
0.88 0.86 0.82 0.95 0.67 0.81 0.82 0.6
8
0.76 0.7
8
0.81 Export
determin
Webology, Volume 17, Number 2, December, 2020
58 http://www.webology.org
ants in
internal
environ
ment
Strong 0.79 0.78 0.76 0.69 0.67 0.74 0.81 0.5
9
0.68 0.8
0
0.76 Industry
type
Strong 0.79 0.81 0.80 0.73 0.72 0.78 0.78 0.6
4
0.73 0.7
7
0.68 Industry
structure
Very
strong
0.81 0.84 0.83 0.78 0.74 0.80 0.83 0.6
8
0.76 0.8
2
0.78 Competi
tion
intensity
Very
strong
0.86 0.85 0.84 0.79 0.76 0.81 0.84 0.6
9
0.77 0.8
3
0.79 Industry
related
determin
ants
Very
strong
0.84 0.82 0.73 0.67 0.70 0.81 0.83 0.7
1
0.68 0.7
2
0.82 Market
saturatio
n
Very
strong
0.81 0.80 0.71 0.65 0.69 0.79 0.80 0.6
9
0.73 0.7
8
0.79 Market
need
Very
strong
0.82 0.81 0.75 0.68 0.73 0.80 0.81 0.7
3
0.69 0.7
9
0.88 Market
depth
Strong 0.78 0.77 0.73 0.70 0.76 0.76 0.83 0.6
8
0.77 0.8
1
0.72 Market
attractiv
eness
Strong 0.74 0.70 0.69 0.61 0.71 0.68 0.73 0.6
3
0.70 0.7
1
0.69 Cultural
similarit
y
Very
strong
0.84 0.83 0.76 0.74 0.77 0.82 0.87 0.7
4
0.78 0.8
3
0.85 Markets
related
determin
ants
Very
strong
0.89 0.88 0.86 0.83 0.78 0.87 0.87 0.7
7
0.81 0.8
4
0.86 Export
determin
ants in
external
environ
ment
Very
strong
0.91 0.89 0.87 0.81 0.79 0.88 0.88 0.7
7
0.82 0.8
5
0.87 Total
export
determin
ants
____ Very
strong
Very
strong
Very
strong
Very
strong
Stro
ng
Ver
y
stro
ng
Very
strong
Str
ong
Very
strong
Ver
y
stro
ng
Very
stron
g
Correlati
onal
strength
Correlation strength: 0.00 Nil / 0.00 to less than 0.2 Very weak / 0.2 to less than 4.0 Poor / 0.4 to less than
0.6 Average / 0.6 to less than 0.8 Strong/ 0. 8 to less than 1 Very strong / 1 complete.
Webology, Volume 17, Number 2, December, 2020
59 http://www.webology.org
3) Analysis of Data
(First): Evaluation of Competitive Advantages in the Jordanian Medicament Companies
a) Analyze and Evaluate the Price Advantages
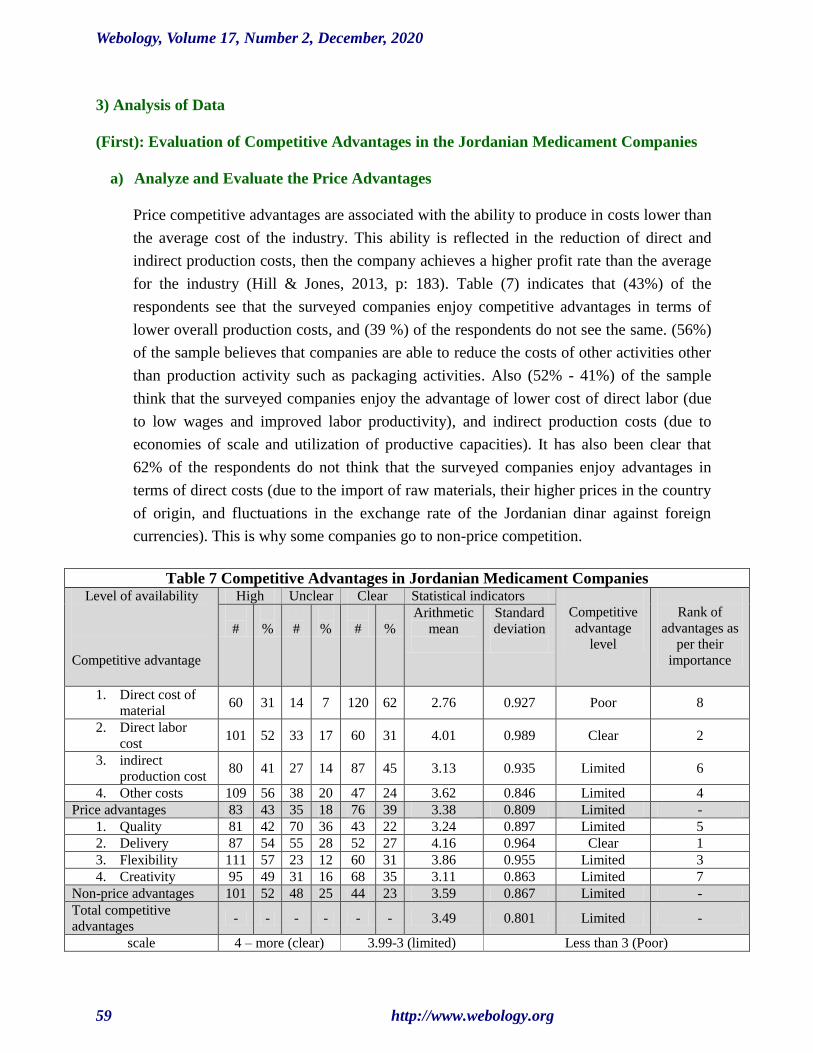
Price competitive advantages are associated with the ability to produce in costs lower than
the average cost of the industry. This ability is reflected in the reduction of direct and
indirect production costs, then the company achieves a higher profit rate than the average
for the industry (Hill & Jones, 2013, p: 183). Table (7) indicates that (43%) of the
respondents see that the surveyed companies enjoy competitive advantages in terms of
lower overall production costs, and (39 %) of the respondents do not see the same. (56%)
of the sample believes that companies are able to reduce the costs of other activities other
than production activity such as packaging activities. Also (52% - 41%) of the sample
think that the surveyed companies enjoy the advantage of lower cost of direct labor (due
to low wages and improved labor productivity), and indirect production costs (due to
economies of scale and utilization of productive capacities). It has also been clear that
62% of the respondents do not think that the surveyed companies enjoy advantages in
terms of direct costs (due to the import of raw materials, their higher prices in the country
of origin, and fluctuations in the exchange rate of the Jordanian dinar against foreign
currencies). This is why some companies go to non-price competition.
Table 7 Competitive Advantages in Jordanian Medicament Companies
Rank of
advantages as
per their
importance
Competitive
advantage
level
Statistical indicators Clear Unclear High Level of availability
Competitive advantage
Standard
deviation
Arithmetic
mean
%
#
%
#
%
#
8 Poor 0.927 2.76 62 120 7 14 31 60 1. Direct cost of
material
2 Clear 0.989 4.01 31 60 17 33 52 101 2. Direct labor
cost
6 Limited 0.935 3.13 45 87 14 27 41 80 3. indirect
production cost
4 Limited 0.846 3.62 24 47 20 38 56 109 4. Other costs
- Limited 0.809 3.38 39 76 18 35 43 83 Price advantages
5 Limited 0.897 3.24 22 43 36 70 42 81 1. Quality
1 Clear 0.964 4.16 27 52 28 55 54 87 2. Delivery
3 Limited 0.955 3.86 31 60 12 23 57 111 3. Flexibility
7 Limited 0.863 3.11 35 68 16 31 49 95 4. Creativity
- Limited 0.867 3.59 23 44 25 48 52 101 Non-price advantages
- Limited 0.801 3.49 - - - - - - Total competitive advantages
Less than 3 (Poor) 3.99-3 (limited) 4 – more (clear) scale
Webology, Volume 17, Number 2, December, 2020
60 http://www.webology.org
b) Analysis and assessment of non-price advantages
Table (7) shows that the rate of agreement on variants of non-price advantages that
depends on Quality, Delivery, Flexibility and Creativity ranged between (57% - 42%)
against rates of disagreement on the same variants that ranged between (35% - 22%) with
arithmetic means that ranged between (4.16 – 3.11). These results indicate that the
surveyed companies have clear non-price advantages.
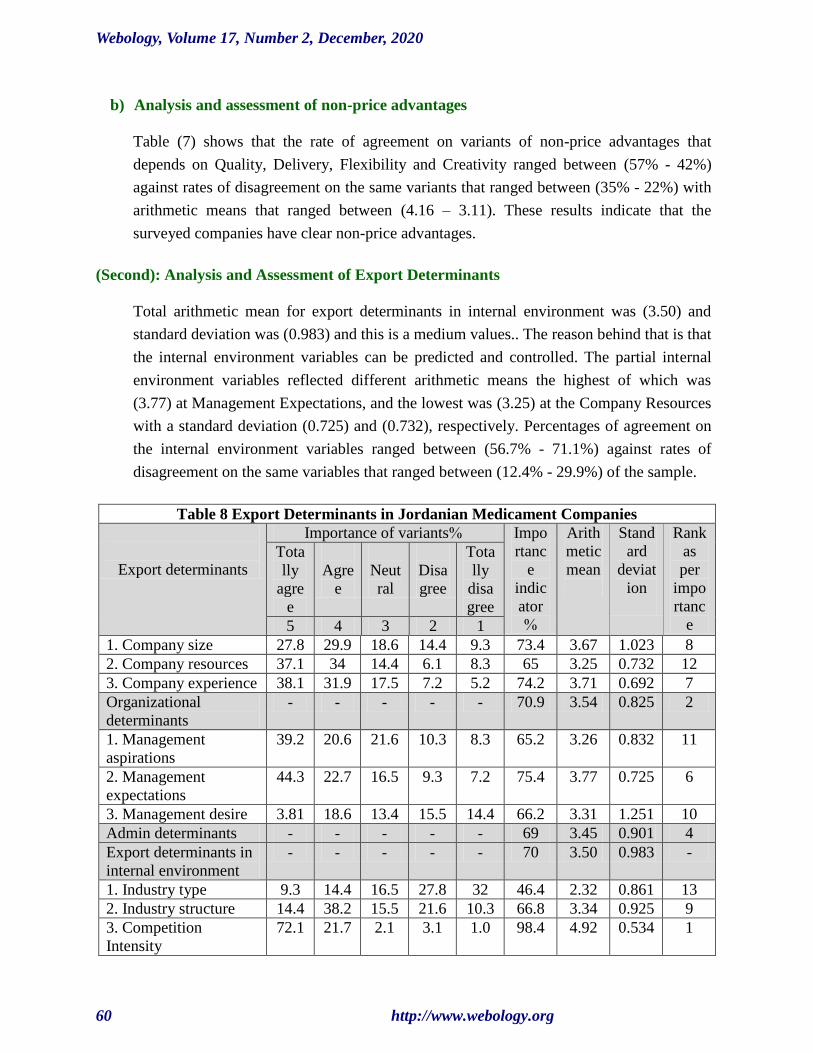
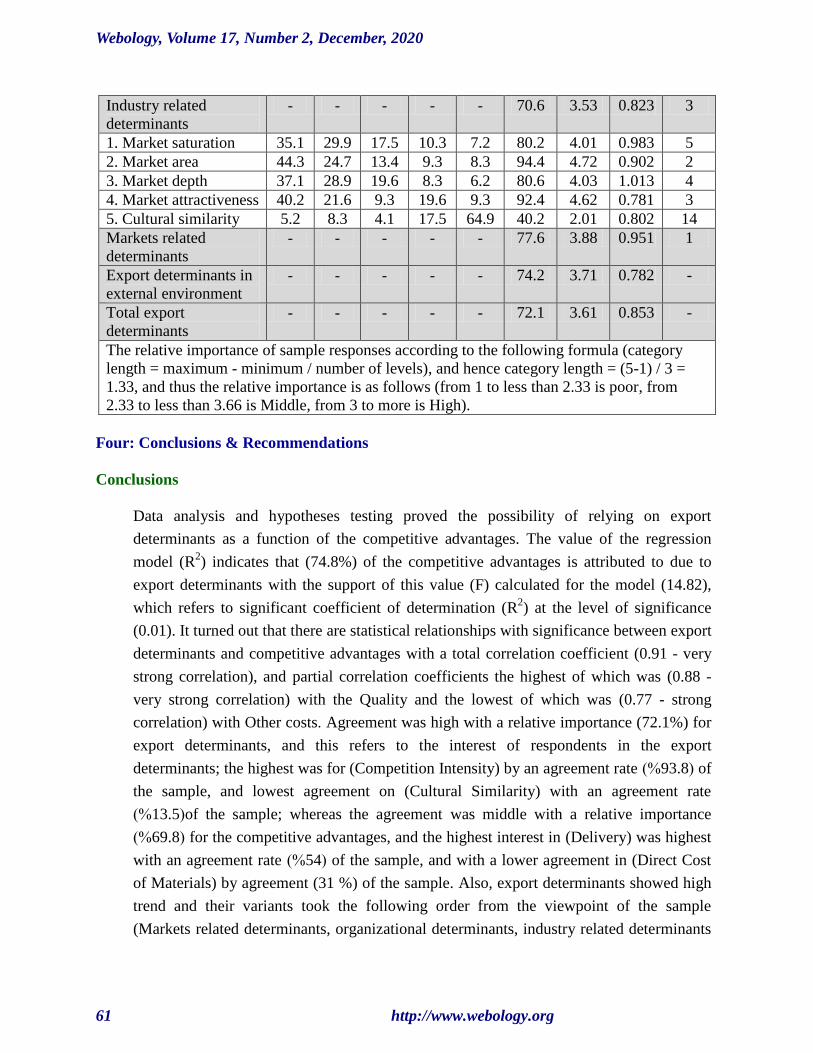
(Second): Analysis and Assessment of Export Determinants
Total arithmetic mean for export determinants in internal environment was (3.50) and
standard deviation was (0.983) and this is a medium values.. The reason behind that is that
the internal environment variables can be predicted and controlled. The partial internal
environment variables reflected different arithmetic means the highest of which was
(3.77) at Management Expectations, and the lowest was (3.25) at the Company Resources
with a standard deviation (0.725) and (0.732), respectively. Percentages of agreement on
the internal environment variables ranged between (56.7% - 71.1%) against rates of
disagreement on the same variables that ranged between (12.4% - 29.9%) of the sample.
Table 8 Export Determinants in Jordanian Medicament Companies
Rank
as
per
impo
rtanc
e
Stand
ard
deviat
ion
Arith
metic
mean
Impo
rtanc
e
indic
ator
%
Importance of variants%
Export determinants Tota
lly
disa
gree
Disa
gree
Neut
ral
Agre
e
Tota
lly
agre
e
1 2 3 4 5
8 1.023 3.67 73.4 9.3 14.4 18.6 29.9 27.8 1. Company size
12 0.732 3.25 65 8.3 6.1 14.4 34 37.1 2. Company resources
7 0.692 3.71 74.2 5.2 7.2 17.5 31.9 38.1 3. Company experience
2 0.825 3.54 70.9 - - - - -Organizational
determinants
11 0.832 3.26 65.2 8.3 10.3 21.6 20.6 39.2 1. Management
aspirations
6 0.725 3.77 75.4 7.2 9.3 16.5 22.7 44.3 2. Management
expectations
10 1.251 3.31 66.2 14.4 15.5 13.4 18.6 3.81 3. Management desire
4 0.901 3.45 69 - - - - -Admin determinants
- 0.983 3.50 70 - - - - -Export determinants in
internal environment
13 0.861 2.32 46.4 32 27.8 16.5 14.4 9.3 1. Industry type
9 0.925 3.34 66.8 10.3 21.6 15.5 38.2 14.4 2. Industry structure
1 0.534 4.92 98.4 1.0 3.1 2.1 21.7 72.1 3. Competition
Intensity
Webology, Volume 17, Number 2, December, 2020
61 http://www.webology.org
3 0.823 3.53 70.6 - - - - -Industry related
determinants
5 0.983 4.01 80.2 7.2 10.3 17.5 29.9 35.1 1. Market saturation
2 0.902 4.72 94.4 8.3 9.3 13.4 24.7 44.3 2. Market area
4 1.013 4.03 80.6 6.2 8.3 19.6 28.9 37.1 3. Market depth
3 0.781 4.62 92.4 9.3 19.6 9.3 21.6 40.2 4. Market attractiveness
14 0.802 2.01 40.2 64.9 17.5 4.1 8.3 5.2 5. Cultural similarity
1 0.951 3.88 77.6 - - - - -Markets related
determinants
- 0.782 3.71 74.2 - - - - -Export determinants in
external environment
- 0.853 3.61 72.1 - - - - -Total export
determinants
The relative importance of sample responses according to the following formula (category
length = maximum - minimum / number of levels), and hence category length = (5-1) / 3 =
1.33, and thus the relative importance is as follows (from 1 to less than 2.33 is poor, from
2.33 to less than 3.66 is Middle, from 3 to more is High).
Four: Conclusions & Recommendations
Conclusions
Data analysis and hypotheses testing proved the possibility of relying on export
determinants as a function of the competitive advantages. The value of the regression
model (R2) indicates that (74.8%) of the competitive advantages is attributed to due to
export determinants with the support of this value (F) calculated for the model (14.82),
which refers to significant coefficient of determination (R2) at the level of significance
(0.01). It turned out that there are statistical relationships with significance between export
determinants and competitive advantages with a total correlation coefficient (0.91 - very
strong correlation), and partial correlation coefficients the highest of which was (0.88 -
very strong correlation) with the Quality and the lowest of which was (0.77 - strong
correlation) with Other costs. Agreement was high with a relative importance (72.1%) for
export determinants, and this refers to the interest of respondents in the export
determinants; the highest was for (Competition Intensity) by an agreement rate (93.8)% of
the sample, and lowest agreement on (Cultural Similarity) with an agreement rate
(13.5)% of the sample; whereas the agreement was middle with a relative importance
(69.8)% for the competitive advantages, and the highest interest in (Delivery) was highest
with an agreement rate (54)% of the sample, and with a lower agreement in (Direct Cost
of Materials) by agreement (31 %) of the sample. Also, export determinants showed high
trend and their variants took the following order from the viewpoint of the sample
(Markets related determinants, organizational determinants, industry related determinants
Webology, Volume 17, Number 2, December, 2020
62 http://www.webology.org
and Admin determinants). Competitive advantages showed a middle level, and their
variants took the following order from the viewpoint of the sample (Delivery, Direct labor
cost, Flexibility, Other costs, Quality, Indirect production costs, Creativity, and Direct
cost of materials). When looking for the reasons behind the lag of competitive advantages
for the Jordanian medicament companies, it was clear that they face different constraints
in the field of the field of their export activities including: External Problems
represented by routine and bureaucracy in state organizations, rising cost of exports
funding, fluctuated rate of exchange and poor government subsidies; Internal Problems
represented by costs of exports funding, lack of human resources qualified in the field of
export, lack of knowledge in the characteristics of export markets, difficulty of meeting
the international specifications and standards related to products design, quality and
packaging, bad efficiency of export sections, and poor R&D level; Procedural Problems
related to transfer of products, delay in payment, and poor processing of export-related
documents; and Information Problems related to customers in foreign countries,
identification of competent distributors, inadequate information on export practices and
procedures in foreign markets and the limited export marketing research.
Recommendations
In-depth studies are recommended to be conducted on the reasons for the growing export
determinants, modesty of competitive advantages of the Jordanian medicament
companies, taking drastic actions to address those causes, and providing necessary
resources to do so, in addition to clearly identifying target competitive advantages (high
quality, low costs, or excellence) as this has a positive impact on framing efforts and
directing the activities and limited resources to achieve the goals set, and export
determinants should be cared for as a major determinant of the competitive advantages,
and the development of structures required to support competitive advantages.
References
Ali, M. (2007). Strategic Management and its Impact on Raising the Performance of Business
Organizations. Tishreen University Journal for Studies and Scientific Research,
Economic and Legal Sciences Series, 39(1).
Al Hayani, B., & Ilhan, H. (2020). Image transmission over decode and forward based
cooperative wireless multimedia sensor networks for Rayleigh fading channels in
medical Internet of Things (MIoT) for remote health-care and health communication
monitoring. Journal of Medical Imaging and Health Informatics, 10(1), 160-168.
Al-Hayani, B., & Ilhan, H. (2020). Efficient cooperative image transmission in one-way multi-
hop sensor network. The International Journal of Electrical Engineering & Education,
57(4), 321-339.
Webology, Volume 17, Number 2, December, 2020
63 http://www.webology.org
Alhayani, B., & Ilhan, H. (2017). Hyper spectral image classification using dimensionality
reduction techniques. International Journal of Innovative Research in Electrical,
Electronics, Instrumentation and Control Engineering, 5, 71-74.
Alhayani, B., & Milind, R. (2014). Face recognition system by image processing. International
journal of electronics and communication engineering & technology (IJCIET), 5(5),
80–90.
Alhayani, B.S. (2020). Visual sensor intelligent module based image transmission in industrial
manufacturing for monitoring and manipulation problems. Journal of Intelligent
Manufacturing, 4, 1-14.
Teece, D.J. (2010). Business models, business strategy and innovation. Long range planning,
43(2-3), 172-194.
Omerzel, D.G., & Gulev, R.E. (2011). Knowledge resources and competitive
advantage. Managing global transitions, 9(4), 335.
Fernandez, A.I., Lara, P.R., Ugalde, M.C., & Sisodia, G.S. (2018). Distinctive competencies
and competency-based management in regulated sectors: A methodological proposal
applied to the pharmaceutical retail sector in Spain. Journal of Retailing and Consumer
Services, 42, 29-36.
Hair, J.F., Black, W.C., Babin, B.J., Anderson, R.E., & Tatham, R.L. (2009). Multivariate
Data Analysis. 7th ed, Upper Saddle River. N.j: Pearson / Prentice Hall.
Hill, W.L.C., & Jones, R.G. (2013). Strategic Management an Integrated Approach. Houghton
Mifflin Puplised, U.S.A.
Takatoshi, I.T.O., Koibuchi, S., Sato, K., & Shimhzu, J. (2010). Determinants of Currency
Invoicing in Japanese Exports: A firm-level analysis. The Research Institute of
Economy, Trade and Industry Discussion Paper.
Smith, T.M., & Reece, J.S. (1999). The relationship of strategy, fit, productivity, and business
performance in a services setting. Journal of Operations Management, 17(2), 145-161.
Bryson, J.M., Ackermann, F., & Eden, C. (2007). Putting the resource‐based view of strategy
and distinctive competencies to work in public organizations. Public administration
review, 67(4), 702-717.
Carneiro, J., Rocha, A.D., & Silva, J.F.D. (2011). Determinants of export performance: a study
of large Brazilian manufacturing firms. BAR-Brazilian Administration Review, 8(2),
107-132.
Villanueva, J., Yoo, S., & Hanssens, D.M. (2008). The impact of marketing-induced versus
word-of-mouth customer acquisition on customer equity growth. Journal of marketing
Research, 45(1), 48-59.
Kraaijenbrink, J., Spender, J.C., & Groen, A.J. (2010). The resource-based view: a review and
assessment of its critiques. Journal of management, 36(1), 349-372.
Baroto, M.B., Abdullah, M.M.B., & Wan, H.L. (2012). Hybrid strategy: A new strategy for
competitive advantage. International Journal of Business and Management, 7(20),
120-133.
McFarland, K.R. (2008). The Breakthrough company: How Everyday Companies Become
Extraordinary performs. Crown Business Publisher, U.S.A.
Webology, Volume 17, Number 2, December, 2020
64 http://www.webology.org
Miller, J. (2003). Game Theory AT work: How to use Game theory Out think and Outmaneuver
your competence. McGraw Hill publisher, U.S.A.
Miuyn, W. (2010). The Search for Sustainable Competitive Advantage: A Stakeholder
Management Perspective. Thesis of Doctor of Philosophy in Management at Massey
University Albany, New Zaland.
Akhtar, N., Khan, R.A., & Mujtaba, B.G. (2013). Exploring and measuring organizational
learning capability and competitive advantage of petroleum industry firms. International
Business and Management, 6(1), 89-103.
Daneshvar, P., & Ramesh, H.N. (2010). Review of information technology effect on
competitive advantage–strategic perspective. International journal of engineering
science and technology, 2(11), 6248-6256.
Rose, R.C., Abdullah, H., & Ismad, A.I. (2010). A Review on the Relationship between
Organizational Resources, Competitive Advantage and Performance. Journal of
International Social Research, 3(11), 488-498.
Andreu, R., Baiget, J., & Canals, A. (2008). Firm‐specific knowledge and competitive
advantage: evidence and KM practices. Knowledge and Process Management, 15(2),
97-106.
Rosane, G., David, G., & Dennis, G. (2003). Brazilian Exporters: Non-Financial Export
Performance Measurements and Their Determinants. Journal of International Business
and Cultural Studies, 2, 1-12.
Sekaran, U. (2003). Research Methods for Business. John Wiley and Sons, U.S.A.
Smit, A.J. (2010). The competitive advantage of nations: is Porter’s Diamond Framework a
new theory that explains the international competitiveness of countries?. Southern
African Business Review, 14(1).
Voigt, K.I., Buliga, O., & Michl, K. (2017). Introduction. In Business Model Pioneers.
Springer, Cham.
Whitney, D., & Cooprider, D. (2009). Appreciative Inquiry: Appositive Revolution in Change.
Berrett – Koehler Publishers, U.S.A.


