
1
Exploitation Reduces Novelty:
An Empirical Analysis of the Japanese Video Game Industry
Takeaki WADA
Abstract: Firms accumulate knowledge through product development activities such as efficient product design, various experimental data, and know-how of project management. By exploiting this knowledge, firms are able to improve product quality, reduce cost, and shorten the development lead time. The more firms accumulate knowledge, the more they are able to gain competitiveness by exploiting their knowledge. However, because of efficiency gained by exploitation, firms can sometimes excessively exploit their knowledge, thus making their products too similar to and less attractive than earlier products and, as a result, lose competitiveness. In this paper, we employ a time series analysis to show that excess exploitation of know-how reduced product creativity in the Japanese video game industry. Keyword: exploitation of know-how, novelty, Japanese video game industry
1. Introduction
This study aims to empirically show that the exploitation of know-how in product development leads to a decline in the novelty of products in the Japanese video game industry.
This study is based on the concepts of exploitation and exploration in the context of an organization. An organization studies and acquires efficient problem-solving routines through continual problem solving. However, if an organization relies heavily on problem-solving routines aimed at providing efficiency under the present conditions, it becomes difficult to implement these routines in different environments (Levitt & March, 1988). Organizations have to exploit current problem-solving routines to be efficient; simultaneously, they have to explore new routines corresponding to environmental changes.
However, on a short-term basis, exploitation of effective problem-solving routines offers its own set of advantages; thus, organizations tend to choose exploitation and lose competitiveness in the long run (Levinthal & March, 1993; March, 1991).
A firm’s product development process is also a cyclic problem-solving process (Clark & Fujimoto, 1991), and the same can be said of product development activities. Firms acquire a variety of know-how through previous problem-solving activities while developing products, such as well product design, various experimental data, and
School of Business, Aoyama Gakuin University, [email protected]
Annals of Business Administrative Science 10 (2011) 1–12 Available at www.gbrc.jp
Online ISSN 1347-4456 Print ISSN 1347-4464©2011 Global Business Research Center

Takeaki Wada
2
project management know-how. By exploiting their know-how, firms are able to improve product quality incrementally, reduce cost, shorten development lead time, and make product development activity more efficient. However, if they exploit their know-how excessively, the new product will offer nothing different from and will not be technologically advanced than the previous version. Therefore, from the long-term perspective of maintaining the appeal and competitiveness of their products, firms have to explore the new attribute of a product and new technology.
Benner and Tushman (2002) analyze the photography and paint industries and show applying for a patent becomes passive in the firms that meet the ISO 9000 standards. They insist that to meet these standards, firms need to improve their management process, for which they need to consider exploiting the management process instead of the patent application process. Benner and Tushman (2003) explained productivity dilemma (Abernathy, 1978) as a trade-off between the exploitation of the current production processes and the exploration of new products.
Like Benner and Tushman (2003), Ikuine (2006) discussed excessive exploitation in product development, but indicated that excessive exploitation tends to occur in the software industry, which has almost no production process to exploit.
Ikuine (2006) pointed out that in the Japanese video game industry, firms accumulated development know-how and the merits of exploitation became far more substantial. Subsequently, firms focused on developing sequels like Dragon Quest (Dragon Warrior in the U.S.) II and III. In contrast, firms display a passive attitude while exploring novel video game concepts that makes video games unappealing to consumers.
Ikuine (2006) termed this trade-off between exploiting know-how and exploring a new product as productivity dilemma in development. Further, he indicated that excess exploitation in development reduces the novelty of video games and shrinks the Japanese video game market.
This paper empirically shows how exploitation of development know-how reduced novelty in the Japanese video game industry. For this purpose, it analyzes the effect of productivity dilemma in development.
2. Overview of the Japanese Video Game Industry and
Effect of Excessive Exploitation in Development
This section gives an overview of the Japanese video game industry and the game development process, and explains, with the help of previous studies, how excessive exploitation affects sales when development takes place.
2.1. Overall condition of the Japanese video game industry
The video game industry in Japan started with the import and copy of American consoles. Subsequently, the Japanese firms accumulated the development know-how gradually through the imitation process (Sunagawa, 1998).
The Japanese video game industry grew substantially in 1983 when Nintendo introduced the Family Computer (Nintendo Entertainment System).
Nintendo practiced a quasi-closed policy strategy: it supplied hardware exclusively

Exploitation reduces novelty
3
(closed), but openly announced that it developed video games for software developers (Asaba, 1995). As a result, many software developers entered the industry, resulting in the development of various video games and the subsequent rapid growth of the market. Figure 1 shows the market growth (number base) of the console video game software in Japan after 1983.
Figure 1 shows that the Japanese video game market matured in the late 1980s and dematured in the 1990s with the release of a new hardware, Super Famicom (Super NES). Subsequently, it matured again in the late 1990s in spite of the release of a new hardware, Sony PlayStation 2 (PS2).
2.2. Development process of Japanese video game developing firms
Japanese video game firms developed their products through an integrally coordinated process and not through a waterfall model (Sunagawa, 1998; Tatsumoto, 2003).
Initially, they decided on a simple, vague concept for the video game project. They defined specifications during the developing, testing, tuning, and revising stages of the game program, and in this process, the game content was improved and enriched (Ikuine, 2000; Sunagawa, 1998; Tatsumoto, 2003).
Firms accumulate know-how and assets—for example, appealing characters like Mario from Super Mario, technique of programming, and know-how of project management—by developing video games. By exploiting some specifications from earlier games, firms can obtain concrete specifications and thus shorten development lead time. By exploiting their knowledge, they can solve problems in the tuning and revising stages expeditiously. Therefore, exploitation of knowledge makes the development process more efficient.
Nevertheless, if firms exploit their know-how excessively, they will develop new video games that are almost similar to previous ones. Video game users (or gamers) want innovative, original, and interactive games (Ikuine, 2000), and exploitation makes video games less attractive.
As mentioned in section 1, Ikuine (2006) termed this trade-off between gain in
Figure 1. Growth of the Japanese console video game software market (number)
0
10
20
30
40
50
60
70
80
90
1983 1985 1987 1989 1991 1993 1995 1997 1999 2001
Million
Family Computer (NES) Super Famicom (SNES) PlayStation
PS2 Other console hardware
Source: Tokyo gangu ningyo donya, Toy Journal [to-i ja-naru], each year.
Takeaki Wada
4
productivity and loss of attraction by exploitation as productivity dilemma in development. Ikuine (2006) investigated the Japanese video game market and verified that Japanese video game makers were inclined to exploit their know-how in the late 1990s. Thus, he concluded that excessive exploitation was the reason that the Japanese video game market shrunk (Figure 1).
2.3. Aim of this paper
However, Ikuine’s (2006) analysis has a limitation in that it measures the degree of exploitation using sequels of games. Ikuine showed that there was an increase in the number of video game series and that the sales of sequels in a series were significantly higher than the sales of non-series games.
Developing sequels as part of a series typically involves exploiting characters, the virtual world, game platforms, and programs from earlier parts in the series. However, certain know-how like program technique and project management, which are not specific to a series, can also be exploited. This can be further explained using a more familiar product, namely, an automobile; Toyota manufactures the Corrolla series, and they exploit know-how obtained through the development of earlier models. For example, when they started manufacturing another series, the Lexus, they could exploit know-how obtained from the development of the Corolla series.
Therefore, to measure the degree of exploitation more precisely, indexes of exploitation other than that of the game series is required. Therefore, this paper presents methodology and indexes that measure the degree of exploitation using product diffusion curve.
3. Methodology
3.1. Sales curve of software product and effect of exploitation
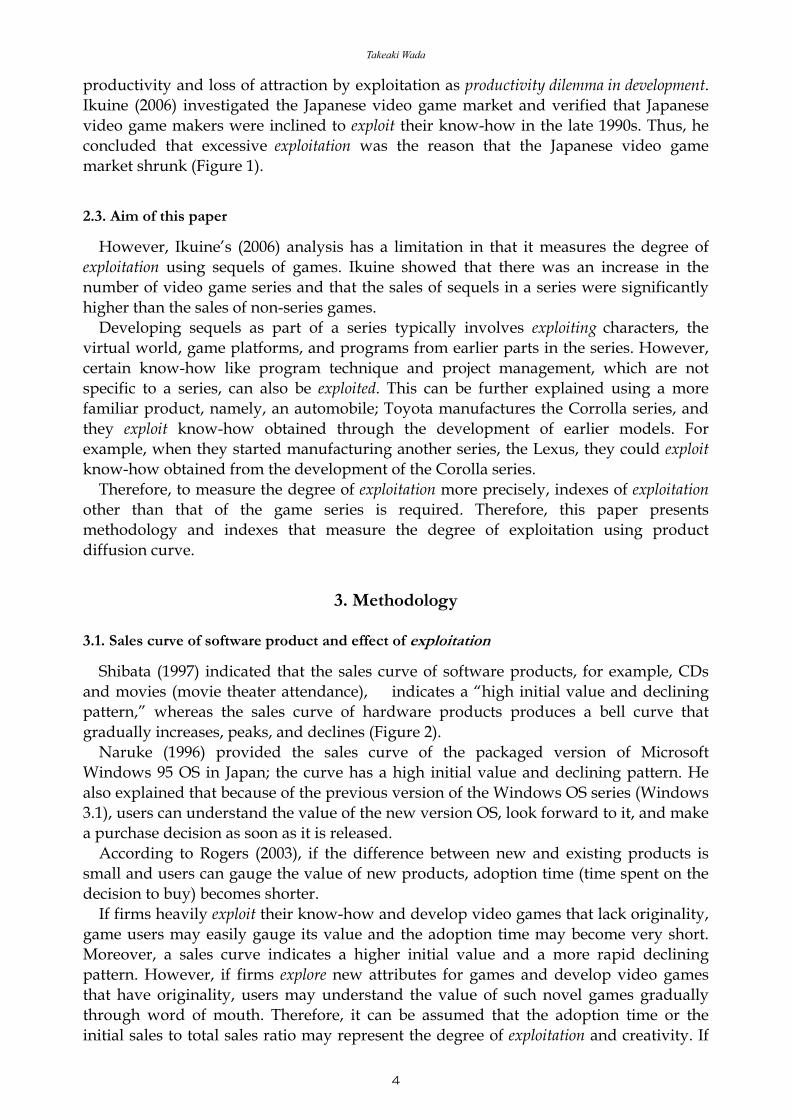
Shibata (1997) indicated that the sales curve of software products, for example, CDs and movies (movie theater attendance), indicates a “high initial value and declining pattern,” whereas the sales curve of hardware products produces a bell curve that gradually increases, peaks, and declines (Figure 2).
Naruke (1996) provided the sales curve of the packaged version of Microsoft Windows 95 OS in Japan; the curve has a high initial value and declining pattern. He also explained that because of the previous version of the Windows OS series (Windows 3.1), users can understand the value of the new version OS, look forward to it, and make a purchase decision as soon as it is released.
According to Rogers (2003), if the difference between new and existing products is small and users can gauge the value of new products, adoption time (time spent on the decision to buy) becomes shorter.
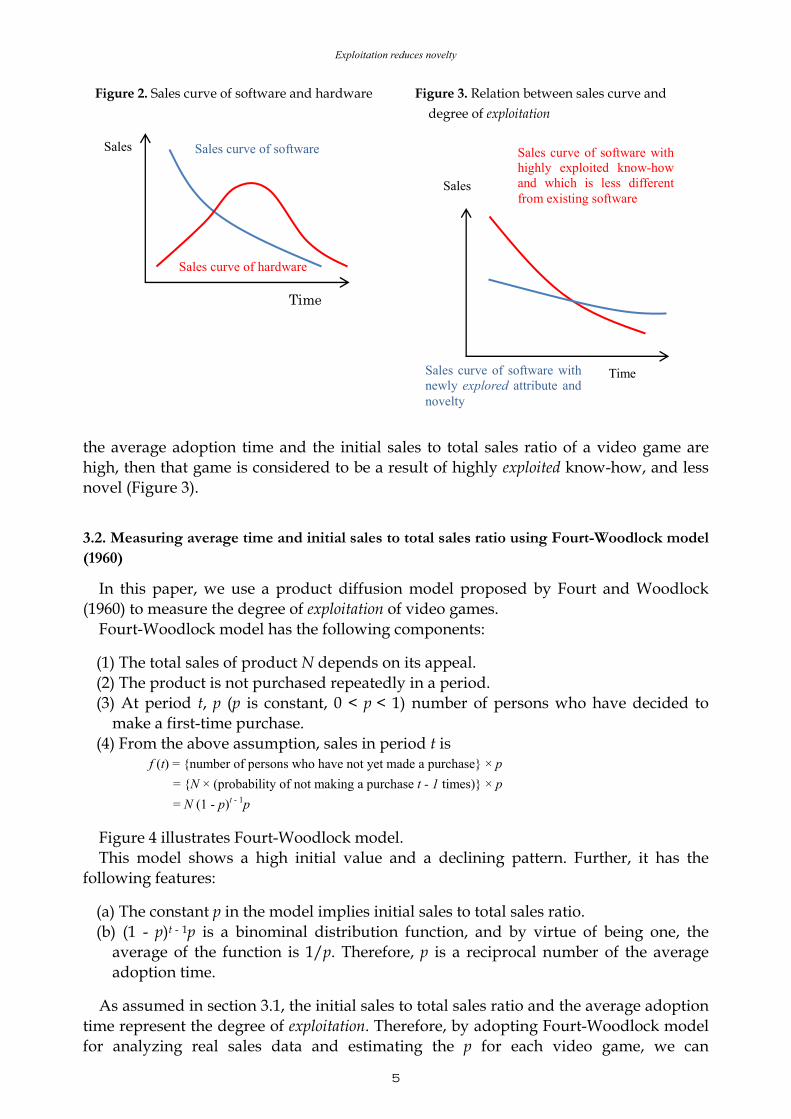
If firms heavily exploit their know-how and develop video games that lack originality, game users may easily gauge its value and the adoption time may become very short. Moreover, a sales curve indicates a higher initial value and a more rapid declining pattern. However, if firms explore new attributes for games and develop video games that have originality, users may understand the value of such novel games gradually through word of mouth. Therefore, it can be assumed that the adoption time or the initial sales to total sales ratio may represent the degree of exploitation and creativity. If
Exploitation reduces novelty
5
the average adoption time and the initial sales to total sales ratio of a video game are high, then that game is considered to be a result of highly exploited know-how, and less novel (Figure 3).
3.2. Measuring average time and initial sales to total sales ratio using Fourt-Woodlock model (1960)
In this paper, we use a product diffusion model proposed by Fourt and Woodlock (1960) to measure the degree of exploitation of video games.
Fourt-Woodlock model has the following components: (1) The total sales of product N depends on its appeal. (2) The product is not purchased repeatedly in a period. (3) At period t, p (p is constant, 0 < p < 1) number of persons who have decided to
make a first-time purchase. (4) From the above assumption, sales in period t is
f (t) = {number of persons who have not yet made a purchase} × p
= {N × (probability of not making a purchase t - 1 times)} × p
= N (1 - p)t - 1p Figure 4 illustrates Fourt-Woodlock model. This model shows a high initial value and a declining pattern. Further, it has the
following features: (a) The constant p in the model implies initial sales to total sales ratio. (b) (1 - p)t - 1p is a binominal distribution function, and by virtue of being one, the
average of the function is 1/p. Therefore, p is a reciprocal number of the average adoption time.
As assumed in section 3.1, the initial sales to total sales ratio and the average adoption
time represent the degree of exploitation. Therefore, by adopting Fourt-Woodlock model for analyzing real sales data and estimating the p for each video game, we can
Figure 2. Sales curve of software and hardware
Time
Sales Sales curve of software
Sales curve of hardware
Figure 3. Relation between sales curve and
degree of exploitation
Time
Sales curve of software with highly exploited know-how and which is less different from existing software
Sales
Sales curve of software with newly explored attribute and novelty

Takeaki Wada
6
distinguish between a relative exploitative/less novel game and a relative explorative/more novel game.
3.3. Model transformation for analysis
Nonlinear regression is required for estimating p in Fourt-Woodlock model. To estimate p more easily, in this paper, the model is transformed as given below.
f (t) = {number of persons who had not yet made a purchase} × p
and, it can transform as
f (t) = {N – cumulative number of persons who had made a purchase at the start point of period t} × p
= {N - Σ1t - 1f (t)} × p
= Np - pΣ1t - 1f (t)
Then, Fourt-Woodlock model can be described as linear function of cumulative and
periodical sales, as shown in Figure 5. By this transformation, p can be estimated by a simple linear regression analysis.
4. Analysis
4.1. Analysis procedure
First, using a linear regression analysis with weekly sales data, we estimate the p in Fourt-Woodlock model of each video game.
Then, by setting p as a dependent variable and setting variables related to exploitation as independent variables, we perform a multiple regression analysis.
4.2. Estimating p in Fourt-Woodlock model
4.2.1. Data set
To estimate p, the weekly sales data of video games, provided by Media Create Co.,
Figure 4. Fourt-Woodlock model (1960)
0
50
100
150
200
250
300
350
1 3 5 7 9
Sales
Period
Settings: N = 1,000 P = 0.3
Figure 5. Transformed Fourt-Woodlock model
0
50
100
150
200
250
300
350
0 500 1000
Sales at t
Cumilative sales at t-1
Settings: N = 1,000 P = 0.3
N
inclination = ‐p= ‐0.3

Exploitation reduces novelty
7
Ltd., were used for analysis in this paper. Media Create estimated the weekly sales by surveying sales in retail stores and divided them by the market share of the stores.
This paper screened these weekly sales data according to the criteria given below: a. A certain number of data is required to maintain the robustness of linear regression
analysis. Thus, video games that have data for 10 consecutive weeks’ data upon release are selected and their data were used for analysis.
b. In the Japanese video game market, an indication of commercial success is the 1-million-sale mark. Therefore, video games that sold more than a million copies were selected.
c. Video games for consoles released in 1997 to 2000 were selected. As a result of this screening, data sets of 434 video games remain.
4.2.2. Estimating p
Next, using these data sets, we estimate p by a linear regression analysis. Figure 6 illustrates the results of applying the model of Final Fantasy VII. In this case, the estimated p is 0.684.
Some video games have a sales curve that does not display a high initial value and declining pattern. In this case, the estimated p is invalid (Figure 7).
If p is estimated as a negative value, that video game is considered the least exploitative one, and p is set as 0.
4.3. Independent and control variables
To explain p, four independent variables and five control variables are set.
4.3.1. Independent variables
(1) The number of years since the Japanese video game market was established In due course, firms develop many video games by exploiting (or possibly imitating)
ideas from existing video games, for example, game genres and platforms. As it is
Figure 6. Four-Woodlock model (1960) applied
to Final Fantasy VII
y = ‐0.684 x + 1,953,335.528 R² = 0.975
0
500,000
1,000,000
1,500,000
2,000,000
2,500,000
0 2,000,000
Weeklysales
Cumilative sales
Figure 7. Fourt-Woodlock model (1960) applied
to IQ: Intelligent Qube
y = 0.095 x + 19,588.415 R² = 0.643
0
10,000
20,000
30,000
40,000
50,000
60,000
0 100,000 200,000 300,000
Weekly sales
Cumilative sales

Takeaki Wada
8
assumed that the video game will be released years later, the p estimated by Fourt-Woodlock model increases.
The variable that represents the industry-wide know-how accumulation is set as below.
The number of years passed since the market was established = Published year of the game – 1983 + 1
(2) The number of years since the video game publisher entered the video game
industry Firms accumulate knowledge assets like appealing characters, program technique,
and project management know-how through previous development activities. In addition, more experienced firms have the incentive to exploit their knowledge. Therefore, we assume that if the year since the development firm of the video game was established is longer, the p estimated by Fourt-Woodlock model increases.
The variable that represents intra-firm know-how accumulation is set as below.
The number of years since the publisher entered the video game industry = Year in which the game was
released – Year in which the publisher published its first video game + 1 To obtain the year in which firms published their first video game, this paper uses a
game “bibliography,” Kougien, published by Ambit Corporation as data source. (3) The cumulative number of video games released by the video game publisher As mentioned above, firms accumulate knowledge assets through past development
activities. Moreover, if two firms have been conducting business for the same amount of time, then the amount of knowledge assets would differ by the number of video games they published. It is assumed that the cumulative number of video games released by the publisher is larger, considering that the p estimated by Fourt-Woodlock model increases.
The variable that represents intra-firm know-how accumulation is set as below.
The cumulative number of video games released by the publisher until the previous year when the game
was released To obtain the number of video games that firms have released, this paper uses Kougien
as a data source. However, this variable includes number of video games for portable hardware; regular and limited editions of games are counted as two, which does not give a precise value.
(4) The number of years since the hardware of the video game was released Ikuine (2006) indicated that, by releasing new hardware, it is possible to develop more
expressive games that utilize high-end platforms and that have to adapt to new specifications of new hardware. Thus, it is assumed that the shorter the time since the release of the video game hardware, the more explorative video game developing activities and the smaller the estimated p.
The variable that represents know-how in terms of becoming adept at hardware is set as below.
The number of years since the release of the game’s hardware

Exploitation reduces novelty
9
4.3.2. Control variables
(i) Price There are two price zones in the video game industry, one is the regular price zone
that ranges from ¥4,800 to ¥7,800, and the second is the economic price zone that ranges from ¥1,500 to ¥2,800. Regular-priced games have a sufficient budget for advertisement and promotion before release, but economically priced games are not generally advertised.
Promotion educates users about video games, assists purchase decisions, and increases the estimated p. To control this promotion effect on p, the price of games is set as a control variable.
(ii) Series dummy If a video game has a sequel, it is assumed that much know-how is exploited because
such an exploitation of previous games in a series is easy and makes the development process efficient.
To control for the difficulty of exploitation, dummy variables (= 1 if sequel is made, and 0 otherwise) are set as control variables.
(iii) Popular edition dummy Popular video game editions are set at a lower price than a hit video game released
earlier, similar to how the soft-cover edition of a book is priced lower than the hardcover edition.
Consumers who purchase popular video game editions are considered as laggards in the product diffusion process. Thus, the estimated p is assumed to be lower in popular editions.
To control this difference in user characteristics, dummy variables (= 1 if popular edition, and 0 if regular edition) are set as control variables.
(iv) Hardware dummy In Japan, apparently, Nintendo’s hardware is popular among teenagers and families,
and Sony’s hardware, among consumers in the 20–30 age group. To control this difference in user demographics, a hardware dummy variable
(Nintendo 64 game or not, Sega Saturn game or not, Dreamcast game or not, PS2 game or not, and PlayStation dummy is excluded) are set as a control variable.
(v) Technology-driven game dummy Ikuine (2003) indicated that some video games need an advanced program and a
richer interface; he called them technology-driven games. In these video games, exploitation is important.
Following Ikuine (2003), the technology-driven game dummy variable (= 1 if the game’s genre is action, fighting, shoot 'em up, racing, sport, or board, and 0 otherwise) is set as a control variable.

Takeaki Wada
10
4.4. Multiple regression analysis and results
Table 1 shows the correlation between independent variables. The results for models 1, 2, and 4 show that the independent variables (1) number of
years since market was established, (2) number of years since the firm entered the industry, and (4) number of years since hardware released are positively correlated with p. These results support the assumption that the more the firms accumulate know-how, the more they exploit it.
Table 2. Results by multiple regression
model 1 model 2 model 3 model 4 model 5
number of data 434
R2 0.491 0.498 0.459 0.502 0.548
adjusted R2 0.481 0.488 0.447 0.491 0.535
constant -0.434*** (-3.741)
0.116*** (3.807)
0.158*** (5.137)
-0.049 (-1.084)
1.309*** (3.187)
(1) number of years since the market was established
0.036*** (5.302)
-0.12*** (-3.356)
(2) number of years since the firm entered the industry
0.009*** (5.847)
0.009*** (5.366)
(3) cumulative number of video games the firm published
0.000 (0.95)
-0.000*** (-3.065)
(4) number of years since the hardware released
0.040*** (6.11)
0.151*** (4.313)
(i) price 0.000*** (8.078)
0.000*** (6.403)
0.000*** (7.606)
0.000*** (7.915)
0.000*** (5.761)
(ii) series dummy 0.074*** (5.957)
0.061*** (4.767)
0.077*** (5.908)
0.072*** (5.863)
0.058*** (4.785)
(iii) popular edition dummy -0.168*** (-4.971)
-0.181*** (-5.42)
-0.183*** (-5.278)
-0.156*** (-4.629)
-0.130*** (-3.923)
(iv) Nintendo 64 dummy -0.069*** (-3.081)
-0.089*** (-3.909)
-0.063*** (-2.699)
0.011 (0.431)
0.215*** (2.902)
Sega Saturn dummy 0.188*** (8.746)
0.163*** (7.983)
0.149*** (6.835)
0.192*** (9.032)
0.210*** (9.708)
Dreamcast dummy 0.113*** (4.969)
0.142*** (6.550)
0.140*** (5.764)
0.269*** (9.191)
0.741*** (5.248)
PS2 dummy -0.040
(-1.232) 0.012
(0.408) 0.022
(0.718) 0.194*** (4.765)
0.870*** (4.094)
(v) technology-driven game dummy
-0.049*** (-3.854)
-0.061*** (-4.844)
-0.057*** (-4.310)
-0.048*** (-3.773)
-0.046*** (-3.770)
Note: In each column, the first number is the regression coefficient and the second number is the t-value. ***: 1% significance, **: 5% significance
Table 1. Correlation between independent variables
Independent Variable (1)
Independent Variable (2)
Independent Variable (3)
Independent Variable (4)
Independent Variable (1) 1
Independent Variable (2) 0.2641 1
Independent Variable (3) 0.2337 0.4937 1
Independent Variable (4) 0.2114 -0.0033 -0.1419 1

Exploitation reduces novelty
11
The result for model 3 shows that the independent variable (3) cumulative number of video games firm published is not correlated with p, and it is contrary to the assumption. Some video game publishers outsource the development of video games and only specialize in publishing. Thus, the number of video games published by the firm may not represent the number of video games developed by it.
The series dummy variable is positively correlated to p in all the results across models, and it is consistent with Ikuine’s (2006) result. Moreover, independent variables are significantly correlated with p even if the series dummy variable is controlled. It means that there is exploitation of know-how between video games that do not have sequels.
In the result for model 5, the independent variable (1) number of years since the market was established is negatively correlated with p. From Table 1, we assume a weak multi-collinearity between independent variables. In addition, a positive correlation effect on then p of the independent variable (1) might be absorbed by the independent variables (2) and (4). Leaving aside whether or not this assumption is true, independent variables (2) and (4) still have a significant and positive effect on p and accumulation of know-how have a negative effect on novelty.
5. Conclusion and Discussion
This paper proves that, gradually, firms accumulate know-how, exploitation of know-how increases, and products become more exploitative but less novel in the Japanese video game market; this finding is based on an analysis of a product diffusion model.
The Japanese video game market declined in 1997–2000, the period for which the analysis was carried out (Figure 1). Ikuine (2006) attributed this decline to the exploitation of know-how between game sequels; the results of this paper support this finding.
The analysis method proposed in this paper is based on a general discussion of product diffusion. Therefore, to confirm the general applicability of this method and to expand the findings, it is necessary to analyze another industry.
References
Abernathy, A. J. (1978). The productivity dilemma: Roadblock to innovation in the automobile industry. Baltimore, MD: Johns Hopkins University Press.
Asaba, S. (1995) Kyo-so- to kyo-ryoku no senryaku: Gyo-kai hyoujun wo meguru kigyou koudou [Competitive and cooperative strategy: Firm behavior toward industrial standard]. Tokyo: Yuhikaku. (in Japanese)
Benner, M. J., & Tushman, M. L. (2002). Process management and technological innovation: A longitudinal study of the photography and paint industry. Administrative Science Quarterly, 47, 676–706.
Benner, M. J., & Tushman, M. L. (2003). Exploration, exploitation, and process management: The productivity dilemma revisited. Academy of Management Review, 28(2), 238–256.
Clark, K. B., & Fujimoto, T. (1991). Product development performance. Boston: Harvard Business School Press.
Fourt, L. A., & Woodlock, J. W. (1960). Early prediction of market success for new grocery products. Journal of Marketing, 25, 31–38.
Ikuine, F. (2000). Katei you ge-mu sofuto no seihin kaihatsu: Syouhisya kansei no simyure-to

Takeaki Wada
12
[Product development of home video game software: Simulation of consumer’s sense]. In T. Fujimoto, & M. Yasumoto (Eds.), Seikou suru seihin kaihatsu [Successful Product Development] (pp. 187–207). Tokyo: Yuhikaku. (in Japanese)
Ikuine, F. (2003). Sofuto kaihatsu no naisei/ gaisei to pafo-mansu [Intra-firm and Inter-firm software development and performance]. In J. Shitaku, T. Tanaka, & N. Yanagawa (Eds.), Ge-mu sangyou no keizai bunseki [Economic analysis on game industry] (pp. 207–233). Tokyo: Toyo Keizai Shinpo-sya. (in Japanese)
Ikuine, F. (2006). Gemu sofuto no inobe-syon pata-n: Kaihatsu seisansei no direnma [Innovation pattern in game soft industry: productivity dilemma in development]. Unpublished doctoral dissertation. University of Tokyo, Japan. (in Japanese)
Levinthal, D. A., & March, J. G. (1993). The myopia of learning. Strategic Management Journal, 14, 95-112.
Levitt, B., & March, J. G. (1988). Organizational learning. Annual Review of Sociology, 14, 319–340.
March, J. G. (1991). Exploration and exploitation in organizational learning. Organization Science, 2(1), 71–87.
Naruke, S. (1996). Uindo-zu 95 wo sasaeru defakuto sutanda-do senryaku [Strategy for supporting Windows 95 to win de facto standard]. Daiamondo Ha-ba-do Bijinesu [Diamond Harvard Business] (1996, February-March), 38–46. (in Japanese)
Rogers, E. M. (2003). Diffusion of innovation. New York: Free Press. Shibata, T. (1997). Maruchimedia kontentsu no jigyo-senryaku [Business strategy for
multimedia contents]. Ofisu O-tome-syon [Office Automation], 17(5), 55–61. (in Japanese) Sunagawa, K. (1998). Nihon ge-mu sangyo ni miru kigyo-sya katsudo-no keiki to gijutsu
senryaku [Succession of entrepreneurship and technological strategy in Japanese game industry]. Keiei Shigaku [Japan Business History Review] 32(4), 1–27. (in Japanese)
Tatsumoto, H. (2003). Ge-mu sofuto to sofutouea kaihatsu purosesu [Game soft and software development process]. In J. Shitaku, T. Tanaka, & N. Yanagawa (Eds.), Ge-mu sangyou no keizai bunseki [Economic analysis on game industry] (pp. 235–257). Tokyo: Toyo Keizai Shinpo-sya. (in Japanese)
[Received June 30, 2010; accepted October 31, 2010]


