Seediscussions,stats,andauthorprofilesforthispublicationat:https://www.researchgate.net/publication/228773987
ExplainingStructuredErrorsinGigabitEthernet
ARTICLE·APRIL2005
READS
13
4AUTHORS,INCLUDING:
AndrewW.Moore
UniversityofCambridge
105PUBLICATIONS2,202CITATIONS
SEEPROFILE
Allin-textreferencesunderlinedinbluearelinkedtopublicationsonResearchGate,
lettingyouaccessandreadthemimmediately.
Availablefrom:AndrewW.Moore
Retrievedon:22January2016
Explaining Structured Errors in Gigabit Ethernet Andrew W. Moore, Laura B. James, Richard Plumb and Madeleine Glick
IRC-TR-05-032
March 2005
1
INFORMATION IN THIS DOCUMENT IS PROVIDED IN CONNECTION WITH INTEL® PRODUCTS. NO LICENSE, EXPRESS OR IMPLIED, BY ESTOPPEL OR OTHERWISE, TO ANY INTELLECTUAL PROPERTY RIGHTS IS GRANTED BY THIS DOCUMENT. EXCEPT AS PROVIDED IN INTEL'S TERMS AND CONDITIONS OF SALE FOR SUCH PRODUCTS, INTEL ASSUMES NO LIABILITY WHATSOEVER, AND INTEL DISCLAIMS ANY EXPRESS OR IMPLIED WARRANTY, RELATING TO SALE AND/OR USE OF INTEL PRODUCTS INCLUDING LIABILITY OR WARRANTIES RELATING TO FITNESS FOR A PARTICULAR PURPOSE, MERCHANTABILITY, OR INFRINGEMENT OF ANY PATENT, COPYRIGHT OR OTHER INTELLECTUAL PROPERTY RIGHT. Intel products are not intended for use in medical, life saving, life sustaining applications. Intel may make changes to specifications and product descriptions at any time, without notice. Copyright © Intel Corporation 2003 * Other names and brands may be claimed as the property of others.
Explaining Structured Errors in Gigabit EthernetAndrew W. Moore
�, Laura B. James
�, Richard Plumb
�and Madeleine Glick
��University of Cambridge, Computer Laboratory
[email protected]�University of Cambridge, Department of Engineering, Centre for Photonic Systems�
lbj20,rgp1000 � @eng.cam.ac.uk�Intel Research, [email protected]
Abstract— A physical layer coding scheme is designed to
make optimal use of the available physical link, providing
functionality to higher components in the network stack.
This paper presents results of an exploration of the errors
observed when an optical Gigabit Ethernet link is subject
to attenuation. In the unexpected results, highlighted by
some data payloads suffering from far higher probability
of error than others, an analysis of the coding scheme
combined with an analysis of the physical light path leads
us to conclude that the cause is an interaction between the
physical layer and the 8B/10B block coding scheme. We
consider the physics of a common type of laser used in
optical communications, and how the frequency charac-
teristics of data may affect performance. A conjecture is
made that there is a need to build converged systems, with
the combinations of physical, data-link, and network layers
optimised to interact correctly. In the mean time, what will
become increasingly necessary is both an identification of
the potential for failure and the need to plan around it.
Topic Keywords: Optical Networks, Network
Architectures, System design.
I. INTRODUCTION
Many modern networks are constructed as a series of
layers. The use of layered design allows for the modular
construction of protocols, each providing a different
service, with all the inherent advantages of a module-
based design. Network design decisions are often based
on assumptions about the nature of the underlying layers.
For example, design of an error-detecting algorithm, such
as a packet checksum, will be based upon a number of
premises about the nature of the data over which it is to
work and assumptions about the fundamental properties
of the underlying communications channel over which it
is to provide protection.
Yet the nature of the modular, layered design of
network stacks has caused this approach to work against
the architects, implementers and users. There exists a
tension between the desire to place functionality in the
most appropriate sub-system, ideally optimised for each
incarnation of the system, and the practicalities of mod-
ular design intended to allow independent developers to
construct components that will inter-operate with each
other through well-defined interfaces. Past experience
has lead to assumptions being made in the construction
or operation of one layer’s design that can lead to
incorrect behaviour when combined with another layer.
There are numerous examples describing the problems
caused when layers do not behave as the architects
of certain system parts expected. One might be the
previous vendor recommendation (and common practice)
for disabling UDP checksums, because the underlying
Ethernet FRC was considered sufficiently strong, led
to data corruptions for UDP-based NFS and network
name (DNS) services [1]. Another example is the re-
use of the 7-bit scrambler for data payloads [2], [3].
The 7-bit scrambling of certain data payloads (inputs)
results in data that is (mis)identified by the SONET [4]
system as belonging to the control channel rather than the
information channel. Also, Tennenhouse [5] noted how
layered multiplexing had a significant negative impact
upon an application’s jitter.
It is our conjecture that this naıve layering, while often
considered a laudable property in computer communica-
tions networks, can lead to irreconcilable faults due to
differences in such fundamental measures as the number
and nature of errors in a channel, a misunderstanding of
the underlying properties or needs of an overlaid layer.
We concentrate upon the naıve layering present when
assumptions are made about the properties of protocol
layers below or above the one being designed. This is
further exacerbated by layers evolving as new technolo-
gies drive speed, availability, etc. Often such evolution is
not explicitly taken into account by existing layers (such
as networks, transport-systems or applications). In fact,
quite the opposite situation occurs where existing layers
are assumed to operate normally.
Outline
Section II describes our motivations for this work
including new optical networking technologies which
change previous assumptions about the physical layer
and the implications of the limits on the quantity of
power useable in optical networks.
We present a study of the 8B/10B block-coding system
of Gigabit Ethernet [6], the interaction between an (N,K)
block code, an optical physical layer, and data trans-
ported using that block code in Section III. In Section IV
we document our findings on the reasons behind the
interactions observed.
Further to our experiments with Gigabit Ethernet,
in Section V we illustrate how the issues we identify
have ramifications for systems with increasing physical
complexity. Alongside conclusions, Section VI states a
number of the directions that further work may take.
II. MOTIVATIONS
A. Optical Networks
Current work in all areas of networking has led
to increasingly complex architectures: our interest is
focused upon the field of optical networking, but this
is also true in the wireless domain. Our exploration
of the robustness of network systems is motivated by

the increased demands of these new optical systems.
Wavelength Division Multiplexing (WDM), capable for
example of 160 wavelengths each operating at 10 Gbps
per channel, able to operate at over 5,000 km without
regeneration [7], is a core technology in the current com-
munications network. However the timescale of change
for such long haul networks is very long: the same
scale as deployment, involving from months to years of
planning, installation and commissioning. To take advan-
tage of capacity developments at the shorter timescales
relevant to the local area network, as well as system
and storage area networks, packet switching and burst
switching techniques have seen significant investigation
(e.g. [8], [9]). Optical systems such as [10] and [11] have
lead us to recognise that the need for higher data-rates
and designs with larger numbers of optical components
are forcing us towards what traditionally have been
technical limits.
Further to the optical-switching domain, there have
been changes in the construction and needs of fibre-
based computer networks. In deployments containing
longer runs of fibre using large numbers of splitters for
measurement and monitoring and active optical devices,
the overall system loss may be greater than in today’s
point-to-point links and the receivers may have to cope
with much-lower optical powers. Increased fibre lengths
used to deliver Ethernet services, e.g., Ethernet in the
first mile [12], along with a new generation of switched
optical networks, are examples of this trend.
Additionally, we are increasingly impacted by operator
practice. For example, researchers have observed that
up to 60% of faults in an ISP-grade network are due
to optical events [13]: defined as ones where it was
assumed errors results directly from operational faults
of in-service equipment. While the majority of these will
be catastrophic events (e.g., cable breaks), a discussion
with the authors allows us to speculate that a non-trivial
percentage of these events will be due to the issues of
layer-interaction discussed in this paper.
B. The Power Problem
If all other variables are held constant an increase
in data rate will require a proportional increase in
transmitter power. A certain number of photons per bit
must be received to guarantee any given bit error rate
(BER), even if no thermal noise is present. The arrival
of photons at the receiver is a Poisson process. If 20
photons must arrive per bit to ensure a BER of �����for a given receiver, doubling the bit rate means that
the time in which the 20 photons must arrive is halved.
The number of photons sent per unit time must thus be
doubled (doubling the transmission power) to maintain
the BER.
The ramifications of this are that a future system
operating at higher rates will either require twice the
power (a 3dB increase), be able to operate with 3dB
less power for the given information rate (equivalent
to the channel being noisier by that proportion) or a
compromise between these. Fibre nonlinearities impose

limitations on the maximum optical power able to be
used in an optical network. Subsequently, we maintain
that a greater understanding of the low-power behaviour
of coding schemes will provide invaluable insight for
future systems.
For practical reasons including availability of equip-
ment, its wide deployment, a tractability of the problem-
space and and well documented behaviour we concen-
trate upon the 8B/10B codec.
C. 8B/10B Block Coding
The 8B/10B codec, originally described by Widmer &
Franaszek [14], is widely used. This scheme converts
8 bits of data for transmission (ideal for any octet-
orientated system) into a 10 bit line code. Although
this adds a 25% overhead, 8B/10B has many valuable
properties; a transition density of at least 3 per 10 bit
code group and a maximum run length of 5 bits for clock
recovery, along with virtually no DC spectral component.
These characteristics also reduce the possible signal
damage due to jitter, which is particularly critical in
optical systems, and can also reduce multimodal noise
in multimode fibre connections.
This coding scheme is royalty-free, well understood,
and sees current use in a wide range of applications.
In addition to being the standard Physical Coding Sub-
layer (PCS) for Gigabit Ethernet [6], it is used in the
Fibre Channel system [15]. This codec is also used for
the 800Mbps extensions to the IEEE 1394 / Firewire
standard [16], and 8B/10B will be the basis of coding
for the electrical signals of the upcoming PCI Express
standard [17].
The 8B/10B codec defines encodings for data octets
and control codes which are used to delimit the data
sections and maintain the link. Individual codes or
combinations of codes are defined for Start of Packet,
End of Packet, line Configuration, and so on. Also, Idle
codes are transmitted when there is no data to be sent
to keep the transceiver optics and electronics active. The
Physical Coding Sublayer (PCS) of the Gigabit Ethernet
specification [6] defines how these various codes are
used.
Individual ten-bit code-groups are constructed from
the groups generated by 5B/6B and 3B/4B coding on the
first five and last three bits of a data octet respectively.
During this process the bits are re-ordered, such that
the last bits of the octet for transmission are encoded at
the start of the 10-bit group. This is because the last
5 bits of the octet are encoded first, into the first 6
bits of code, and then the first 3 bits of the octet are
encoded to the final 4 transmitted bits. Some examples
are given in Table I; the running disparity is the sign
of the running sum of the code bits, where a one is
counted as 1 and a zero as -1. During an Idle sequence
between packet transmissions, the running disparity is
changed (if necessary) to -1 and then maintained at
that value. Both control and data codes may change
the running disparity or may preserve its existing value;
examples of both types are shown in Table I. The code-
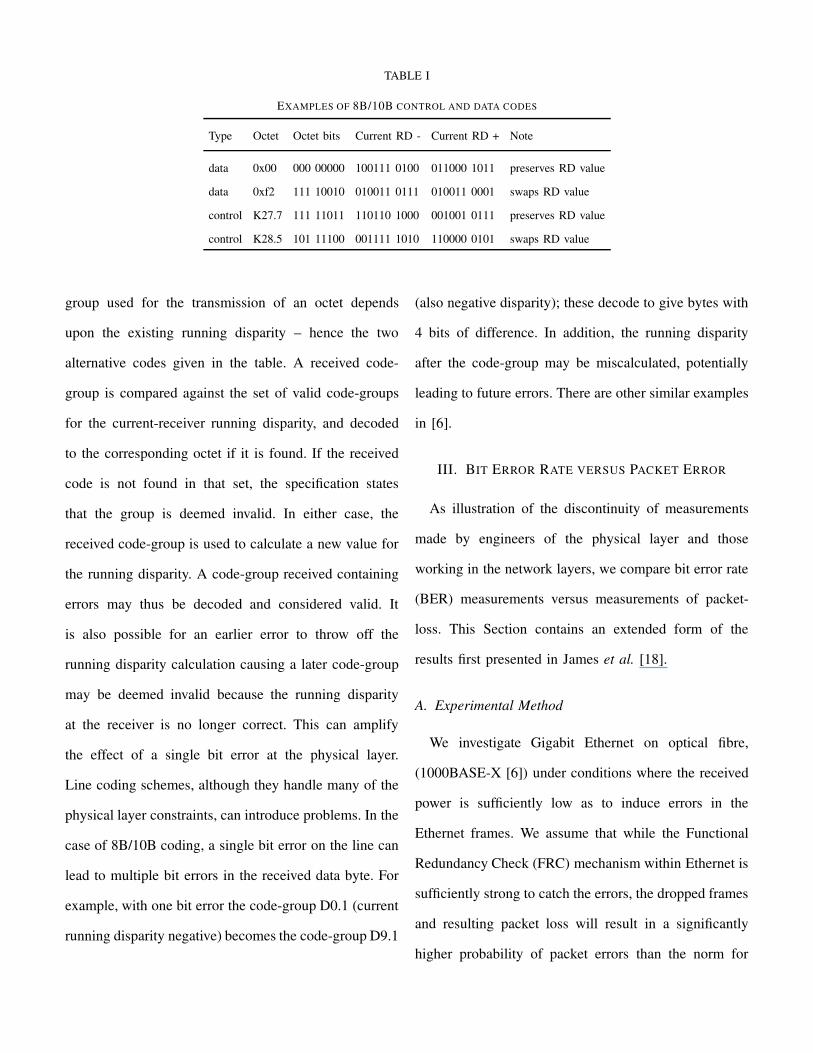
TABLE I
EXAMPLES OF 8B/10B CONTROL AND DATA CODES
Type Octet Octet bits Current RD - Current RD + Note
data 0x00 000 00000 100111 0100 011000 1011 preserves RD value
data 0xf2 111 10010 010011 0111 010011 0001 swaps RD value
control K27.7 111 11011 110110 1000 001001 0111 preserves RD value
control K28.5 101 11100 001111 1010 110000 0101 swaps RD value
group used for the transmission of an octet depends
upon the existing running disparity – hence the two
alternative codes given in the table. A received code-
group is compared against the set of valid code-groups
for the current-receiver running disparity, and decoded
to the corresponding octet if it is found. If the received
code is not found in that set, the specification states
that the group is deemed invalid. In either case, the
received code-group is used to calculate a new value for
the running disparity. A code-group received containing
errors may thus be decoded and considered valid. It
is also possible for an earlier error to throw off the
running disparity calculation causing a later code-group
may be deemed invalid because the running disparity
at the receiver is no longer correct. This can amplify
the effect of a single bit error at the physical layer.
Line coding schemes, although they handle many of the
physical layer constraints, can introduce problems. In the
case of 8B/10B coding, a single bit error on the line can
lead to multiple bit errors in the received data byte. For
example, with one bit error the code-group D0.1 (current
running disparity negative) becomes the code-group D9.1
(also negative disparity); these decode to give bytes with
4 bits of difference. In addition, the running disparity
after the code-group may be miscalculated, potentially
leading to future errors. There are other similar examples
in [6].
III. BIT ERROR RATE VERSUS PACKET ERROR
As illustration of the discontinuity of measurements
made by engineers of the physical layer and those
working in the network layers, we compare bit error rate
(BER) measurements versus measurements of packet-
loss. This Section contains an extended form of the
results first presented in James et al. [18].
A. Experimental Method
We investigate Gigabit Ethernet on optical fibre,
(1000BASE-X [6]) under conditions where the received
power is sufficiently low as to induce errors in the
Ethernet frames. We assume that while the Functional
Redundancy Check (FRC) mechanism within Ethernet is
sufficiently strong to catch the errors, the dropped frames
and resulting packet loss will result in a significantly
higher probability of packet errors than the norm for

Fig. 1. Main test environment
certain hosts, applications and perhaps users.
In our main test environment an optical attenuator is
placed in one direction of a Gigabit Ethernet link. A
traffic generator feeds a Fast Ethernet link to an Ethernet
switch, and a Gigabit Ethernet link is connected between
this switch and a traffic sink and tester (Figure 1). The
variable optical attenuator and an optical isolator are
placed in the fibre in the direction from the switch to
the sink. We had previously noted interference due to
reflection and took the precaution to remove this aspect
from the results.
A packet capture and measurement system is im-
plemented within the traffic sink using an enhanced
driver for the SysKonnect SK-9844 network interface
card (NIC). Among a number of additional features,
the modified driver allows application processes to re-
ceive error-containing frames that would normally be
discarded. As well as purpose-built code for the receiving
system we use a special-purpose traffic generator and
comparator. Pre-constructed test data in tcpdump-format
is transmitted from one or more traffic generators using
an adapted version of tcpfire [19]. Transmitted frames are
compared to their received versions and if they differ,
both original and errored frames are stored for later
analysis.
1) Octet Analysis: Each octet for transmission is
coded by the Physical Coding Sublayer of Gigabit
Ethernet using 8B/10B into a 10 bit code-group or
symbol, and we analyze these for frames which are
received in error at the octet level. By comparing the
two possible transmitted symbols for each octet in the
original frame to the two possible symbols corresponding
to the received octet we can deduce the bit errors which
occurred in the symbol at the physical layer. In order
to infer which symbol was sent and which received,
we assume that the combination giving the minimum
number of bit errors on the line is most likely to have
occurred. This allows us to determine the line errors
which most probably occurred.
Various types of symbol damage may be observed.
One of these is the single-bit error caused by the low
signal to noise ratio at the receiver. A second form of
error results from a loss of bit clock causing smeared
bits: where a subsequent bit is read as having the value
of the previous bit. A final example results from the
loss of symbol clock synchronization. This can lead
to the symbol boundaries being misplaced, so that a
sequence of several symbols, and thus several octets, will
be incorrectly recovered.
2) Real Traffic: Some results presented here are
conducted with real network traffic referred to as the
day-trace. This network traffic was captured from the
interconnect between a large research institution and
the Internet over the course of two working days. We
consider it to contain a representative sample of network
traffic for an academic/research organisation of approx-
imately 150 users.
Other traffic tested included pseudo-random data,
consisting of a sequence of frames of the same number
and size as the day-trace data, although each is filled
with a stream of octets whose values were drawn from a
pseudo-random number generator. Structured test data
consists of a single frame containing repeated octets:
0x00–0xff, to make a frame 1500 octets long. The low
error testframe consists of 1500 octets of 0xCC data
(selected for a low symbol error rate); the high error
testframe is 1500 octets of 0x34 data (which displays a
high symbol error rate).
3) Bit Error Rate Measurements: Optical systems
experiments commonly use a Bit Error Rate Test kit
(BERT) to assess the behaviour of the system [20].
This comprises both a data source and a receiving
unit and compares the incoming signal with the known
transmitted one. Individual bit errors are counted both
during short sampling periods and over a fixed period
(defined in time, bits, or errors). The output data can be
used to modulate a laser and a photodiode can be placed
before the BERT receiver to set up an optical link; optical
system components can then be placed between the two
parts of the BERT for testing. Usually, a pseudo-random
bit sequence is used but any defined bit sequence can be
0
0.1
0.2
0.3
0.4
0.5
0.6
0.7
0.8
0.9
1
0 256 512 768 1024 1280 1536
Offset of octet within frame
Structured test data Pseudo-random data
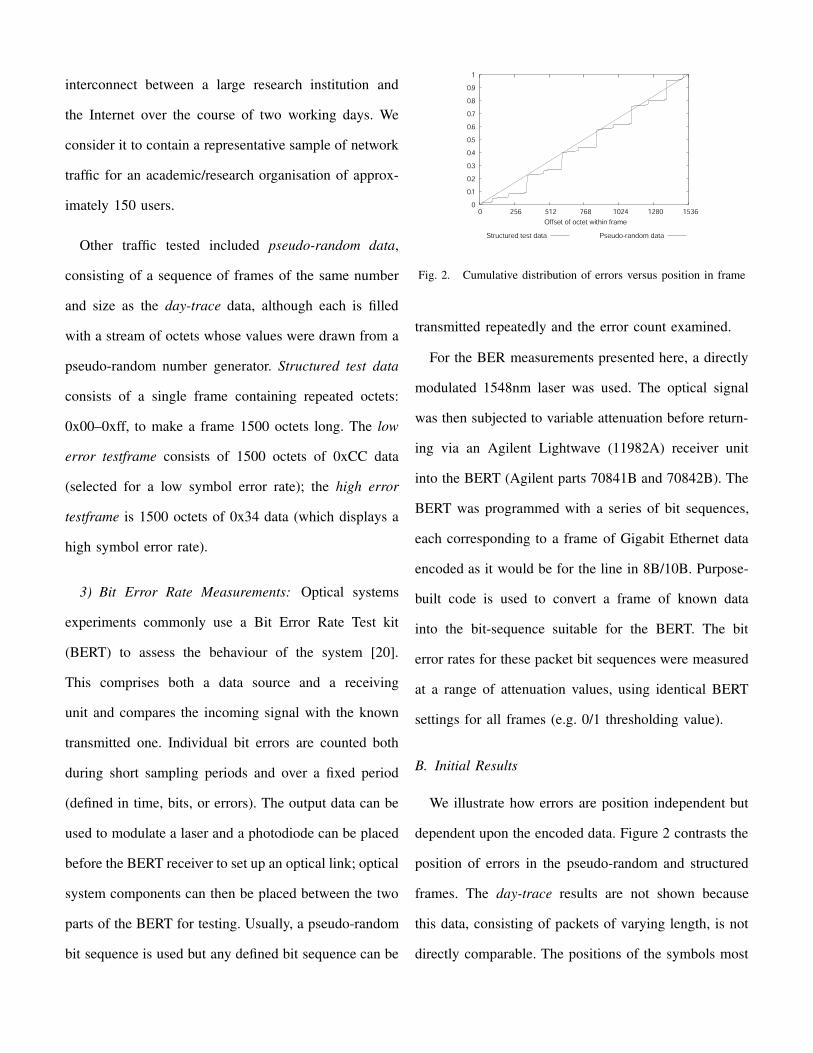
Fig. 2. Cumulative distribution of errors versus position in frame
transmitted repeatedly and the error count examined.
For the BER measurements presented here, a directly
modulated 1548nm laser was used. The optical signal
was then subjected to variable attenuation before return-
ing via an Agilent Lightwave (11982A) receiver unit
into the BERT (Agilent parts 70841B and 70842B). The
BERT was programmed with a series of bit sequences,
each corresponding to a frame of Gigabit Ethernet data
encoded as it would be for the line in 8B/10B. Purpose-
built code is used to convert a frame of known data
into the bit-sequence suitable for the BERT. The bit
error rates for these packet bit sequences were measured
at a range of attenuation values, using identical BERT
settings for all frames (e.g. 0/1 thresholding value).
B. Initial Results
We illustrate how errors are position independent but
dependent upon the encoded data. Figure 2 contrasts the
position of errors in the pseudo-random and structured
frames. The day-trace results are not shown because
this data, consisting of packets of varying length, is not
directly comparable. The positions of the symbols most
0.4
0.5
0.6
0.7
0.8
0.9
1
5 10 15 20 25 30 35 40 45 50Symbols in error per Frame
Structured test dataHigh error testframe
Low error testframe
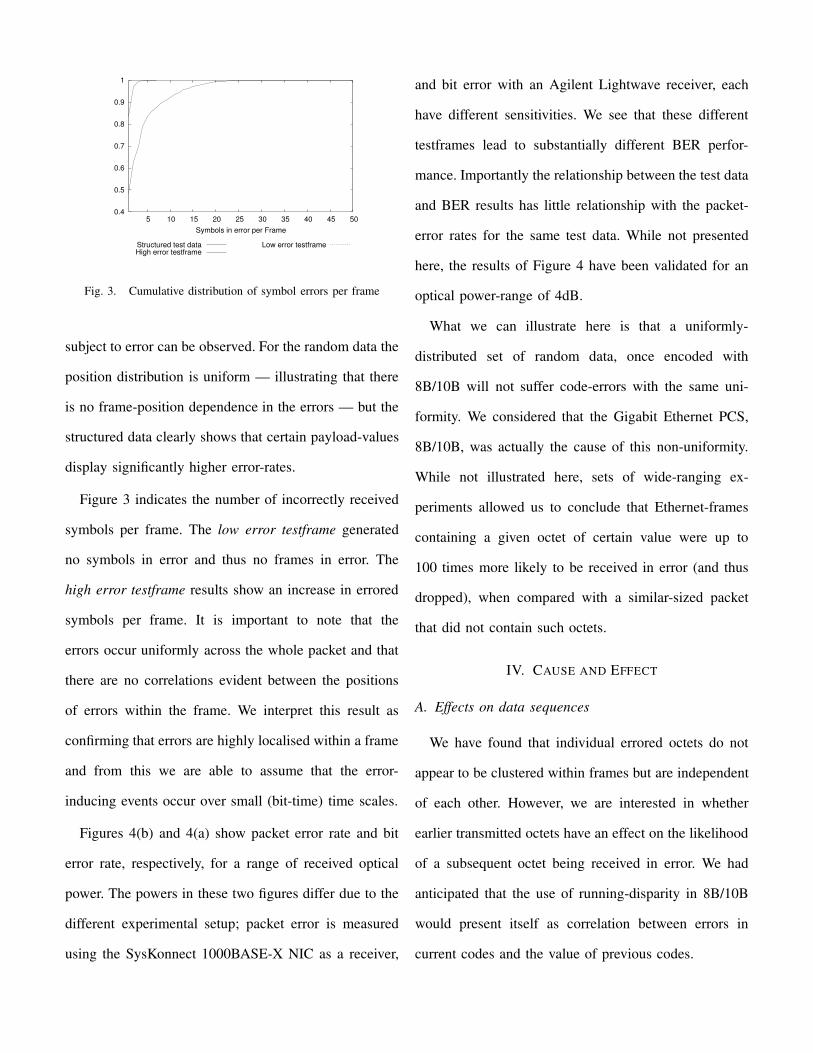
Fig. 3. Cumulative distribution of symbol errors per frame
subject to error can be observed. For the random data the
position distribution is uniform — illustrating that there
is no frame-position dependence in the errors — but the
structured data clearly shows that certain payload-values
display significantly higher error-rates.
Figure 3 indicates the number of incorrectly received
symbols per frame. The low error testframe generated
no symbols in error and thus no frames in error. The
high error testframe results show an increase in errored
symbols per frame. It is important to note that the
errors occur uniformly across the whole packet and that
there are no correlations evident between the positions
of errors within the frame. We interpret this result as
confirming that errors are highly localised within a frame
and from this we are able to assume that the error-
inducing events occur over small (bit-time) time scales.
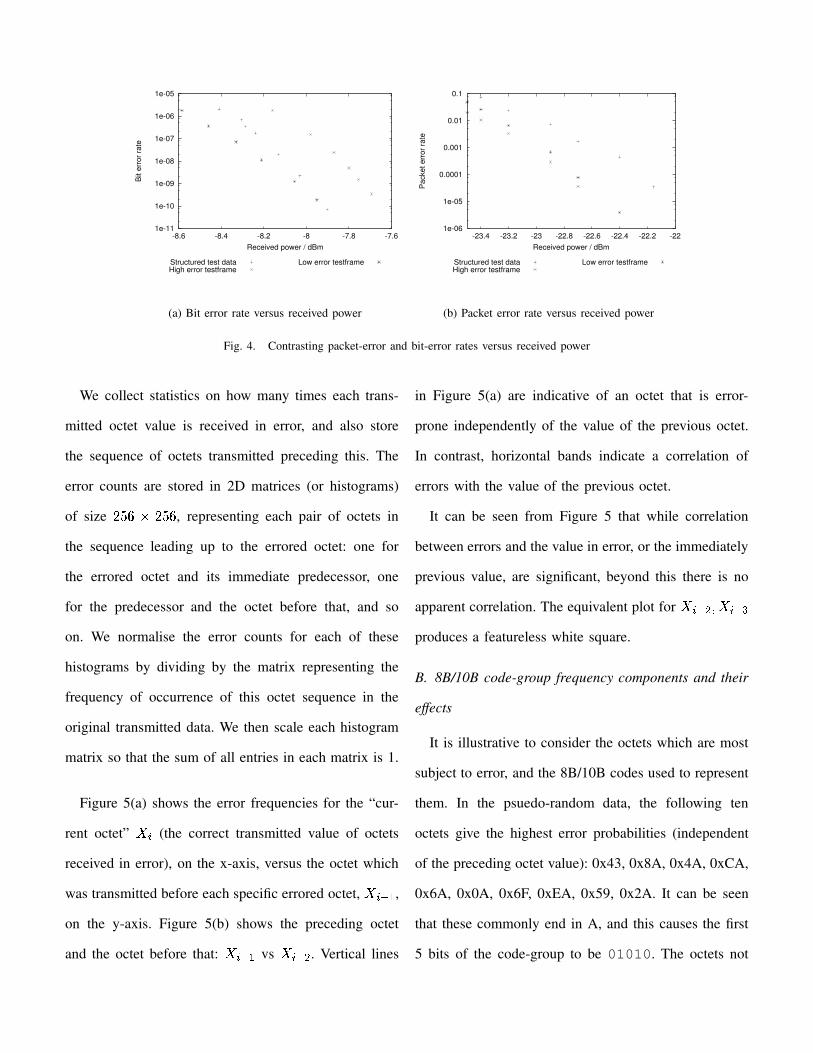
Figures 4(b) and 4(a) show packet error rate and bit
error rate, respectively, for a range of received optical
power. The powers in these two figures differ due to the
different experimental setup; packet error is measured
using the SysKonnect 1000BASE-X NIC as a receiver,
and bit error with an Agilent Lightwave receiver, each
have different sensitivities. We see that these different
testframes lead to substantially different BER perfor-
mance. Importantly the relationship between the test data
and BER results has little relationship with the packet-
error rates for the same test data. While not presented
here, the results of Figure 4 have been validated for an
optical power-range of 4dB.
What we can illustrate here is that a uniformly-
distributed set of random data, once encoded with
8B/10B will not suffer code-errors with the same uni-
formity. We considered that the Gigabit Ethernet PCS,
8B/10B, was actually the cause of this non-uniformity.
While not illustrated here, sets of wide-ranging ex-
periments allowed us to conclude that Ethernet-frames
containing a given octet of certain value were up to
100 times more likely to be received in error (and thus
dropped), when compared with a similar-sized packet
that did not contain such octets.
IV. CAUSE AND EFFECT
A. Effects on data sequences
We have found that individual errored octets do not
appear to be clustered within frames but are independent
of each other. However, we are interested in whether
earlier transmitted octets have an effect on the likelihood
of a subsequent octet being received in error. We had
anticipated that the use of running-disparity in 8B/10B
would present itself as correlation between errors in
current codes and the value of previous codes.
1e-11
1e-10
1e-09
1e-08
1e-07
1e-06
1e-05
-8.6 -8.4 -8.2 -8 -7.8 -7.6
Bit
erro
r rat
e
Received power / dBm
Structured test dataHigh error testframe
Low error testframe
(a) Bit error rate versus received power
1e-06
1e-05
0.0001
0.001
0.01
0.1
-23.4 -23.2 -23 -22.8 -22.6 -22.4 -22.2 -22
Pac
ket e
rror
rate
Received power / dBm
Structured test dataHigh error testframe
Low error testframe
(b) Packet error rate versus received power
Fig. 4. Contrasting packet-error and bit-error rates versus received power
We collect statistics on how many times each trans-
mitted octet value is received in error, and also store
the sequence of octets transmitted preceding this. The
error counts are stored in 2D matrices (or histograms)
of size �� ������� �� , representing each pair of octets in
the sequence leading up to the errored octet: one for
the errored octet and its immediate predecessor, one
for the predecessor and the octet before that, and so
on. We normalise the error counts for each of these
histograms by dividing by the matrix representing the
frequency of occurrence of this octet sequence in the
original transmitted data. We then scale each histogram
matrix so that the sum of all entries in each matrix is 1.
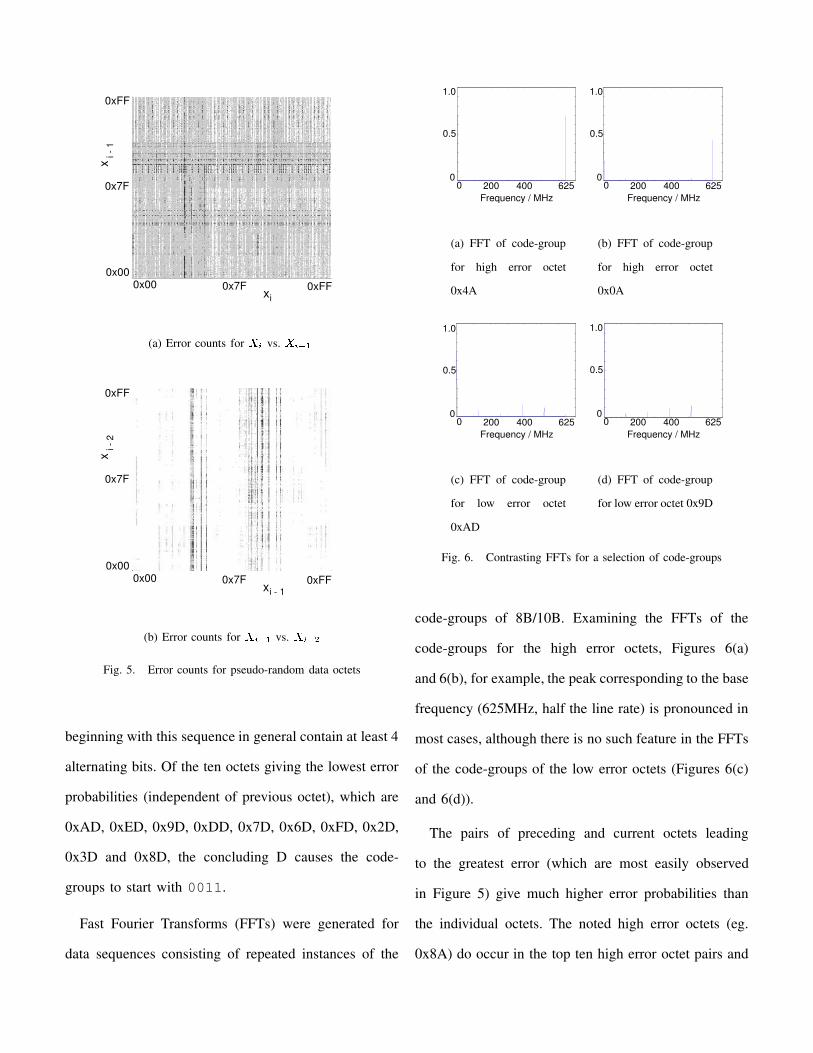
Figure 5(a) shows the error frequencies for the “cur-
rent octet” ��� (the correct transmitted value of octets
received in error), on the x-axis, versus the octet which
was transmitted before each specific errored octet, ��� ��� ,on the y-axis. Figure 5(b) shows the preceding octet
and the octet before that: ��� ��� vs ��� ��� . Vertical lines
in Figure 5(a) are indicative of an octet that is error-
prone independently of the value of the previous octet.
In contrast, horizontal bands indicate a correlation of
errors with the value of the previous octet.
It can be seen from Figure 5 that while correlation
between errors and the value in error, or the immediately
previous value, are significant, beyond this there is no
apparent correlation. The equivalent plot for ��� ����� ��� ���produces a featureless white square.
B. 8B/10B code-group frequency components and their
effects
It is illustrative to consider the octets which are most
subject to error, and the 8B/10B codes used to represent
them. In the psuedo-random data, the following ten
octets give the highest error probabilities (independent
of the preceding octet value): 0x43, 0x8A, 0x4A, 0xCA,
0x6A, 0x0A, 0x6F, 0xEA, 0x59, 0x2A. It can be seen
that these commonly end in A, and this causes the first
5 bits of the code-group to be 01010. The octets not
0xFF
0xFF
x
x
0x7F
0x7F
i - 1
0x000x00
i
(a) Error counts for �! vs. �" $#&%
0xFF
0xFF
x
x
0x7F
0x7F
i - 2
0x000x00
i - 1
(b) Error counts for �! $#&% vs. �" $#�'Fig. 5. Error counts for pseudo-random data octets
beginning with this sequence in general contain at least 4
alternating bits. Of the ten octets giving the lowest error
probabilities (independent of previous octet), which are
0xAD, 0xED, 0x9D, 0xDD, 0x7D, 0x6D, 0xFD, 0x2D,
0x3D and 0x8D, the concluding D causes the code-
groups to start with 0011.
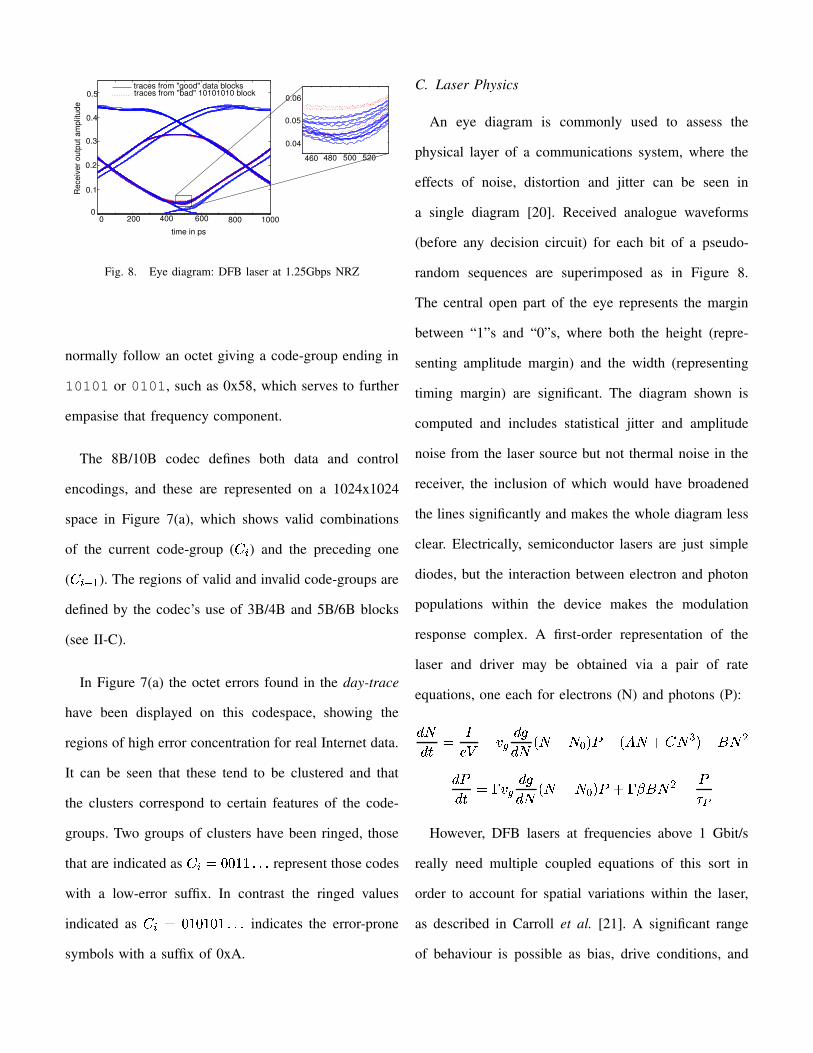
Fast Fourier Transforms (FFTs) were generated for
data sequences consisting of repeated instances of the
0 200 400 6250
0.5
1.0
Frequency / MHz
(a) FFT of code-group
for high error octet
0x4A
0 200 400 6250
0.5
1.0
Frequency / MHz
(b) FFT of code-group
for high error octet
0x0A
0 200 400 6250
0.5
1.0
Frequency / MHz
(c) FFT of code-group
for low error octet
0xAD
0 200 400 6250
0.5
1.0
Frequency / MHz
(d) FFT of code-group
for low error octet 0x9D
Fig. 6. Contrasting FFTs for a selection of code-groups
code-groups of 8B/10B. Examining the FFTs of the
code-groups for the high error octets, Figures 6(a)
and 6(b), for example, the peak corresponding to the base
frequency (625MHz, half the line rate) is pronounced in
most cases, although there is no such feature in the FFTs
of the code-groups of the low error octets (Figures 6(c)
and 6(d)).
The pairs of preceding and current octets leading
to the greatest error (which are most easily observed
in Figure 5) give much higher error probabilities than
the individual octets. The noted high error octets (eg.
0x8A) do occur in the top ten high error octet pairs and
0 200 400 600 800 10000
time in ps
Rec
eive
r out
put a
mpl
itude
traces from "good" data blocks
traces from "bad" 10101010 block
0.1
0.2
0.3
0.4
0.5
460 480 500 520
0.04
0.05
0.06
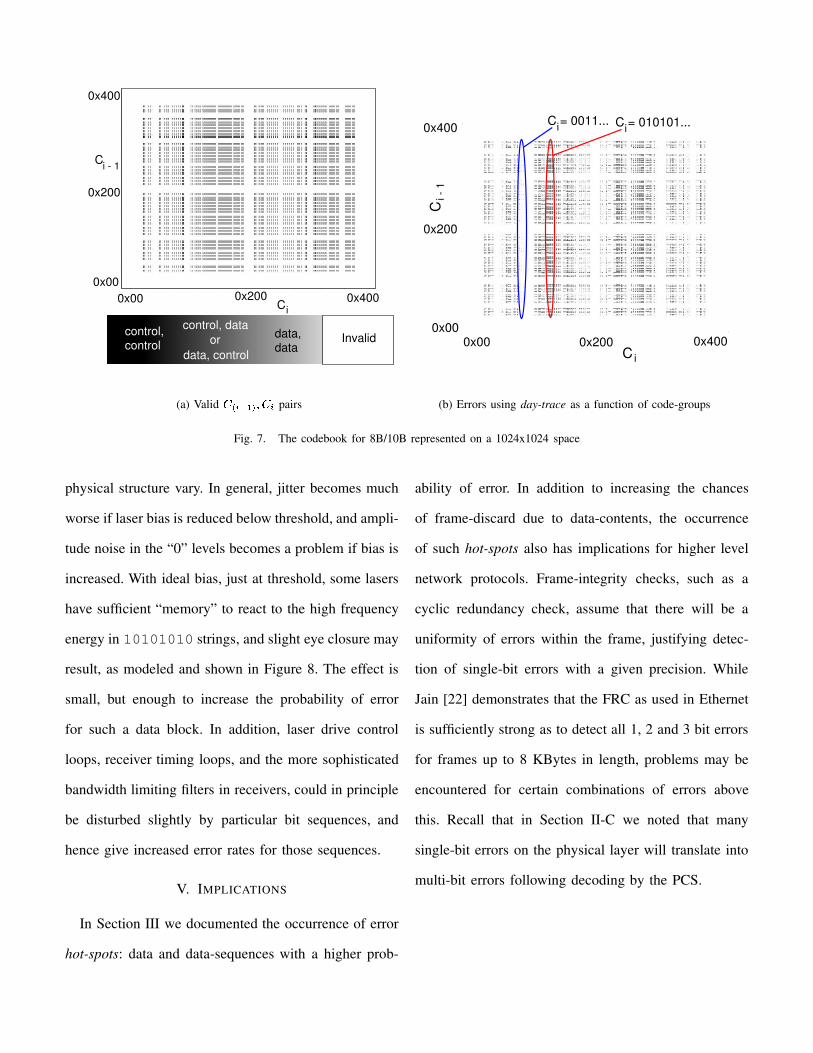
Fig. 8. Eye diagram: DFB laser at 1.25Gbps NRZ
normally follow an octet giving a code-group ending in
10101 or 0101, such as 0x58, which serves to further
empasise that frequency component.
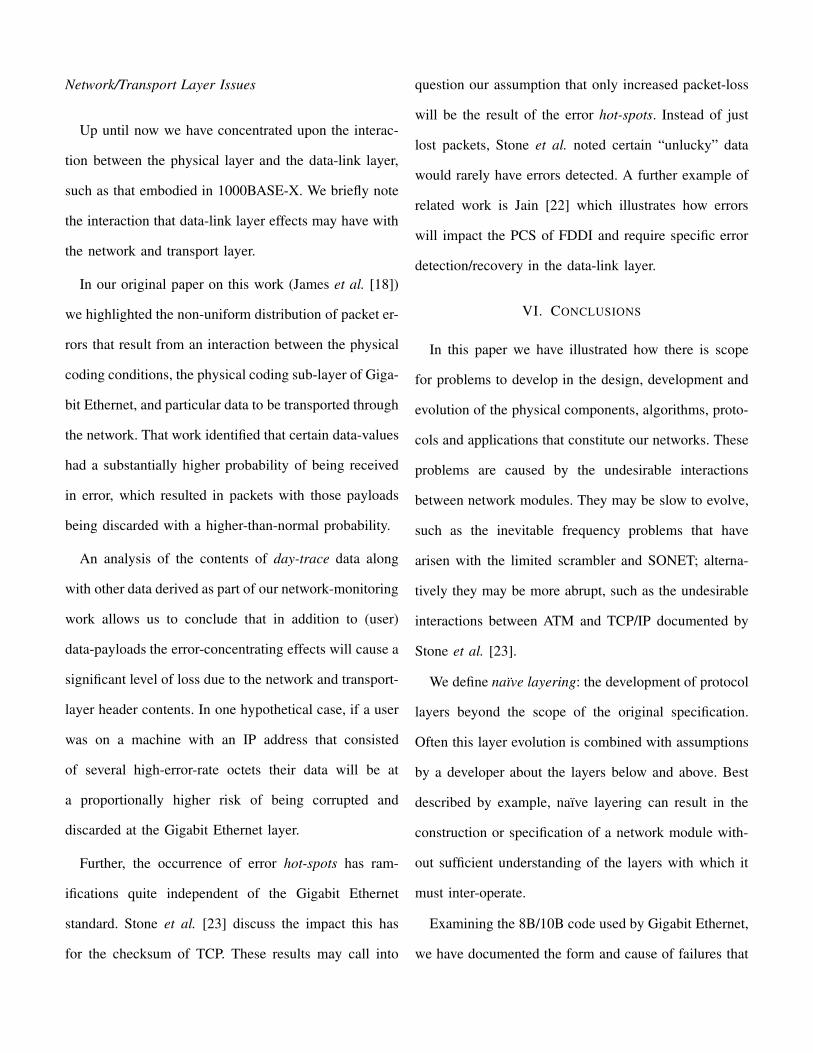
The 8B/10B codec defines both data and control
encodings, and these are represented on a 1024x1024
space in Figure 7(a), which shows valid combinations
of the current code-group ( (!� ) and the preceding one
( ()� ��� ). The regions of valid and invalid code-groups are
defined by the codec’s use of 3B/4B and 5B/6B blocks
(see II-C).
In Figure 7(a) the octet errors found in the day-trace
have been displayed on this codespace, showing the
regions of high error concentration for real Internet data.
It can be seen that these tend to be clustered and that
the clusters correspond to certain features of the code-
groups. Two groups of clusters have been ringed, those
that are indicated as (!�+*,������.-�-�- represent those codes
with a low-error suffix. In contrast the ringed values
indicated as ( � */��������.-�-�- indicates the error-prone
symbols with a suffix of 0xA.
C. Laser Physics
An eye diagram is commonly used to assess the
physical layer of a communications system, where the
effects of noise, distortion and jitter can be seen in
a single diagram [20]. Received analogue waveforms
(before any decision circuit) for each bit of a pseudo-
random sequences are superimposed as in Figure 8.
The central open part of the eye represents the margin
between “1”s and “0”s, where both the height (repre-
senting amplitude margin) and the width (representing
timing margin) are significant. The diagram shown is
computed and includes statistical jitter and amplitude
noise from the laser source but not thermal noise in the
receiver, the inclusion of which would have broadened
the lines significantly and makes the whole diagram less
clear. Electrically, semiconductor lasers are just simple
diodes, but the interaction between electron and photon
populations within the device makes the modulation
response complex. A first-order representation of the
laser and driver may be obtained via a pair of rate
equations, one each for electrons (N) and photons (P):
021043 *
5687:9<;8=
0�>0&1@? 1 9 1BADCFE 9 ?HG 1JI ( 1 � C 9<K 1 �
0&E023 *,L ;8=
0�>0&1 ? 1 9 1BADCFEMI L+N K 1 � 9
EO�P
However, DFB lasers at frequencies above 1 Gbit/s
really need multiple coupled equations of this sort in
order to account for spatial variations within the laser,
as described in Carroll et al. [21]. A significant range
of behaviour is possible as bias, drive conditions, and
0x200
0x200
0x400
i - 1C
iC 0x4000x000x00
Invaliddata,data
control, datacontrol,control
data, control or
(a) Valid QSR $#&%UTWV Q pairs
0x400
C i0x200 0x400
0x200
Ci -
1
C = 0011... C = 010101...i i
0x000x00
(b) Errors using day-trace as a function of code-groups
Fig. 7. The codebook for 8B/10B represented on a 1024x1024 space
physical structure vary. In general, jitter becomes much
worse if laser bias is reduced below threshold, and ampli-
tude noise in the “0” levels becomes a problem if bias is
increased. With ideal bias, just at threshold, some lasers
have sufficient “memory” to react to the high frequency
energy in 10101010 strings, and slight eye closure may
result, as modeled and shown in Figure 8. The effect is
small, but enough to increase the probability of error
for such a data block. In addition, laser drive control
loops, receiver timing loops, and the more sophisticated
bandwidth limiting filters in receivers, could in principle
be disturbed slightly by particular bit sequences, and
hence give increased error rates for those sequences.
V. IMPLICATIONS
In Section III we documented the occurrence of error
hot-spots: data and data-sequences with a higher prob-
ability of error. In addition to increasing the chances
of frame-discard due to data-contents, the occurrence
of such hot-spots also has implications for higher level
network protocols. Frame-integrity checks, such as a
cyclic redundancy check, assume that there will be a
uniformity of errors within the frame, justifying detec-
tion of single-bit errors with a given precision. While
Jain [22] demonstrates that the FRC as used in Ethernet
is sufficiently strong as to detect all 1, 2 and 3 bit errors
for frames up to 8 KBytes in length, problems may be
encountered for certain combinations of errors above
this. Recall that in Section II-C we noted that many
single-bit errors on the physical layer will translate into
multi-bit errors following decoding by the PCS.
Network/Transport Layer Issues
Up until now we have concentrated upon the interac-
tion between the physical layer and the data-link layer,
such as that embodied in 1000BASE-X. We briefly note
the interaction that data-link layer effects may have with
the network and transport layer.
In our original paper on this work (James et al. [18])
we highlighted the non-uniform distribution of packet er-
rors that result from an interaction between the physical
coding conditions, the physical coding sub-layer of Giga-
bit Ethernet, and particular data to be transported through
the network. That work identified that certain data-values
had a substantially higher probability of being received
in error, which resulted in packets with those payloads
being discarded with a higher-than-normal probability.
An analysis of the contents of day-trace data along
with other data derived as part of our network-monitoring
work allows us to conclude that in addition to (user)
data-payloads the error-concentrating effects will cause a
significant level of loss due to the network and transport-
layer header contents. In one hypothetical case, if a user
was on a machine with an IP address that consisted
of several high-error-rate octets their data will be at
a proportionally higher risk of being corrupted and
discarded at the Gigabit Ethernet layer.
Further, the occurrence of error hot-spots has ram-
ifications quite independent of the Gigabit Ethernet
standard. Stone et al. [23] discuss the impact this has
for the checksum of TCP. These results may call into
question our assumption that only increased packet-loss
will be the result of the error hot-spots. Instead of just
lost packets, Stone et al. noted certain “unlucky” data
would rarely have errors detected. A further example of
related work is Jain [22] which illustrates how errors
will impact the PCS of FDDI and require specific error
detection/recovery in the data-link layer.
VI. CONCLUSIONS
In this paper we have illustrated how there is scope
for problems to develop in the design, development and
evolution of the physical components, algorithms, proto-
cols and applications that constitute our networks. These
problems are caused by the undesirable interactions
between network modules. They may be slow to evolve,
such as the inevitable frequency problems that have
arisen with the limited scrambler and SONET; alterna-
tively they may be more abrupt, such as the undesirable
interactions between ATM and TCP/IP documented by
Stone et al. [23].
We define naıve layering: the development of protocol
layers beyond the scope of the original specification.
Often this layer evolution is combined with assumptions
by a developer about the layers below and above. Best
described by example, naıve layering can result in the
construction or specification of a network module with-
out sufficient understanding of the layers with which it
must inter-operate.
Examining the 8B/10B code used by Gigabit Ethernet,
we have documented the form and cause of failures that

occur in the low-power regime, inducing, at best, poor
performance and, at worst, undetected errors that may
focus upon specific networks, applications and users.
The errors observed in Gigabit Ethernet in a low-power
regime are not uniform as may be assumed. Some
packets will suffer greater loss rates than the norm. This
content-specific effect is particularly insidious because it
occurs without a total failure of the network.
We applied a scrambler as a form of noise-whitener
and were able to successfully illustrate that its impact
removed the error hot-spotting in the data-space.
We have seen how future optical networks will consist
of an increasingly large number of diverse elements
and will have very limited optical power budgets. This
will cause a fundamental change in the physical optical
layer, which will also impact the construction of these
networks. Alongside this we would maintain that these
changes will lead to occurrences of naıve layering be-
coming more prevalent.
Future Work
We anticipate further study of the effects of scramblers
on Gigabit Ethernet, and by extension, on other N,K
block coded systems. In particular we would like to
fully understand the interactions between block coding
schemes and scrambling. We are also interested in the
effects of jitter in the interactions between the layers of
an optical network, as the jitter requirements for various
network specifications (e.g. Gigabit Ethernet, SONET)
are not just different in quantity, but measured in quite
different ways.
Acknowledgements
Many thanks to Ian White, Richard Penty, Derek
McAuley, Bradley Booth, Jon Crowcroft, David G.
Cunningham, Eric Jacobsen, Peter Kirkpatrick, Barry
O’Mahony, Ralphe Neill, Ian Pratt, Adrian P. Stephens,
Kevin Williams, and Adrian Wonfor. Additionally, An-
drew Moore acknowledges the Intel Corporation’s gener-
ous support of his research fellowship and Laura James
would like to thank Marconi for its support of her PhD
research.
REFERENCES
[1] J. Stone and C. Partridge, “When the CRC and TCP checksum
disagree,” in Proceedings of ACM SIGCOMM 2000. ACM
Press, Aug. 2000.
[2] W. Simpson, “PPP over SONET/SDH,” IETF, RFC 1619, May
1994.
[3] A. Malis and W. Simpson, “PPP over SONET/SDH,” IETF,
RFC 2615, June 1999.
[4] ANSI, “T1.105-1988, Synchronous Optical Network (SONET)
— Digital Hierarchy: Optical Interface Rates and Formats
Specification,” 1988.
[5] D. L. Tennenhouse, “Layered multiplexing considered harm-
ful,” in Protocols for High-Speed Networks. North Holland,
Amsterdam, May 1989.
[6] IEEE, “IEEE 802.3z — Gigabit Ethernet,” 1998, standard.
[7] A. R. Pratt et al., “5745 km DWDM transcontinental field trial
using 10Gbit/s dispersion managed solitons and dynamic gain
equalization,” in Proceedings of OFC-2003, 2003, post-deadline
paper PD26.
[8] J. S. Turner, “Terabit burst switching,” J. High Speed Netw.,
vol. 8, no. 1, pp. 3–16, 1999.
[9] P. Gambini et al., “Transparent optical packet switching: net-
work architecture and demonstrators in the KEOPS project,”
IEEE Journal on Selected Areas in Communications, vol. 16,
no. 7, pp. 1245–1259, Sept. 1998.
[10] D. McAuley, “Optical Local Area Network,” in Computer
Systems: Theory, Technology and Applications, A. Herbert and
K. Sparck-Jones, Eds. Springer-Verlag, Feb 2003.
[11] L. James, G. Roberts, M. Glick, D. McAuley, K. Williams,
R. Penty, and I. White, “Wavelength Striped Semi-synchronous
Optical Local Area Networks,” in London Communications
Symposium (LCS 2003), Sept. 2003.
[12] IEEE, “IEEE 802.3ah — Ethernet in the First Mile,” 2004,
standard.
[13] A. Markopoulou, G. Iannaccone, S. Bhattacharyya, C.-N.
Chuah, and C. Diot, “Characterization of failures in an IP
backbone,” in Proceedings of IEEE INFOCOMM 2004, Hong
Kong, Mar. 2004, Sprint ATL Research Report.
[14] A. X. Widmer and P. A. Franaszek, “A DC-Balanced,
Partitioned-Block, 8B/10B Transmission Code,” IBM Journal of
Research and Development, vol. 27, no. 5, pp. 440–451, Sept.
1983.
[15] The Fibre Channel Association, Fibre Channel Storage Area
Networks. Eagle Rock, VA: LLH Technology Publishing, 2001.
[16] IEEE, “IEEE 1394b — High-Performance Serial Bus,” 2002,
standard.
[17] E. Solari and B. Congdon, The Complete PCIExpress Reference.
Hillsboro, OR: Intel Press, 2003.
[18] L. B. James, A. W. Moore, and M. Glick, “Structured Errors in
Optical Gigabit Ethernet,” in Passive and Active Measurement
Workshop (PAM 2004), Apr. 2004.
[19] “tcpfire,” 2003, http://www.nprobe.org/tools/.
[20] R. Ramaswami and K. N. Sivarajan, Optical Networks. Morgan
Kaufmann, 2002, pp. 258–263.
[21] J. E. Carroll, J. Whiteaway, and R. Plumb, Distributed Feedback
Semiconductor Lasers, ser. IEE Circuits, Devices & Systems
Series. Co-published by the IEE and SPIE Press, 1998, no. 10.
[22] R. Jain, “Error Characteristics of Fiber Distributed Data Inter-
face (FDDI),” IEEE Transactions on Communications, vol. 38,
no. 8, pp. 1244–1252, 1990.
[23] J. Stone, M. Greenwald, C. Partridge, and J. Hughes, “Perfor-
mance of Checksums and CRCs over Real Data,” in Proceed-
ings of ACM SIGCOMM 2000, Stockholm, Sweden, Aug. 2000.


