Expert Group Meeting on Transport and Trade facilitation
Why Trade Logistics Matter in the Arab Region?
Mohamed A. Chemingui, ESCWA
Movenpick hotel, Dubai, 10-11 April 2013
2
Regional Characteristics
Economically diverse region …..In terms of:- Size of economy;- Size of population;- Economic structures and level of economic
diversification;- Geographical location and area;- Type of governance and institutions- Human capital and labor productivity- Level of integration to the world economy
Growth pattern has special characteristics……- Heavy reliance on oil exports; - Weak macroeconomic policies coordination- Weak regional trade and financial integration;- High population growth rates;- High unemployment rates, particularly youth and
women;- High weight of public sectors and inefficient
markets- High poverty rates outside GCC countries; - Very heterogeneous fiscal space levels;- Underdeveloped institutions;

Country Name Population GDP GDP per capita
% of Total population to overall ESCWA population
% of GDP constant to Total ESCWA GDP
GCC (Oil-Rich labor importing)
Bahrain 1.1 19.3 18.3 0.32 1.1Kuwait 2.5 105.9 41.6 0.76 6.0Libya 6.2 62.4 10.1 1.86 3.5Oman 2.6 46.9 17.8 0.79 2.7Qatar 1.4 97.6 69.9 0.42 5.5Saudi Arabia 26.2 376.7 14.4 7.86 21.4UAE 6.2 297.6 48.0 1.86 16.9Total 46.2 1006.4 220 13.87 57.1
Non-Oil middle income Labor exporting
Egypt 78.3 189.0 2.4 23.51 10.7Morocco 34.8 90.9 2.6 10.45 5.2Jordan 5.8 23.8 4.1 1.74 1.4Lebanon 4.2 34.9 8.4 1.25 2.0Syrian 19.6 53.9 2.7 5.90 3.1Tunisia 10.3 43.5 4.2 3.09 2.5
Total 153.0 436.1 24.5 45.93 24.7Others (Diversified Economies)
Algeria 34.8 138.1 4.0 10.45 7.8Djibouti 1.9 1.0 0.5 0.57 0.1Mauritania 3.0 3.0 1.0 0.90 0.2Iraq 30.2 81.1 2.7 9.06 4.6Sudan 41.4 67.0 1.6 12.43 3.8Yemen 22.6 31.0 1.4 6.79 1.8
Clear discrepancy in the region;
In 2009, Oil rich labor importing countries
recorded less that 14% of total Arab Pop; and more than 57% of Arab GDP In 2009, Non- oil
middle income labor exporting countries population
registered more than 3 times that of oil rich countless with only 25% share to total Arab GDP.
The 3rd group contributed 18% to total GDP and more than 40% of total Arab population.
Arab Economic
Performance –
selected indicators
(2009)
No data available for Palestine, Comoros and Somalia. Source WB

Institutions & Agreements in
support of regional economic
integration
Starting from Arab League in 1945… 1950 Treaty for Joint Defense and Economic
Cooperation; 1953 Agreement on Trade Facilitation and Regulating
Transit Trade; 1957 Arab Economic Unity Agreement; 1964 Arab Common Market Agreement; 1981 Agreement on Facilitation and Development of
Trade; 1981 Gulf Cooperation Council; 1989 Arab Maghreb Union; 1997 Greater Arab Free Trade Area; 2003 Initiation of the Framework Agreement for
Liberalizing Trade in Services; 2005 Full entry into force of Greater Arab Free Trade
Area.
Future actions• Main declarations of the third Arab Economic Summit 2013• 1. Removal of remaining barriers (tariffs and non tariffs) on intra-
Arab trade by end of 2013• 2. Creation of Arab Custom Union by 2015• 3. Accelerate the implementation of the “Aid for Trade” activities for
the 22 Arab countries under the coordination of the Islamic Development Bank
• Challenges:• Is there a room for an Arab Common Position for the Next WTO
ministerial conference in December 2013 and potential agreement?• What about the FTAs signed by some Arab countries with the EU
and USA if an Arab Custom Union will be implemented?

Export Performance:
Compared to other regions…
Arab region is less integrated, even compared to African countries.
Intraregional exports as % of total exports (2010)
Source: ITC
Arab league
GCC Maghreb UE 27 NAFTA Asean Africa0.0
10.0
20.0
30.0
40.0
50.0
60.0
70.0
5.22.6 2.5
64.5
48.7
24.8
12.4
7

What determines divergent trade performance?
Export concentration index by regionindex (1995,2011)
World
DCs
Developed economies
DCs Africa
DCs America
DCs Asia
DCs Western Asia
0.0
0.1
0.2
0.3
0.4
0.5
0.6
1995 2011 -4.0
-2.0
0.0
2.0
4.0
6.0
8.0
10.0
12.0
14.0
Tur
key
Leba
non
Jord
an
O.
Pal
estin
ian
T.
Syr
ian
Ara
b R
.
Bah
rain
UA
E
Qat
ar
Om
an
Yem
en
Kuw
ait
Sau
di A
rabi
a
Iraq
-0.40
-0.20
0.00
0.20
0.40
0.60
0.80
1.00
1.20
1.40
2000-2011 Volume of exports Growth
2011 concentration index
Export concentration index by county and export performance (2000-2011)
• Arab countries has high export concentration• Does high export concentration hindering export growth?
– Empirical Studies .. Yes – Western Asia .. Yes (oil sector), but there are windows for diversification
and improvements !

Understanding why intra-Arab trade is low in Arab countries?
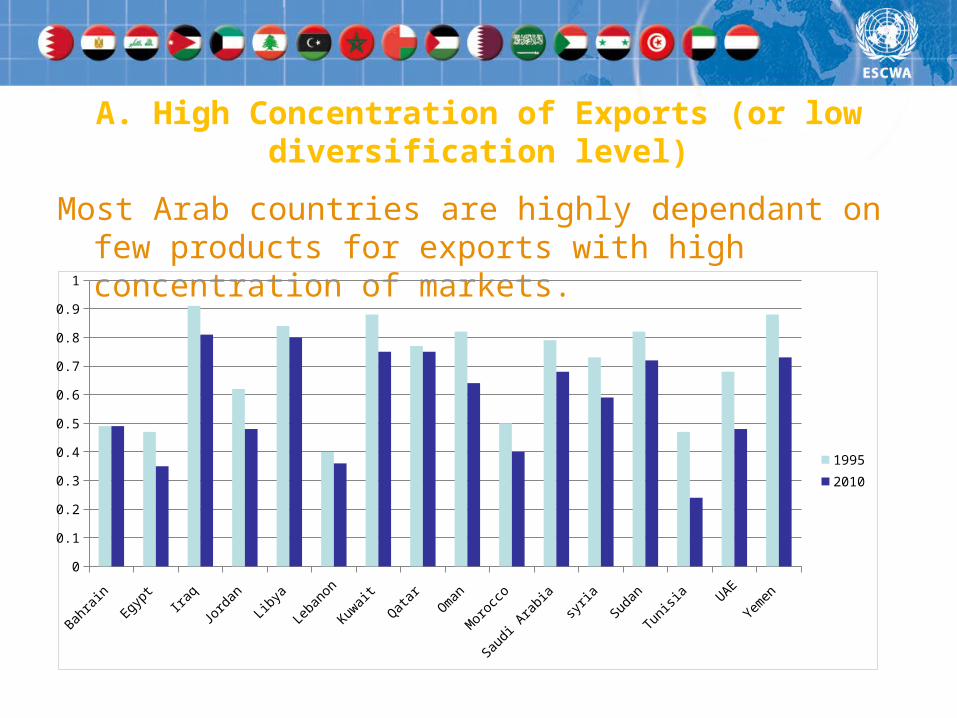
A. High Concentration of Exports (or low diversification level)
Most Arab countries are highly dependant on few products for exports with high concentration of markets.
Bahra
in
Egypt
Ira
q
Jord
an
Libya
Leba
non
Kuwait
Qatar
Oman
Mor
occo
Saudi
Arabia
syria
Sudan
Tunisi
a UAE
Yemen
0
0.1
0.2
0.3
0.4
0.5
0.6
0.7
0.8
0.9
1
1995
2010
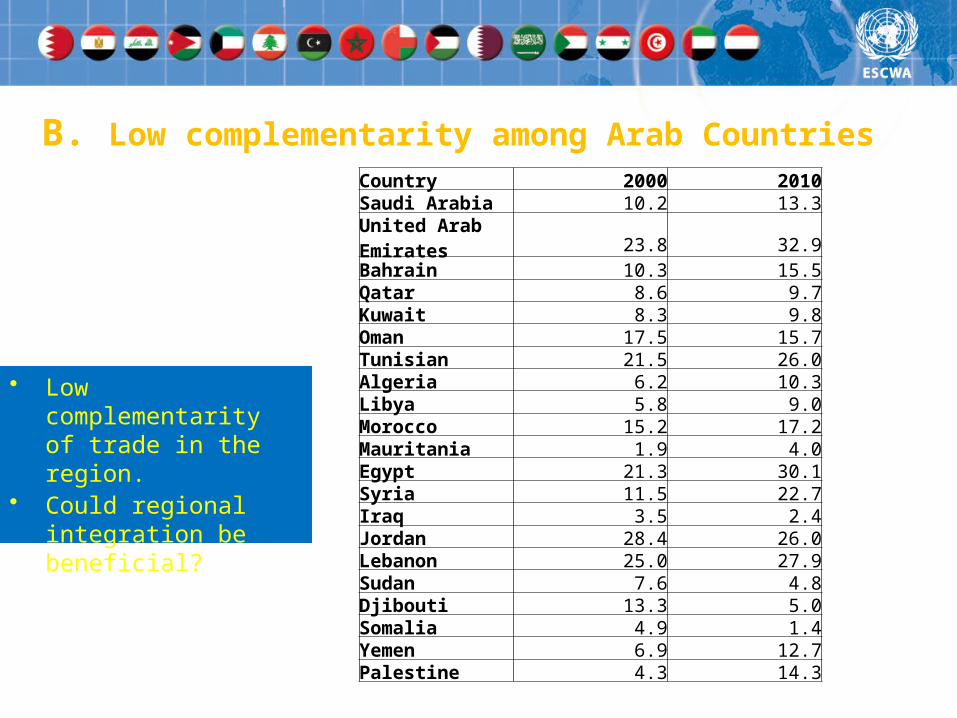
• Low complementarity of trade in the region.
• Could regional integration be beneficial?
B. Low complementarity among Arab Countries Country 2000 2010Saudi Arabia 10.2 13.3United Arab Emirates 23.8 32.9Bahrain 10.3 15.5Qatar 8.6 9.7Kuwait 8.3 9.8Oman 17.5 15.7Tunisian 21.5 26.0Algeria 6.2 10.3Libya 5.8 9.0Morocco 15.2 17.2Mauritania 1.9 4.0Egypt 21.3 30.1Syria 11.5 22.7Iraq 3.5 2.4Jordan 28.4 26.0Lebanon 25.0 27.9Sudan 7.6 4.8Djibouti 13.3 5.0Somalia 4.9 1.4Yemen 6.9 12.7Palestine 4.3 14.3
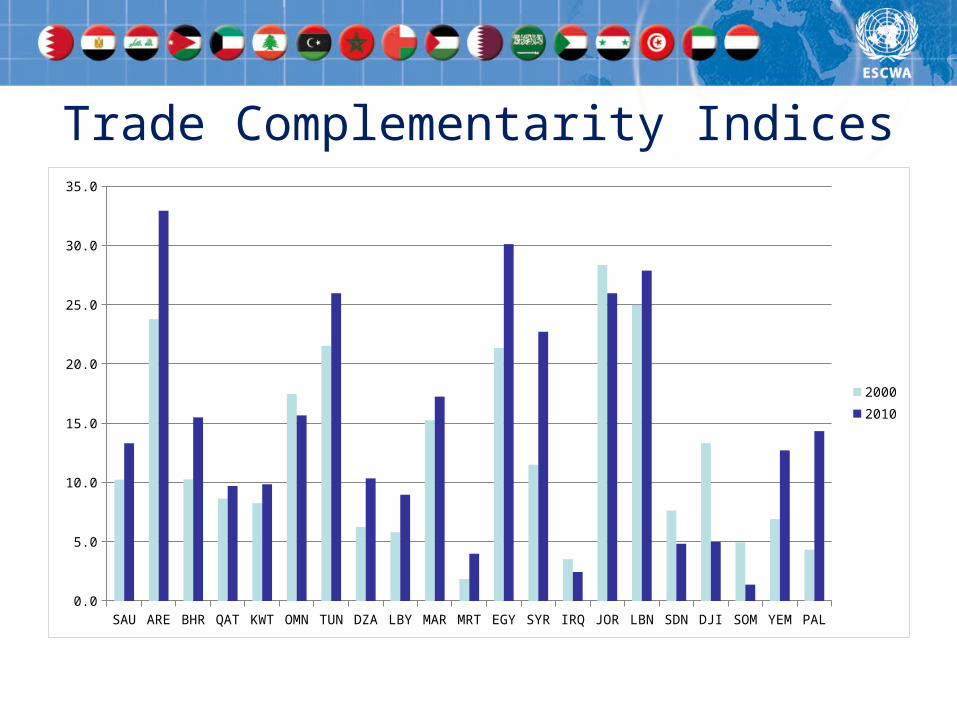
Trade Complementarity Indices
SAU ARE BHR QAT KWT OMN TUN DZA LBY MAR MRT EGY SYR IRQ JOR LBN SDN DJI SOM YEM PAL0.0
5.0
10.0
15.0
20.0
25.0
30.0
35.0
2000
2010

Structure of Arab Countries’ Exports
Bahra
in
Egypt
Ira
q
Jord
an
Libya
leban
on
Kuwait
Qatar
Oman
Mor
rocc
o
Saudia
Ara
bia
Syria
Sudan
Tunisi
a UAE
Yem
en
0%
10%
20%
30%
40%
50%
60%
70%
80%
90%
100%
Commodities and transactions not classified elsewhere in the SITC
Miscellaneous manufactured articles
Machinery and transport equipment
Manufactured goods classified chiefly by material
Chemicals and related products, n.e.s
Animal and vegetable oils, fats and waxes
Mineral fuels, lubricants and related mater-ials
Crude materials, inedible, except fuels
Beverages and tobacco
Food and live animals

• Trade agreements granting prefrencial market access DOES NOT eliminate problems created by NTMs.
• NTMs are particulary challanging in manufacturing sector.
• NTMs in Agriculture: Sanitary and Photosanitay measures (SPS), technical barriers to trade (TBT), and rules of origin.
Agriculture Manufacturing0
5
10
15
20
25
30
35
40
45
NTMExportP
erce
nt
Share of burdensome NTMs and exports in LAS
• NTMs in Manufacture: Rules of origin is the main callenge followed by SPS and TBT measures.
C. High Non-Tariff Measures (NTM) among Arab countries

• The most performing Arab countries is the UAE
• The second Arab country appears only at the 33 rank
• Most of the remaining countries still poor in terms of facility of trade.
• Poor logistics performance index means high cost of trade.
• In many Arab countries, the expected impacts from tariff removal have been offset by the high logistic costs
• To ensure gains from trade, Arab countries must make significant efforts in reducing technical barreirs to trade through the modernization of its infrastructure and logistics related to trade.
Economy rank score % of highest performer Singapore 1 4.13 100.00Hong Kong SAR, China 2 4.12 99.90United Arab Emirates 17 3.78 88.90Qatar 33 3.32 74.30Saudi Arabia 37 3.18 69.70Tunisia 41 3.17 69.40Morocco 50 3.03 65.00Egypt, Arab Rep. 57 2.98 63.30Oman 62 2.89 60.40Yemen, Rep. 63 2.89 60.30Kuwait 70 2.83 58.50Syrian Arab Republic 92 2.60 51.30Lebanon 96 2.58 50.60Jordan 102 2.56 49.80Algeria 125 2.41 45.30Mauritania 127 2.40 44.70Libya 137 2.28 41.00Iraq 145 2.16 37.10Sudan 148 2.10 35.30Djibouti 154 1.80 25.50Burundi 155 1.61 19.50
D. . High Cost of Logistics LPI is built around a survey of logistics
professionals. By asking freight forwarders to rate countries on key logistics issues— such as
customs clearance efficiency, infrastructure quality, and the ability to track cargo— It captures a broad
set of elements that affect perceptions of the efficiency of trade logistics in practice
The Logistics Performance Indicator provides a simple, global benchmarkto measure logistics performance

High disparities in terms of macroeconomic and sectoral policies
Convergence in macroeconomic and sectoral policies is found to be a key factor for the success of regional integration shemes
The three pillars for a successful regional integration are: - Convergence in terms of monetary policies-Convergence in terms of fiscal policies- Convergence in sectoral policies.
• Macroeconomic policies are too heterogeneous in the Arab word: Monetary policies are an example, where Arab countries did not achieved the minimum level of convergence. Some of them pegged their currencies to the US Dollar while others are more flexible.
• The objective of monetary policies itself is not homogeneous among countries: targeting inflation, increasing domestic investment, or mobilizing savings...
• Sectoral policies in terms of subsidies and public support harm competition and accordingly many countries excluded a significant lists of products from their inter-Arab agreements, mainly in Agriculture and related industries
E. . High disparities in terms of macroeconomic and sectoral policies
Impact of reduction of the cost of transport s in the Region within the
context of DAFAT?

Scenarios definition
18
Sim 1 (FTA): A full implementation of intra-Arab FTA
Sim2 (TR) =Sim1+ a 50% reduction of intra-Arab transport costs
Sim3 (CU) : Sim2+ a customs union between all Arab countries.
Sim4 (Migration): Sim3+the replacement of 20% of non Arab migrant stock by Arab migrants.
sim4:sim3+ An Arab
preference for migration
quotas in OPC
sim3: sim3+a common
external tariffs (for non
agriculture products
sim2: sim1+ 50% reduction in
transport cost
sim1: A complete Free trade Area

Simulations results:
Impacts on trade
Intra Arab trade variation
19
sim1 sim2 sim3 sim40.0
5.0
10.0
15.0
20.0
25.0
30.0
35.0
40.0
45.0
10.1
38.5
32.6 33.0
ref sim1 sim2 sim3 sim40.0
2.0
4.0
6.0
8.0
10.0
12.0
14.0
8.59.3
11.510.6 10.7
A full implementation of the FTA supports the increase of intra-Arab trade by around 10 per cent. If 50 per cent transport cost is reduced intra-Arab trade could increase by 38.5%.
The application of common external tariff increases trade with non-Arab partners as the market access will increase in both directions.
Share of the intra-Arab trade in total trade

Simulations results:
Impacts on GDP at regional
level
20
Variation of GDP
Impact on GDP ranges from 0.17 % in scenario 1 to more than 3.56% in scenario 4.
This increase is shown for both oil and non-oil producing Arab economies with more increase in non oil economies.
Scenario 4 shows, in oil producing countries the GDP increases around 3% compared to 4.45% increase in non oil producing countries.

Simulations results: Impacts
on GDP at country level
Substantially impact on GDP is shown in all Arab countries.
Egypt will in particular benefit and will enjoy a 5.49% increase in GDP.
A number of GCC countries will also benefit such as SA, UAE Bahrain, Kuwait.
The impact on GDP is low in Oman and Qatar.
Saudi Arabia
UAE
Bahrain
Kuwait
Oman
Qatar
Rest of North Africa
Egypt
Tunisia
Morocco
Rest of Mashreq
-1 0 1 2 3 4 5 6
0.12
0.12
0.15
0.04
0.05
0.01
-0.14
0.55
0.03
0.12
0.42
1.22
0.620000000000001
2.13
0.52
0.820000000000001
0.45
0.15
1.58
1.04
0.42
2.24
2.88
2.88
4.14
3.11
1.24
1.27
1.94
3.23
2.1
0.55
3.37
4
4.07
4.01
3.36
0.34
0.98
1.95
5.49
3.08
2.39
4.43
Migration CU Transport cost reduction FTA
21

How to reduce Trade Costs? ESCWA’s activities
• Current activities• 1. Identification and costing of
technical barriers to trade: A survey on trade costs in selected Arab countries and on selected commodities
• 2. Costing of strategies and impacts analysis: Impacts of reduction in trade costs on economic performance in the Arab region (by country) through alternative options of public-private investments and financing
• 3. Aid for Trade: • Identification of projects to
reduce trade costs (by country)• Costing the identified projects
(by country)• Comparative financing options
for trade costs related projects (by country)
• Economic implications (by country)

Conclusions
• Removing trade barriers is good but not enough
• Making countries able to take advantage from trade openness is more challenging than removing tariffs
• Other barriers and obstacles require specific and additional attention:
• - inefficient trade logistics• - costly transport and financial
services• - low productive capacities and
poor diversification• - poor policy coordination and
convergence

Thanks for your attention


