
EXPERIMENTAL STUDY AND NUMERICAL MODELLING OF
SELF-HEATING BEHAVIOUR OF TORREFIED AND
NON-TORREFIED BIOMASS FUELS
By
Tengku Noor Arbaee binti Tg Azhar
A thesis submitted in partial fulfilment of the requirements for the degree of the
Doctor of Philosophy
The University of Sheffield
Faculty of Engineering
Department of Chemical and Biological Engineering
JUNE 2018
II
Abstract
Biomass pre-treatment using torrefaction technology has been proven to upgrade
energy density, thermal and physical properties of the biomass. The torrefied
biomass fuel has higher energy content, which could be comparable to low-rank coal.
However, similar to coal, self-heating is one of the major safety concerns during the
storage and handling, which can lead to ignition. There are several events of
accidental fires that occurred in the past, resulting from self-heating leading to
ignition. This work focuses on the experimental study and numerical modelling of
self-heating behaviour of microwave torrefied biomass and non-torrefied biomass
stored in a large pile. Physical and chemical properties of the materials were
determined using proximate and ultimate analysis. The calorific values of the non-
torrefied sample are 18.4MJ/kg and 22.0MJ/kg for torrefied biomass. Self-heating
propensity is determined based on heat evolution and mass changes analysis using
the thermogravimetric analysis to determine the thermal decomposition behaviour
and thermal decomposition kinetics parameters of the torrefied and non-torrefied
material. The activation energy for thermal decomposition in the air is in between
64.5 to 84.4 kJ/mol for the non-torrefied sample and 53.1 to 70.7 kJ/mol for the
torrefied sample. However, the activation energy for thermal decomposition in
nitrogen is between 58.7 to 70.9 kJ/mol for non-torrefied sample and 59.2 to 71.8
kJ/mol for the torrefied sample. The evaluation of the self-ignition risk was done
based on the characteristic oxidation temperature and the activation energy. The
activation energy for torrefied biomass fuel indicated that the material is reactive and
have a higher tendency to self-heating. The risk ranking graph; is drawn based on the
activation energy and characteristic temperature of the samples against other
materials from literature. Both samples are classified as a medium risk, but with
microwave torrefied sample in the rank of higher tendency to self-ignite comparing
to the non-torrefied sample. A series of bulk test was performed to investigate the
heating behaviour on a larger scale to examine the effect of the bulk size and oven
temperature. The test showed that when the oven temperature is below and at 180ºC
no ignition is detected for the non-torrefied sample. However, microwave torrefied
sample started to self-heat at 4002 seconds (66.7 minutes). It can be concluded that
the torrefied sample is more reactive compared to the non-torrefied sample. Series of
III
the bulk test is carried out in the uniformly heated oven at constant air temperature to
study the thermal heating behaviour independently. The test showed the ignition
induction time for microwave torrefied sample heated at 180ºC is 4002 seconds at
Bulk 1, 5066 for Bulk 2 and 7611 for Bulk 3. The ignition induction time increased
with the decreasing of the bulk volume. The ignition induction time is decreasing
when the oven temperature is increased. A simulation model to predict the heating
behaviour of the materials, in an open storage area, had been developed using
COMSOL Multiphysics® software. The numerical model was used to examine the
thermal behaviour of the pile based on coupled heat and mass transfer in porous
media, which includes kinetic parameters, obtained using thermogravimetric
analysis. The numerical model was validated against the results of the bulk tests with
good agreement. Simulations were carried out to examine the effect of the height and
ambient temperature on the thermal behaviour of the pile. The simulations
demonstrated that the ignition induction time decreased when the ambient
temperature increased. The ambient temperature of 60°C is established as critical
ambient temperature for the storage of microwave torrefied sample, while 80°C is
the critical ambient temperature for non-torrefied sample. Based on the simulation,
the biomass needs to be piled up vertically instead of horizontally to avoid the
multiple hot spots. The results from this study can be used as decisional support
information towards achieving the safe storage of torrefied biomass.

IV
Acknowledgement
I would like to express my most sincere gratitude and appreciation to Dr Yajue Wu,
who has patiently mentored me throughout my PhD. journey. She was supportive
and helpful during the stressful and toughest time in my life. She has given me
insightful guidance as well as encouragement for the last four years.
I would also like to thanks Dr. Vitaliy L. Budarin from Department of Chemistry,
University of York and his team; as well as Dr. Chunfei Wu from School of
Engineering, University of Hull for their precious time spent in preparing the
torrefaction sample using the reactor at the Green Chemistry Centre of Excellence,
Department of Chemistry, University of York.
Thank you to everyone in D10 office, Pam Liversidge Building, the valuable
discussions and the endless silly jokes made the academic life enjoyable. I am also
sincerely grateful to all the technicians and staff at the Department of Chemical and
Biological Engineering for all your help towards completing my PhD.
To my family - thank you for the unconditional support and believing in me:
~ Ayah, Mama, Abang, Kak Huda, Azmin, Elena, Firdaus, Munirah, and Faiz ~
Lastly, thank you to all my amazing friends who always by my side…
“Success isn’t a result of spontaneous combustion. You must set yourself on fire.”
– Arnold H. Glasgow

V
Table of Contents
LIST OF TABLES ............................................................................................................................................ VIII LIST OF FIGURES ............................................................................................................................................. IX
ABBREVIATIONS……………………………………………………………………………………………………………XIII
NOMENCLATURE…………………………………………………………………………………………………………. XIV
CHAPTER 1 INTRODUCTION ...................................................................................................................... 1 1.1 BACKGROUND ......................................................................................................................................................... 1 1.2 APPROACH OF THE RESEARCH ............................................................................................................................ 11 1.3 OBJECTIVES AND NOVEL CONTRIBUTION .......................................................................................................... 14
1.3.1 Objectives ................................................................................................................................................... 14 1.3.2 Novelty of the research ......................................................................................................................... 14
1.4 LAYOUT OF THE THESIS ....................................................................................................................................... 15
CHAPTER 2 LITERATURE REVIEW ........................................................................................................ 16 2.1 ENERGY RECOVERY FROM BIOMASS .................................................................................................................. 16
2.1.1 Issues of biomass fuels as energy source ....................................................................................... 19 2.2 PRE-TREATMENT METHODS FOR LIGNOCELLULOSIC BIOMASS ..................................................................... 20
2.2.1 Thermal pre-treatment ........................................................................................................................ 21 2.2.2 Torrefaction technology ...................................................................................................................... 22 2.2.3 Conventional torrefaction ................................................................................................................... 23 2.2.4 Microwave torrefaction ....................................................................................................................... 26 2.2.5 Torrefied biomass fuels ........................................................................................................................ 27
2.3 STORAGE OF BIOMASS FUELS .............................................................................................................................. 28 2.4 SELF-HEATING LEADING TO IGNITION .............................................................................................................. 29
2.4.1 Self-heating behaviour of coal ........................................................................................................... 32 2.4.2 Self-heating behaviour in biomass fuels stockpile ..................................................................... 33 2.4.3 Factors influence the self-heating propensity ............................................................................. 35 2.4.4 Biomass fuels ignition preventions .................................................................................................. 37
2.5 EXPERIMENTAL STUDY OF SELF-HEATING BEHAVIOUR .................................................................................. 37 2.5.1 Thermogravimetric analysis of thermal decomposition ......................................................... 39 2.5.2 Isothermal oven test .............................................................................................................................. 41 2.5.3 Numerical modelling of self-ignition .............................................................................................. 43
2.6 CONCLUSIONS OF THE LITERATURE REVIEW.................................................................................................... 44
CHAPTER 3 CHARACTERISATION OF NON-TORREFIED AND MICROWAVE TORREFIED BIOMASS…………. ............................................................................................................................................. 46
3.1 BIOMASS SAMPLE ................................................................................................................................................. 46 3.2 TORREFACTION PROCESS .................................................................................................................................... 46
3.2.1 Equipment and experimental procedure for sample preparation ...................................... 47 3.2.2 Microwave torrefied biomass fuels .................................................................................................. 49

VI
3.3 METHODS TO DETERMINE PROPERTIES OF BIOMASS FUELS .......................................................................... 51 3.3.1 Calorific value .......................................................................................................................................... 51 3.3.2 Proximate analysis ................................................................................................................................. 52 3.3.3 Ultimate analysis .................................................................................................................................... 53 3.3.4 True density and bulk density determination ............................................................................. 54
3.4 RESULTS AND DISCUSSION .................................................................................................................................. 54 3.4.1 Calorific value .......................................................................................................................................... 54 3.4.2 Mass and energy yield ........................................................................................................................... 56 3.4.3 Proximate analysis ................................................................................................................................. 58 3.4.4 Ultimate analysis .................................................................................................................................... 62 3.4.5 True density and bulk density ............................................................................................................ 65
3.5 SUMMARY .............................................................................................................................................................. 66
CHAPTER 4 EXPERIMENTAL DETERMINATION OF REACTIVITY AND KINETIC PARAMETERS USING THERMOGRAVIMETRIC ANALYSIS ............................................................... 67
4.1 EQUIPMENT AND METHOD USED FOR THERMAL BEHAVIOUR ANALYSIS ..................................................... 67 4.2 EVALUATION OF THERMAL REACTIVITY ........................................................................................................... 69
4.2.1 Thermal decomposition characteristic .......................................................................................... 69 4.2.2 Temperature of initial combustion (TIC) ....................................................................................... 73 4.2.3 Temperature at maximum weight loss (TMWL) ........................................................................ 74 4.2.4 Characteristic oxidation temperature (Tcharac) ........................................................................... 75
4.3 RESULTS OF KINETIC PARAMETERS USING THERMOGRAVIMETRIC ANALYSIS ............................................ 77 4.3.1 Background on determination of kinetic parameters ............................................................. 77 4.3.2 Kinetic analysis method ....................................................................................................................... 78 4.3.3 Kinetic parameters of the samples .................................................................................................. 80
4.4 THERMAL DECOMPOSITION CHARACTERISTIC IN AIR ..................................................................................... 83 4.5 THERMAL DECOMPOSITION CHARACTERISTIC IN NITROGEN ......................................................................... 86
4.5.1 Characteristic parameters of both samples at various heating rate and carrier gas 89 4.6 EVALUATION OF SELF-IGNITION RISK BASED ON CHARACTERISTIC OXIDATION TEMPERATURE AND
ACTIVATION ENERGY ........................................................................................................................................................ 90 4.7 SUMMARY .............................................................................................................................................................. 91
CHAPTER 5 EXPERIMENTAL STUDY OF THE THERMAL RUNAWAY IN BULK TESTS .......... 93 5.1 EXPERIMENTAL WORKS ....................................................................................................................................... 93
5.1.1 Objectives of the experiment .............................................................................................................. 93 5.1.2 Samples and equipment ....................................................................................................................... 93 5.1.3 Thermal data logging system ............................................................................................................ 96
5.2 EXPERIMENTAL PROCEDURE .............................................................................................................................. 96 5.3 SELF-HEATING AND THERMAL RUNAWAY IN BULK TESTS ............................................................................. 99
5.3.1 Discussion of the self-heating propensity of the samples ........................................................ 99 5.3.2 Discussion of effect of bulk size on self-heating behaviour ................................................. 103
VII
5.3.3 Discussion of effect of oven temperature on self-heating behaviour .............................. 110 5.4 CONCLUSION ...................................................................................................................................................... 113
CHAPTER 6 DEVELOPMENT OF NUMERICAL MODELS TO SIMULATE THE SELF-HEATING PROCESS IN BULK STORAGE AREA ....................................................................................................... 114
6.1 SELF-HEATING OF BIOMASS FUELS IN OPEN STORAGE AREA ...................................................................... 114 6.2 THE MODEL SET UP ........................................................................................................................................... 115 6.3 GOVERNING EQUATIONS AND COMPUTATIONAL MODULE .......................................................................... 116
6.3.1 Mathematical model .......................................................................................................................... 117 6.3.2 Mesh .......................................................................................................................................................... 119
6.4 MODEL VALIDATION ......................................................................................................................................... 119 6.4.1 Introduction ........................................................................................................................................... 119 6.4.2 Geometry of the model ....................................................................................................................... 120 6.4.3 Result of the validation...................................................................................................................... 121
6.5 VARIABLE ANALYSIS ......................................................................................................................................... 125 6.5.1 Effect of pile height ............................................................................................................................. 125 6.5.2 Effect of pile width............................................................................................................................... 130 6.5.3 Effect of ambient temperature ....................................................................................................... 132
6.6 DISCUSSIONS ON EFFECT OF THE VARIABLES ................................................................................................ 141
CHAPTER 7 CONCLUSIONS AND RECOMMENDATIONS FOR FUTURE RESEARCH ............. 144 7.1 CONCLUSIONS .................................................................................................................................................... 144 7.2 RECOMMENDATIONS FOR FUTURE RESEARCH .............................................................................................. 147
REFERENCES……. ......................................................................................................................................... 148 APPENDIX A: THERMOCOUPLES READINGS FOR BULK TESTS .................................................. 162 APPENDIX B: PUBLICATION ORIGINATED FROM THE THESIS .................................................. 171
VIII
List of Tables
Table 1.1: Lignocellulosic biomass groups and examples of utilisation ............................ 3
Table 1.2: Properties of biomass fuels and coal ................................................................. 6
Table 1.3: Fire incidents associated with the self-heating of biomass in the United Kingdom for the past ten years .................................................................................................. 9
Table 1.4: Experimental work done in the research .......................................................... 13
Table 2.1: Categories of pre-treatment of lignocellulosic biomass ................................... 21
Table 2.2: Prevention suggestions from past studies on self-heating of biomass material in stockpiles .................................................................................................................. 38
Table 3.1 Proximate analysis of non-torrefied and microwave torrefied samples in comparison with coal ............................................................................................... 60
Table 3.2: Ultimate analysis of non-torrefied and microwave torrefied samples in comparison to coal ................................................................................................... 63
Table 4.1: The equations of linear regression for kinetic parameters determination of thermal decomposition in air ................................................................................................. 81
Table 4.2: The equations of linear regression for kinetic parameters determination of thermal decomposition in nitrogen ........................................................................................ 81
Table 4.3: Kinetic parameters of thermal decomposition in air for samples evaluated based on Doyle’s and Coats-Redfern’s approximations .................................................... 82
Table 4.4: Kinetic parameters of thermal decomposition in nitrogen for samples evaluated based on Doyle’s and Coats-Redfern’s approximations .......................................... 82
Table 4.5: Characteristic temperatures and maximum rate of mass loss (DTGmax) for the decomposition in air and nitrogen ............................................................................ 90
Table 5.1: Locations of the thermocouples based on vertical and radial coordinates ....... 97
Table 5.2: List of oven temperatures used during bulk heating experiments ................... 98
Table 6.1: Model inputs for simulation ........................................................................... 118

IX
List of Figures
Figure 1.1: The carbon neutral cycle (Vassilev, Vassileva, & Vassilev, 2015). ................. 1
Figure 1.2: Components in (a) willow chips (b) straw pellets (Mašek et al., 2013a) ......... 2
Figure 1.3: World total primary energy supply based on the types of fuel. (IEA, 2016) ... 4
Figure 1.4: Source of total energy consumption in Europe in 2014 (AEBIOM, 2016) ...... 5
Figure 2.1: Possible routes of conversion for biomass fuels using thermochemical processes (Iowa Energy Center, 2016) ..................................................................................... 17
Figure 2.2: Possible routes of conversion for biomass fuels using biochemical processes (Badiei et al., 2014; Balat, 2006) ............................................................................. 17
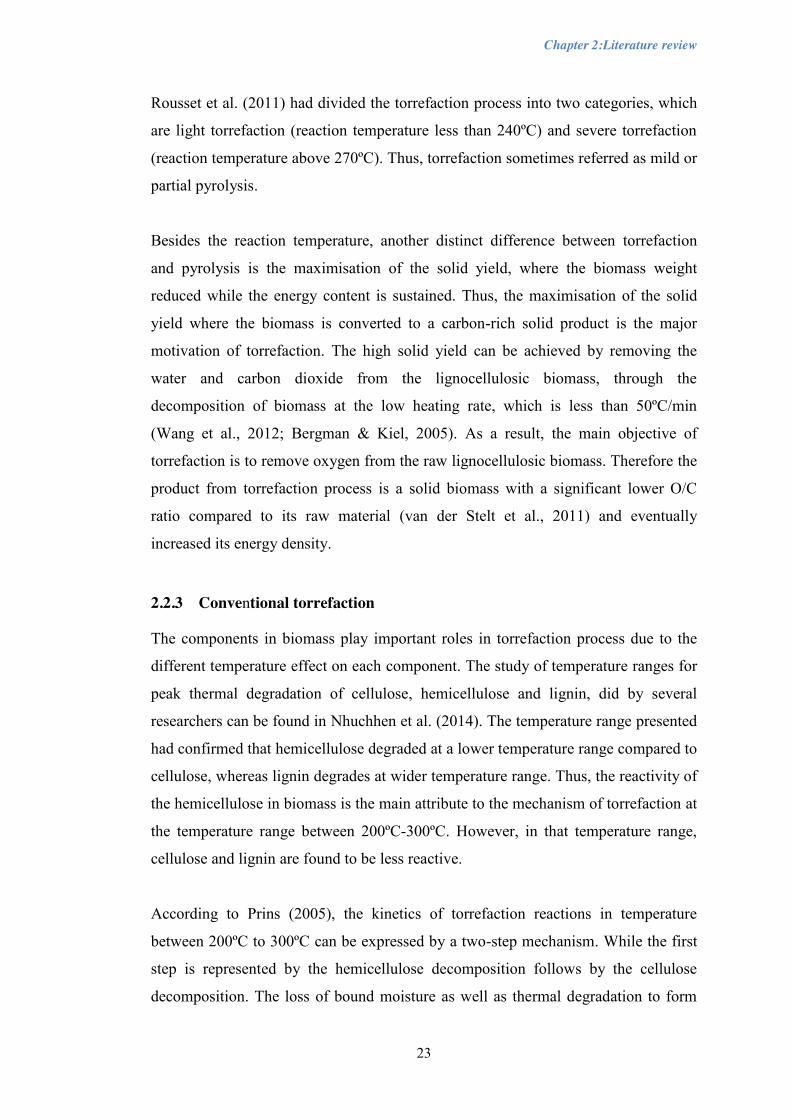
Figure 2.3: Temperature stages of torrefaction process (van der Stelt et al., 2011).......... 25
Figure 2.4: Mechanism of microwave heating (Anwar et al., 2015; Lanigan, 2010). ...... 26
Figure 2.5: Heat produced by the reaction (Qreact) and the heat lost or gained due to convective heat transfer for three values of To (van Blijderveen et al., 2010) ......... 31
Figure 2.6: Stages concerning the fires caused by self-ignition in bulk material (Krause, 2009) ........................................................................................................................ 34
Figure 2.7: Possibility of thermal behaviour of the sample in the isothermal oven (Ramírez, García-torrent, & Tascón, 2010) .............................................................................. 42
Figure 3.1: Non-torrefied biomass sample ........................................................................ 46
Figure 3.2: Microwave torrefaction reactor ROTO SYNTH (Milestone Srl., Italy) ........ 47
Figure 3.3: Rotating glass flask filled with raw biomass sample inside the microwave chamber .................................................................................................................... 48
Figure 3.4: The liquid products were condensed in a water-cooled vacuum trap ............. 48
Figure 3.5: Microwave torrefied sample ........................................................................... 49
Figure 3.6: 6200 Isoperibol Bomb calorimeter (Parr Instrument Company, USA) .......... 51
Figure 3.7: Parts of bomb vessel ....................................................................................... 52
Figure 3.8: Calorific value of the samples ........................................................................ 54
Figure 4.1: Temperature profile for thermal decomposition in air at 5°C/min ................. 70
Figure 4.2: Derivative weight loss in air at 5°C/min ........................................................ 70
Figure 4.3: Temperature profile for thermal decomposition in nitrogen at 5°C/min ........ 72
Figure 4.4: Derivative weight loss in nitrogen at 5°C/min ............................................... 73

X
Figure 4.5: Determination of temperature of initial combustion (TIC) ............................ 74
Figure 4.6: Determination of temperature of maximum weight loss in air at 1°C/min .... 75
Figure 4.7: Determination of Tcharac under oxygen stream at 40°C/min. ........................... 76
Figure 4.8: Temperature profile of decomposition in air of non-torrefied sample at different heating rate ............................................................................................................... 83
Figure 4.9: Temperature profile of derivative weight loss in air of non-torrefied sample at different heating rate ................................................................................................ 84
Figure 4.10: Temperature profile of decomposition in air for microwave torrefied sample at different heating rate ................................................................................................ 85
Figure 4.11: Temperature profile of derivative weight loss in air for microwave torrefied sample at different heating rate ................................................................................ 85
Figure 4.12: Temperature profile of decomposition in nitrogen of non-torrefied sample at different heating rate ................................................................................................ 87
Figure 4.13: Temperature profile of derivative weight loss in nitrogen non-torrefied sample at different heating rate ............................................................................................ 88
Figure 4.14: Temperature profile of decomposition in nitrogen of microwave torrefied sample at different heating rate ................................................................................ 88
Figure 4.15: Temperature profile of derivative weight loss in nitrogen for microwave torrefied sample at different heating rate ................................................................. 89
Figure 4.16: Risk ranking graph based on the activation energy and characteristic oxidation temperature plotted among data from García Torrent et al., (2016) and Ramírez et al., (2010) ....................................................................................................................... 91
Figure 5.1: Three sizes of wire mesh baskets wide side lengths labelled ......................... 94
Figure 5.2: Schematic diagram of experimental setup of heating tests for Bulk 1 ........... 94
Figure 5.3: Schematic diagram of experimental setup of heating tests for Bulk 2 ........... 95
Figure 5.4: Schematic diagram of experimental setup of heating tests for Bulk 3 ........... 95
Figure 5.5: Location of the thermocouple in the experiments. ......................................... 97
Figure 5.6: Wire mesh basket filled with microwave torrefied sample ............................ 98
Figure 5.7: The comparison of the temperature profiles of the samples at 180°C heated using Bulk 1 ..................................................................................................................... 100
Figure 5.8: Temperature profile of non-torrefied sample heated at 180ºC in Bulk 1 ..... 101
Figure 5.9: Temperature profile of T1 and oven temperature (T5) ................................. 102
Figure 5.10: Temperature profile of microwave torrefied sample at 180ºC in Bulk 1 .. 102

XI
Figure 5.11: Comparison of temperature reading at the centre (T1) of non-torrefied sample heated at 200°C at different volumes ..................................................................... 104
Figure 5.12: Induction time of non-torrefied sample heated at 200ºC in Bulk 1 ............ 105
Figure 5.14: Induction time of non-torrefied sample heated at 200°C in Bulk 3 ............ 105
Figure 5.15: Induction time vs V/A of non-torrefied sample at 200°C .......................... 106
Figure 5.16: Relationship between side length and induction time of non-torrefied sample heated at 200°C ...................................................................................................... 106
Figure 5.17: Temperature profile of microwave torrefied sample heated at 180°C Bulk 1107
Figure 5.18: Temperature profile of microwave torrefied heated at 180°C in Bulk 2 .... 108
Figure 5.19: Temperature profile of microwave torrefied sample heated at 180°C in Bulk 3 ................................................................................................................................ 108
Figure 5.20: Comparison of temperature profiles at the centre of the bulk (T1) of microwave torrefied sample heated at 180°C at different volumes .......................................... 109
Figure 5.21: Relationship between side length and induction time for microwave torrefied sample heated at 180°C .......................................................................................... 110
Figure 5.22: Temperature profile of microwave torrefied sample at 170°C in Bulk 1 ... 111
Figure 5.23: Temperature profile for microwave torrefied sample at 190ºC in Bulk 1 .. 111
Figure 5.24: Comparison of readings at the centre of the bulk (T1) of microwave torrefied sample heated in Bulk 1 at various oven temperatures .......................................... 112
Figure 5.25: Relationship between the temperature and induction time ......................... 113
Figure 6.1: Heat loop that leading to thermal runaway ................................................... 114
Figure 6.2: Geometry of simplified model of the pile in an open storage. ..................... 116
Figure 6.3: Free triangular shape mesh was chosen for the simulation .......................... 119
Figure 6.7: The comparison for experimental and simulation for microwave torrefied biomass heated at 180°C in Bulk 1. ....................................................................... 123
Figure 6.8: The comparison between temperature patterns at the centre for experimental and simulation for non-torrefied biomass heated at 180°C ........................................... 124
Figure 6.14: Temperature profile at the hottest spot of the microwave torrefied sample after being stored for 2550 hours at ambient temperature of 80°C ................................ 132
Figure 6.16: Relationship between highest pile temperature and the ambient temperature of microwave torrefied sample ................................................................................... 134
Figure 6.19: Temperature contour at ambient temperature of 60°C ............................... 137
Figure 6.20: Temperature profile of hottest point at ambient temperature of 60°C........ 137

XII
Figure 6.21: Temperature contour of hottest point at ambient temperature of 80°C ...... 138
Figure 6.22: Temperature profile of hottest point at ambient temperature of 80°C........ 139
Figure 6.23: Temperature contour for hottest point at ambient temperature of 85°C ..... 140
XIII
Abbreviations
SIT Self ignition temperature TMWL The maximum weight loss DTA Differential thermal analysis DSC Differential scanning calorimeter TGA Thermogravimetric analysis TG Thermogravimetric DTG Differential thermogravimetric CP Crossing point TIC Temperature of Initial Combustion

XIV
Nomenclature
Symbol Description Unit
A Pre-exponential factor Bi Biot number Cp Specific heat J/(kg K) Dp Particle diameter mm Ea Activation energy J/mol H Height m H Convective heat transfer coefficient W/(m2 K) K Reaction rate constant min-1 L Length m Q Heat source W/m3 R Universal gas constant, 8.314 J mol-1 K-1 �̇�′ Heat source J/kg T Temperature K t Time s V Volume m3 𝛽 Heating rate K/min 𝑤 Weight original sample mg 𝑤𝑜 Weight at the start of the stage mg 𝑤∞ Weight at the end of the stage mg V Volume m3 𝑂2 Oxygen concentration mol m-3
Greek symbols Α Thermal diffusivity m2/s 𝜆 Thermal conductivity W/(m K) Ρ Bulk density Kg/m3 𝜀 Porosity 𝛿𝑐 Damkohler number. Subscript F fuel react reaction conv convective crit critical eff effective charac characteristic

Chapter 1: Introduction
1
Chapter 1 Introduction
1.1 Background
Biomass is a source of renewable energy that has a huge potential to play a major
role in the energy sector as alternative fuels to coal. Biomass is defined as “the
biologically degradable fraction of products, waste and residues from the biological
origin of agriculture that include vegetable and animal substances, forestry and
related industries including fisheries and aquaculture, as well as the biodegradable
fraction of industrial and municipal waste” (Renewable Energy Directive, 2009).
However, despite many sources of biomass, lignocellulosic biomass has been
considered as the most promising energy source due to its surplus availability, usage
practicality, and relatively low cost. The lignocellulosic biomass refers to plant
biomass that is composed of cellulose, hemicellulose, and lignin.
Figure 1.1: The carbon neutral cycle (Vassilev et al., 2015).
In addition to that, lignocellulosic biomass is the only carbon neutral energy source
that does not contribute to the greenhouse effect. Therefore lignocellulosic biomass
has become the most favourable source due to its carbon neutral advantage. The
neutral carbon cycle of carbon dioxide is shown in Figure 1.1, where the
neutralisation of carbon dioxide emission achieved when converting biomass to

Chapter 1: Introduction
2
energy since the growth of new biomass removes carbon dioxide from the
atmosphere. Unless otherwise stated, biomass is referred as lignocellulosic biomass
throughout this thesis.
As mention earlier, the main components of lignocellulosic biomass are cellulose,
hemicellulose, lignin and extracts. Thus, cellulose is a component with a crystalline
structure that is insoluble in water as well as resistant towards depolymerisation
(Badiei et al., 2014). Hemicellulose is a backbone of the plant cell wall that has sugar
units such as xylose, mannose, galactose, arabinose as well as glucose (Eriksson,
2011). Lignin provides mechanical strength to the plant cell wall by covalent linkage.
Lastly, terpene, phenol and different types of fats are among extractives in the
lignocellulosic biomass component. Different types of biomass will have a different
component breakdown. The examples of biomass components adopted from study by
Mašek et al. (2013a) are shown in Figure 1.2.
Figure 1.2: Components in (a) willow chips (b) straw pellets (Mašek et al., 2013a)
The biomass characteristics are influenced by its origins from which it has been
collected. Biomass may have the same major component but in different proportion,
which results in a broad range of fuel properties. According to Naik et al. (2010), the
same type of biomass can have different composition based on the climatic condition
as well as the seasonal variation. Badiei et al. (2014) added that the composition of
biomass component is also affected by the types of the biomass such hardwood or
softwood. The work by Vassilev et al. (2010) recognised various factors that affected
the composition of biomass such as the growth conditions, a distance of the plant
from the source of pollutions, harvesting time, types of biomass including plant
Chapter 1: Introduction
3
species or part of the plants. Its chemical composition cannot be defined precisely for
a given tree species or even for a given tree properties. The utilisation of each
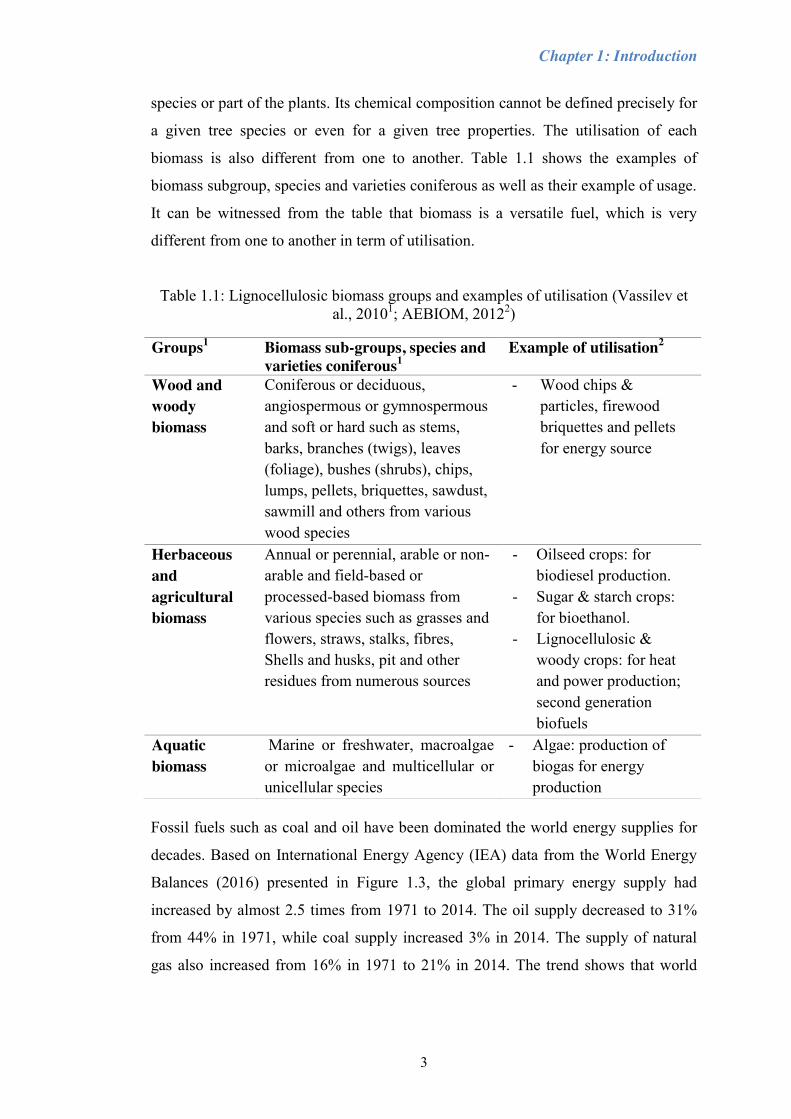
biomass is also different from one to another. Table 1.1 shows the examples of
biomass subgroup, species and varieties coniferous as well as their example of usage.
It can be witnessed from the table that biomass is a versatile fuel, which is very
different from one to another in term of utilisation.
Table 1.1: Lignocellulosic biomass groups and examples of utilisation (Vassilev et al., 20101; AEBIOM, 20122)
Fossil fuels such as coal and oil have been dominated the world energy supplies for
decades. Based on International Energy Agency (IEA) data from the World Energy
Balances (2016) presented in Figure 1.3, the global primary energy supply had
increased by almost 2.5 times from 1971 to 2014. The oil supply decreased to 31%
from 44% in 1971, while coal supply increased 3% in 2014. The supply of natural
gas also increased from 16% in 1971 to 21% in 2014. The trend shows that world
Groups1 Biomass sub-groups, species and varieties coniferous1
Example of utilisation2
Wood and woody biomass
Coniferous or deciduous, angiospermous or gymnospermous and soft or hard such as stems, barks, branches (twigs), leaves (foliage), bushes (shrubs), chips, lumps, pellets, briquettes, sawdust, sawmill and others from various wood species
- Wood chips & particles, firewood briquettes and pellets for energy source
Herbaceous and agricultural biomass
Annual or perennial, arable or non-arable and field-based or processed-based biomass from various species such as grasses and flowers, straws, stalks, fibres, Shells and husks, pit and other residues from numerous sources
- Oilseed crops: for biodiesel production.
- Sugar & starch crops: for bioethanol.
- Lignocellulosic & woody crops: for heat and power production; second generation biofuels
Aquatic biomass
Marine or freshwater, macroalgae or microalgae and multicellular or unicellular species
- Algae: production of biogas for energy production

Chapter 1: Introduction
4
primary energy supplies by some means still depend on fossil fuel with 81% of
energy supply in 2014 is from fossil fuels.
Figure 1.3: World total primary energy supply based on the types of fuel. (IEA,
2016)
Unfortunately, harmful emission such as SO2, NOx, CO2, N2O, particulate matter,
mercury, cadmium and other acid gases are being released into the environment by
the coal-fired power plant (Nalbandian, 2010). The burning of fossil fuels such as
coal that cause the harmful emission started since the Industrial Revolution as early
as the 1800s has been recognised as one of the main contributors to the increase of
the greenhouse gases concentration in the atmosphere especially carbon dioxide (Life
Science, 2016).
Coal is a sedimentary rock that composed of lithified plant materials remains that
consist of carbohydrates, lignin, proteins and other polymers including
hemicelluloses, suberin as well as cutin (Speight, 1994). Coal can be grouped into
types based on its rank, which is a measure according to the degree of organic
metamorphism (changes). The rank of coal is from lowest to highest are peat, lignite,
sub-bituminous, bituminous and anthracite.
The chemical composition of coal is different from biomass, especially the amount
of hydrogen, oxygen and carbon. In comparison to biomass, coal has much higher
carbon content and fewer fractions of hydrogen and oxygen. Thus, coal is a fuel with
a low atomic ratio of oxygen to carbon (O/C); which is more favourable in energy
conversion. The low O/C fuel is favourable because of its higher gasification
Chapter 1: Introduction
5
efficiencies (Prins et al., 2006b) and decrease amount of smoke and water vapour
(Kambo & Dutta, 2014). Furthermore, biomass has higher volatile matters compared
to coal, which could lead to low ignition temperature causing more amounts of
combustible gas production during thermal conversion process (Chiang et al., 2012).
Based on Table 1.2, the energy density of coal is considerably higher than the one in
wood as well as solid biofuel such wood pellet and torrefied pellet. As mentioned
earlier, biomass fuels have more oxygen and hydrogen and less carbon than coal.
Thus, the properties are agreeable with the fact that biomass fuels have much higher
volatile matters and moisture content compared to coal as well as lower heating
value. Based on Table 1.2, the biomass fuel that undergone the pre-treatment such as
torrefaction had improvement in properties, for example the heating value of the
torrefied pellets is higher compared to the wood pellets. The improved properties are
comparable to coal. Thus, the positive outcome from the biomass pre-treatment is
creating the demand for solid biofuels in the energy industry to fulfil the carbon
neutral energy demand.
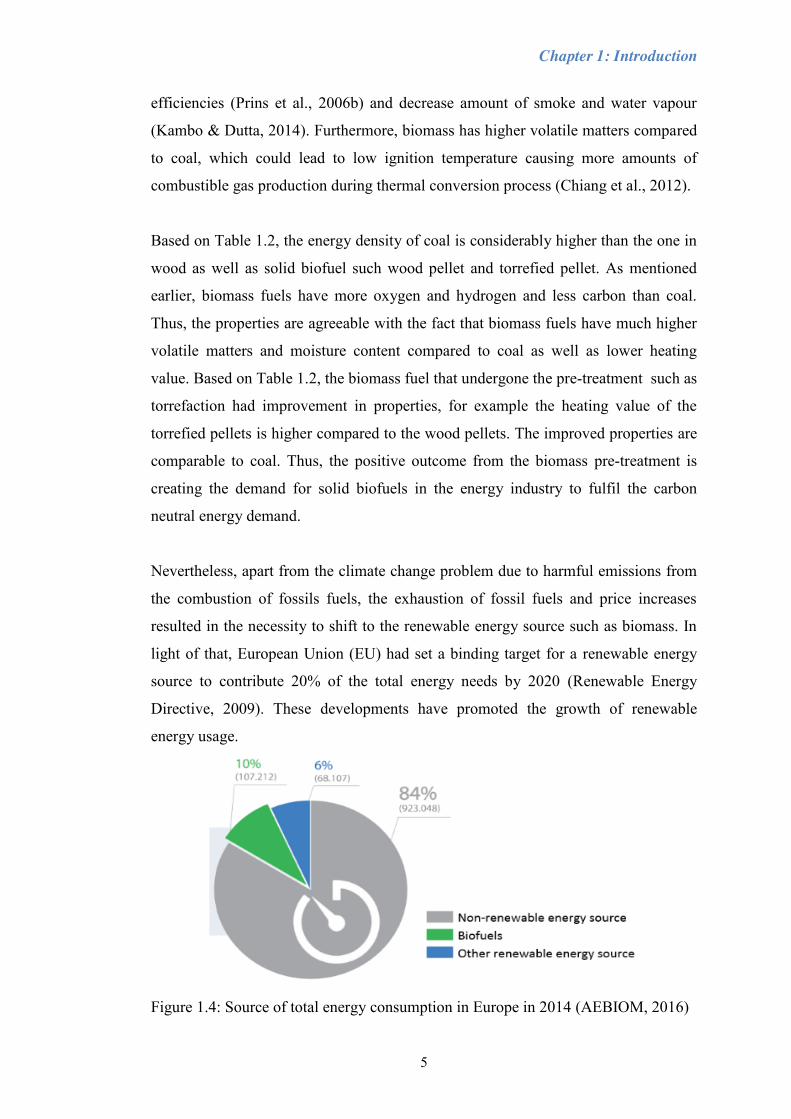
Nevertheless, apart from the climate change problem due to harmful emissions from
the combustion of fossils fuels, the exhaustion of fossil fuels and price increases
resulted in the necessity to shift to the renewable energy source such as biomass. In
light of that, European Union (EU) had set a binding target for a renewable energy
source to contribute 20% of the total energy needs by 2020 (Renewable Energy
Directive, 2009). These developments have promoted the growth of renewable
energy usage.
Figure 1.4: Source of total energy consumption in Europe in 2014 (AEBIOM, 2016)

Table 1.2: Properties of biomass fuels and coal (Nunes et al., 20141; Koppejan et al., 20122)
Wood2 Wood
pellets2
Wood chips1 Torrefied
pellets2
Bituminous
Coal1
Coal2 Charcoal2
Moisture (%) 30-45 70-10 30-60 1-5 5-10 10-15 1-5
Fixed carbon (% db) 20-25 20-25 20-25 28-35 340-780 50-55 50-55
Volatile matter (% db) 70-75 70-75 70-75 55-65 - 15-30 10-12
Lower heating value (MJ/kg) 9-12 15-18 6-13 20-24 >25 23-28 30-32
Bulk density (kg/m3) 200-250 550-750 250-400 750-850 800-10000 800-850 ~200
Energy density (GJ/m3) 2.0-3.0 7.5-10.4 2.5-3.2 15-18.7 20-25 18.4-23.8 6-6.4
Biological degradation Yes Yes Yes No No No No
Hygroscopic properties Hydrophilic Hydrophilic Hydrophilic Hydrophobic Hydrophobic Hydrophobic Hydrophobic
Dust Average Limited Average Limited Limited Limited Limited
6

Chapter 1:Introduction
7
Based on Figure 1.4, 16% of the energy consumption originated from the renewable
sources (biofuels and other renewable energy sources) in 2014. That current status is
a good sign showing that the target set in the Renewable Energy Directive, (2009) is
achievable. Therefore, a new target had been set by the European Union in the 2030
Energy Policy, where the final energy consumption in the European Union at least
27% by 2030 (Energy,2017).
In Figure 1.4, biofuels refer to liquid fuels produced from biomass such as biodiesel
and bioethanol. While other renewable sources include the wind, hydro, solar,
geothermal and bioenergy. Therefore, the energy produced from biomass sources is
called bioenergy. Bioenergy is widely used in heating and cooling, power generation
as well as transport application. Due to the high availability as well as the
consistency of supply around the world, the biomass is an excellent material
compared to other sources. The growth of biomass trade especially the trade of
pellets and biofuels is moving towards a more globally traded commodity. In Europe,
wood pellet consumption reached 20.3 million tonnes that represent 6 % of total
solid biomass usage (AEBIOM, 2016).
However, the direct use of lignocellulosic biomass is not possible for energy
conversion due to several issues such as handling. Therefore, the lignocellulosic
biomass needs to be transformed into fuel in solid, liquid or gas form using various
pre-treatment technologies. Wood pellet is one of the solid biofuels that can be
produced from the pre-treatment of lignocellulosic biomass. Wood pellet is used with
coal-fired boilers since the handling properties of the wood pellets are comparable to
coal.
Many power plants such as Drax and Fiddlers Ferry power stations in the United
Kingdom as well as Avedøre plant in Denmark that co-firing of coal and wood
pellets as an initiative to potentially reduce the carbon dioxide emissions (Henderson,
2015). In addition to that, the government of Netherlands also has the intention to
mandate co-firing of biomass at all existing coal-fired power plants (Verhoest &
Ryckmans, 2012). Besides co-firing, the use of biomass as the main fuels also been
practised worldwide.

Chapter 1:Introduction
8
The increase in demand of the lignocellulosic biomass fuels in the energy sector can
be witnessed in the growth of global wood pellet production between 2010 to 2014,
which increased from 16 to 25 million tonnes as reported by Matthews, (2015). This
growth could be triggered by the introduction of several European biomass standards
such as EN 14961, which is for classification and specification of biomass in
2011(Audigane et al., 2012). The lignocellulosic biomass has received increasing
attention especially in the utilisation of the thermally treated products that enhanced
its physical and thermal properties. The thermally treated products have properties
that are better or equivalent to the coal. Gasification, combustion, pyrolysis and
torrefaction are among widely used thermochemical applications that had been
proven to upgrade lignocellulosic biomass quality. Besides that, pelletization also has
improved the quality of the biomass fuels as well as eases the handling and
transportation of the material.
However, similar to coal, biomass fuels are also prone to self-heating due to
chemical oxidation when reacting with oxygen in the air during its storage period.
The self-ignition can happen during storage if the heat generated by the chemical
oxidation starts to accumulate and does not dissipate to the surrounding of the stored
biomass fuels. The fire triggered by self-heating of stored bulk biomass fuels causes
serious safety issues as it is difficult to detect when it started to occur. Besides the
chemical oxidation, heating due to the microbiological activities can also happen in
biomass fuels due to its properties such as hydrophilic nature and high moisture
content.
The accidental fires caused by dust explosion and self-ignition can cause hazards to
workers, storage structure as well as to the economic loss (Guo, 2013a). Serious
injuries and sometimes fatalities are also witnessed in such fires. In addition to those,
the undesired fires can cause emission of carbon dioxide and toxic gases such as
carbon monoxide through incomplete combustion (Ferrero et al. 2009). Thus,
prevention of the self-ignition is economical and safety-relevant issues that need to
be studied and understood for accident prevention in the future.
Chapter 1:Introduction
9
There are many recorded accidental fires associated with the self-heating of biomass.
For example, an estimated average of 14070 fires per year between 2005-2009 had
been reported caused by self-ignition or chemical reaction in United State, with 20%
of fires in storage properties were ignited by biomass material such as crops (Evarts,
2011). Data of major accidents associated with biomass energy production had been
presented by Casson Moreno & Cozzani (2015), where 30% of the fires recorded
was started by self-ignition of sawdust in stockpiles.
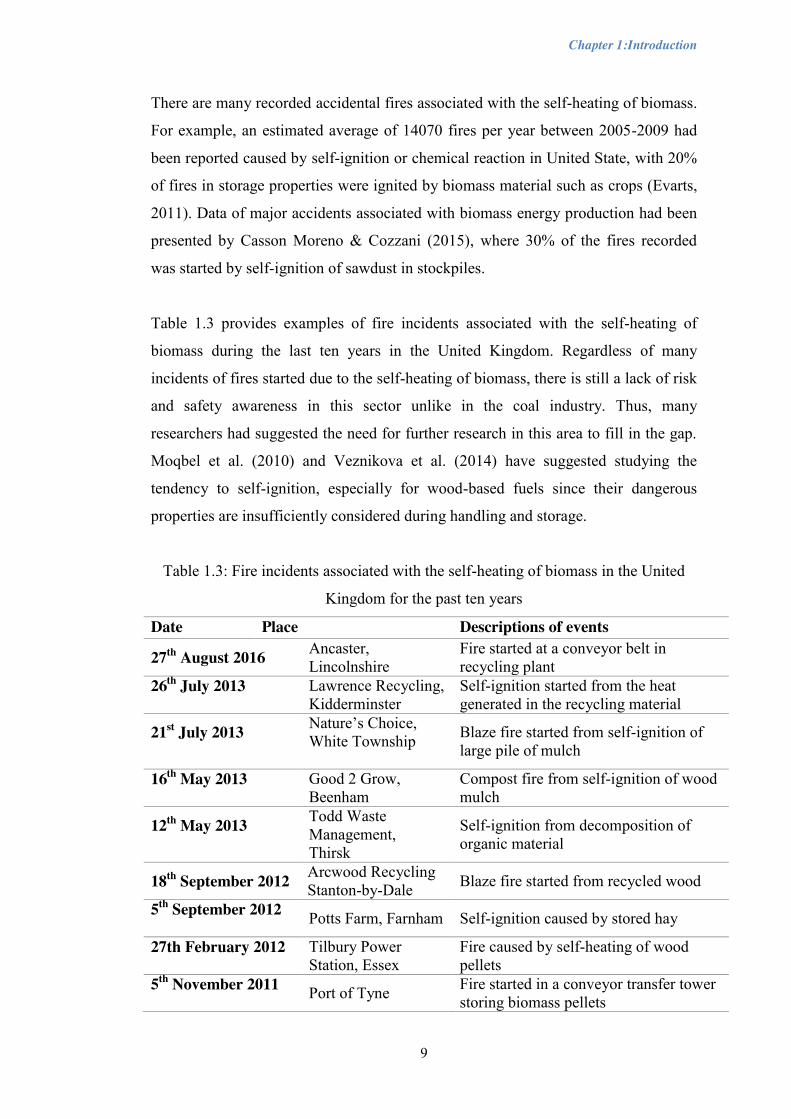
Table 1.3 provides examples of fire incidents associated with the self-heating of
biomass during the last ten years in the United Kingdom. Regardless of many
incidents of fires started due to the self-heating of biomass, there is still a lack of risk
and safety awareness in this sector unlike in the coal industry. Thus, many
researchers had suggested the need for further research in this area to fill in the gap.
Moqbel et al. (2010) and Veznikova et al. (2014) have suggested studying the
tendency to self-ignition, especially for wood-based fuels since their dangerous
properties are insufficiently considered during handling and storage.
Table 1.3: Fire incidents associated with the self-heating of biomass in the United
Kingdom for the past ten years
Date Place Descriptions of events
27th August 2016 Ancaster, Lincolnshire
Fire started at a conveyor belt in recycling plant
26th July 2013
Lawrence Recycling, Kidderminster
Self-ignition started from the heat generated in the recycling material
21st July 2013
Nature’s Choice, White Township
Blaze fire started from self-ignition of large pile of mulch
16th May 2013
Good 2 Grow, Beenham
Compost fire from self-ignition of wood mulch
12th May 2013
Todd Waste Management, Thirsk
Self-ignition from decomposition of organic material
18th September 2012 Arcwood Recycling Stanton-by-Dale Blaze fire started from recycled wood
5th September 2012 Potts Farm, Farnham Self-ignition caused by stored hay
27th February 2012
Tilbury Power Station, Essex
Fire caused by self-heating of wood pellets
5th November 2011 Port of Tyne Fire started in a conveyor transfer tower
storing biomass pellets

Chapter 1:Introduction
10
However, the main cause of the self-ignition of biomass fuel is so unique from one to
another. It varies according to types of biomass and their physical, chemical and
biological properties. Therefore, due to its wide possibilities of the cause, the fire is
hard to predict and mitigate. However, the storage conditions of the biomass can be
monitored and always have a high correlation with the heat generated by the system
during the storage period. The heat generated due to self-heating depends on many
parameters which can be categorised as a controllable, uncontrollable and
conditionally controllable parameter (Arisoy & Akgun, 2000). Therefore, the focus
of this study should always be on the approaches to prevent biomass fuels self-
combustion during the storage period, where the storage conditions are considered as
a controllable parameter. Thus, the critical storage conditions can be predicted to
avoid the self-ignition.
Many studies have been done to predict the behaviour of the biomass material that
has a tendency to self-heat in concealed storage facilities as a silo (Larsson et al.,
2012; Malow & Krause, 2008; Guo 2013; Ramírez et al., 2010; Carrera-Rodríguez et
al., 2011). However, there is limited research done on the tendency of self-heating of
biomass fuels in open storage area. Over the past 20 years, many studies were done
to investigate the self-heating behaviour, which measured the ignition kinetic
parameters and the critical conditions that can lead to self-ignition (Chen et al.,
2013). Hence, this study focuses on predicting self-heating process due to chemical
oxidation by considering its kinetic parameters and the critical storage condition of
the bulk biomass fuels in indoor open storage piles.
A recent positive development for replacement of coal by a sustainable source in the
energy sector on a global scale had driven biomass fuel industry to produce biomass
fuels that have similar properties to coal. Thus, many researchers had come out with
methods to improve the energy density of biomass fuels, which will give added
commercial value to the material produced. Among others, torrefaction is one of the
proven methods to upgrade the quality of the biomass fuels. Besides that, the
rationale behind the torrefaction process on wood pellets is to achieve a final product
that is superior to the conventional wood pellets.
Chapter 1:Introduction
11
This study is focused on the self-heating behaviour of those two completely different
materials, which are conventional wood pellets and thermally treated wood sample
using microwave torrefaction technology. Ceballos et al. (2015) had pointed out
several gaps in the study of torrefied biomass, which include the need to understand
its self-heating propensity in stockpiles. Hence, this thesis is aimed to understand the
self-heating behaviour of such biomass based on their physical and thermal
properties that may influence the self-heating propensity in the stockpile. The study
is carried out by simulating the self-heating behaviour of bulk biomass fuels based
on experimentally determine kinetic properties. Several simulations were performed
using COMSOL Multiphysics® software to obtain a deeper understanding of the
effect of the controllable parameters on the self-heating behaviour of biomass fuels
in piles during storage.
1.2 Approach of the research
The focus of this study is to examine the self-heating behaviour of the biomass fuels
that undergo microwave torrefaction process. Microwave torrefied biomass has
identifiable improvement in the energy density and the thermal kinetics parameters
of the biomass; therefore it was used for this study. This study investigates the
parameters affecting the self-heating behaviour of biomass storage. The findings
from this study will particularly highlight the distinct changes of material properties
before and after the microwave torrefaction process. It offers the opportunity to
compare the reactivity of the biomass that undergoes the microwave torrefaction
process and the non-torrefied biomass.
Furthermore, many studies on conventional torrefied biomass had reported various
reaction conditions such as torrefaction temperature; inert gas and reaction time can
lead to various solid, liquid and gaseous products. In addition to that, the higher
torrefaction temperature or longer residence time resulted in torrefaction removes
moisture, volatiles and degrades parts of its carbohydrate fraction, resulting in a
product with higher energy density, better grindability and less moisture absorption
(Nunes et al., 2013; Shang, 2012; Stelt et al., 2011).
Chapter 1:Introduction
12
Therefore, in this study the variation of process conditions for producing the
torrefied sample was neglected and only torrefied sample produced using microwave
process was considered in the self-heating propensity study. The study is focused on
the variability of storage conditions that reflected the variable reactivity of both
samples. There is a growing needs to determine whether the microwave torrefaction
will increase the reactivity of the biomass and does the torrefied biomass needs to be
handled in the same way as material that prone to self-heating.
This work also has no intention on examining which process condition that will
contribute to a biomass fuel with higher reactivity by comparing the sample produces
using conventional torrefaction method. Therefore, in this work, the comparison
between the non-torrefied sample and microwave torrefied samples were adequate.
The experimental work carried our to determine the chemical and physical
properties, kinetic parameters as well as to examine the heating behaviour of both
fuels. Information gathered from the experimental works is used in the simulation of
the heating behaviour of the fuels in stockpiles.
The properties of the samples play a substantial role in the reactivity towards
chemical reaction in air. Therefore, the main parameters associated with the self-
heating phenomena were identified by the thermogravimetric analysis. The
composition of moisture content, fixed carbon, volatile matters as well as ash is
acquired from the proximate analysis using thermogravimetric analysis. While the
composition of carbon, hydrogen, nitrogen and oxygen are obtained from the
ultimate analysis.
Furthermore, the characteristic temperature observed from the thermogravimetric
analysis can be used to measure the tendency of the material to undergo a self-
heating process. Also, thermogravimetric analysis was done to obtain information of
the reactivity of the samples as well as their kinetics in the air and the inert
environment. Mass change measurements over temperature provide key information
on the decomposition behaviour in the air and the inert environment.
Additionally, to examine the heating behaviour of the sample in bulk size, further
analyses on the self-heating behaviour of the samples in a larger scale is in an oven-
Chapter 1:Introduction
13
controlled environment. The bulk oven test is significant to observe the temperature
profile within the bulk sample in an oxidative environment at various oven
temperature and bulk size. Besides that, the initial heating temperatures used for the
non-torrefied sample were very similar to conventional torrefaction process which
are between 180oC to 200oC, therefore, it can be considered that the torrefaction
process was included in the oven test.
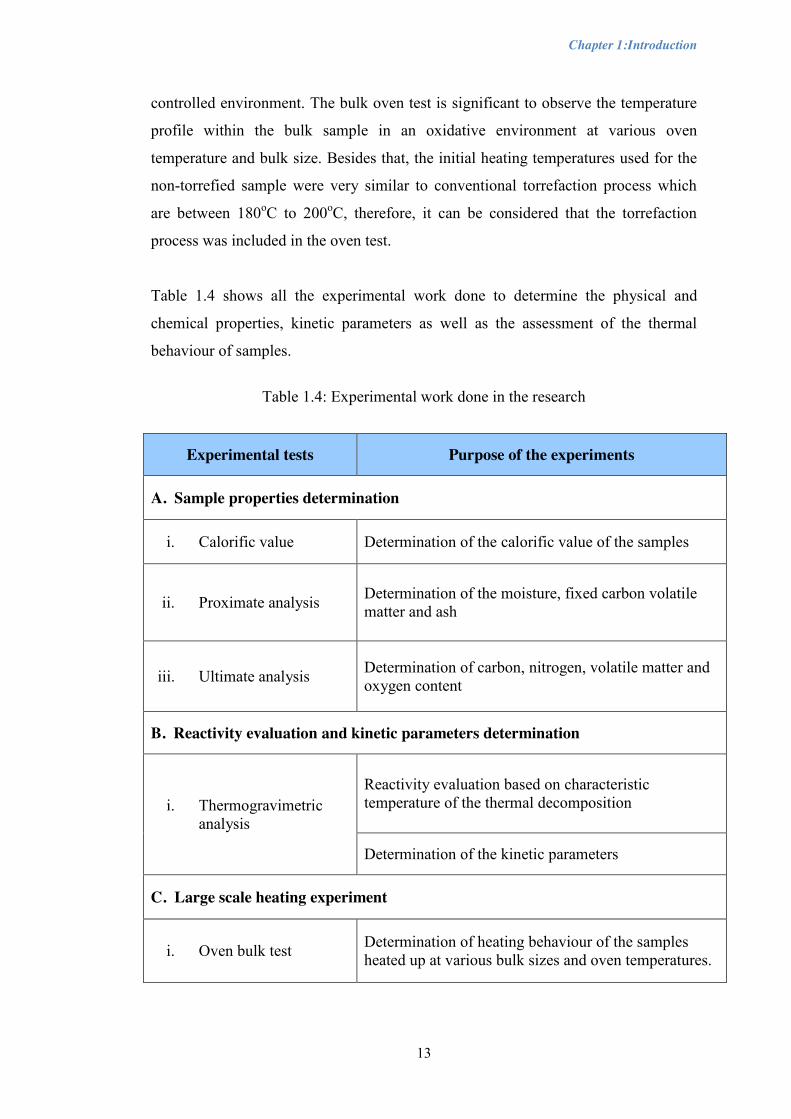
Table 1.4 shows all the experimental work done to determine the physical and
chemical properties, kinetic parameters as well as the assessment of the thermal
behaviour of samples.
Table 1.4: Experimental work done in the research
Experimental tests Purpose of the experiments
A. Sample properties determination
i. Calorific value Determination of the calorific value of the samples
ii. Proximate analysis Determination of the moisture, fixed carbon volatile matter and ash
iii. Ultimate analysis Determination of carbon, nitrogen, volatile matter and oxygen content
B. Reactivity evaluation and kinetic parameters determination
i. Thermogravimetric analysis
Reactivity evaluation based on characteristic temperature of the thermal decomposition
Determination of the kinetic parameters
C. Large scale heating experiment
i. Oven bulk test Determination of heating behaviour of the samples heated up at various bulk sizes and oven temperatures.
Chapter 1:Introduction
14
1.3 Aim, Objectives and novel contribution
1.3.1 Aim and Objectives
This study is aimed at investigating the heating behaviour of microwave torrefied
samples and non-torrefied sample to predict the self-heating of the fuels in
stockpiles. The objectives of this research are:
(i) to determine the effect of physical and chemical properties of biomass
fuels towards self-heating propensity using proximate and ultimate
analysis;
(ii) to examine the thermal decomposition behaviour of fuels samples
properties using thermogravimetric analysis;
(iii) to analyse the kinetic parameters of thermal decomposition of biomass
fuels at a low heating rate;
(iv) to investigate the effect of bulk size and oven temperature on the heating
behaviour of the biomass samples in oven bulk test;
(v) to develop a numerical model that can predict the effect of piles height
and ambient temperature on self-heating behaviour of biomass samples;
and
(vi) to validate the numerical model with the results from oven bulk test
1.3.2 Novelty of the research
The novel contribution of this research is the determination of the thermal behaviour
of the microwave torrefied sample in comparison to the non-torrefied sample.
Although a lot of researchers had been devoted to investigating the self-heating
behaviour of biomass fuels, there is still very limited data on the self-heating
behaviour of torrefied biomass fuels. In addition to that, to the best of the author’s
knowledge, the study on self-heating behaviour of the sample prepared using
microwave torrefaction has not been reported in any research, therefore requires
further research. Previous studies on torrefied biomass fuels provided evidence that,
the biomass fuel produced from microwave torrefaction increased the reactivity of
the biomass. Therefore, additional precaution steps must be taken during storage and
handling phase. The novel aspect of this research also established from the validation
of the numerical model used in the simulations against the experimental data. In

Chapter 1:Introduction
15
brief, the findings from this research will help to examine the self-heating propensity
of the biomass fuels produced using microwave torrefaction process.
1.4 Layout of the thesis
Chapter 2 presents the literature review on biomass usage as an alternative energy
source and the fundamental theories of self-heating behaviour of the biomass fuels
Chapter 3 describes experimental method for characterisation of the samples used in
this work, which include proximate and ultimate analysis
Chapter 4 covers the experimental work to evaluate the reactivity of the samples as
well as their kinetic parameters. Also, the thermal decomposition behaviour of both
microwaves torrefied and non-torrefied samples are presented.
Chapter 5 presents the bulk tests to evaluate the reactivity of the samples in a larger
scale. The relationships between the oven temperature and bulk size towards
induction time are discussed.
Chapter 6 examines the effects of geometry of the piles and the critical ambient
temperature on the self-heating propensity using numerical simulation.
Chapter 7 summarises all the experimental and simulation work in this thesis.
Conclusions and recommendations for future work are presented.

Chapter 2:Literature review
16
Chapter 2 Literature review
This chapter presents a literature review of current research on fundamental behind
the upgrading of lignocellulosic biomass using thermal treatment process for energy
production and the self-heating behaviour of the biomass fuels in comparison to coal.
This chapter also reviews the experimental work on self-heating evaluation.
2.1 Energy recovery from biomass
There are many alternative technologies available today that are able to recover the
energy from biomass by converting biomass into solid fuel. However, the
characteristic such as calorific value, moisture content as well as the amount of ash is
unique for each biomass due to their differences in composition. Thus, it requires
suitable conversion technology to convert the biomass into solid fuel efficiently.
There are two major technical approaches to convert lignocellulosic biomass into
energy, which include thermochemical conversion and biochemical conversion.
Thermochemical processes that widely used for biomass conversion process are
pyrolysis, gasification and combustion, to produce heat or energy carrier such as
charcoal and bio-oil. On the other hand, the biochemical conversion involved
processes such as anaerobic digestion, alcoholic fermentation and aerobic
biodegradation includes the process of a microorganism to break down the biomass
into biomass-based energy fuels (Saxena, Adhikari, & Goyal, 2009; Balat, 2006).
Figure 2.1 shows the possible route for thermochemical conversion of lignocellulosic
biomass, while Figure 2.2 shows the possible route for the biochemical conversion.
According to Chiang et al. (2012), between these two types of technologies,
thermochemical conversion has higher conversion efficiency with the better ability to
break the organic compounds as well as shorter reaction time. Thus, thermochemical
conversion is a favourable path for biomass concerning those advantages. The prior
knowledge of the biomass such as chemical composition is necessary for choosing
Chapter 2:Literature review
17
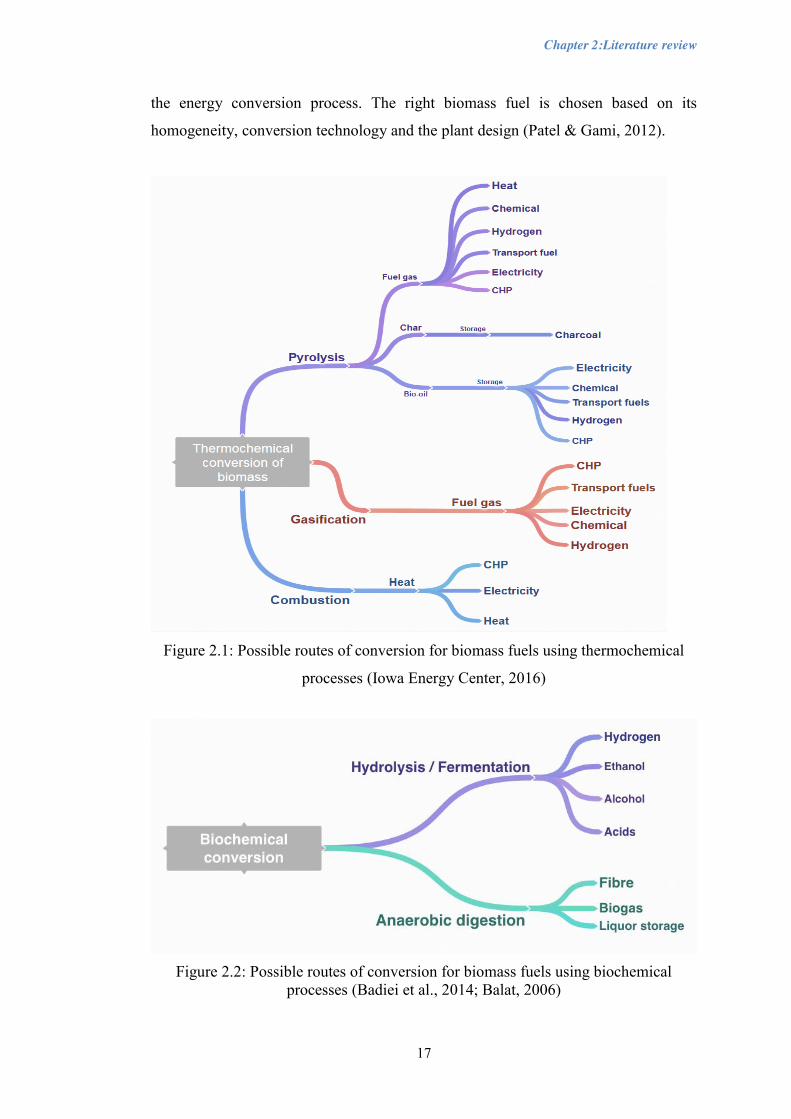
the energy conversion process. The right biomass fuel is chosen based on its
homogeneity, conversion technology and the plant design (Patel & Gami, 2012).
Figure 2.1: Possible routes of conversion for biomass fuels using thermochemical
processes (Iowa Energy Center, 2016)
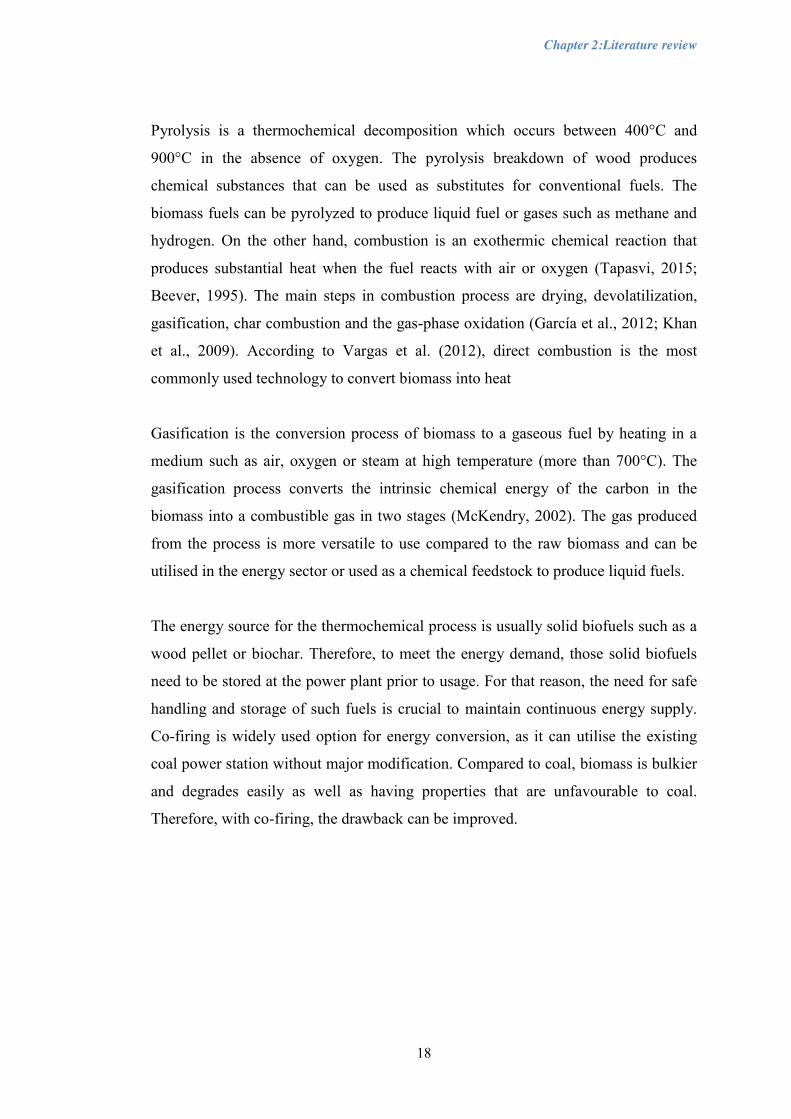
Figure 2.2: Possible routes of conversion for biomass fuels using biochemical processes (Badiei et al., 2014; Balat, 2006)
Chapter 2:Literature review
18
Pyrolysis is a thermochemical decomposition which occurs between 400°C and
900°C in the absence of oxygen. The pyrolysis breakdown of wood produces
chemical substances that can be used as substitutes for conventional fuels. The
biomass fuels can be pyrolyzed to produce liquid fuel or gases such as methane and
hydrogen. On the other hand, combustion is an exothermic chemical reaction that
produces substantial heat when the fuel reacts with air or oxygen (Tapasvi, 2015;
Beever, 1995). The main steps in combustion process are drying, devolatilization,
gasification, char combustion and the gas-phase oxidation (García et al., 2012; Khan
et al., 2009). According to Vargas et al. (2012), direct combustion is the most
commonly used technology to convert biomass into heat
Gasification is the conversion process of biomass to a gaseous fuel by heating in a
medium such as air, oxygen or steam at high temperature (more than 700°C). The
gasification process converts the intrinsic chemical energy of the carbon in the
biomass into a combustible gas in two stages (McKendry, 2002). The gas produced
from the process is more versatile to use compared to the raw biomass and can be
utilised in the energy sector or used as a chemical feedstock to produce liquid fuels.
The energy source for the thermochemical process is usually solid biofuels such as a
wood pellet or biochar. Therefore, to meet the energy demand, those solid biofuels
need to be stored at the power plant prior to usage. For that reason, the need for safe
handling and storage of such fuels is crucial to maintain continuous energy supply.
Co-firing is widely used option for energy conversion, as it can utilise the existing
coal power station without major modification. Compared to coal, biomass is bulkier
and degrades easily as well as having properties that are unfavourable to coal.
Therefore, with co-firing, the drawback can be improved.

Chapter 2:Literature review
19
2.1.1 Issues of biomass fuels as energy source
Several weaknesses of biomass need to be taken into consideration before using it as
an energy source in the thermochemical process. Therefore, efficient use of the raw
biomass can be achieved by transforming the biomass into fuels in solid, liquid and
gaseous form via various pre-treatment processes.
Several concerns that had been reported associated with biomass are high moisture
content, non-uniform physical properties, low calorific value, low energy density,
structural heterogeneity, hydrophilic nature and low bulk density (Eseyin, Steele, &
Jr., 2015; Nhuchhen, Basu, & Acharya, 2014; Sadaka et al., 2014; Järvinen & Agar,
2014; van der Stelt et al., 2011). In addition to that, the lignocellulosic biomass is
reflected as thermally unstable by Prins et al. (2006a) even though having a low
nitrogen, sulphur and ash content.
Biomass also inclines to be less dense than coal resulting in lower energy density.
Low energy density is an unappealing aspect as it implies high transportation cost
per energy unit as well as more storage area that leads to higher logistic cost (Nunes
et al., 2014). Therefore, normally biomass fuel needs to undergo densification or
palletization to increase its energy density. The ash content in biomass is also much
higher than coal. The higher ash content reflected as a significant challenge for
biomass combustion, due to the ash related problem during combustion such as
slagging and fouling (Liu & Han, 2015; Deutmeyer et al., 2012; Darvell et al., 2010;
Ciolkosz, 2010).
The latest review on the disadvantages of biomass compared to coal can be found in
(Vassilev et al., 2015), where they pointed out that the despite the disadvantages of
biomass in biofuel and biochemical application, the main environmental, economic
and social benefits seem to counterbalance the shortcomings. Besides that, the
drawbacks mentioned earlier can be resolved through the pre-treatment process of
biomass (Chen & Kuo, 2011).

Chapter 2:Literature review
20
2.2 Pre-treatment methods for lignocellulosic biomass
The positive growth of sustainable energy sources such as biomass had driven
biomass fuels industry to produce biomass fuels that have similar properties to coal.
For example, as shown in Table 1.2, the energy density of wood is between 2.0 to 3.0
GJ/M3 while the energy density of coal is between 18.4 to 23.8 GJ/M3. These figures
show that wood has a relatively lower energy density compared to coal. Therefore a
pre-treatment is needed for wood to achieve a higher energy density that is
comparable to coal.
Thus, a pre-treatment process is needed to upgrade the quality of the lignocellulosic
biomass before being used as fuel in the energy sector. Pre-treatment is necessary for
lignocellulosic biomass utilisation to modify the size, shape, and density of the
biomass to match fuel specification or the thermochemical process. The upgraded
lignocellulosic biomass had been proven suitable to be used for the co-firing with
coal in the existing coal-fired power plant, without requiring major modifications to
the plant (Liu et al., 2016). Besides that, it is essential to upgrade the lignocellulosic
biomass fuel prior utilisation to ease its handling and transportation as well. In
summary, the aims of lignocellulosic biomass pre-treatment had been recognised by
Tapasvi (2015) to homogenise the biomass feedstock, increase the biomass energy
density and improve biomass storage stability.
According to Demirbas (2004), the conversion of biomass via pre-treatment process
is to transform a raw material, which is initially hard to handle, bulky and of low
energy concentration, into a fuel with upgraded physicochemical characteristics that
allows cost-effective storage and handling. Thus, pre-treatment for utilisation of the
biomass for energy conversion is needed to address the shortcoming of the raw
biomass. Harmsen et al. (2010) stated that the criteria lead to an improvement of
lignocellulosic material after pre-treatment are (i) increasing the surface area and
porosity, (ii) alteration of lignin structure, (iii) removal of lignin and/or
hemicellulose, (iv) partial depolymerization of hemicellulose, and (v) reducing the
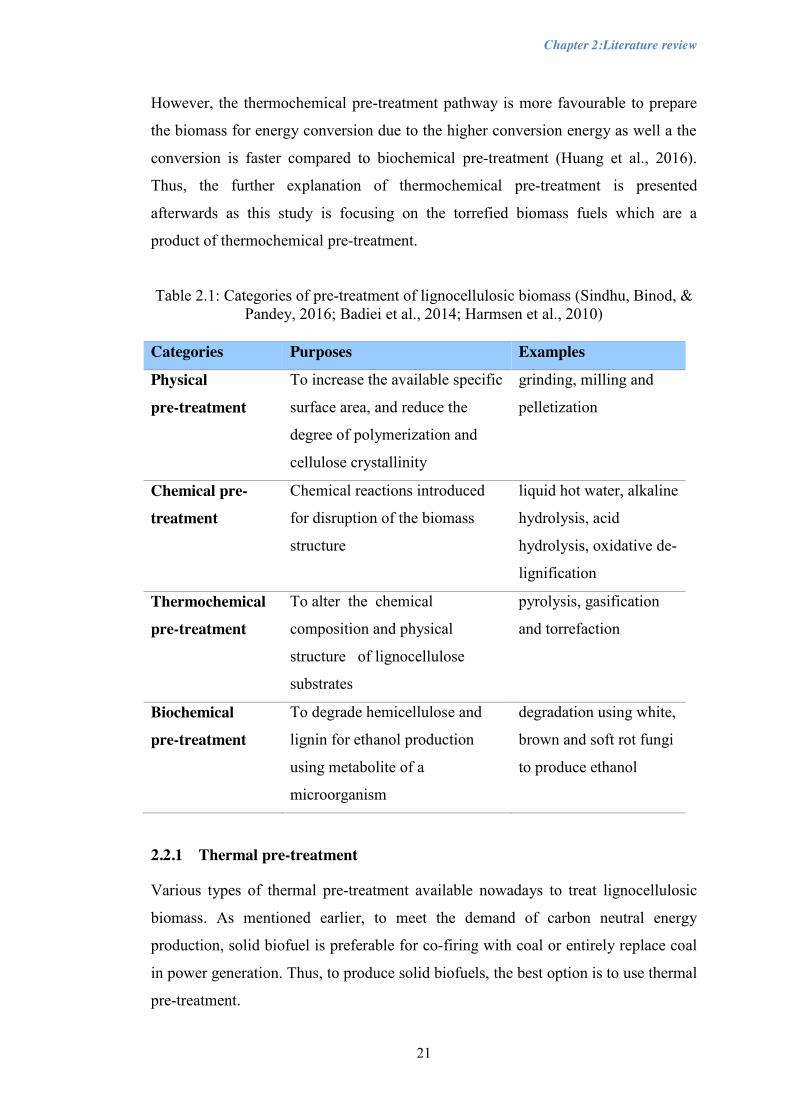
crystallinity of cellulose. Table 2.1 summarised the purposes of each pre-treatment
along with the examples.
Chapter 2:Literature review
21
However, the thermochemical pre-treatment pathway is more favourable to prepare
the biomass for energy conversion due to the higher conversion energy as well a the
conversion is faster compared to biochemical pre-treatment (Huang et al., 2016).
Thus, the further explanation of thermochemical pre-treatment is presented
afterwards as this study is focusing on the torrefied biomass fuels which are a
product of thermochemical pre-treatment.
Table 2.1: Categories of pre-treatment of lignocellulosic biomass (Sindhu, Binod, & Pandey, 2016; Badiei et al., 2014; Harmsen et al., 2010)
Categories Purposes Examples
Physical
pre-treatment
To increase the available specific
surface area, and reduce the
degree of polymerization and
cellulose crystallinity
grinding, milling and
pelletization
Chemical pre-
treatment
Chemical reactions introduced
for disruption of the biomass
structure
liquid hot water, alkaline
hydrolysis, acid
hydrolysis, oxidative de-
lignification
Thermochemical
pre-treatment
To alter the chemical
composition and physical
structure of lignocellulose
substrates
pyrolysis, gasification
and torrefaction
Biochemical
pre-treatment
To degrade hemicellulose and
lignin for ethanol production
using metabolite of a
microorganism
degradation using white,
brown and soft rot fungi
to produce ethanol
2.2.1 Thermal pre-treatment
Various types of thermal pre-treatment available nowadays to treat lignocellulosic
biomass. As mentioned earlier, to meet the demand of carbon neutral energy
production, solid biofuel is preferable for co-firing with coal or entirely replace coal
in power generation. Thus, to produce solid biofuels, the best option is to use thermal
pre-treatment.
Chapter 2:Literature review
22
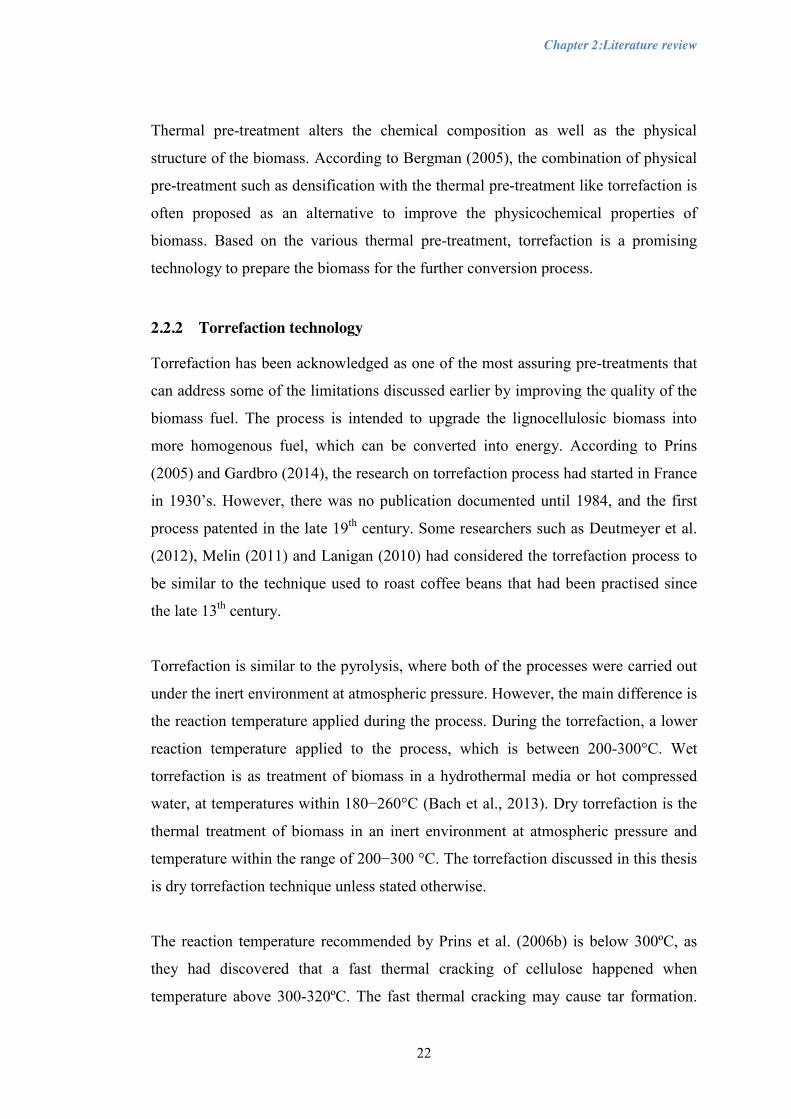
Thermal pre-treatment alters the chemical composition as well as the physical
structure of the biomass. According to Bergman (2005), the combination of physical
pre-treatment such as densification with the thermal pre-treatment like torrefaction is
often proposed as an alternative to improve the physicochemical properties of
biomass. Based on the various thermal pre-treatment, torrefaction is a promising
technology to prepare the biomass for the further conversion process.
2.2.2 Torrefaction technology
Torrefaction has been acknowledged as one of the most assuring pre-treatments that
can address some of the limitations discussed earlier by improving the quality of the
biomass fuel. The process is intended to upgrade the lignocellulosic biomass into
more homogenous fuel, which can be converted into energy. According to Prins
(2005) and Gardbro (2014), the research on torrefaction process had started in France
in 1930’s. However, there was no publication documented until 1984, and the first
process patented in the late 19th century. Some researchers such as Deutmeyer et al.
(2012), Melin (2011) and Lanigan (2010) had considered the torrefaction process to
be similar to the technique used to roast coffee beans that had been practised since
the late 13th century.
Torrefaction is similar to the pyrolysis, where both of the processes were carried out
under the inert environment at atmospheric pressure. However, the main difference is
the reaction temperature applied during the process. During the torrefaction, a lower
reaction temperature applied to the process, which is between 200-300°C. Wet
torrefaction is as treatment of biomass in a hydrothermal media or hot compressed
water, at temperatures within 180−260°C (Bach et al., 2013). Dry torrefaction is the
thermal treatment of biomass in an inert environment at atmospheric pressure and
temperature within the range of 200−300 °C. The torrefaction discussed in this thesis
is dry torrefaction technique unless stated otherwise.
The reaction temperature recommended by Prins et al. (2006b) is below 300ºC, as
they had discovered that a fast thermal cracking of cellulose happened when
temperature above 300-320ºC. The fast thermal cracking may cause tar formation.
Chapter 2:Literature review
23
Rousset et al. (2011) had divided the torrefaction process into two categories, which
are light torrefaction (reaction temperature less than 240ºC) and severe torrefaction
(reaction temperature above 270ºC). Thus, torrefaction sometimes referred as mild or
partial pyrolysis.
Besides the reaction temperature, another distinct difference between torrefaction
and pyrolysis is the maximisation of the solid yield, where the biomass weight
reduced while the energy content is sustained. Thus, the maximisation of the solid
yield where the biomass is converted to a carbon-rich solid product is the major
motivation of torrefaction. The high solid yield can be achieved by removing the
water and carbon dioxide from the lignocellulosic biomass, through the
decomposition of biomass at the low heating rate, which is less than 50ºC/min
(Wang et al., 2012; Bergman & Kiel, 2005). As a result, the main objective of
torrefaction is to remove oxygen from the raw lignocellulosic biomass. Therefore the
product from torrefaction process is a solid biomass with a significant lower O/C
ratio compared to its raw material (van der Stelt et al., 2011) and eventually
increased its energy density.
2.2.3 Conventional torrefaction
The components in biomass play important roles in torrefaction process due to the
different temperature effect on each component. The study of temperature ranges for
peak thermal degradation of cellulose, hemicellulose and lignin, did by several
researchers can be found in Nhuchhen et al. (2014). The temperature range presented
had confirmed that hemicellulose degraded at a lower temperature range compared to
cellulose, whereas lignin degrades at wider temperature range. Thus, the reactivity of
the hemicellulose in biomass is the main attribute to the mechanism of torrefaction at
the temperature range between 200ºC-300ºC. However, in that temperature range,
cellulose and lignin are found to be less reactive.
According to Prins (2005), the kinetics of torrefaction reactions in temperature
between 200ºC to 300ºC can be expressed by a two-step mechanism. While the first
step is represented by the hemicellulose decomposition follows by the cellulose
decomposition. The loss of bound moisture as well as thermal degradation to form

Chapter 2:Literature review
24
volatile products lead to reduced mass yield of torrefaction process (Prins et al.
2006a). Based on their research on torrefied willow, a large fraction of biomass solid
is yield during the first step, which around 70-88% compared to only 41% for the
second step. According to Ben & Ragauskas (2012), despite the biomass source,
significant decomposition of hemicellulose happened at 240ºC, which explains the
chosen reaction temperature for the torrefaction process that is below 300°C, where
the objective of the process achieved.
Subsequently, biomass material with a high hemicellulose content tends to have less
solid product yield compare to the one with lower hemicellulose content (Nhuchhen
et al. 2014). They also speculate that, within the torrefaction temperature range of
200-300ºC, the cellulose degradation might have enhanced by the water vapour and
acids released from the hemicellulose degradation. As a result, the solid product from
the torrefaction process has more lignin content, which is more stable component
than hemicellulose and cellulose.
Torrefaction process leads to devolatilization of the cell wall constituents, which will
cause enlargement of the lumina and create more available space for free water to
occupy (Kymäläinen et al., 2015). Hence, torrefaction had been known for its
advantages to improve the energy density and shelf life of the biomass. However,
due to the incomplete devolatilization during torrefaction, torrefied biomass
produced contained some volatile matters. In study done by Tumuluru et al. (2011)
they had listed eight (8) parameters that influence the torrefaction process, namely
(a) reaction temperature, (b) heating rate, (c) absence of oxygen, (d) residence time,
(e) ambient pressure, (f) flexible feedstock, (g) feedstock moisture and (h) feedstock
particles size. According to van der Stelt et al. (2011) torrefaction process can be
divided into stages of the temperature-time as presented in Figure 2.3:
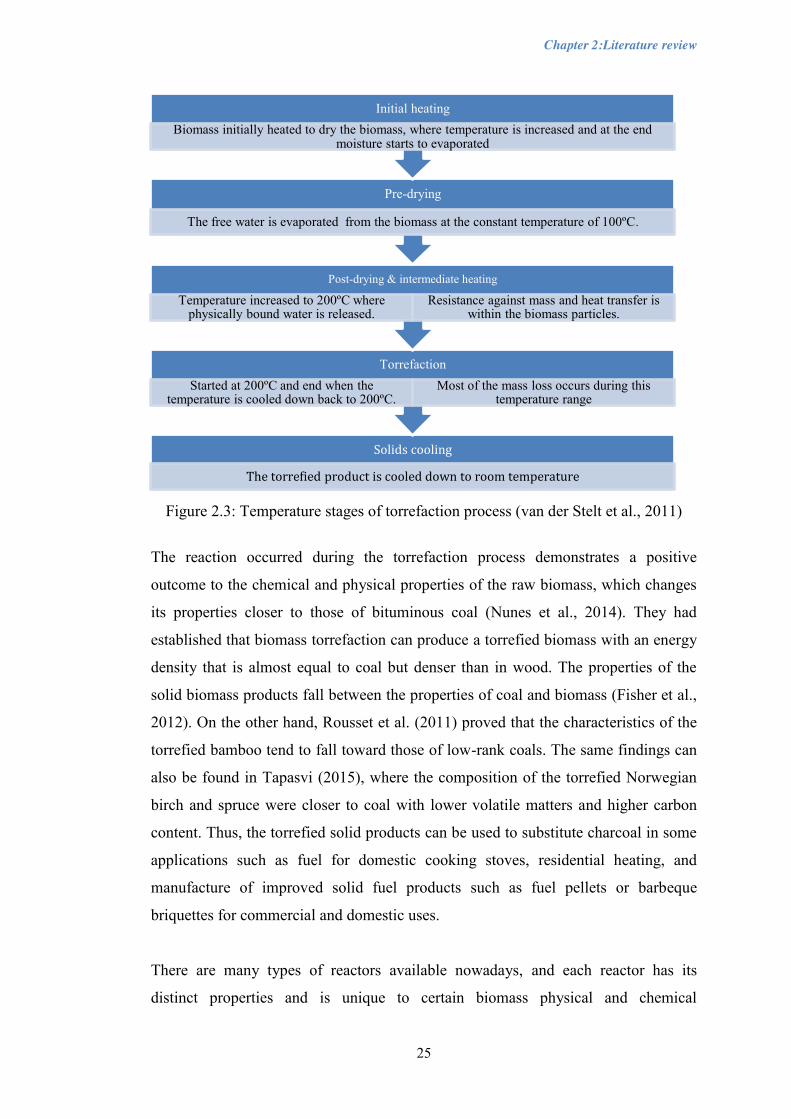
Chapter 2:Literature review
25
Figure 2.3: Temperature stages of torrefaction process (van der Stelt et al., 2011)
The reaction occurred during the torrefaction process demonstrates a positive
outcome to the chemical and physical properties of the raw biomass, which changes
its properties closer to those of bituminous coal (Nunes et al., 2014). They had
established that biomass torrefaction can produce a torrefied biomass with an energy
density that is almost equal to coal but denser than in wood. The properties of the
solid biomass products fall between the properties of coal and biomass (Fisher et al.,
2012). On the other hand, Rousset et al. (2011) proved that the characteristics of the
torrefied bamboo tend to fall toward those of low-rank coals. The same findings can
also be found in Tapasvi (2015), where the composition of the torrefied Norwegian
birch and spruce were closer to coal with lower volatile matters and higher carbon
content. Thus, the torrefied solid products can be used to substitute charcoal in some
applications such as fuel for domestic cooking stoves, residential heating, and
manufacture of improved solid fuel products such as fuel pellets or barbeque
briquettes for commercial and domestic uses.
There are many types of reactors available nowadays, and each reactor has its
distinct properties and is unique to certain biomass physical and chemical
Solids cooling
The torrefied product is cooled down to room temperature
Torrefaction Started at 200ºC and end when the
temperature is cooled down back to 200ºC. Most of the mass loss occurs during this
temperature range
Post-drying & intermediate heating
Temperature increased to 200ºC where physically bound water is released.
Resistance against mass and heat transfer is within the biomass particles.
Pre-drying
The free water is evaporated from the biomass at the constant temperature of 100ºC.
Initial heating Biomass initially heated to dry the biomass, where temperature is increased and at the end
moisture starts to evaporated

Chapter 2:Literature review
26
characteristics only (Medic, 2012). The overview of torrefaction reactors with
different technology by several developers in Europe, North America, and Brazil can
be found in Shang (2012), which consists of several categories such as conveyor
reactor, moving bed reactor, rotary drum reactor, fluidised bed reactor and
microwave reactor. All the categories mentioned earlier use electrical heating
method except for microwave reactor that uses microwave radiation to heat up the
sample. The method of torrefaction using electrical heating is referred as
conventional torrefaction in this thesis. Subsequently, this study is focused on the
torrefied biomass fuels using microwave reactor.
2.2.4 Microwave torrefaction
The general definition of microwaves is electromagnetic waves, which frequencies
fall between 300 MHz and 300 GHz with corresponding wavelengths between 1m
and 1mm, respectively. Figure 2.5 shows two mechanisms of microwave heating that
contribute to the heating of the materials quickly and uniformly are; dipole rotation
(dipolar polarisation) and ionic conduction (Anwar et al., 2015; Lanigan, 2010). The
dipolar rotation happened when the polar molecules such as water in microwave field
rotate to align themselves with the changing field. The friction and collision between
a dipole molecule and the surrounding molecules dissipate heat. Whereas, the ionic
conduction occurs when the free ions oscillate back and forth under the electric field
caused by the microwaves energy. The ionic motion causes the rapid heating of the
material.
Figure 2.4: Mechanism of microwave heating (Anwar et al., 2015; Lanigan, 2010).

Chapter 2:Literature review
27
Thus, unlike conventional heating that transfers heat to the materials, microwaves
produced heat by converting the electromagnetic energy to the thermal energy
(Wang et al., 2012). However, due to those heating mechanisms, only materials with
the dielectric properties can absorb microwaves. According to Huang et al. (2016);
Gronnow et al. (2013); Wang et al. (2012); Lanigan (2010), the microwave
chemistry suggests many advantages of the microwave torrefaction over the
conventional torrefaction. Some of the benefits discussed are: the shorter reaction
time compare to the conventional method and does not need direct contact between
the heated material and energy source, selective heating and energy saving.
One of the main advantages discussed by many researchers is the mode of energy
transfer when heating using microwave radiation over the conventional heating. The
microwave energy is delivered directly into the material through molecular
interaction with the electromagnetic field. While for the conventional heating
method, the heat is transferred into the material via convection, conduction and
radiation from the surfaces of the material. Therefore, Lanigan (2010) explained that
the heating using the microwave is an energy efficient process as the microwave
irradiation provide volumetric heating throughout the material while the
conventional heating heats the material that in contact with the reaction vessel before
the whole volume. However, main parameters that affect the torrefaction reaction are
microwave power and reaction time.
2.2.5 Torrefied biomass fuels
The solid product from the torrefaction sometimes referred as biochar or simply
torrefied biomass. Nunes et al. (2014) identified the improvement of the physical
properties biomass torrefaction such as the grindability, the particle shape, size, and
distribution as well as improves the pelletability. The torrefied biomass has lower
volatile matters and oxygen, a higher calorific value as well as higher ash and carbon
content (Huang et al., 2012; Jones et al., 2012; Wang et al., 2012; Arias et al., 2008).
The characteristics mentioned earlier were more similar to that of coal, which makes
the torrefied biomass suitable for co-firing with coal in power plant.

Chapter 2:Literature review
28
Given the high volumetric energy density, the solid torrefied biomass has been
recognised to be suitable for combustion or gasification application in commercial
and residential (Tumuluru et al., 2011) or as co-firing material in power plant
(Nhuchhen et al., 2014). Besides the chemical properties, torrefaction process also
upgrades the physical properties of the biomass. For example, the study by Li et al.
(2012) reported a decreased of water adsorption capacity after torrefaction of wood
material. In addition to that, the study also mentioned that moisture content reduced
to almost half of its raw material.
Despite all the benefits presented earlier, due to the brittleness of the torrefied
biomass, Michael Wild (2016) and Bergman (2005) claimed that more dust would be
produced during handling compared to coal and extra care shall be taken to avoid
dust accumulation as it said to be more reactive than coal dust. In addition, off-
gassing issues in torrefied biomass showed an alarming risk that required mitigation
by proper design of storage facilities along with safe handling procedures (Tumuluru
et al., 2015).
The torrefaction process also changed the reactivity of the raw biomass. Researcher
such as Liu et al. (2016) and Fisher et al. (2012) reported the decreases of biomass
reactivity after torrefaction. However, the reactivity is affected by the torrefaction
degree as well as the heating rate. The torrefied biomass is more reactive when the
torrefaction process uses higher heating rate than the one produced in lower heating
rate. The reactivity might have a good implication on the utilisation for combustion,
but there is a possibility of the self-heating problem.
2.3 Storage of biomass fuels
The growing interest in the production of solid biofuels has led to the need for the
storage in large amounts prior usage. The production of solid biofuels takes place all
over the year. However, the higher demand for the solid biofuels mostly during the
winter season due to the needs of energy for heating. Therefore, there is a necessity
to store the solid biofuels for the long term. Nevertheless, there is also a need for
short-term storage of biomass at the site.
Chapter 2:Literature review
29
To be able to operate continuously, a power plant needs to be able to handle large
quantities of fuel. Therefore, delivery just in time prior usage is impossible.
Consequently, the plant needs to have a buffer storage of fuel at the site to cope with
the fluctuation demand, as well as delays in the delivery chain (Eriksson, 2011). The
solid biofuels storage needed to be first in first out basis to avoid the degradation of
the fuels during storage.
Current practice to store conventional wood pellets is usually in the silo to protect
them from exposure to moisture, which can cause swell and disintegrate. Based on
Biochar.net (2012), current practice for transportation and storage purposes of
biochar is packed in a sealed 200 L drums or one cubic meter sacks. However, there
is a possibility for the biochar to develop heat once exposed to air.
While for torrefied biomass fuel, the outdoor pile storage is not recommended as the
best practice in stockpiling (Järvinen & Agar, 2014). Therefore, the study had
suggested that storage practice for torrefied biomass fuel been treated similarly to
wood pellet. The suggestion had been proven as a suitable storage practice by
Kymäläinen et al. (2015), through their study of five-month storage trial of several
types of biomass fuel including torrefied biomass. The findings from the study
suggested that even though torrefied biomass fuel is hydrophobic, the liquid water
can still be absorbed into the bulk through capillary action. However, the study
recommended that the usage of the silo to store the torrefied biomass fuel be
unnecessary, unlike the untreated pellet. Thus, roof-covered storage areas or simple
covers are suggested as a cheaper option for storage condition of torrefied fuel, and
this suggestion matches the recommendation in Koppejan et al. (2012). There are
limited amounts of experimental data on the self-heating of torrefied biomass stored
in large piles or heaps, but it most likely will follow the same self-heating
mechanism of coal piles.
2.4 Self-heating leading to ignition
Self-ignition is a thermal runaway resulting from the self-heating process. Self-
heating is the process where the materials achieve temperature higher than
surrounding temperature due to the internal exothermic reactions. According to

Chapter 2:Literature review
30
Bowes (1971), the thermal explosion analysis by Semenov (1940) and Frank-
Kamenetskii (1955) are the basis of the theoretical study of the self-heating and self-
ignition in a stockpile. The phenomena of the self-ignition in a stockpile are
described by two main parameters, which is the heat gained by the reaction and the
heat lost to the surrounding. Self-ignition is a phenomenon where thermal runaway
occurs due to self-heating of the material resulted in a transition from slow internal
exothermic reaction to a rapid oxidation without external heat source such as spark
or flame (van Blijderveen, Bramer, & Brem, 2013). Self-heating, on the other hand,
is part of the self-ignition process that happened before the ignition occurs (Fan and
Dong, 2011).
The imbalance between the heat produced by the reaction and the heat release
through the stockpile may lead to the self-heating. Self-heating happens when the
temperature of the stockpile is higher than the ambient temperature due to the
internal exothermic reactions. The self-ignition in stockpiles is a thermal runaway
resulting from the self-heating process that cannot be balanced by heat loss in the
system. Self-ignition also commonly being termed as spontaneous ignition, auto-
ignition and auto-combustion.
The mathematical model of self-ignition from the theory is based on the partial
differential equation of heat conduction, where the governing equation of heat
transfer is as shown in Eq. 2.1.
𝜕𝑇𝜕𝑡= 𝑎 [𝜕
2𝑇𝜕𝑥2+ 𝜕2𝑇𝜕𝑦2+ 𝜕2𝑇𝜕𝑧2] + 𝑄(𝑇)
𝜌𝑐 (Eq. 2.1)
Q is the heat source, W/m3, that is represented by an Arrhenius model as presented in
Eq. 2.2
𝑄 = 𝑞𝜌𝐴𝑒−𝐸𝑅𝑇 (Eq. 2.2)
Also, Figure 2.5, describes the behaviour of the system based on the heat balance due
to the heat of reaction and heat loss. Based on the diagram, the thick curve line is the
heat of reaction (Qreact) that increases in a non-linear form with the temperature.
While heat loss to the surrounding is represented by, the three grey parallel lines,
which are at the initial temperature, Ta. The three parallel straight lines marked a, b

Chapter 2:Literature review
31
and c are the convective heat transport from the fuel bed to air stream for three
primary air stream temperatures Qconv. These lines cross the x-axis at air temperature
(To). When Qconv is negative, the fuel bed is heated by the primary airflow.
Figure 2.5: Heat produced by the reaction (Qreact) and the heat lost or gained due to
convective heat transfer for three values of To (van Blijderveen et al., 2010)
There are two essential parameters to assess the self-heating behaviour that lead to
ignition; namely spontaneous ignition temperature and induction time. The
spontaneous ignition temperature is defined as the highest surrounding temperature
where no ignition occurs at a given volume, however the thermal runaway can
happen if the surrounding temperature is higher than the self ignition temperature
(SIT) where the heat released by the reactions inside the material is larger than the
heat transmitted to the environment (Ferrero et al., 2008).
In the other hand, induction time or ignition delay time is the time taken by the
material to ignite, which according to Saddawi et al. (2013) is a function of
surrounding temperature of the bed where the self-heating and ignition take place.
The difference arises in the induction time of material had been justified by Thomas
& Bowes (1961) as a result of time taken of the material to form the active product
material or to destroy the reaction inhibitor of the material.
The relationship between SIT and ignition delay times can be examined by the
method in BS EN 15188:2007 (BS 15188, 2007). As tested by Saddawi et al. (2013),
the results obtained from the test are a function of the size of the sample, where the

Chapter 2:Literature review
32
SIT will be lower for larger sample size and a longer time is taken to ignite (longer
induction time).
2.4.1 Self-heating behaviour of coal
However, coal stockpiles are susceptible to self-ignition particularly if the large
amounts are stored for long periods. The subtle change in the physiochemical
properties upon weathering is called oxidation. Based on Nalbandian (2010) the
accumulation of heat due to the heat generated from the oxidation process can lead to
self-ignition. The oxidation process is affected by three ways of how oxygen affects
the process (Veznikova et al., 2014). The three ways are physical adsorption of
oxygen the, reaction of oxygen on highly active coal centres, and the chemical
reaction of oxygen on coal. Thus, the mechanism of self-ignition results from the
physical and chemical reaction of coal.
The process of self-ignition coal can be divided into four phases as listed below:
a. Chemisorption of oxygen along with the increase of weight; from
ambient temperature up to 70ºC
b. Initial release of oxidation reactions products and inner water;
temperature range between 70ºC to 150ºC
c. Production of larger amounts of oxidation reactions products;
temperature range between150ºC to 230ºC,
d. Fast burning including production of soot; temperature above 230ºC
Some factors that influence the process of self-ignition are chemical reactivity of the
coal towards oxygen, atmospheric conditions, the moisture content of the coal, a
method of storage, particles size, and physical properties of coal (Nalbandian, 2010;
Schmal et al., 1985). The works by Beamish et al. (2000) show that the self-heating
rate of freshly exposed coal to the atmosphere is higher than the aged coal. The rate
of the rate is lower due to the loss of the reactive site for oxidation. Besides that, the
propensity of self-heating is different between types of coal. Low-rank coals exhibit
strong self-heating tendency compared to the matured coal (Ceballos et al., 2015; Fei
et al., 2009; Hull et al., 1997; Krishnaswamy, Agarwal, & Gunn, 1996; Jones &
Vais, 1991). Coal self-heating propensity is associated with coals containing high

Chapter 2:Literature review
33
volatiles (low-rank) compared to low volatile and high fixed carbon coals (high-
rank). The volatile matters in coal decreases as the ranking increases.
2.4.2 Self-heating behaviour in biomass fuels stockpile
The temperature rises of biomass fuel in a stockpile occurs primarily due to the self-
heating generated by chemical, biological or physical processes. Chemical self-
heating takes account of the reaction between the gas and solid material such as
oxidation. While for the biological self-heating, the metabolism of microbes within
the biomass generates heat. Lastly, the self-heating concerning physical process
includes effect related to moisture transport (Leslie, 2014). When storing large
amount of biomass fuels, there is a high risk of self-heating occurrence in the
stockpile due to a combination of those self-heating processes.
Biomass fuels have a potential to absorb oxygen during storage period to produce
exothermic reactions in the same manners of risk is observed in coal storage period
(Mateos et al., 2013). The oxidation at low temperature (below 200°C) can be
observed for biomass fuels, where the oxidation rate depends on the surface area of
the active site. Morrison & Hart (2012) had acknowledged the risk of self-heating
processes in piles of biomass, which may be under the oxygen-limited environment
and access to oxygen able to increase the heat generation and onset of a smouldering
or thermal runaway.
The exothermic reaction can take place under various conditions depending on the
materials observed. According to (Ramírez, García & Tascón, 2010), the initial stage
of temperature rise in biomass stockpile happens typically due to the biological
activity of microorganisms such as bacteria and moulds. The temperature of the
system commonly rise to 55°C, and in some cases, the temperature may up to 75°C.
Jirjis (2005) found the relationship between the fungal activities and the heat
development in fresh willow shoot storage, where the spore counts increased was
closely related to the heat development. Respiration is one of the processes that
happened in all organic materials that were stored in silos or storage facilities as
being explained by Ramírez et al. (2010). Respiration process will break down
carbohydrates, proteins and fats into carbon dioxide, water and energy. The self-

Chapter 2:Literature review
34
heating process will happen when the energy is used by the cell to fuel the metabolic
process which will release heat; if there is insufficient heat exchange between the
reaction system and the external environment the temperature will eventually rise
therefore will further increase the rate of reaction which then the product becomes
even warmer.
Afterwards, the heat generation due to chemical oxidation takes place, and the
heating up can occur up to at least 150°C. The same temperature pattern as explained
before can be witnessed in the study by Hogland & Marques (2003) on the storage of
waste pile. The study explained that the physical process due to adsorption or
condensation might lead to heat generation. However, it happened at a low
temperature (below 20°C), which is not significant in this work. Also, Thomas &
Bowes (1961) highlighted the complexity of the self-heating process which may
include more than one exothermic reaction, however in the first stage of reactions,
only low heat generated is witnessed, which will not result in the ignition.
Figure 2.6: Stages concerning the fires caused by self-ignition in bulk material
(Krause, 2009)
According to Krause (2009), there are four main criteria must take place for the
spontaneous combustion to occur. The main criteria are: (1) the material must exhibit
self-heating properties, (ii) the reaction that contributes to self-heating in the system
must rapidly accelerate to reach high temperature until it extends to a thermal
runaway, (iii) the thermal runaway phase must start a sustained smouldering, (4) the

Chapter 2:Literature review
35
sustained smouldering must spread to the outside surface of the material and possibly
erupt into flaming. Figure 2.3 shows the phases concerning the criteria lead to the
occurrence of a self-ignition process.
Meanwhile, Nelson et al. (2003) described the process of heat generation involving
bulk organic materials into two stages of temperature only: (i) at low-temperature
heat generated is due to the process of growth and respiration of microorganisms and
(ii) at high-temperature heat generated is due to chemical oxidation of cellulosic
materials. Their work also dismissed the heat generated due to a physical process.
Therefore, this study is focused on the source of heat generation at high temperature;
that only consider the chemical reaction of the biomass fuels without the effect of
microorganism activities. Besides that, the samples used in this study are considered
having a very low moisture content, which is an unfavourable environment for
biological activity by microorganisms.
2.4.3 Factors influence the self-heating propensity
There are several factors, which have influence the tendency of self-heating of
biomass fuels during the storage period. Two types of factors influence the self-
heating process in biomass fuels during the storage period are controllable and
uncontrollable factors. Controllable factors take account of the management of the
pile condition itself, for example, the pile height. In the other hand, the
uncontrollable factors include the characteristic of the biomass fuel. However, this
study only focuses on the controllable factors that can influence the propensity of the
biomass fuels self-heating.
Nalbandian (2010) had discussed some factors that influence the spontaneous
combustion of coal, which included air-ventilation of the stockpile, silo or bunker,
the atmospheric conditions of the storage area, the coal quality, coal moisture content
and particle size. Hogland & Marques (2003) listed several factors that influence the
temperature development in a waste storage pile such as particle size, the amount of
organic material, moisture content, the size of the waste pile and the surface area of
the waste fuel available to the reaction. Similarly, these factors also play roles
influencing the self-ignition during storage of biomass fuels. Storage time,

Chapter 2:Literature review
36
surrounding conditions, species composition, form of the biomass, as well as
geometry and structure of the storage pile influenced tendency of the biomass
characteristics changes during storage period (Krigstin & Wetzel, 2016), which
eventually affect the propensity of the self-heating to occur.
The compaction of the bulk material can also increase the propensity of the material
to self-heat, due to the increase in the thermal conductivity as reported by Mateos et
al. (2013) on the study of several types of lignocellulosic biomass with a particle size
of 0.5 μm and 0.9 μm. While more uniform particle size of wood chips lead to higher
compaction, which will reduce the heat dissipation to the surrounding especially in
higher chip piles (Jirjis, 2005).
Pauner & Bygbjerg (2007); Wilěn Carl & Rautalin (1993) concluded in their
research that the ambient temperature of the storage area and the characteristic of the
biomass fuel play an important role influencing the propensity of the self-heating. In
addition to that, Guo (2013) considered the influence of the ventilation in the storage
of wood pellets in a silo, which indeed a very significant factor to be taken into
attention.
Many studies agreed that the stockpile geometry is a critical factor to be taken into
account when storing biomass fuels in a bulk quantity (Murasawa et al., 2012;
Ferrero et al., 2009; Li, Koseki, & Momota, 2006; Jirjis, 2005). The mechanism of
the heat dissipated for from the stockpiles is through the surface even though the heat
is produced in the whole bulk volume. Therefore, if the heat loss to the surrounding
through the surface is unable to balance the heat generation, it can initiate the self-
ignition.
For instance, Li et al. (2006) had established the relationship between the heat
generation and the volume of the bulk pile. The heat generation in a pile is
proportional to the its volume, while the heat loss is proportional to the surface area.
Hence, volume to surface area ratio (V/A) has a strong influence on the self-ignition
occurrence as the rate reaction associated with it. According to Cruz Ceballos et al.
(2015), the higher surface area can be translated to more active sites. Thus, to be able

Chapter 2:Literature review
37
to control the influence of the geometry toward self-heating propensity, the height of
piles is a controllable factor that can be managed during the storage period.
2.4.4 Biomass fuels ignition preventions
Many researchers had study the safe storage of biomass fuels in stockpiles regards
physical and chemical properties that likely to cause self-heating. Table 2.2, listed
the several countermeasure suggestions of the research based on the material studied.
Based on the several examples of countermeasures suggested, the storage
environment plays an important role to avoid the self-ignition occurrences. The
surrounding temperature of the storage is a key factor to be taken into account along
with the pile condition such as its height. Besides that, the physical condition of the
stockpile such as the need to compact or bale the material can avoid the self-ignition.
Thus, those factors are the focus of this study, where the effect of pile height,
temperature and material porosity is presented.
2.5 Experimental study of self-heating behaviour
There are many analysis methods available to evaluate the self-heating propensity of
the biomass material. Among the experimental techniques adopted by researchers to
analyse the self-heating in biomass fuels are based on the one used for coal. The
study of the self-heating of coal in the mining industry is well understood compared
to the biomass fuel industry (García-Torrent et al., 2012). Similar to coal, the
understanding of the kinetics of the biomass fuel oxidation is beneficial for the
understanding, design and modelling of the industrial processes (Sima-Ella, Yuan, &
Mays, 2005). The self-heating analysis can be categorised based on the method used
to obtain the self-heating parameters, which characterised the material’s reactivity.
The main kinetic parameters that influence the reactivity of the biomass fuels are
activation energy and pre-exponential factor. Sima-Ella et al. (2005) elaborated that
the activation energy affects the temperature sensitivity of reaction rate, while the
pre-exponentials factor associated with the material structure.

Chapter 2:Literature review
38
Table 2.2: Prevention suggestions from past studies on self-heating of biomass material in stockpiles
Sources and biomasses studied
Suggestions
Graham (2015) - Freshly harvested willow - Thermally treated wood
pellet - Untreated white wood pellet
- Long term storage of thermally treated wood pellet in an open barn with cover
- Short term option of outdoor storage for thermally treated wood pellet
- Storage of untreated white wood pellet in a fully enclosed environment
- Sloped edge pile
Mateos et al. (2013) - Several types of milled
lignocellulosic biomass (size: 0.5μm & 0.9μm)
- Compaction of the stored material reduced the self-heating propensity; due to the reduction of air accessibility.
Guo (2013) - Wood pellet
- Smaller silo size for storage system - Increase the pellet age before storage - Ventilation system inside the silo
Koseki (2012) - Wood chips - Chicken dung - Refuse paper and plastic
fuel - Organic rubble - Soy sauce squeezing residue
- The removal of heat using a tube that is penetrated into the pile
- Active monitoring of the temperature and gas emission from the pile
- Reduce fermentation by covering the low part of the pile’s slope with incombustible material.
Murasawa et al. (2012) - Soy sauce squeezing residue - Fish meal residue
- Limitation of the pile height - Adjustment of the surrounding temperature
Fu et al., (2006) - Refuse derived fuel - Meat bone meal
- Monitoring of the relative humidity and temperature inside bulk piles
- Avoid the long-term storage
Hogland & Marques (2003) - Refused derived fuel - Unsorted industrial waste
- Baling of the material to reduce the porosity - Ensure pile is lower than 5m - Construction of the wind barrier to protect the
pile from strong wind
Chapter 2:Literature review
39
2.5.1 Thermogravimetric analysis of thermal decomposition
Critical conditions for self-heating in stored biomass materials can be evaluated by
using suitable laboratory-scale test method including thermogravimetric test,
differential scanning calorimeter, differential thermal analysis, adiabatic calorimeter
and isothermal oven tests using basket heating methods (Cruz Ceballos, Hawboldt, &
Hellleur, 2015; García-Torrent et al., 2012). The thermal analysis such as
thermogravimetric and differential scanning calorimeter require smaller sample size
as well as less time-consuming.
Among the techniques used, the most common approaches are using thermo-
analytical analysis, which based on the net amount of heat released by the sample as
well as the dependence of certain parameters to the temperature (Avila, 2012). This
technique including thermogravimetric analysis (TGA), differential thermal analysis
(DTA) and differential scanning calorimeter (DSC) are widely used in self-ignition
researches.
A thermogravimetric analysis is extensively used to determine the kinetic parameters
for the sample as well as to evaluate its thermal stability. TGA was performed to
measure the mass changes of the sample related to its temperature changes which
provides the characteristic temperature of the sample. Many researchers such as
(Jones et al., 2015; Della Zassa et al., 2013; Avila et al., 2011; Saddawi et al., 2010)
used this method in the study of reactivity biomass materials. Nevertheless, this
technique had been widely used in the study of coal as well.
Therefore, the significant parameters examined based on thermogravimetric analysis
in term of self-heating behaviour as reported by Ramírez et al. (2010) are are the
temperature maximum weight loss (TMWL), temperature of initial combustion
(TIC) and characteristic oxidation temperature (Tcharac).
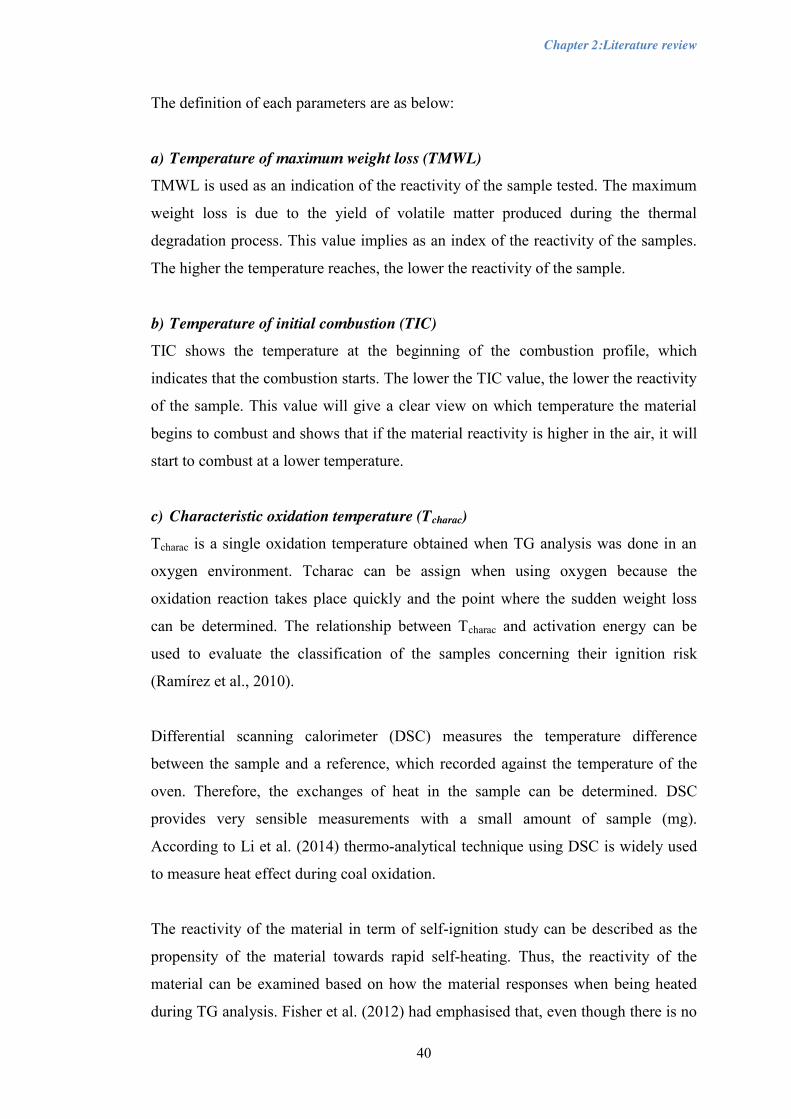
Chapter 2:Literature review
40
The definition of each parameters are as below:
a) Temperature of maximum weight loss (TMWL)
TMWL is used as an indication of the reactivity of the sample tested. The maximum
weight loss is due to the yield of volatile matter produced during the thermal
degradation process. This value implies as an index of the reactivity of the samples.
The higher the temperature reaches, the lower the reactivity of the sample.
b) Temperature of initial combustion (TIC)
TIC shows the temperature at the beginning of the combustion profile, which
indicates that the combustion starts. The lower the TIC value, the lower the reactivity
of the sample. This value will give a clear view on which temperature the material
begins to combust and shows that if the material reactivity is higher in the air, it will
start to combust at a lower temperature.
c) Characteristic oxidation temperature (Tcharac)
Tcharac is a single oxidation temperature obtained when TG analysis was done in an
oxygen environment. Tcharac can be assign when using oxygen because the
oxidation reaction takes place quickly and the point where the sudden weight loss
can be determined. The relationship between Tcharac and activation energy can be
used to evaluate the classification of the samples concerning their ignition risk
(Ramírez et al., 2010).
Differential scanning calorimeter (DSC) measures the temperature difference
between the sample and a reference, which recorded against the temperature of the
oven. Therefore, the exchanges of heat in the sample can be determined. DSC
provides very sensible measurements with a small amount of sample (mg).
According to Li et al. (2014) thermo-analytical technique using DSC is widely used
to measure heat effect during coal oxidation.
The reactivity of the material in term of self-ignition study can be described as the
propensity of the material towards rapid self-heating. Thus, the reactivity of the
material can be examined based on how the material responses when being heated
during TG analysis. Fisher et al. (2012) had emphasised that, even though there is no

Chapter 2:Literature review
41
accepted definition of char reactivity, the global char reactivity can be determined
from mass loss histories, by defining it as the time derivative of the conversion.
Therefore, this study adopted the same definition of char reactivity as earlier
researchers.
However, thermal analysis operates on the relatively small sample (mg samples),
which raise the issues in the sample representative towards actual heating behaviour
as well as it reproducibility (Della Zassa et al., 2013). Therefore, the need of larger
scale investigation is essential. Thus, the isothermal oven test is one of the preferable
option.
2.5.2 Isothermal oven test
The isothermal oven test is conducted to investigate the larger scale of heating
behaviour on the combustible material. The effect of temperature well as the volume
over the self-heating propensity can be quantified using this technique. Besides that,
the kinetic parameters of the heating process can also be found.
Three different curves can be obtained from this experiment. The curves are
presented in Figure 2.7. The curve A is a subcritical curve where at chosen
experimental temperature TA the sample becomes hotter towards the oven
temperature. However, no exothermic reaction within the sample, thus no ignition is
observed. While for curve labelled B, is the critical curve. At this temperature
profile, the temperature of the sample slightly exceeds the oven temperature, TB.
However, it just surpasses for a slight time then tends to reduce towards the oven
temperature. Lastly, if curve C is observed during the experiment, ignition will be
detected. The supercritical curve observed when the heat generation in the sample
surpasses its heat losses. Eventually, non-stationary conditions reached, and the
sample temperature escalates rapidly over that of the oven (TC), and ignition occurs.

Chapter 2:Literature review
42
Figure 2.7: Possibility of thermal behaviour of the sample in the isothermal oven
(Ramírez, García-torrent, & Tascón, 2010)
The isothermal oven test uses crossing point (CP) method to find the kinetic
parameters. This method assumes that when two temperature points inside the
container are identical, there will be no conductive heat transfer between two points,
leads to the heat transfer based on a transient solution as Eq 2.3.
𝜌𝐶𝑝𝜕𝑇𝜕𝑡| 𝑝 = 𝜌 ∙ ∆𝑟ℎ ∙ 𝐴𝑒
− 𝐸𝑎𝑅𝑇𝑝 (Eq. 2.3)
Where the subscript 𝑝 represents the condition at the centre of the sample. The
identical temperature between this two location points is defined as the crossing
point, where activation energy (Ea) can be calculated after Tp, which is the ‘crossing
point temperature’ and 𝜕𝑇𝜕𝑡| 𝑝 , is the temperature increase rate being examined
experimentally. The activation energy can be calculated from the slope of 𝑙𝑛 (𝑑𝑇𝑑𝑡)| 𝑝
against ( 1𝑇𝑝).

Chapter 2:Literature review
43
2.5.3 Numerical modelling of self-ignition
Various level of complexity to predict the condition of which biomass can undergo
self-heating, starting with one-dimensional (1-D) to the more complex like two-
dimensional (2-D) and three-dimensional (3-D). However, Fierro et al. (2001) had
highlighted the disadvantage of time-consuming of the computational time with the
possibility for the inaccuracy of prediction.
Many mathematical modelling had been done to study the self-heating process
leading to ignition. Researchers manage to find the relationships between critical
parameters to predict the possibility of ignition occurrence as been done by Ferrero
et al. (2008); Ferrero et al. (2009); Lohrer et al. (2005); Fan & Dong (2011) and
Pauner & Bygbjerg (2007).
The one-dimensional model equations are preferable, as it is less time consuming
compared to two-dimensional (Arisoy & Akgun, 2000; Hull et al., 1997). However,
the one-dimensional model will give less accurate results. Thus, many recent studies
had run the simulations in two-dimensional as well as included complex coupled
reaction such as biological and chemical oxidation in the numerical model in order to
get more accurate and realistic results (Escudey et al., 2011; Luangwilai et al., 2010;
Ferrero et al., 2008; Krause, Schmidt, & Lohrer, 2006; Akgun & Essenhigh, 2001).
Also, Akgun & Essenhigh (2001) recognised the need of using the one-dimensional
model as a first step approximation, but the model is incomplete and unrealistic.
Therefore, a two-dimensional model is the simplest model that can give the accurate
and realistic result. In the other hand, for the case of the prediction of critical
conditions, the larger geometry managed to predict the critical conditions using the
global developed model.
In order to for the parameters to be used in the simulation, thermal properties of the
material can be examined using the thermal analysis such as thermogravimetric (TG)
and differential scanning calorimeter (DSC). The temperature from the test will be
applied in the numerical equation to determine the self-heating kinetic. Besides that,
the prediction using numerical simulation can also be validated by experimental
methods. Atreya (1998) had mentioned that there are three requirements in

Chapter 2:Literature review
44
experimental investigation of the ignition phenomenon, which are (i) a heat source to
simulate the fire heat flux, (ii) a technique of mounting and exposing the sample to
the heat source, and (iii) in case of piloted study, the initial source to ignite the
sample. Numerical simulations will help in closing the gap when there’s a restriction
in size or geometry of materials that need to be tested and often be used to
complement extensive experiments (Lohrer et al., 2005).
2.6 Conclusions of the literature review
x The growth of demand for biomass fuel increased due to the awareness of
using the carbon neutral fuel source for energy production. Therefore many
new technologies to produced biomass fuels had been developed.
x The torrefaction technology managed to upgrade the quality of the biomass
into a solid biofuel with high energy density and suitable for combustion or
gasification for energy production. The torrefied biomass also a carbon
neutral fuel, which is preferable compared to coal.
x The properties of torrefied biomass are comparable to the one in low ranking
coal, with lower volatile matters and oxygen and higher calorific value, ash
and carbon content.
x The torrefaction process changes the reactivity of the biomass based on the
degree of torrefaction. Therefore, the torrefied biomass also likely to have
issues of self-heating due to higher reactivity.
x Microwave torrefaction has advantages over conventional torrefaction with
overall efficient process as well as promising technology application.
x Self-heating behaviour can be observed once the heat generated by the
exothermic reaction is more than the heat losses to the surrounding. The self-
heating leading to the ignition is a problem during the biomass bulk storage.
x The parameters affecting self-heating propensity of biomass fuel in bulk
storage include ambient storage temperature, species composition, geometry
of the storage (pile height), storage ventilation, physical and chemical
properties of the biomass, surface area as well as the duration of the storage.
x Thermogravimetric analysis is a useful method to find the thermal kinetic for
the biomass decomposition as well as the proximate analysis.

Chapter 2:Literature review
45
x Larger scale experiment is suitable to give more in-depth observation and
measurement of the sample reactivity based on the effect of temperature and
volume of samples towards heating propensity.
x Numerical modelling is a decisional-support tool that can help to simulate the
heating behaviour on a large scale as well as to complement the findings from
the experiment.
x Two-dimensional geometry model proven to have better advantages over
one-dimensional despites the time-consuming simulation.
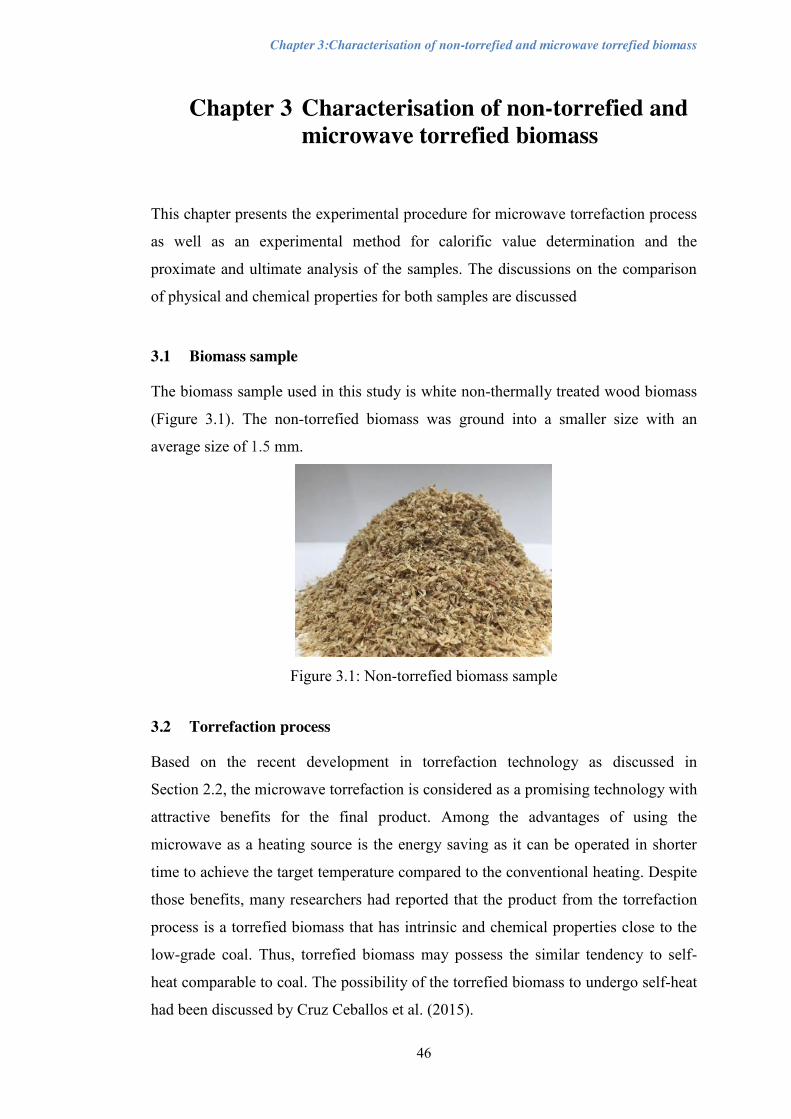
Chapter 3:Characterisation of non-torrefied and microwave torrefied biomass
46
Chapter 3 Characterisation of non-torrefied and microwave torrefied biomass
This chapter presents the experimental procedure for microwave torrefaction process
as well as an experimental method for calorific value determination and the
proximate and ultimate analysis of the samples. The discussions on the comparison
of physical and chemical properties for both samples are discussed
3.1 Biomass sample
The biomass sample used in this study is white non-thermally treated wood biomass
(Figure 3.1). The non-torrefied biomass was ground into a smaller size with an
average size of 1.5 mm.
Figure 3.1: Non-torrefied biomass sample
3.2 Torrefaction process
Based on the recent development in torrefaction technology as discussed in
Section 2.2, the microwave torrefaction is considered as a promising technology with
attractive benefits for the final product. Among the advantages of using the
microwave as a heating source is the energy saving as it can be operated in shorter
time to achieve the target temperature compared to the conventional heating. Despite
those benefits, many researchers had reported that the product from the torrefaction
process is a torrefied biomass that has intrinsic and chemical properties close to the
low-grade coal. Thus, torrefied biomass may possess the similar tendency to self-
heat comparable to coal. The possibility of the torrefied biomass to undergo self-heat
had been discussed by Cruz Ceballos et al. (2015).
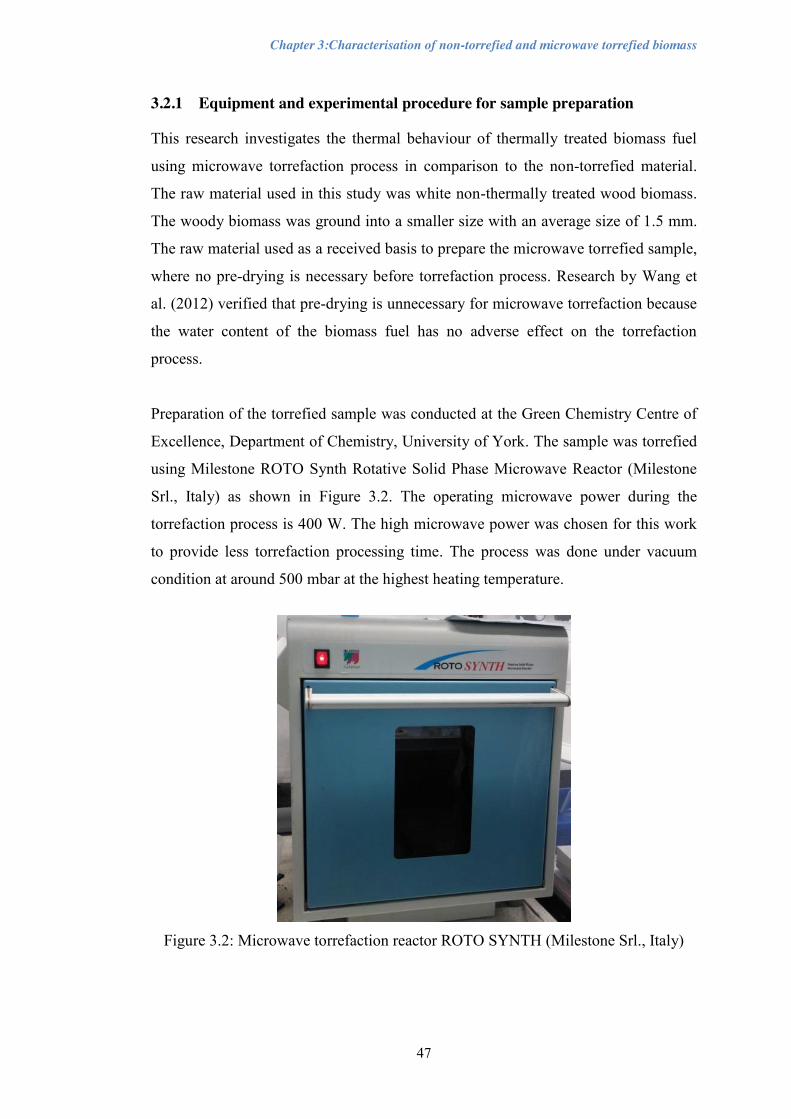
Chapter 3:Characterisation of non-torrefied and microwave torrefied biomass
47
3.2.1 Equipment and experimental procedure for sample preparation
This research investigates the thermal behaviour of thermally treated biomass fuel
using microwave torrefaction process in comparison to the non-torrefied material.
The raw material used in this study was white non-thermally treated wood biomass.
The woody biomass was ground into a smaller size with an average size of 1.5 mm.
The raw material used as a received basis to prepare the microwave torrefied sample,
where no pre-drying is necessary before torrefaction process. Research by Wang et
al. (2012) verified that pre-drying is unnecessary for microwave torrefaction because
the water content of the biomass fuel has no adverse effect on the torrefaction
process.
Preparation of the torrefied sample was conducted at the Green Chemistry Centre of
Excellence, Department of Chemistry, University of York. The sample was torrefied
using Milestone ROTO Synth Rotative Solid Phase Microwave Reactor (Milestone
Srl., Italy) as shown in Figure 3.2. The operating microwave power during the
torrefaction process is 400 W. The high microwave power was chosen for this work
to provide less torrefaction processing time. The process was done under vacuum
condition at around 500 mbar at the highest heating temperature.
Figure 3.2: Microwave torrefaction reactor ROTO SYNTH (Milestone Srl., Italy)
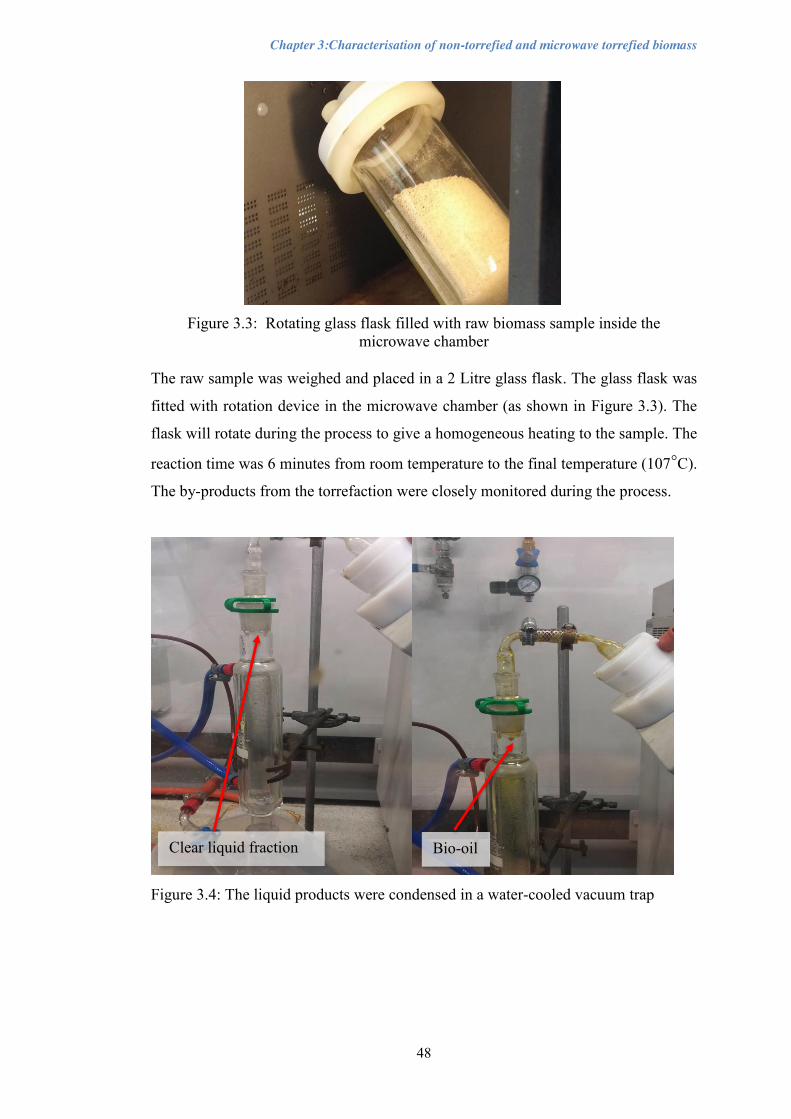
Chapter 3:Characterisation of non-torrefied and microwave torrefied biomass
48
Figure 3.3: Rotating glass flask filled with raw biomass sample inside the microwave chamber
The raw sample was weighed and placed in a 2 Litre glass flask. The glass flask was
fitted with rotation device in the microwave chamber (as shown in Figure 3.3). The
flask will rotate during the process to give a homogeneous heating to the sample. The
reaction time was 6 minutes from room temperature to the final temperature (107°C).
The by-products from the torrefaction were closely monitored during the process.
Figure 3.4: The liquid products were condensed in a water-cooled vacuum trap
Clear liquid fraction Bio-oil
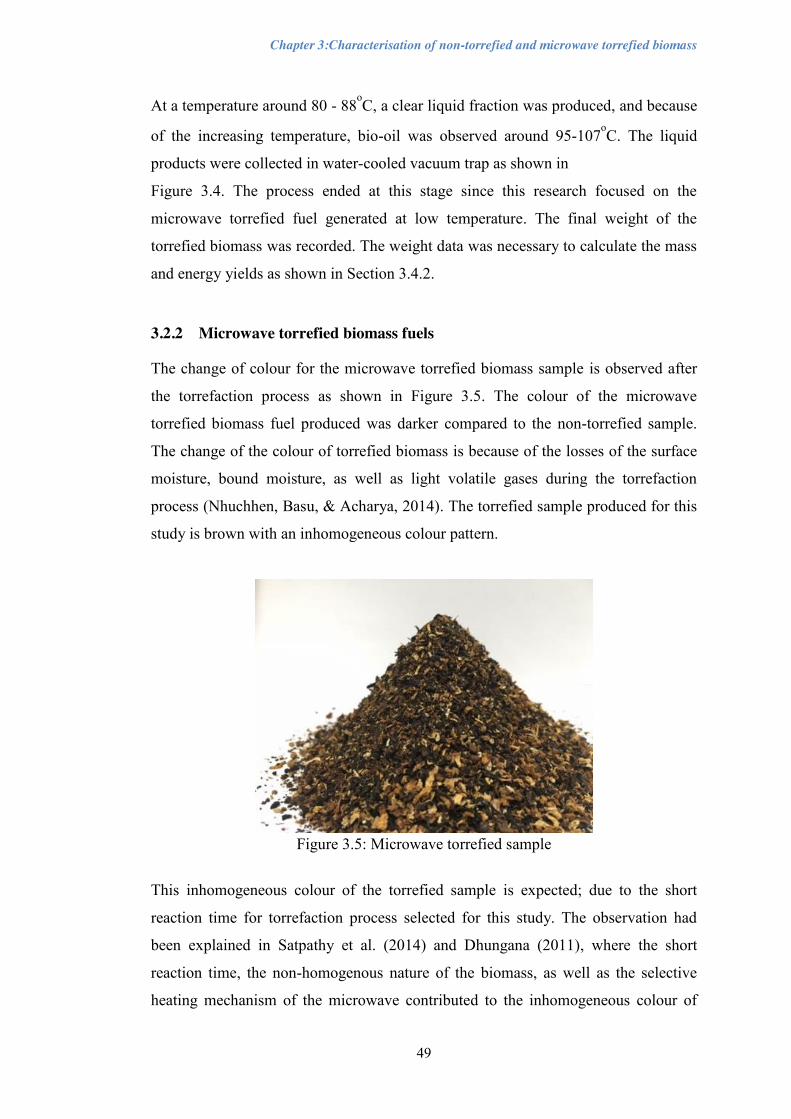
Chapter 3:Characterisation of non-torrefied and microwave torrefied biomass
49
At a temperature around 80 - 88oC, a clear liquid fraction was produced, and because
of the increasing temperature, bio-oil was observed around 95-107oC. The liquid
products were collected in water-cooled vacuum trap as shown in
Figure 3.4. The process ended at this stage since this research focused on the
microwave torrefied fuel generated at low temperature. The final weight of the
torrefied biomass was recorded. The weight data was necessary to calculate the mass
and energy yields as shown in Section 3.4.2.
3.2.2 Microwave torrefied biomass fuels
The change of colour for the microwave torrefied biomass sample is observed after
the torrefaction process as shown in Figure 3.5. The colour of the microwave
torrefied biomass fuel produced was darker compared to the non-torrefied sample.
The change of the colour of torrefied biomass is because of the losses of the surface
moisture, bound moisture, as well as light volatile gases during the torrefaction
process (Nhuchhen, Basu, & Acharya, 2014). The torrefied sample produced for this
study is brown with an inhomogeneous colour pattern.
Figure 3.5: Microwave torrefied sample
This inhomogeneous colour of the torrefied sample is expected; due to the short
reaction time for torrefaction process selected for this study. The observation had
been explained in Satpathy et al. (2014) and Dhungana (2011), where the short
reaction time, the non-homogenous nature of the biomass, as well as the selective
heating mechanism of the microwave contributed to the inhomogeneous colour of

Chapter 3:Characterisation of non-torrefied and microwave torrefied biomass
50
the torrefied sample. Also, the lower heating rate can also contribute to more
homogenous products.
The varieties in the changes of colour for the torrefied product were reported as to be
depending on the applied torrefaction conditions (Graham, 2015; Nhuchhen, Basu, &
Acharya, 2014). This statement is supported by Cruz Ceballos et al. (2015); Shang et
al. (2012); Phanphanich & Mani (2011) where they established that the colour of the
materials that undergo torrefaction process were found to be darker with the
increasing of torrefaction heating temperature. Besides that, the study by Satpathy et
al. (2014) also showed the colour changes from dark brown to black when the
microwave power level and the reaction time increased. Tumuluru et al. (2011) had
identified the colour changes of raw material after the torrefaction process as a useful
method to describe the degree of torrefaction, where the biomass turns from brown to
black at 150oC – 300oC considering the chemical composition changes during the
process.
It is worth mentioning that, a recent study by Sadaka et al. (2014), had published a
detailed measurement of biomass colour changes, where they used biomass
discoloration index to characterise the colour changes based on carbonisation
temperature and reaction time during the carbonisation process. The index could
potentially capture the extent of the biomass conversion through the degree of the
colour changes at different carbonisation conditions. The use of the discoloration
index can be extended on the biomass fuel produced using torrefaction process.
Unfortunately, this index cannot be applied in this research because only one
condition of torrefaction process was studied.
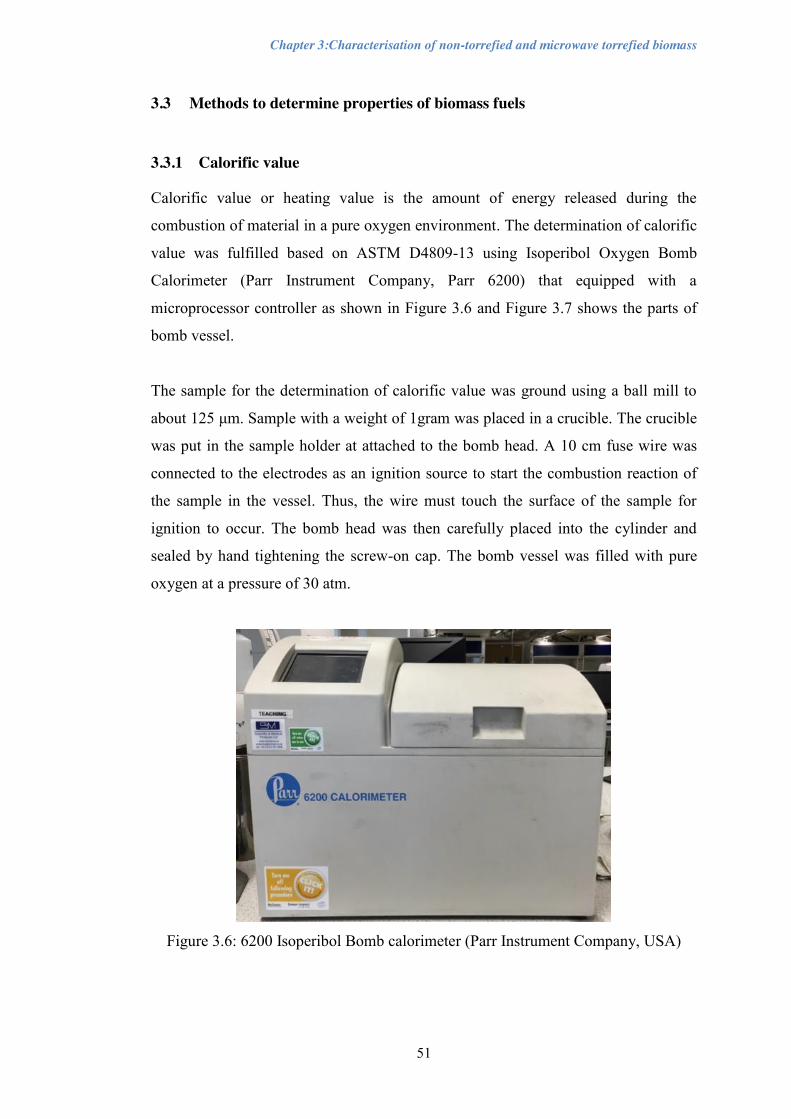
Chapter 3:Characterisation of non-torrefied and microwave torrefied biomass
51
3.3 Methods to determine properties of biomass fuels
3.3.1 Calorific value
Calorific value or heating value is the amount of energy released during the
combustion of material in a pure oxygen environment. The determination of calorific
value was fulfilled based on ASTM D4809-13 using Isoperibol Oxygen Bomb
Calorimeter (Parr Instrument Company, Parr 6200) that equipped with a
microprocessor controller as shown in Figure 3.6 and Figure 3.7 shows the parts of
bomb vessel.
The sample for the determination of calorific value was ground using a ball mill to
about 125 μm. Sample with a weight of 1gram was placed in a crucible. The crucible
was put in the sample holder at attached to the bomb head. A 10 cm fuse wire was
connected to the electrodes as an ignition source to start the combustion reaction of
the sample in the vessel. Thus, the wire must touch the surface of the sample for
ignition to occur. The bomb head was then carefully placed into the cylinder and
sealed by hand tightening the screw-on cap. The bomb vessel was filled with pure
oxygen at a pressure of 30 atm.
Figure 3.6: 6200 Isoperibol Bomb calorimeter (Parr Instrument Company, USA)

Chapter 3:Characterisation of non-torrefied and microwave torrefied biomass
52
Figure 3.7: Parts of bomb vessel
A water bucket was filled with 2 litres of water and placed into the bomb
calorimeter. The bomb vessel was lowered into the bucket that filled together with
the stirring mechanism. The stirrer will ensure a homogeneous temperature
distribution of water in the bucket. Then the sample was ignited in pure oxygen
within a sealed bomb vessel. The heat resulting from the ignition will cause a small
increase in water temperature in the bucket that surrounding the bomb, which then
recorded automatically by the sensor.
3.3.2 Proximate analysis
Proximate analysis is a method to characterise biomass by determination of moisture,
fixed carbon, ash and volatile content in biomass sample. Proximate analysis
determination was using thermogravimetric system following the standard method in
ASTM Standard Test Method D5142. Based on the ASTM method, the moisture
content, volatile matter, and fixed carbon can be determined successively in a single
instrumental procedure. On the other hand, for fixed carbon, the value is a calculated
from the difference between 100 and the total of the percentage of moisture, volatile
matter and ash.
Crucible Fuse
Sample holder
Cylinder
Bomb head
Screw on cap
Chapter 3:Characterisation of non-torrefied and microwave torrefied biomass
53
The analytical requirements for proximate testing using thermogravimetric had been
summarised as the capability to record the weight of a sample as it is heated based on
a designated temperature range and held isothermally at those temperatures, then
change the sample’s environmental atmosphere from inert to oxidising (Cassel,
Menard, & Earnest, 2012). Thus, in this study, TGA 4000 (PerkinElmer Inc, USA) is
used to carry out the analysis as it meets the capability mentioned earlier.
Firstly, Nitrogen (99.5% purity) is used as the carrier gas to achieve the inert
environment for the reaction. The nitrogen is purged at a rate of 20mL/min while the
sample is heated from ambient temperature to 110oC. After reaching 110oC, the
temperature was kept constant for 5 minutes; the weight loss seen here is due to the
evaporation of moisture content in the sample. After 5 minutes, the sample was
heated up to 900oC with a heating rate of 25oC/min in nitrogen. The condition was
held for a minute where the complete release of volatile matter occurs at this stage.
Then the supply gas was switched to Oxygen (99.5% purity) at 40mL/min, and the
sample was heated up to 950 oC at 10oC/min, to ensure the burn of the remaining
fixed carbon. After that, the residual left from the process is known as incombustible
ash.
3.3.3 Ultimate analysis
This analysis is performed to determine the elemental compositions by weight
percentage of Carbon, Hydrogen, Nitrogen, Sulphur and Oxygen. It was carried out
using Elemental analyser FLASH 2000 CHNS/O (Thermo Fisher Scientific Inc.,
USA). The basic premise behind the procedure is the combustion of the sample in a
pure oxygen atmosphere, and the resultant gases are automatically measured (García
et al., 2012).
Sample weighed 2-3mg was placed into the aluminium capsule and added with
vanadium pentoxide (V2O5). Vanadium pentoxide acts as an oxidising agent to
promote combustion process in the furnace. The analyser is equipped with an auto-
sampler that will drop each sample sequentially by electronically controlled
movements into a 900oC furnace. A small volume of oxygen is added to burn the
sample that converts the sample into elemental gases. The element concentrations

Chapter 3:Characterisation of non-torrefied and microwave torrefied biomass
54
were determined using a separation column and thermal conductivity detector
equipped in the analyser.
3.3.4 True density and bulk density determination
The true density had been determined using AccuPyc II 1340 Automatic Gas
Pycnometer (Micrometrics, Norcross, USA). The true density was determined by
calculating the volume occupied by its mass without the volume of all pores. The
volume is calculated using the pressure difference and the known volume of
displacement.
The overall volume occupied by the mass of the sample, which included the pore and
interstice volumes is the bulk density. The bulk density was determined by filling up
the sample into a known cubic volume and measuring the amount of the samples
without the tamping the samples.
3.4 Results and discussion
3.4.1 Calorific value
Figure 3.8 shows the results from the experiment using bomb calorimeterthe increase
in the calorific value of the microwave torrefied sample. The calorific value of the
non-torrefied sample is 18.4MJ/kg and 22.0MJ/kg for torrefied biomass. The
calorific value of the microwave torrefied biomass had increased to around 20%
compared to its raw material.
Figure 3.8: Calorific value of the samples

Chapter 3:Characterisation of non-torrefied and microwave torrefied biomass
55
The calorific value determined for the torrefied sample in this study is in the range of
values reported by several researchers such as Ren et al. (2013) for torrefied
Douglas fir pellet using microwave reactor; Kopczyński et al. (2015) for torrefied
willow using fixed bed reactor; Wang et al. (2013) for torrefied sawdust in an
oxidative torrefaction process and Jones et al. (2012) for torrefied willow using
reactor tube for conventional torrefaction. Even though the material and method of
torrefaction are different for the mentioned researchers, the values reported were in
the range as stated by Kleinschmidt (2011) in his review, which is between 20-
24MJ/kg.
The increased of calorific value had been described by Eseyin et al. (2015) and
Wang et al. (2013) was due to the removal hemicellulose content in biomass, where
hemicelluloses go through most reactive devolatilization and carbonisation under
250ºC. The calorific value values increased linearly with the torrefaction temperature
in the laboratory scale study of conventional torrefaction of reed canary grass, wheat
straw and willow by Bridgeman et al. (2008). This pattern is expected as the
moisture contents of the samples also decrease with the increased of the torrefaction
temperature. The same relationship was observed in the recent study by Kopczyński
et al. (2015) on torrefied willow at a different temperature where the calorific value
of 19.33MJ/kg for torrefaction temperature of 200ºC was observed and increased to
26.5MJ/kg when applied with torrefaction temperature of 300ºC.
However, it is a different case for the application of microwave induced pyrolysis on
rice straw at 400-500W microwave power reported by Huang et al. (2008). They
indicated that there is no correlation between the calorific value and the microwave
power/temperature. The reduction of calorific value under the torrefaction condition
of 400-500W microwave power can be seen in their findings. They had concluded
that the findings might suggest that when microwave power is higher than 400W,
some of the fixed carbon content can also be pyrolyzed, which lead to the reduction
in the calorific value values. Moreover, their research showed that the water content
of biomass fuel used did not have a substantial effect on the calorific value. On the
other hand, Wang et al. (2012) observed the increase of the calorific value of the
biomass products due to water content at lower microwave power levels (below
300W)

Chapter 3:Characterisation of non-torrefied and microwave torrefied biomass
56
A study done by Lanigan (2010) had shown the efficiency of using microwave
irradiation pyrolysis compared to conventional pyrolysis. Based on the research, the
similar calorific value could be produced at temperatures 100oC lower than those
produced using conventional pyrolysis. For conventional pyrolysis, the calorific
value increases with temperature and residence time (Arias et al., 2008). Besides
that, the results of the microwave torrefied biomass determined in this work is
comparable to calorific values determined by low-temperature pyrolysis using pine
wood and coconut fibre in (Liu & Han, 2015). The present result shows that the low-
temperature microwave torrefaction has potential to produce solid biofuel similar to
the one using other types of thermal pre-treatment.
3.4.2 Mass and energy yield
The torrefaction process had been proved to reduce the mass and energy yield of the
final product. There are several correlations between the microwave torrefaction
conditions and the percentage of mass and energy yield of biomass torrefied
material. For example; the percentage of mass yield reduced with the increased of the
torrefaction temperature in research by Poudel & Oh (2014) as well as van der Stelt
et al. (2011). In the other hand, Satpathy et al. (2014) found the mass yield reduced
when the reaction time increased. In addition to the torrefaction conditions, findings
in Satpathy et al. (2014) presented that the moisture content also has a significant
influence on the pattern of mass yield in torrefaction process, where most of the
higher mass yield achieved at higher moisture content.
Mass and energy yield shows in Figure 3.9 was calculated for the microwave
torrefaction process using the Eq. 3.1 and Eq. 3.2 based on Bridgeman et al. (2008).
𝑀𝑎𝑠𝑠 𝑦𝑖𝑒𝑙𝑑 (𝑀) = 𝑀𝑎𝑠𝑠 𝑎𝑓𝑡𝑒𝑟 𝑡𝑜𝑟𝑟𝑒𝑓𝑎𝑐𝑡𝑖𝑜𝑛𝑀𝑎𝑠𝑠 𝑜𝑓 𝑟𝑎𝑤 𝑠𝑎𝑚𝑝𝑙𝑒
𝑥 100 (Eq. 3.1)
𝐸𝑛𝑒𝑟𝑔𝑦𝑦𝑖𝑒𝑙𝑑 (𝐸) =
𝑀𝑎𝑠𝑠 𝑦𝑖𝑒𝑙𝑑 (𝑀) ∗
𝐻𝐻𝑉 𝑎𝑓𝑡𝑒𝑟 𝑡𝑜𝑟𝑟𝑒𝑓𝑎𝑐𝑡𝑖𝑜𝑛𝐻𝐻𝑉 𝑜𝑓 𝑟𝑎𝑤 𝑠𝑎𝑚𝑝𝑙𝑒
𝑥 100 (Eq.3.2)
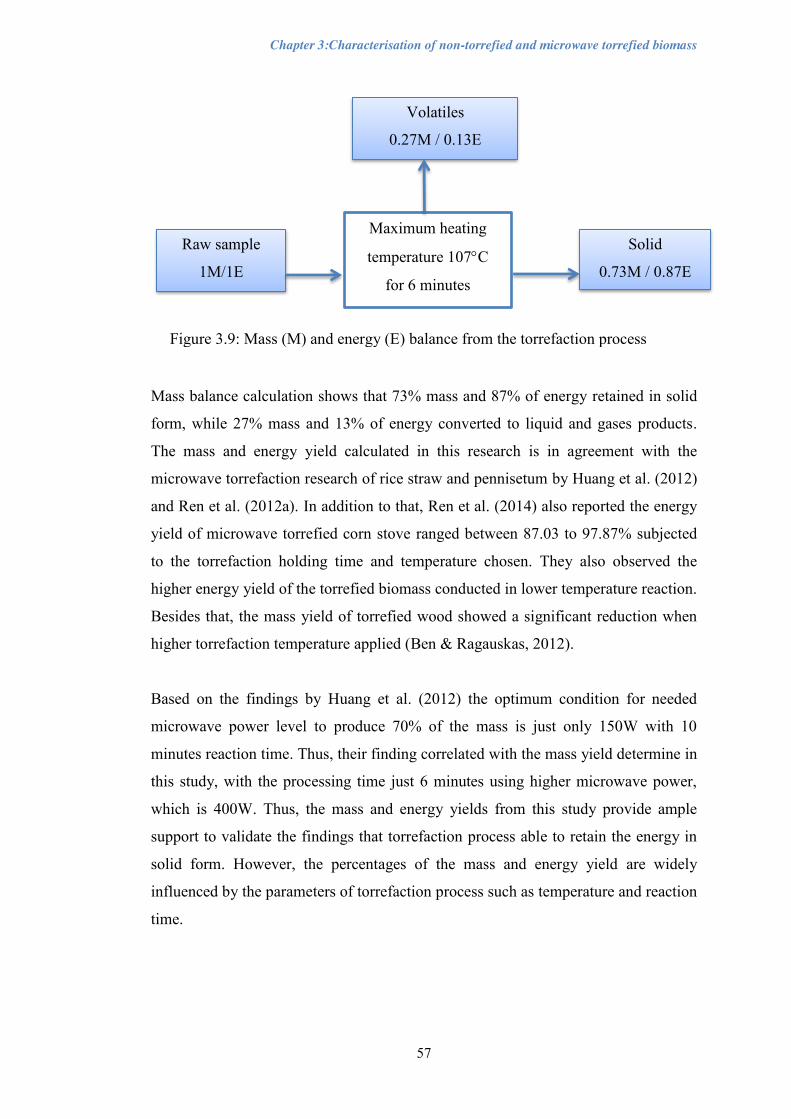
Chapter 3:Characterisation of non-torrefied and microwave torrefied biomass
57
Mass balance calculation shows that 73% mass and 87% of energy retained in solid
form, while 27% mass and 13% of energy converted to liquid and gases products.
The mass and energy yield calculated in this research is in agreement with the
microwave torrefaction research of rice straw and pennisetum by Huang et al. (2012)
and Ren et al. (2012a). In addition to that, Ren et al. (2014) also reported the energy
yield of microwave torrefied corn stove ranged between 87.03 to 97.87% subjected
to the torrefaction holding time and temperature chosen. They also observed the
higher energy yield of the torrefied biomass conducted in lower temperature reaction.
Besides that, the mass yield of torrefied wood showed a significant reduction when
higher torrefaction temperature applied (Ben & Ragauskas, 2012).
Based on the findings by Huang et al. (2012) the optimum condition for needed
microwave power level to produce 70% of the mass is just only 150W with 10
minutes reaction time. Thus, their finding correlated with the mass yield determine in
this study, with the processing time just 6 minutes using higher microwave power,
which is 400W. Thus, the mass and energy yields from this study provide ample
support to validate the findings that torrefaction process able to retain the energy in
solid form. However, the percentages of the mass and energy yield are widely
influenced by the parameters of torrefaction process such as temperature and reaction
time.
Solid
0.73M / 0.87E
Volatiles
0.27M / 0.13E
Maximum heating
temperature 107qC
for 6 minutes
Raw sample
1M/1E
Figure 3.9: Mass (M) and energy (E) balance from the torrefaction process
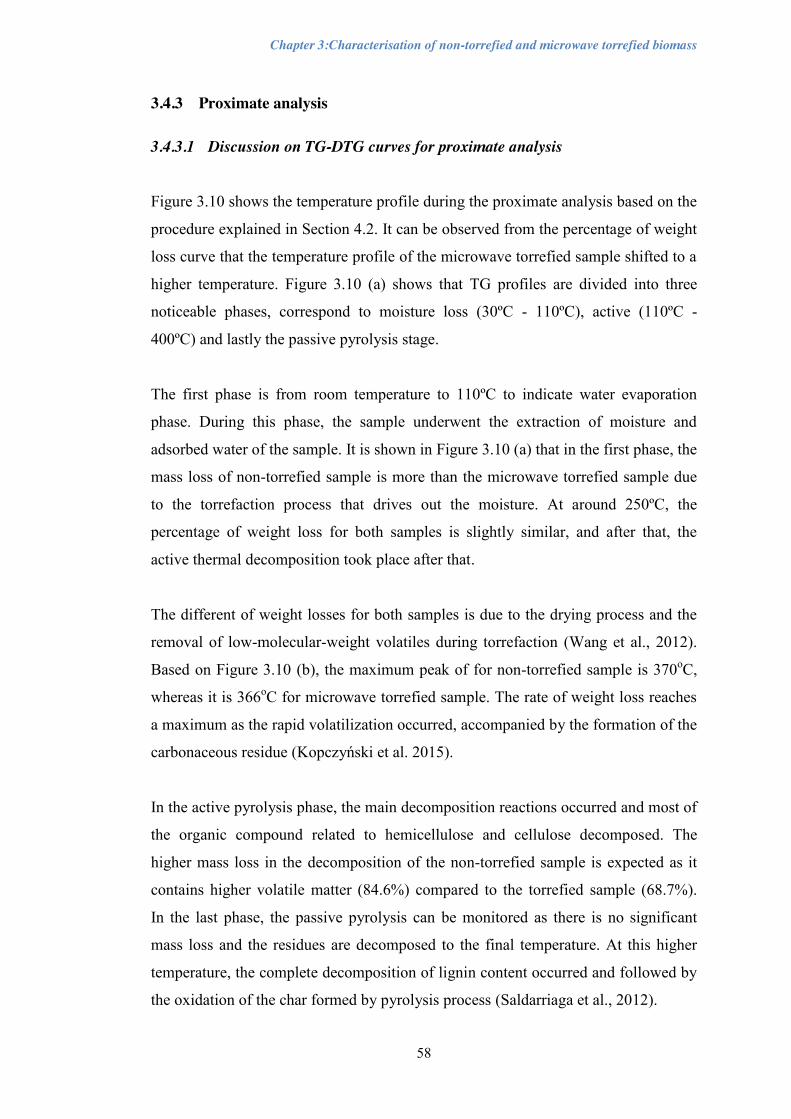
Chapter 3:Characterisation of non-torrefied and microwave torrefied biomass
58
3.4.3 Proximate analysis
3.4.3.1 Discussion on TG-DTG curves for proximate analysis
Figure 3.10 shows the temperature profile during the proximate analysis based on the
procedure explained in Section 4.2. It can be observed from the percentage of weight
loss curve that the temperature profile of the microwave torrefied sample shifted to a
higher temperature. Figure 3.10 (a) shows that TG profiles are divided into three
noticeable phases, correspond to moisture loss (30ºC - 110ºC), active (110ºC -
400ºC) and lastly the passive pyrolysis stage.
The first phase is from room temperature to 110ºC to indicate water evaporation
phase. During this phase, the sample underwent the extraction of moisture and
adsorbed water of the sample. It is shown in Figure 3.10 (a) that in the first phase, the
mass loss of non-torrefied sample is more than the microwave torrefied sample due
to the torrefaction process that drives out the moisture. At around 250ºC, the
percentage of weight loss for both samples is slightly similar, and after that, the
active thermal decomposition took place after that.
The different of weight losses for both samples is due to the drying process and the
removal of low-molecular-weight volatiles during torrefaction (Wang et al., 2012).
Based on Figure 3.10 (b), the maximum peak of for non-torrefied sample is 370oC,
whereas it is 366oC for microwave torrefied sample. The rate of weight loss reaches
a maximum as the rapid volatilization occurred, accompanied by the formation of the
carbonaceous residue (Kopczyński et al. 2015).
In the active pyrolysis phase, the main decomposition reactions occurred and most of
the organic compound related to hemicellulose and cellulose decomposed. The
higher mass loss in the decomposition of the non-torrefied sample is expected as it
contains higher volatile matter (84.6%) compared to the torrefied sample (68.7%).
In the last phase, the passive pyrolysis can be monitored as there is no significant
mass loss and the residues are decomposed to the final temperature. At this higher
temperature, the complete decomposition of lignin content occurred and followed by
the oxidation of the char formed by pyrolysis process (Saldarriaga et al., 2012).

Chapter 3:Characterisation of non-torrefied and microwave torrefied biomass
59
Based on the temperature profile in Figure 3.10 (a), after heating to 800oC
approximately 30% of microwave torrefied sample remained while only
approximately 15% of the non-torrefied sample was left. Therefore, based on the
TGA results, the non-torrefied sample is more reactive to thermal process compared
to the microwave torrefied sample. The increase of reactivity contributed to a more
stable torrefied material after the torrefaction process.
3.4.3.2 Discussion on the composition of the samples
The results of the proximate analysis of both samples were shown in Table 3.1, and
was compared to the range values reported by Vassilev et al. (2015). The properties
of the torrefied biomass found to be in between wood and coal except for volatile
matters, which is relatively higher than the value of coal. However, the upgraded
properties compared to wood are a desirable characteristic needed for the usage of
torrefied biomass as alternative fuel.
The moisture content of the non-torrefied sample is 6.9% and decreases to 2.2% after
the torrefaction process. The reduction is more than 50% compared to the non-
torrefied sample. The reduction is expected due to one of the advantages of
torrefaction process that include reduced moisture content. Besides that, torrefaction
is also proven to reduce the water adsorption capacity and acquired hydrophobicity
nature of the resultant products (Satpathy et al. 2014; Huang & Hsu 2012; Li et al.
2012; van der Stelt et al. 2011). In addition to that, Tumuluru et al. (2011) suggested
that hydrophobicity nature was due to the loss of the low-volatility components and
extractive during the torrefaction.
(a) (b)
Figure 3.10: Temperature profile of TG of weight loss curve (a) and DTG curves (b)

Chapter 3:Characterisation of non-torrefied and microwave torrefied biomass
60
Table 3.1: Proximate analysis of non-torrefied and microwave torrefied samples in comparison with coal
Proximate Analysis (wt.%) Non-torrefied sample
Microwave torrefied sample
1Coal
Moisture content 6.90 2.20 0.4 – 20.2
Volatile matter 84.60 68.70 12.2 – 44.5
Fixed carbon 3.90 18.60 17.9 – 70.4
Ash* 4.70 10.5 5.0 – 48.9
* Content is obtained by difference 1Source: Vassilev et al. (2015)
Volatile matters refer as the components released, including combustible gases (CxHy
gases, CO or H2) and some incombustible part (CO2, SO2 or NOx) when the sample
heated at high temperature. The volatile matters in the torrefied sample are slightly
lower than the non-torrefied sample, due the changes occur through product’s
devolatilization during the torrefaction process. During the microwave torrefaction
process, the condensable volatile matters were condensed into a liquid such as bio-
oil. The values of the volatile matter in the both samples are higher than the one
found in coal. According to Chiang et al. (2012), the material with higher volatile
matter will has lower ignition temperature and high ignition stability to produce
synthesis gas during the biomass gasification process. They also added that, the
finding indicated that the coals exhibit less volatility during thermal conversion
process.
The composition of volatile matters observed to reduce from 84.6% to 68.7%, which
is a reduction of 18.79% for the microwave torrefied sample compared to the non-
torrefied sample. The reduction was due to the decomposition of the hemicelluloses
to volatiles matter while partly decomposition occurred for cellulose and lignin.
However, the degree of decomposition is subject to the parameters of torrefaction
process such as reaction temperature (Huang et al., 2012). The study by Wang et al.
(2012) indicated that with increased processing time and certain power level; the
reaction could become more complete, which resulted in a further degree of
decomposition of lignocelluloses that eventually lead to more removal of volatiles

Chapter 3:Characterisation of non-torrefied and microwave torrefied biomass
61
from the biomass. The reduction of the volatile matters in the microwave torrefied
biomass may suggest the lower reactivity of the material.
Fixed carbon is the carbon that is left after volatile materials are driven off during the
torrefaction process due to the conversion of hemicellulose into the more thermally
stable compound. In this work, the fixed carbon content in the torrefied sample
showed a significant increase compared to its non-torrefied sample. The fixed carbon
in the microwave torrefied sample is almost five times higher than the non-torrefied
sample. Based on the proximate analysis done, the fixed carbon in the non-torrefied
sample is 3.9% whereas for the microwave torrefied sample is 18.6%. The fixed
carbon found in microwave torrefied sample was within the range of the one found in
coal. This showed that thermal properties of the material had been upgraded
comparable to coal.
Ash is an inorganic part of the sample, which left after the complete combustion
occurs. Ash content in the torrefied sample is over two times higher than to the non-
torrefied sample. Where the ash content in torrefied biomass samples is 10.5%
compared to only 4.7% in the non-torrefied sample. The increased value of the ash
content can be seen in most of the torrefied biomass either using microwave induced
method or conventional torrefaction process (Poudel & Oh, 2014; Satpathy et al.,
2014; Huang et al., 2012; Fisher et al., 2012). Furthermore, Wu et al. (2015) stated
that ash content of microwave pyrolysis biomass at is higher than the one produced
using conventional pyrolysis process. Thus, it can be suggested that the method of
heating using microwave have some effect on the ash content.
Based on the research of self-heating on coal; higher ash content will lead to slower
self-heating rate (Beamish, Lin, & Beamish, 2012) as the ash can block the active
site. Thus the ash content reduced the reactivity of the torrefied biomass as the
accumulation of the ash on the surface reduces the direct contact for the oxidation
process. However, high ash content will also lead to several problems such as a
reduction in heating value, and the ash deposits can cause extensive equipment
maintenance during the thermal treatment (García et al., 2012). Consequently, Khan
et al. (2009) had concluded that the difficulty related to high ash content in biomass
as the biggest technical challenge.

Chapter 3:Characterisation of non-torrefied and microwave torrefied biomass
62
Thus, it is agreeable to findings by earlier researchers that acknowledged the
torrefaction process as a highly proven method to reduce moisture content and
volatile matter as well as increase the fixed carbon and ash content (Cruz Ceballos,
Hawboldt, & Hellleur, 2015; Kopczyński, Plis, & Zuwała, 2015; Peng et al., 2013;
Agar & Wihersaari, 2012; Bridgeman et al., 2008).
3.4.4 Ultimate analysis
Table 3.2 shows the comparison of the chemical composition of the samples as
compared to the range values reported for coal in Vassilev et al. (2015). Sulphur
content was below the detected limit of the equipment. Therefore, the sulphur
content is discarded in the analysis. Based on a review by Vassilev et al. (2015) and
Yin et al. (2008), the low Sulphur content is an excellent characteristic in biomass
fuel as it leads to lower SO2 emissions and limited production of fine particulates,
deposit formation and corrosion during the thermochemical process. Therefore, it is
safe to consider that the microwave torrefied sample in this study demonstrates a
desirable characteristic as alternative fuels to coal.
During torrefaction process, the biomass loses oxygen and hydrogen due dehydration
of water and organic reaction products, for example, acetic acid, furans, methanol
and gases that contain a substantial amount of oxygen such as CO2 and CO
(Bergman & Kiel, 2005). The percentage of H and O content in the microwave
torrefied sample is less than the non-torrefied sample. While the nitrogen and carbon
content are higher in the microwave torrefied sample compared to the non-torrefied
sample.
The trend presented in Table 3.2 are similar to the findings by Prins, (2005); Ren et
al. (2012); Huang & Hsu (2012); Poudel & Oh (2014); Cruz Ceballos et al. (2015);
Kopczyński et al. (2015) where similar pattern of increased carbon and decreased of
oxygen content in torrefied biomass has been found; despite the method of
torrefaction used.

Chapter 3:Characterisation of non-torrefied and microwave torrefied biomass
63
Table 3.2: Ultimate analysis of non-torrefied and microwave torrefied samples in comparison to coal
Ultimate Analysis (wt.%) Non-torrefied
sample
Microwave
torrefied
sample
1Coal
C 54.4 61.50 62.9 – 86.9
H 7.70 6.80 4.4 – 29.9
N 1.70 3.80 3.5 – 6.3
O* 36.2 27.90 0.5 – 2.9
O/C 0.67 0.45 -
H/C 0.14 0.11 -
* Content is obtained by difference 1Source: Vassilev et al. (2015)
The carbon content of the microwave torrefied sample showed an increase of roughly
13% compared to the non-torrefied sample. The increase is due to the carbon
preservation after torrefaction process completed. Besides that, nitrogen content rose
from 1.7% in the non-torrefied sample to 3.8% in microwave torrefied sample.
According to ultimate analysis of the torrefied biomass by (Prins, 2005; Kopczyński
et al. 2015), they had found a relationship between the torrefaction temperature and
the amount of oxygen and carbon left in the torrefied biomass. Where the higher the
torrefaction temperature is applied, the lower the oxygen content left in the sample.
While for the carbon content, it increased with the increase of torrefaction
temperature.
The findings in this research followed the pattern in Wang et al. (2013) where the
hydrogen and oxygen content in torrefied sample decreased, and this may be due to
the release of volatiles that rich in hydrogen and oxygen such as water and carbon
dioxide. The release of water can be proved based on the earlier discussed findings in
the proximate analysis that showed a reduction of 68% moisture content in the
torrefied sample compared to its raw material.
Moreover, the common trend in torrefied sample is a reduction of H/C and O/C ratio
compared to its raw material can be observed in several studies on torrefied biomass
Chapter 3:Characterisation of non-torrefied and microwave torrefied biomass
64
such as (Satpathy et al., 2014; W.H. Chen et al., 2013; Arias et al., 2008; Huang et
al., 2008; Prins, 2005). The reduction of hydrogen and oxygen had been described
due to the water, carbon dioxide and carbon monoxide production during the
torrefaction process.
The H/C ratio for the non-torrefied sample is 0.14, and it decreased to 0.11 in the
torrefied material. The reduction of 21.43% H/C ratio is due to the removal of
moisture content during torrefaction where decomposition of hemicellulose and
dehydration of lignin and cellulose simultaneously occurred. The removal of the
moisture content and the reduction of the H/C ratio leads to higher calorific value.
Therefore based on a study by Poudel & Oh (2014) the O/C and H/C ratios are found
to reduce with an increase of the torrefaction temperature where further removal of
hydrogen and oxygen occur at a higher temperature. According to Tumuluru et al.
(2011) the reduction of O/C and H/C also reduced the energy loss, produced less
smoke and water vapour during combustion and gasification process. Therefore,
those reductions are desirable characteristics in the utilisation of biomass fuels as a
substitute for coal.
The reduction of O/C ratio in microwave torrefied sample increases the resistance to
thermal degradation. Therefore, one of the objectives of torrefaction processes is to
produce biomass fuels that resistance to thermal degradation. The O/C ratio in the
torrefied sample is 0.45 compared to 0.67 for its non-torrefied sample. The lower
O/C ratio contributes to the higher yield during gasification compared to its raw
material (Prins et al., 2006a). The work by Satpathy et al. (2014) presented a
relationship between H/C and O/C ratios, where the ratio decreased with increase in
power and reaction time of microwave torrefaction process.
The ultimate analysis shows that the torrefaction process had improved the quality of
the biomass fuels. According to Valix et al. (2016) the H/C and O/C ratios of
various types of coal are between 1.02 - 0.078 and 0.4 - 0.08 respectively. The value
of the H/C and O/C ratios for the microwave torrefied lies in the ranges stated, which
reflects that its properties had improved closer to coal.

Chapter 3:Characterisation of non-torrefied and microwave torrefied biomass
65
In addition to that, similar to the finding by Valix et al., (2016) that indicated the
reduction of the H/C content suggested the increase in aromaticity which leads to the
better resistance to biological degradation. The same findings of increases in the
degree of aromaticity for the sludge that had to undergo the pyrolysis process can be
found in (Kan, Strezov, & Evans, 2016). A recent study of the off-gas emissions
during storage of torrefied biomass had proved that the biological degradation was
not the reason that contributed to the emission (Tumuluru et al., 2015). Thus, it can
be concluded that the microwave torrefaction process had improved the resistance
toward biological degradation.
In term of a tendency to the self-heating, García Torrent et al. (2016) have observed
that biomass with higher H/C has higher tendency to self-ignite and this finding seem
to contradict to the behaviour witnessed in coal. However, they suggested that the
inconsistency could be due to different mechanisms of self-heating development that
lead to self-ignition in biomass in comparison to coal. Thus, according to that
observation, the non-torrefied sample will have a higher tendency to self-heat
compared to microwave torrefied sample. However, this initial assumption needs to
be clarified using thermal analysis to get an accurate measurement of the tendency of
the samples to self-heat.
3.4.5 True density and bulk density
Based on the experiments done, the true density of the non-torrefied sample is 1451
kg/m3 and 1442 kg/m3 for microwave torrefied sample. It can be seen here that the
true density of the microwaved torrefied sample is lower than the non-torrefied
sample. The reduction is expected due to the lower volatile matters in the microwave
torrefied sample, which resulted in more pore volumes.
The bulk densities calculated are 443 kg/m3 and 500 kg/m3 for non-torrefied sample
and microwave torrefied sample respectively. The increased of the bulk density
proved that the energy density increased after torrefaction process (Satpathy et al.,
2014; Medic, 2012; Shang, 2012). The reduction of the bulk density due to the
evaporating water and volatiles matters in the biomass by the torrefaction process.

Chapter 3:Characterisation of non-torrefied and microwave torrefied biomass
66
3.5 Summary
x The torrefaction process upgrades the quality of the biomass, where the calorific
value of the microwave torrefied sample increases to 22 MJ/kg from the 18.4
MJ/kg in the non-torrefied sample. The bulk densities are 443 kg/m3 and 500
kg/m3 for non-torrefied sample and microwave torrefied sample respectively.
x The upgraded biomass fuels produced from the torrefaction process is more
reactive compared to the non-torrefied fuels. The TG curve of the microwave
torrefied sample shifted to higher temperature region compared to non-torrefied
sample, which indicated the higher reactivity of the sample non-torrefied sample.
x The moisture content reduced from 6.9% in the non-torrefied sample to 2.2% of
microwave torrefied sample. Volatile matters reduced from 84.6% in the non-
torrefied sample to 68.7% in microwave torrefied sample.
x The fixed carbon content in the non-torrefied sample is 3.9% whereas, for the
microwave torrefied sample the content increased to 18.6%.
x The ash content in torrefied biomass samples is 10.5% compared to only 4.7% in
the non-torrefied sample.
x O/C and H/C ratio decreased after the torrefaction process, which is one of the
desirable characteristics of using torrefied biomass fuel as an alternative to coal.
The O/C ratio is 0.67 in the non-torrefied sample and 0.45 in microwave torrefied
sample. Whereas, the H/C ratio is 0.14 in the non-torrefied sample and 0.11 in
microwave torrefied sample.
x The true density of the non-torrefied sample is 1451 kg/m3 and 1442 kg/m3 for
microwave torrefied sample. Experimental determination of reactivity and kinetic
parameters using thermogravimetric analysis
Chapter 4:Experimental determination of reactivity and kinetic parameters using thermogravimetric analysis
67
Chapter 4 Experimental determination of reactivity and kinetic parameters using thermogravimetric analysis
This chapter consists of the evaluation of the samples reactivity based on their
thermal behaviour using thermogravimetric (TG) analysis and the kinetic parameters
determination of the thermal decomposition of biomass in the air and inert condition
using nitrogen as carrier gas. The objectives of this chapter are:
(a) to evaluate the thermal decomposition behaviour of the torrefied and non-
torrefied biomass sample in air and nitrogen;
(b) to determine the characteristic temperature of both samples to analyse their
reactivity; and
(c) to establish the kinetic parameters of the torrefied and non-torrefied biomass
sample to evaluate their propensity of self-heating.
4.1 Equipment and method used for thermal behaviour analysis
TG analysis is used to obtain the critical parameters based on their heating
behaviour. The thermogravimetric analysis of the sample was performed using a
TGA 4000 (Perkin Elmer, USA). The weight loss of sample due to thermal
degradation in the different carrier gas at the various heating rate was observed in
this experiment. Only a small amount of sample needed for each test as this will
ensure the uniformity of the sample. Samples weighing around 18-20mg were used
for throughout the analysis.
There are three methods conducted in this study to analyse the thermal behaviour of
the samples. The methods employed are as below:
a) Thermal behaviour in air and inert condition This approach was used to assess the reactivity of the material that prone
to self-heat. The reactivity of the samples is evaluated by identifying the
mass loss behaviour of the samples when heated at fixed heating rate
using air and nitrogen as a carrier gas. Nitrogen is used as a comparison

Chapter 4:Experimental determination of reactivity and kinetic parameters using thermogravimetric analysis
68
of the thermal behaviour in an inert environment. The samples were
subjected to several heating rates namely 1oC/min and 5oC/min from
ambient temperature to 900oC in the air. The flow of carrier gas is fixed at
50ml/min throughout the experiment. The heating rate of 1oC/min was
chosen to represent the slow heating rate of self-heating behaviour, which
allows a fully developed exothermic reaction in order to determine the
temperature of initial combustion (TIC). While 5oC/min was chosen for
the evaluation of the thermal characteristic of both sample in air and inert
condition.
b) Susceptibility evaluation in oxygen
The TG analysis in the oxygen was done to fine a single point oxidation
temperature. The carrier gas used in this analysis is oxygen, and the flow
is fixed at 50ml/min. The heating rate is set to 40°C/min. The same
condition applied to both samples.
c) Kinetic parameter determination
Samples were heated from ambient temperature to 900°C in air at a
heating rate of 5, 10, 20 and 30°C/min. The flow of carrier gas is fixed at
50ml/min throughout the experiment. The selected heating rates are
chosen based on the study done by Benitez, (2014) where the heating rate
higher than 50°C/min had been proved to produce TGA curves with high
variability and rapid changes.
Each experimental run was repeated at least three times, and the curves for each
heating rates were compared to check the reproducibility. The reproducibility was
verified by comparing the temperature, the conversion and weight derivative at peak
DTG curve for each heating rate. In addition to that, a constant gas flow is chosen to
achieve a low noise TG reading (Mansaray & Ghaly, 1999).
Chapter 4:Experimental determination of reactivity and kinetic parameters using thermogravimetric analysis
69
4.2 Evaluation of thermal reactivity
4.2.1 Thermal decomposition characteristic
The method employed for the analysis of intrinsic reactivity was explained in Section
4.1. Air was used as carrier gas because this study focuses on the behaviour of the
sample during storage in an air atmosphere. Nevertheless, the analysis was extended
using nitrogen to compare the thermal decomposition behaviour of the sample in an
inert environment.
4.2.1.1 Thermal decomposition in air
For the evaluation purposes, the temperature profiles of thermal decomposition in the
air at 5oC/min is presented to evaluate the reactivity of the samples in air at a low
heating rate. The low heating rate for the reactivity evaluation in the air had been
chosen to allow a fully developed exothermic reaction as suggested by Della Zassa et
al. (2013).
Figure 4.1 shows the temperature profile of both sample during TG analysis in the air
at 5°C/min. The graph indicates that the thermal decomposition of microwave
torrefied sample shifted to a higher degree compared to the non-torrefied sample.
This pattern represents the sample’s reactivity in an air stream at 5°C/min, where
non-torrefied sample seems to decompose in the air at a lower temperature than the
microwave torrefied sample. Based on the TG analysis, 10% weight loss was
identified at the temperature of 252°C for the non-torrefied sample. However, for the
microwave torrefied sample, the same weight loss was achieved at 267°C. Therefore,
based on the TG analysis in air, the non-torrefied sample is more reactive in the air
compared to the microwave torrefied sample.
The same pattern was reported by several researchers when comparing the
temperature profile of the torrefied sample to its raw materials such as for Cruz
Ceballos et al. (2015); Kopczyński et al. (2015); Mašek et al. (2013); Ren et al.
(2013). A study by Ren et al., (2013) indicates the relationship of the degree of the
shift with the severity of torrefaction condition and the same relationship can be
observed in Cruz Ceballos et al. (2015). In both studies, the decomposition of the

Chapter 4:Experimental determination of reactivity and kinetic parameters using thermogravimetric analysis
70
torrefied biomass seems to shift to a higher degree for the biomass that exposed to
higher reaction temperature during the torrefaction process.
From the rate of mass loss shown in DTG graph (Figure 4.2), three clear peaks can
be observed for both samples. The first peak represents the moisture driven out from
both samples. Based on the graph, more derivative weight loss occurred in the non-
torrefied sample at the first peak compared to the microwave torrefied sample
because of the different value of moisture content. Based on the proximate analysis,
the moisture content of the non-torrefied sample is 6.9%, while for microwave
torrefied sample only 2.2%. Thus, increasing the temperature from ambient to about
110°C resulted in the weight losses due to the moisture content in the samples.
Figure 4.1: Temperature profile for thermal decomposition in air at 5°C/min
Figure 4.2: Derivative weight loss in air at 5°C/min
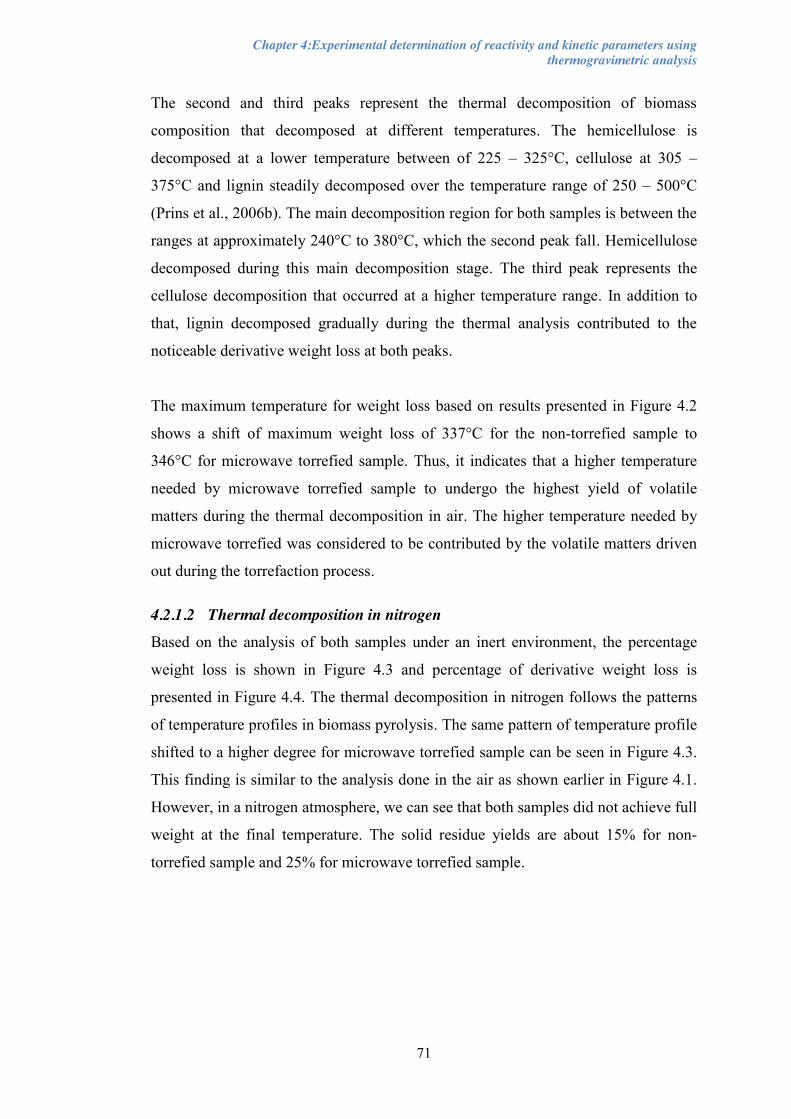
Chapter 4:Experimental determination of reactivity and kinetic parameters using thermogravimetric analysis
71
The second and third peaks represent the thermal decomposition of biomass
composition that decomposed at different temperatures. The hemicellulose is
decomposed at a lower temperature between of 225 – 325°C, cellulose at 305 –
375°C and lignin steadily decomposed over the temperature range of 250 – 500°C
(Prins et al., 2006b). The main decomposition region for both samples is between the
ranges at approximately 240°C to 380°C, which the second peak fall. Hemicellulose
decomposed during this main decomposition stage. The third peak represents the
cellulose decomposition that occurred at a higher temperature range. In addition to
that, lignin decomposed gradually during the thermal analysis contributed to the
noticeable derivative weight loss at both peaks.
The maximum temperature for weight loss based on results presented in Figure 4.2
shows a shift of maximum weight loss of 337°C for the non-torrefied sample to
346°C for microwave torrefied sample. Thus, it indicates that a higher temperature
needed by microwave torrefied sample to undergo the highest yield of volatile
matters during the thermal decomposition in air. The higher temperature needed by
microwave torrefied was considered to be contributed by the volatile matters driven
out during the torrefaction process.
4.2.1.2 Thermal decomposition in nitrogen
Based on the analysis of both samples under an inert environment, the percentage
weight loss is shown in Figure 4.3 and percentage of derivative weight loss is
presented in Figure 4.4. The thermal decomposition in nitrogen follows the patterns
of temperature profiles in biomass pyrolysis. The same pattern of temperature profile
shifted to a higher degree for microwave torrefied sample can be seen in Figure 4.3.
This finding is similar to the analysis done in the air as shown earlier in Figure 4.1.
However, in a nitrogen atmosphere, we can see that both samples did not achieve full
weight at the final temperature. The solid residue yields are about 15% for non-
torrefied sample and 25% for microwave torrefied sample.
Chapter 4:Experimental determination of reactivity and kinetic parameters using thermogravimetric analysis
72
Figure 4.3: Temperature profile for thermal decomposition in nitrogen at 5°C/min
Three regions can be witnessed in Figure 4.4. Those regions correspondent to the
moisture driven out process, active and passive pyrolysis. The first region follows the
same pattern as thermal decomposition in air. The active pyrolysis phase occurs at
the second region which lies in a range from 120°C to 425°C for heating rate
5°C/min. In this region, only one clear peak is observed, which represents the highest
derivative weight loss. Furthermore, there is no third peak can be seen in DTG curve
of the thermal decomposition in nitrogen due to the reaction in air added the stage of
charring (Liu et al., 2016).
Similar to the thermal decomposition in the air, the temperature where the highest
derivative weight loss occurs shifted to a higher temperature for the microwave
torrefied sample. Based on Figure 4.4, the temperature is 370°C for non-torrefied
sample and 372°C for microwave torrefied sample. The value of the temperature that
higher weight loss occurred for both sample in nitrogen is slightly higher compared
to the analysis done in air. The pattern found here proved that higher reaction
temperature is needed to achieve the highest derivative weight loss in an inert
environment.

Chapter 4:Experimental determination of reactivity and kinetic parameters using thermogravimetric analysis
73
Figure 4.4: Derivative weight loss in nitrogen at 5°C/min
Based on the analysis of temperature profiles presented here, the non-torrefied
sample can be proposed as a higher reactivity material compared to the microwave
torrefied sample. Thus it can be said that torrefaction process helps to upgrade the
thermal properties of the microwave torrefied sample, which leads to a higher
thermal stability due to less volatile matters (Agar & Wihersaari, 2012).
4.2.2 Temperature of initial combustion (TIC)
The temperature of initial combustion is essential in reactivity analysis because it
reflects the starting point of the volatile matters to decompose after moisture driven
out from the material. The more reactive material will have lower TIC, due to the
ease of the material to react in the air. Determination of the TIC was done based on
the thermal degradation behaviour of the samples at 1ºC/min in air. The temperature
profile used to find the TIC is shown in Figure 4.5.
Following the method to determine the TIC as explained in Ramírez et al. (2010),
TIC for the non-torrefied sample is 268°C, whereas 283°C for the microwave
torrefied sample. These values agree with the analysis done in 5°C/min, which
concluded that the non-torrefied sample is more reactive compared to the non-
torrefied sample.
First region
Second region
Third region

Chapter 4:Experimental determination of reactivity and kinetic parameters using thermogravimetric analysis
74
Figure 4.5: Determination of temperature of initial combustion (TIC)
The increase in the initial combustion (TIC) for the microwave torrefied sample is
consistent with the observed reduction of the volatile matter as been shown in Table
3.1. The increase of temperature had suggested that the decrease of the combustible
volatile matters due to the torrefaction process. The same behaviour can be found in
Liu et al. (2016) where the temperature of initial combustion of the torrefied biomass
also shifted to a higher temperature in their research. They also mentioned that the
finding might result in higher combustion efficiency and reduction of emissions in
the combustion process of the torrefied biomass.
4.2.3 Temperature at maximum weight loss (TMWL)
To compare the propensity of self-heating for the non-torrefied sample and
microwave torrefied sample. The TG analysis in the air is done at 1°C/min based on
method explained in Section 4.1(a). The heating rate of 1°C/min is chosen to portrait
a prolonged heating in an air atmosphere. The slow heating rate allows a more rapid
thermal energy supplied to the sample during the decomposition process (Slopiecka,
Bartocci, & Fantozzi, 2012) in longer reaction time.

Chapter 4:Experimental determination of reactivity and kinetic parameters using thermogravimetric analysis
75
Figure 4.6: Determination of temperature of maximum weight loss in air at 1°C/min
Figure 4.6 shows the DTG analysis at 1°C, where the maximum derivative weight
loss is 310°C for non-torrefied sample and 312°C for microwave torrefied sample.
Thus, the temperatures of maximum derivative weight loss demonstrate that
microwave torrefied sample is less reactive compared to the non-torrefied sample.
The temperature difference is too small, only exceed 2°C for microwave torrefied
sample compared to the non-torrefied sample. This slight difference makes it hard to
distinguish the reactivity between the two samples. The differences suggested that
both materials reacted slightly similar in the air. The samples need to be tested under
oxygen stream in order to get a clear justification on this matter which is discussed in
Section 4.2.4. However, the TMWL determined for both samples from the TG
analysis are in agreement with the finding by DTI (2013) for pine chips torrefaction
that showed sign of self-ignition at temperatures above 200 ºC.
4.2.4 Characteristic oxidation temperature (Tcharac)
To get a single point oxidation temperature, the TG analysis using oxygen as a
carrier gas is done. The temperature profile of the analysis is shown in Figure 4.8.
The characteristic oxidation temperature is an important parameter since it can be
used with the activation energy to give a comparative assessment of the self-heating
propensity (Saddawi et al., 2013).

Chapter 4:Experimental determination of reactivity and kinetic parameters using thermogravimetric analysis
76
Based on the graph presented in Figure 4.7, a single oxidation temperature can be
assigned to the sample. Tcharac for the non-torrefied sample and microwave torrefied
sample are 331°C and 329°C respectively. The results of Tcharac for the samples
imply that the microwave torrefied sample is more reactive compared to the non-
torrefied sample. The finding, similar to the study by Cruz Ceballos et al. (2015),
where they found that torrefaction had caused depletion of volatiles component
which increases the available surface of active sites for oxidation which will lead to
self-heating. The occurrence can only be seen clearly when the TG analysis was done
in oxygen stream.
Figure 4.7: Determination of Tcharac under oxygen stream at 40°C/min.
However, the reactivity susceptibility of the material in the air based on Tchar
contradict with the earlier conclusion based on TIC and TMWL that reveals non-
torrefied sample is more reactive than the microwave torrefied sample. Therefore,
further investigation using kinetic parameters analysis is needed to confirm the
reactivity of the samples in air.

Chapter 4:Experimental determination of reactivity and kinetic parameters using thermogravimetric analysis
77
4.3 Results of kinetic parameters using thermogravimetric analysis
4.3.1 Background on determination of kinetic parameters
It is important to understand the reaction kinetic of the oxidation process that takes
place at a low temperature in order to assess the risk of self-heating events that lead
self-heating. Based on the study of intrinsic reactivity of coal chars in Sima-Ella et
al. (2005), the activation energy affected the temperature sensitivity of the material,
while the pre-exponential factor is related to the material structure (Sima-Ella, Yuan,
& Mays, 2005). Consequently, due to the similarity of the properties of the
microwave torrefied sample and coal, it is suggested that its behaviour will follow
the same intrinsic reactivity. Therefore, in this study, it is sufficient to characterise
the reactivity by its activation energy value only for both samples. However, due to
the limited volume of samples, the kinetic study using adiabatic oven test as
described in BS 15188 (2007) cannot be applied.
Thermogravimetric (TG) analysis is widely used to obtain kinetic parameters for the
low-temperature oxidation. The mass changes of the material obtained from TG
analysis at several heating rates is seen as a useful tool for determination of kinetic
parameters of solid-state reactions (Carrier et al., 2016; Prins, 2005). There are
many different methods developed to quantify the mass changes reactions and
commonly categorised as model-fitting and model-free methods. For the model-
fitting method, different models are fits to the experimental data and the model
giving the best statistical fit is selected. The evaluations of the model were done from
which the activation energy (Ea) and frequency factor (A).
The model fitting methods were broadly used because kinetic parameters can be
calculated directly from the thermogravimetric analysis results. However, these
methods have several disadvantages. One of the major advantages, has been
discussed in Heydari et al. (2015) is their inability to select the appropriate reaction
model uniquely, and the comparison of results from these models can be challenging
as the wide range of kinetic parameters in non-isothermal data.
Chapter 4:Experimental determination of reactivity and kinetic parameters using thermogravimetric analysis
78
Hence, in this research, a model-free method is adopted to calculate the kinetic
parameter of the sample decomposition. This model is much simple to apply and can
allow the determination of the kinetic parameters for different constant extents of the
conversion without considering any particular form of reaction model (Heydari,
Rahman, & Gupta, 2015). The determination is possible because this method
involves reaction rate that depends on the extents of conversion to product, where
several kinetic curves involve in the calculation of the activation energy at the
different heating rates on the same value of the conversion. The method of using
multiple heating rates is proven more efficient compared to single heating rate.
Thus for non-isothermal experiments, each run need to be done under the same
experimental conditions, such as same sample weight, purge gas rate and sample
size, then the only variable is the heating rate. The temperature sensitivity of the
reaction rate depends on the extent of conversion to products. A parameter called
conversion degree (α) is defined for the subsequent analysis of each phase of the
decomposition process.
Changes of air to the inert environment resulted in the increase in values of
activation energy, as the decomposition in the air is significantly faster compared to
the decomposition process in an inert atmosphere. Thus, in this section the discussion
of the comparison of the behaviour of the sample for the thermal decomposition in
inert and air atmosphere. For the numerical modelling of the self-heating behaviour,
the kinetic parameters for the thermal decomposition in air atmosphere are used.
4.3.2 Kinetic analysis method
The simplest way for modelling the complex thermal decomposition process is using
empirical model, which uses global kinetics. The Arrhenius expression is used to
correlate the rate of mass loss and temperature during the thermal decomposition.
The thermal decomposition of biomass followed the reaction as below:
𝐵𝑖𝑜𝑚𝑎𝑠𝑠 𝑘 → 𝑉𝑜𝑙𝑎𝑡𝑖𝑙𝑒𝑠 + 𝐶ℎ𝑎𝑟
The general rate of decomposition or reactivity,𝑘 can be characterised in term of
temperature dependent reaction, 𝑘(𝑇). This temperature dependent reaction obeys

Chapter 4:Experimental determination of reactivity and kinetic parameters using thermogravimetric analysis
79
the Arrhenius Eq. that is represented by activation energy Ea (J/mol) and a pre-
exponential factor, A (s-1) which expressed by:
𝑘(𝑇) = 𝐴 𝑒𝑥𝑝 (− 𝐸𝑎𝑅𝑇) (Eq. 4.1)
where T is the absolute temperature and gas constant, R = 8.314JK-1mol-1
The study by Benitez (2014) described the first order reaction model as the reaction
model that fit better for biomass decomposition. Therefore, this study assumed the
decomposition of biomass follows the first-order reaction model. Thus, the reactivity
of the decomposition over time, 𝑑𝛼𝑑𝑡
can be described in Eq. 4.2:
𝑑𝛼𝑑𝑡= 𝑘(1 − 𝛼) (Eq. 4.2)
Where the degree of conversion, 𝛼 or the fractional weight conversion is represented
by the decomposed amount of the sample as shown in Eq. 4.3. 𝑤𝑖 is the sample
weight, 𝑤𝑜 is the original sample weight and 𝑤∞ is the residual or final mass after
decomposition. The conversion degree, α varies from 0 to 1, indicating 1 as end of
conversion phase with no mass loss at 1
𝛼 = ( 𝑤𝑜−𝑤𝑖𝑤𝑜−𝑤∞
) (Eq. 4.3)
Under non-isothermal analysis, where the heating rate is maintained constant for
each test, the temperature changes at a constant positive rate, 𝛽 = 𝑑𝑇𝑑𝑡
. The rate of
decomposition reaction of biomass is described as a function of temperature instead
of time by combining Eq. 4.1 and Eq. 4.2 leads to Eq. 4.4 as below:
𝑑𝛼 𝑑𝑇= 𝐴(1−𝛼)
𝛽𝑒𝑥𝑝 (− 𝐸𝑎
𝑅𝑇) (Eq. 4.4)
The Eq. 4.4 is solved using integration subject to initial condition 𝛼 = 0, 𝑇 = 𝑇𝑜 to
get:
ln(1 − 𝛼) = − 𝐴𝛽 ∫ 𝑒𝑥𝑝 (− 𝐸𝑎
𝑅𝑇)𝑇
𝑇𝑜 (Eq. 4.5)
since there is no decomposition where (α=0) up to To (ignition temperature), the limit
of the integral are conventionally changed to ∫ exp (− 𝐸𝑅𝑇)𝑇
0 , which leads to
introduction of function p(x) as in Eq. 4.6, where 𝑥 = 𝐸𝑎𝑅𝑇
𝑝(𝑥) = ∫ exp(−𝑥)𝑥2
∞𝑥 𝑑𝑥 (Eq. 4.6)

Chapter 4:Experimental determination of reactivity and kinetic parameters using thermogravimetric analysis
80
Thus, Eq. 4.6 reduces to:
ln(1 − 𝛼) = −𝐴𝐸𝑎𝛽𝑅𝑝(𝑥) (Eq. 4.7)
Based on the equation above, Doyle’s and Coats-Redfern’s approximations are
adopted, due to their simplicity and easier manipulation of linear forms (Sima-Ella,
Yuan, & Mays, 2005). For temperature integral approximation, Doyle suggested a
linear approximation to the temperature integral, which is derived by observing a
linear relationship between ln 𝑝(𝑥)and x as: 𝑝(𝑥) ≈ exp (−5.33 − 𝑥). Consequently,
the linear for of Eq. 4.7 can be manipulated into Eq. 4.8 as below:
ln[−ln(1 − 𝛼)] = 𝑙𝑛 (−𝐴𝐸𝑎𝛽𝑅) − 5.33 − 1.052 (𝐸𝑎
𝑅𝑇) (Eq. 4.8)
Hence the linear Eq. can be solved for a specific heating rate, E and A can be
determined from value of the slope and the intercept of plot ln[−ln(1 − 𝛼)] versus
1/T. Meanwhile, in the integral approximation by Coat-Redfern, rearranging the Eq.
4.4 and integrating the temperature the Eq. 4.9 can be obtained:
𝑙𝑛 [−ln (1−𝛼)𝑇2
] = ln (𝐴𝐸𝑎𝛽𝑅) − 𝐸𝑎
𝑅𝑇 (Eq. 4.9)
Thus the kinetic data in this study will be interpreted using the temperature integral
approximation based on the plot of ln [− ln(1−𝛼)𝑇2
] versus 1𝑇, which will give the values
of A and Ea from the intercept and slope respectively.
4.3.3 Kinetic parameters of the samples
The activation energy (Ea) and pre-exponential factor (A) for microwave torrefied
sample and the non-torrefied sample of thermal decomposition for both in air and
nitrogen at different heating rates are calculated based on the Doyle’s and Coats-
Redfern’s approximations explained in Section 4.3.2. Relationships between the Ea
and A of the biomass fuel samples can be obtained using linear regression analysis.
Therefore, to show how close the data are to the fitted regression line, the coefficient
of determination (R2) of the calculated linear models were also included in the
presented results. The R2 calculated were between 0.9658 and 0.9989, which
indicates that the linear models explain all the variability of the response data around

Chapter 4:Experimental determination of reactivity and kinetic parameters using thermogravimetric analysis
81
its mean. The equations of linear regression for kinetic parameters determination of
each sample in air for is shown in Table 4.1, while Table 4.2 shows the kinetic
parameters determination of each sample in nitrogen.
Table 4.1: The equations of linear regression for kinetic parameters determination of thermal decomposition in air
Non-torrefied sample Heating
rate Doyle Coat-Redfern
Linear regression R2 Linear regression R2 10°C/min y = -11132x + 17.389 0.9881 y = -10409x + 3.3686 0.9852
20°C/min y = -9100.4x + 13.735 0.9968 y = -7763.2x - 1.0323 0.9959
30°C/min y = -9617.4x + 14.634 0.9975 y = -8372.4x - 0.2348 0.9970 Microwave torrefied sample
Heating rate
Doyle Coats-Redfern Linear regression R2 Linear regression R2
10°C/min y = -7929.2x + 12.116 0.9935 y = -6719.2x - 2.6961 0.9915
20°C/min y = -8939.2x + 13.224 0.9945 y = -7984.1x - 0.6896 0.9968
30°C/min y = -7603.3x + 11.005 0.9745 y = -6386.1x - 3.8202 0.9658
Table 4.2: The equations of linear regression for kinetic parameters determination of thermal decomposition in nitrogen
Non-torrefied sample Heating
rate Doyle Coat-Redfern
Linear regression R2 Linear regression R2 10°C/min y = -8300.8x + 12.573 0.9990 y = -7061.7x - 2.2874 0.9989
20°C/min y = -8764.7x + 13.087 0.9984 y = -7503x - 1.8095 0.9980
30°C/min y = -8973x + 13.446 0.9986 y = -7714.4x - 1.4445 0.9984 Microwave torrefied sample
Heating rate
Doyle Coats-Redfern Linear regression R2 Linear regression R2
10°C/min 𝑦 = −8373.3𝑥 + 12.349 0.9942 𝑦 = −7123.4 − 2.528 0.9925
20°C/min 𝑦 = −8469.3𝑥 + 12.323 0.9947 𝑦 = −7209.7𝑥 − 2.569 0.9931
30°C/min 𝑦 = −9082.3𝑥 + 12.249 0.9970 𝑦 = −7804.3𝑥 − 1.677 0.9969
The activation energy (Ea) and pre-exponential factor (A) for microwave torrefied
sample and the non-torrefied sample are presented in Table 4.3 and Table 4.4
respectively. Based on the results presented in Table 4.3, it can be concluded that the
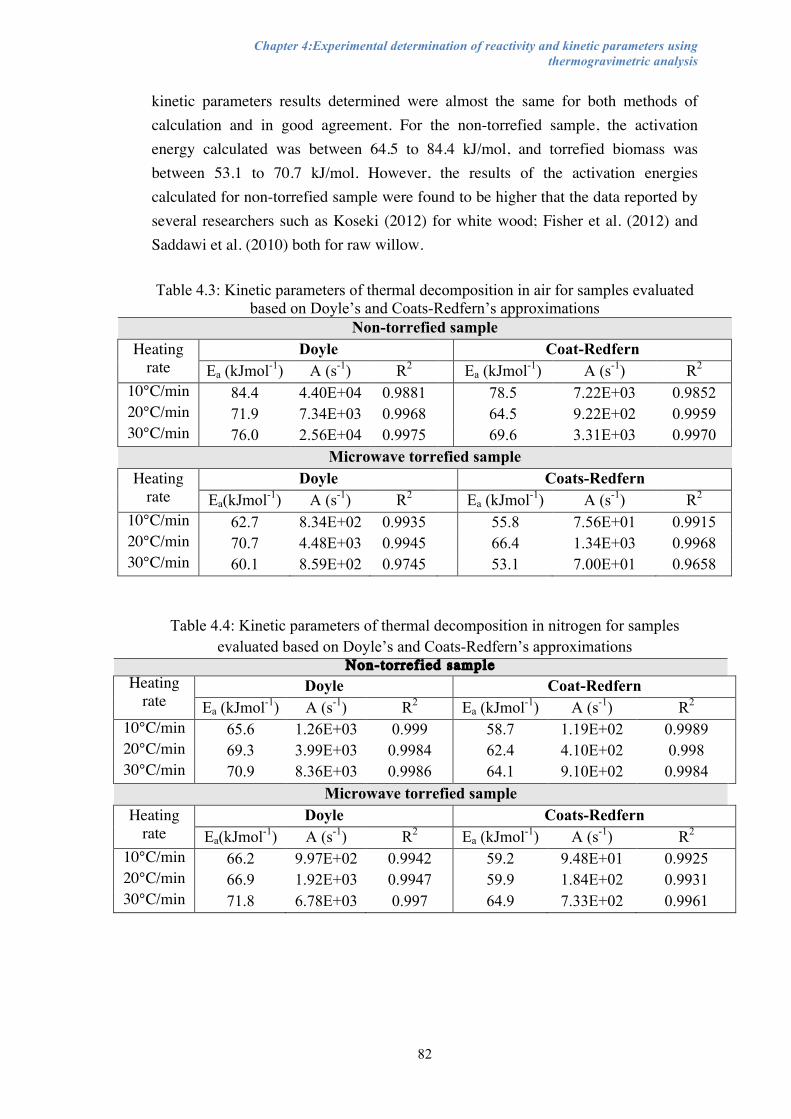
Chapter 4:Experimental determination of reactivity and kinetic parameters using thermogravimetric analysis
82
kinetic parameters results determined were almost the same for both methods of calculation and in good agreement. For the non-torrefied sample, the activation energy calculated was between 64.5 to 84.4 kJ/mol, and torrefied biomass was between 53.1 to 70.7 kJ/mol. However, the results of the activation energies calculated for non-torrefied sample were found to be higher that the data reported by several researchers such as Koseki (2012) for white wood; Fisher et al. (2012) and Saddawi et al. (2010) both for raw willow. Table 4.3: Kinetic parameters of thermal decomposition in air for samples evaluated
based on Doyle’s and Coats-Redfern’s approximations Non-torrefied sample
Heating rate
Doyle Coat-Redfern Ea (kJmol-1) A (s-1) R2 Ea (kJmol-1) A (s-1) R2
10°C/min 84.4 4.40E+04 0.9881 78.5 7.22E+03 0.9852 20°C/min 71.9 7.34E+03 0.9968 64.5 9.22E+02 0.9959 30°C/min 76.0 2.56E+04 0.9975 69.6 3.31E+03 0.9970
Microwave torrefied sample Heating
rate Doyle Coats-Redfern
Ea(kJmol-1) A (s-1) R2 Ea (kJmol-1) A (s-1) R2 10°C/min 62.7 8.34E+02 0.9935 55.8 7.56E+01 0.9915 20°C/min 70.7 4.48E+03 0.9945 66.4 1.34E+03 0.9968 30°C/min 60.1 8.59E+02 0.9745 53.1 7.00E+01 0.9658
Table 4.4: Kinetic parameters of thermal decomposition in nitrogen for samples evaluated based on Doyle’s and Coats-Redfern’s approximations
Non-torrefied sample Heating
rate Doyle Coat-Redfern
Ea (kJmol-1) A (s-1) R2 Ea (kJmol-1) A (s-1) R2 10°C/min 65.6 1.26E+03 0.999 58.7 1.19E+02 0.9989 20°C/min 69.3 3.99E+03 0.9984 62.4 4.10E+02 0.998 30°C/min 70.9 8.36E+03 0.9986 64.1 9.10E+02 0.9984
Microwave torrefied sample Heating
rate Doyle Coats-Redfern
Ea(kJmol-1) A (s-1) R2 Ea (kJmol-1) A (s-1) R2 10°C/min 66.2 9.97E+02 0.9942 59.2 9.48E+01 0.9925 20°C/min 66.9 1.92E+03 0.9947 59.9 1.84E+02 0.9931 30°C/min 71.8 6.78E+03 0.997 64.9 7.33E+02 0.9961

Chapter 4:Experimental determination of reactivity and kinetic parameters using thermogravimetric analysis
83
However, based on the results determined, the lower activation energy for torrefied material showed that the material is easier to decompose and have a higher tendency to self-heat. This result agreed with findings by Ren et al. (2013), which showed a decreasing trend of activation energy for the torrefied sample compared to the raw
material. The range of kinetic parameters for thermal decomposition in nitrogen
shows a higher value for both samples. For the non-torrefied sample, the activation
energy calculated was between 58.7 to 70.9 kJ/mol, and torrefied biomass was
between 59.2 to 71.8 kJ/mol. Therefore, it is suggested that thermal decomposition of
the samples is less reactive in nitrogen.
4.4 Thermal decomposition characteristic in air
Analysis of the thermal decomposition behaviour in the air for both samples at three
heating rates, 10ºC/min, 20ºC/min and 30ºC/min are performed based on method
explained in earlier in Section 4.1. Figure 4.8 shows the weight loss of non-torrefied
sample with the temperature at various heating rates. As expected, we can see three
regions of decomposition from the curves, where the first region from ambient
temperature to 130ºC that represented the moisture loss in the sample. The second
region takes place from 130ºC to 360ºC that characterised by volatilization process
of the cellulosic and hemicellulose components. Lastly, the third region from varies
between 360ºC to 900ºC is characterised by the char combustion, which produced
the volatiles and solid residues.
Figure 4.8: Temperature profile of decomposition in air of non-torrefied sample at
different heating rate
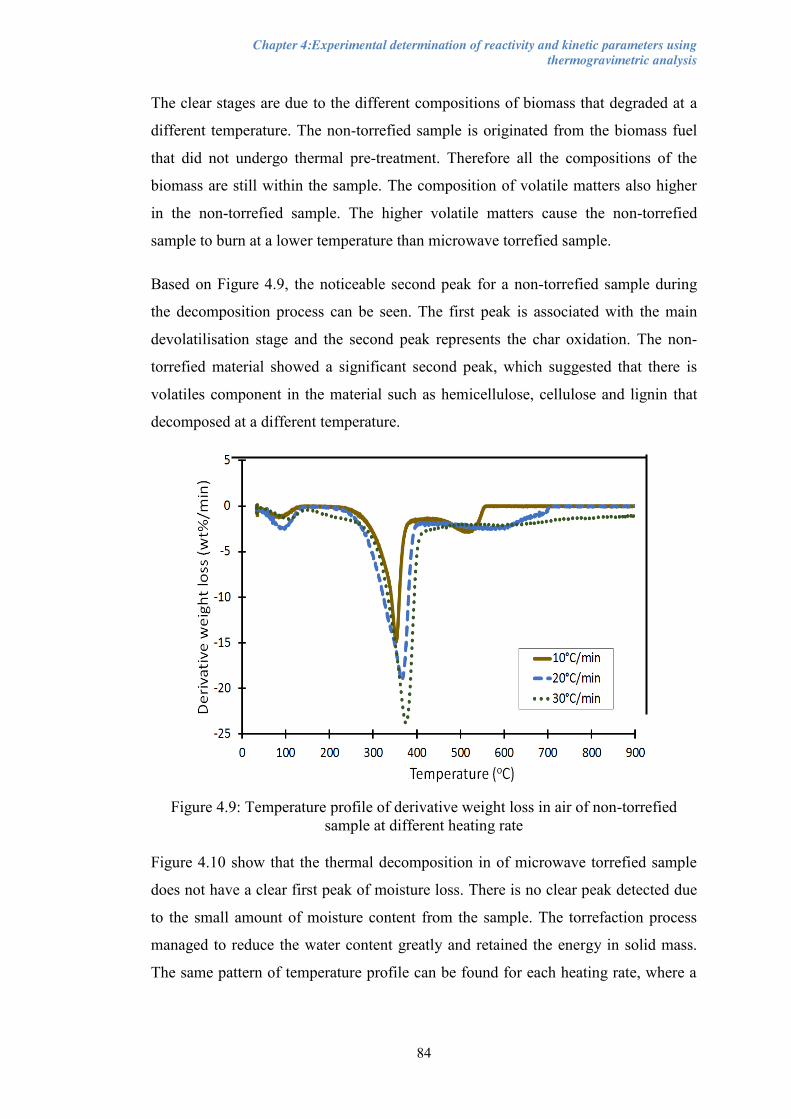
Chapter 4:Experimental determination of reactivity and kinetic parameters using thermogravimetric analysis
84
The clear stages are due to the different compositions of biomass that degraded at a
different temperature. The non-torrefied sample is originated from the biomass fuel
that did not undergo thermal pre-treatment. Therefore all the compositions of the
biomass are still within the sample. The composition of volatile matters also higher
in the non-torrefied sample. The higher volatile matters cause the non-torrefied
sample to burn at a lower temperature than microwave torrefied sample.
Based on Figure 4.9, the noticeable second peak for a non-torrefied sample during
the decomposition process can be seen. The first peak is associated with the main
devolatilisation stage and the second peak represents the char oxidation. The non-
torrefied material showed a significant second peak, which suggested that there is
volatiles component in the material such as hemicellulose, cellulose and lignin that
decomposed at a different temperature.
Figure 4.9: Temperature profile of derivative weight loss in air of non-torrefied
sample at different heating rate
Figure 4.10 show that the thermal decomposition in of microwave torrefied sample
does not have a clear first peak of moisture loss. There is no clear peak detected due
to the small amount of moisture content from the sample. The torrefaction process
managed to reduce the water content greatly and retained the energy in solid mass.
The same pattern of temperature profile can be found for each heating rate, where a

Chapter 4:Experimental determination of reactivity and kinetic parameters using thermogravimetric analysis
85
clear devolatilization stage can be witnessed at the second phase of the heating
profile, which is between 280 ºC – 450 ºC.
Figure 4.10: Temperature profile of decomposition in air for microwave torrefied
sample at different heating rate
There is no clear indication for the second peak in the case of the microwave
torrefied sample as shown in Figure 4.11. This pattern is found in the temperature
profile of the microwaved torrefied sample due to the moisture loss during the
torrefaction process. Besides that, it can be seen that the maximum weight loss
temperature of the sample shifted to higher temperature when the heating rate
increase from 10 ºC/min to 30 ºC/min.
Figure 4.11: Temperature profile of derivative weight loss in air for microwave
torrefied sample at different heating rate

Chapter 4:Experimental determination of reactivity and kinetic parameters using thermogravimetric analysis
86
Based on Figure 4.8 and Figure 4.10, it can be observed that with the increase of
heating rate, the curves move slightly to a higher temperature zone, for both samples.
The delay of the temperature due to several factors such as shorter reaction time and
lower degree of reaction changes due to higher heating rate (Guo et al., 2012), thus
the temperature required for the sample to reach the same conversion will be higher
(Heydari et al., 2015). Besides that, the low thermal conductivity of the samples can
also contribute to this phenomenon where the longer time needed for the heat to
transfer across the sample and there is no enough time available for the heat to
transfer within the sample matrix (Kan, Strezov, & Evans, 2016).
Figure 4.10, also shows that microwave torrefied sample generated a larger amount
of unburned residual material at the end of the experiment compared to the non-
torrefied sample in Figure 4.8. This is in accordance with the higher ash content in
microwave torrefied sample. However, non-torrefied sample decomposed in at
30°C/min generated more residual material compared to the one at 10°C and 20°C,
which could be due to the shorter reaction time with the low degree reaction changes
as mentioned earlier.
4.5 Thermal decomposition characteristic in nitrogen
Thermal results obtained from decomposition in nitrogen for the non-torrefied
sample are presented in Figure 4.12 and Figure 4.13. Based on the decomposition in
nitrogen for both samples, the residual matter at the end of the reaction is higher than
the one done in air. The higher amount of residual matter is expected due to the
incomplete decomposition in nitrogen over air. The Figure 4.12 shows the
temperature profile of the non-torrefied sample heated at various heating rate. It can
be witnessed that, different heating rates did not have strong influence on the amount
of residual left at the end of the heating process of the samples in nitrogen. For non-
torrefied sample, the residual left at the end of process is 16% of total weight of
sample.
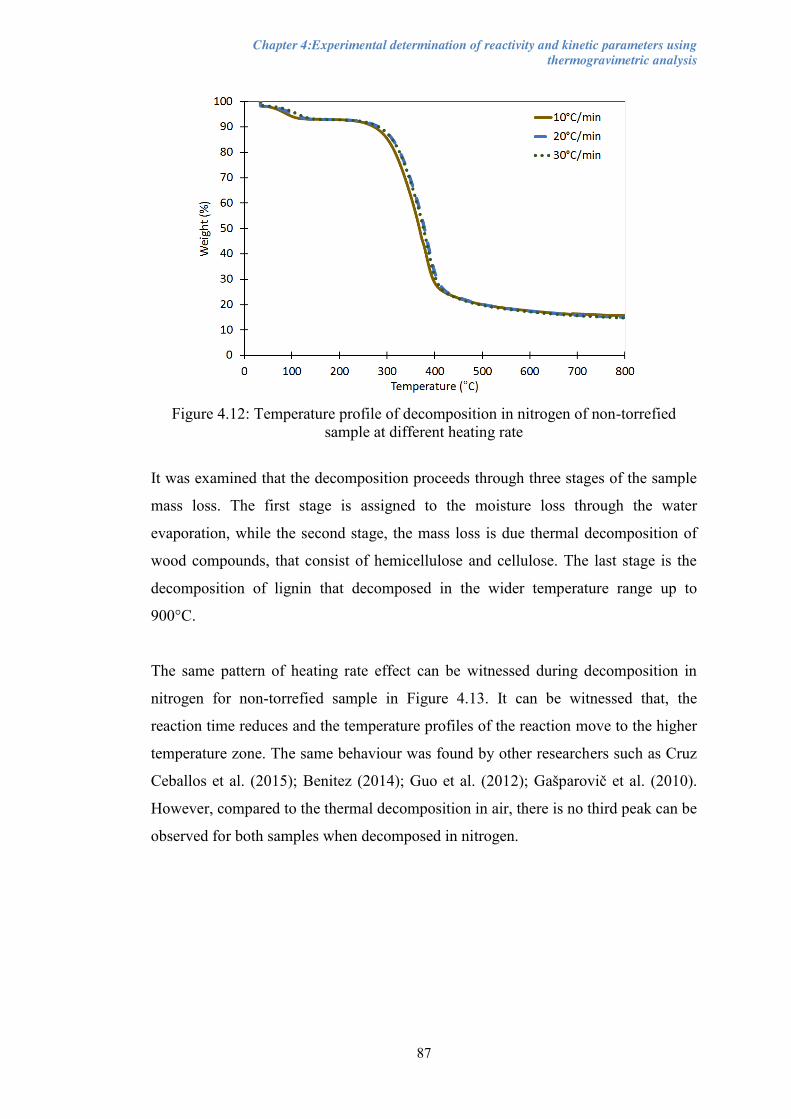
Chapter 4:Experimental determination of reactivity and kinetic parameters using thermogravimetric analysis
87
Figure 4.12: Temperature profile of decomposition in nitrogen of non-torrefied
sample at different heating rate
It was examined that the decomposition proceeds through three stages of the sample
mass loss. The first stage is assigned to the moisture loss through the water
evaporation, while the second stage, the mass loss is due thermal decomposition of
wood compounds, that consist of hemicellulose and cellulose. The last stage is the
decomposition of lignin that decomposed in the wider temperature range up to
900°C.
The same pattern of heating rate effect can be witnessed during decomposition in
nitrogen for non-torrefied sample in Figure 4.13. It can be witnessed that, the
reaction time reduces and the temperature profiles of the reaction move to the higher
temperature zone. The same behaviour was found by other researchers such as Cruz
Ceballos et al. (2015); Benitez (2014); Guo et al. (2012); Gašparovič et al. (2010).
However, compared to the thermal decomposition in air, there is no third peak can be
observed for both samples when decomposed in nitrogen.
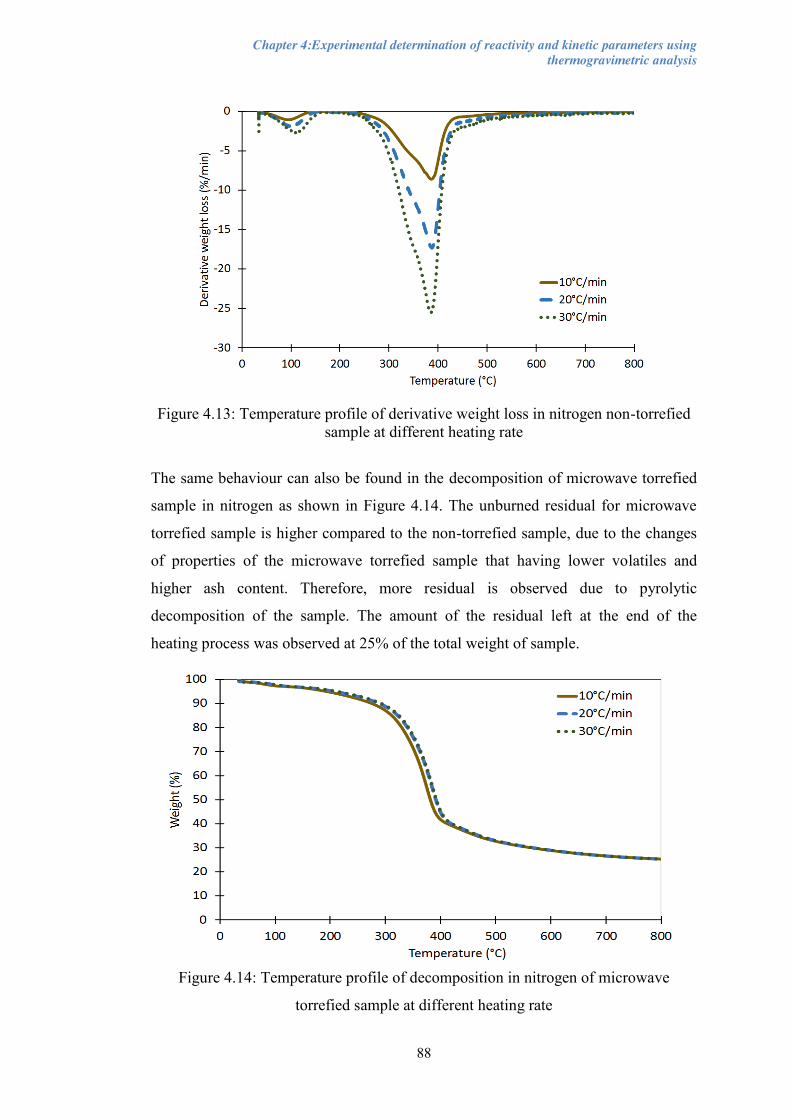
Chapter 4:Experimental determination of reactivity and kinetic parameters using thermogravimetric analysis
88
Figure 4.13: Temperature profile of derivative weight loss in nitrogen non-torrefied
sample at different heating rate
The same behaviour can also be found in the decomposition of microwave torrefied
sample in nitrogen as shown in Figure 4.14. The unburned residual for microwave
torrefied sample is higher compared to the non-torrefied sample, due to the changes
of properties of the microwave torrefied sample that having lower volatiles and
higher ash content. Therefore, more residual is observed due to pyrolytic
decomposition of the sample. The amount of the residual left at the end of the
heating process was observed at 25% of the total weight of sample.
Figure 4.14: Temperature profile of decomposition in nitrogen of microwave
torrefied sample at different heating rate

Chapter 4:Experimental determination of reactivity and kinetic parameters using thermogravimetric analysis
89
The same pattern of heating behaviour as non-torrefied sample can be seen during
the analysis of the microwave torrefied sample in nitrogen at various heating rate as
shown in Figure 4.15. There is a clear second peaks for the samples heated at
various heating rates. However the peaks tend to shift to a higher temperature, with
the decrease of heating rates.
Figure 4.15: Temperature profile of derivative weight loss in nitrogen for microwave
torrefied sample at different heating rate
4.5.1 Characteristic parameters of both samples at various heating rate and
carrier gas
Table 4.5 presents the comparison of characteristic parameters and maximum rate of
mass loss of the decomposition in air and nitrogen. It is not much difference between
the temperatures of initial combustion (TIC) for thermal decomposition of the non-
torrefied sample in air and nitrogen. However, the trend of characteristic
temperatures increase can be seen for microwave torrefied sample comparing to the
nitrogen. The increase in the temperature when decomposed in nitrogen is due to the
reduction in decomposition rate. The maximum weight losses of both samples
heated in air are much lower than the one heated in nitrogen due to its pyrolytic
condition.
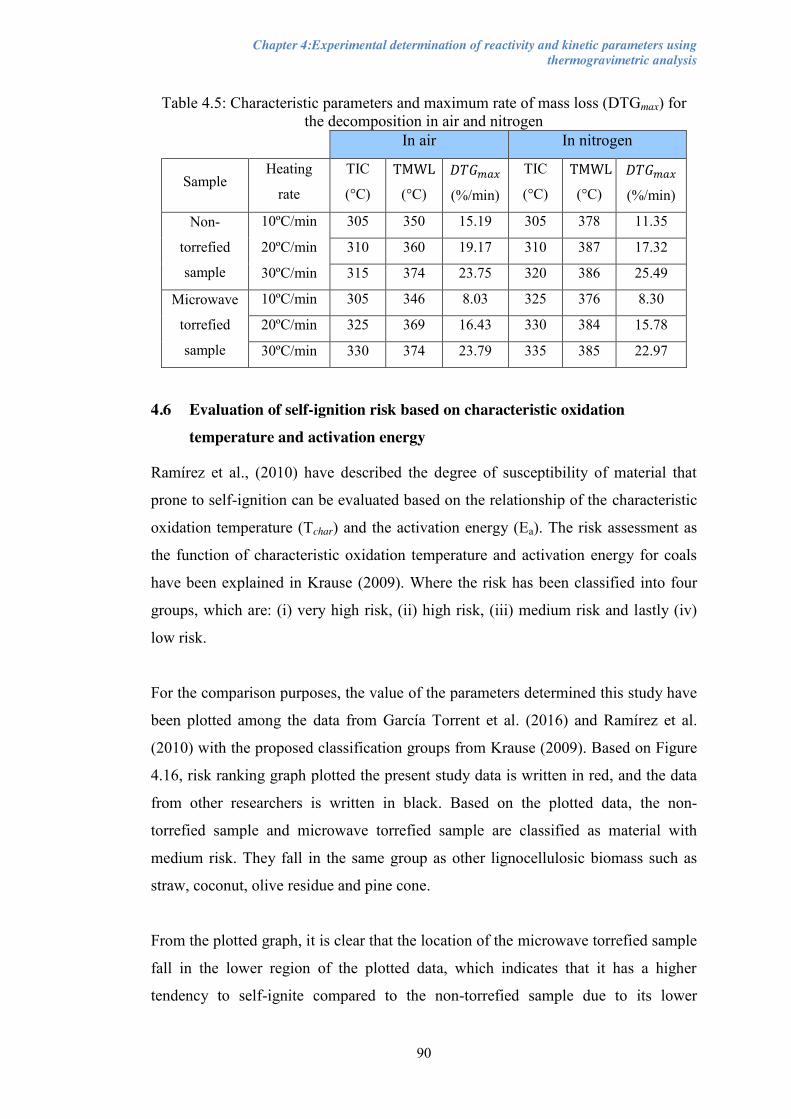
Chapter 4:Experimental determination of reactivity and kinetic parameters using thermogravimetric analysis
90
Table 4.5: Characteristic parameters and maximum rate of mass loss (DTGmax) for the decomposition in air and nitrogen
In air In nitrogen
Sample Heating
rate
TIC
(°C)
TMWL
(°C)
𝐷𝑇𝐺𝑚𝑎𝑥
(%/min)
TIC
(°C)
TMWL
(°C)
𝐷𝑇𝐺𝑚𝑎𝑥
(%/min)
Non-
torrefied
sample
10ºC/min 305 350 15.19 305 378 11.35
20ºC/min 310 360 19.17 310 387 17.32
30ºC/min 315 374 23.75 320 386 25.49
Microwave
torrefied
sample
10ºC/min 305 346 8.03 325 376 8.30
20ºC/min 325 369 16.43 330 384 15.78
30ºC/min 330 374 23.79 335 385 22.97
4.6 Evaluation of self-ignition risk based on characteristic oxidation
temperature and activation energy
Ramírez et al., (2010) have described the degree of susceptibility of material that
prone to self-ignition can be evaluated based on the relationship of the characteristic
oxidation temperature (Tchar) and the activation energy (Ea). The risk assessment as
the function of characteristic oxidation temperature and activation energy for coals
have been explained in Krause (2009). Where the risk has been classified into four
groups, which are: (i) very high risk, (ii) high risk, (iii) medium risk and lastly (iv)
low risk.
For the comparison purposes, the value of the parameters determined this study have
been plotted among the data from García Torrent et al. (2016) and Ramírez et al.
(2010) with the proposed classification groups from Krause (2009). Based on Figure
4.16, risk ranking graph plotted the present study data is written in red, and the data
from other researchers is written in black. Based on the plotted data, the non-
torrefied sample and microwave torrefied sample are classified as material with
medium risk. They fall in the same group as other lignocellulosic biomass such as
straw, coconut, olive residue and pine cone.
From the plotted graph, it is clear that the location of the microwave torrefied sample
fall in the lower region of the plotted data, which indicates that it has a higher
tendency to self-ignite compared to the non-torrefied sample due to its lower

Chapter 4:Experimental determination of reactivity and kinetic parameters using thermogravimetric analysis
91
activation energy. Besides that, it can be witnessed that the samples tested in this
study had a higher risk compared to bituminous coal and sub-bitumonous coal. In
addition to that, biomasses such as wood chip and animal waste are easier to self-
ignite compared to the samples used in this study.
Figure 4.16: Risk ranking graph based on the activation energy and characteristic oxidation temperature plotted among data from García Torrent et al., (2016) and
Ramírez et al., (2010)
4.7 Summary
x The thermogravimetric curves move towards higher temperature region when
torrefied biomass sample is decomposed as it suggested that the material is
more stable towards thermal decomposition
x The result of TIC and TMWL for both samples showed that that the non-
torrefied sample is more reactive than the torrefied sample. However, Tcharac for the non-torrefied sample is higher than the torrefied sample.
x Thermal decomposition in nitrogen for both samples shows higher residual
matter at the end of the reaction is compared to the one done in air. This is
expected due to the incomplete decomposition in nitrogen over air.
x The activation energy for thermal decomposition in air is in between 64.5 to
84.4 kJ/mol for the non-torrefied sample, and 53.1 to 70.7 kJ/mol torrefied

Chapter 4:Experimental determination of reactivity and kinetic parameters using thermogravimetric analysis
92
sample.While in nitrogen is in between 58.7 to 70.9 kJ/mol for non-torrefied
sample and 59.2 to 71.8 kJ/mol for torrefied sample.
x The lower activation energy for torrefied material showed that the material is
easier to decompose, as a result, have a higher tendency to self-heat.
x The kinetic parameters findings agreed to the results found in the Tcharac
analysis, which confirmed that the microwave torrefied sample is more
reactive than non-torrefied sample in air.
x Based on the risk ranking graph; both non-torrefied sample and microwave
torrefied sample are classified as a material with medium risk. The location
of plotted point for microwave torrefied sample fall in lower part of the
graph, which indicates that it has a higher tendency to self-ignite compared to
the non-torrefied sample due to its lower activation energy

Chapter 5:Experimental study of the thermal runaway in bulk tests
93
Chapter 5 Experimental study of the thermal runaway in bulk tests
Chapter 5 provides details of experiments undertaken the heating behaviour of the
samples heated up to various bulk sizes and oven temperatures. The experimental
programme considers examining the effect of the bulk size and the oven temperature
on time taken for a thermal runaway to occur. This chapter presents the temperature
profile from each experiment. This chapter also shows the relationship between the
ignition delay time and oven temperature as well as the bulk size thermal runaway to
happen in a high-temperature environment.
5.1 Experimental works
5.1.1 Objectives of the experiment
The experimental works done in this chapter is to fulfil the objectives as below:
(i) to determine the relationship between various bulk sizes on the ignition delay
time for the ignition to occur;
(ii) to determine the relationship between the various oven temperatures and the
time taken for a thermal runaway to occur; and
(iii) to compare the thermal stability of both materials in larger scale heating
environment
5.1.2 Samples and equipment
The samples used in this experiment are non-torrefied sample and microwave
torrefied sample. The properties of both samples are very different from one another.
Therefore, it will give a good comparison of heating behaviour. The experiments
were conducted using the various size of cubic shaped wire mesh bulks as shown in
Figure 5.1 with each cube’s length labelled and named as Bulk 1, Bulk 2 and Bulk 3.
The schematic diagrams of the experimental setup with the position of the
thermocouples are presented in Figure 5.2, Figure 5.3 and Figure 5.4.
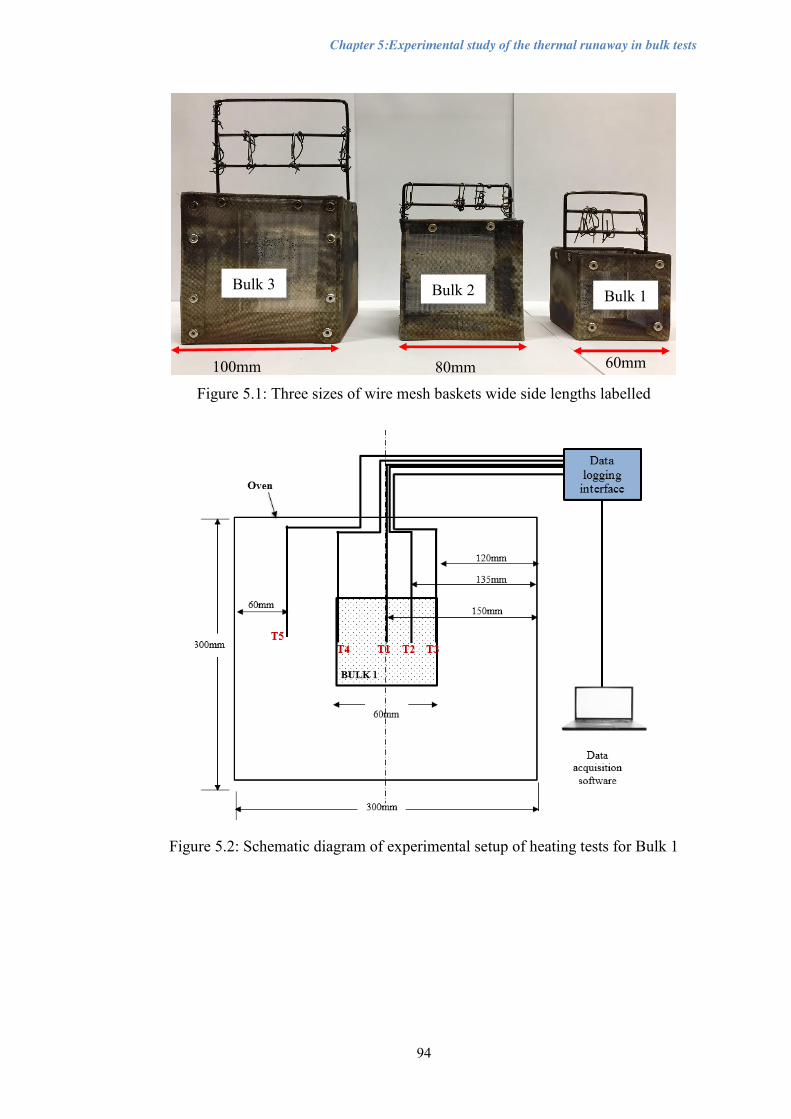
Chapter 5:Experimental study of the thermal runaway in bulk tests
94
Figure 5.1: Three sizes of wire mesh baskets wide side lengths labelled
Figure 5.2: Schematic diagram of experimental setup of heating tests for Bulk 1
100mm 80mm 60mm
Bulk 3 Bulk 2 Bulk 1

Chapter 5:Experimental study of the thermal runaway in bulk tests
95
Figure 5.3: Schematic diagram of experimental setup of heating tests for Bulk 2
Figure 5.4: Schematic diagram of experimental setup of heating tests for Bulk 3
60mm
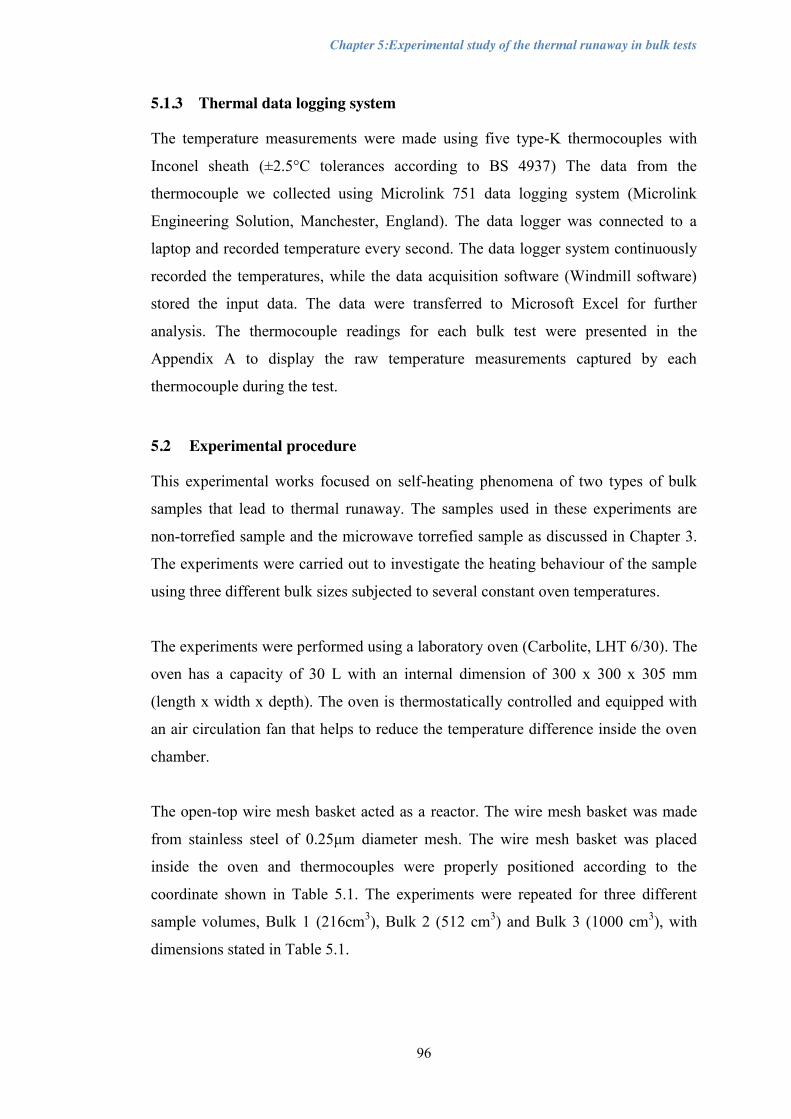
Chapter 5:Experimental study of the thermal runaway in bulk tests
96
5.1.3 Thermal data logging system
The temperature measurements were made using five type-K thermocouples with
Inconel sheath (±2.5°C tolerances according to BS 4937) The data from the
thermocouple we collected using Microlink 751 data logging system (Microlink
Engineering Solution, Manchester, England). The data logger was connected to a
laptop and recorded temperature every second. The data logger system continuously
recorded the temperatures, while the data acquisition software (Windmill software)
stored the input data. The data were transferred to Microsoft Excel for further
analysis. The thermocouple readings for each bulk test were presented in the
Appendix A to display the raw temperature measurements captured by each
thermocouple during the test.
5.2 Experimental procedure
This experimental works focused on self-heating phenomena of two types of bulk
samples that lead to thermal runaway. The samples used in these experiments are
non-torrefied sample and the microwave torrefied sample as discussed in Chapter 3.
The experiments were carried out to investigate the heating behaviour of the sample
using three different bulk sizes subjected to several constant oven temperatures.
The experiments were performed using a laboratory oven (Carbolite, LHT 6/30). The
oven has a capacity of 30 L with an internal dimension of 300 x 300 x 305 mm
(length x width x depth). The oven is thermostatically controlled and equipped with
an air circulation fan that helps to reduce the temperature difference inside the oven
chamber.
The open-top wire mesh basket acted as a reactor. The wire mesh basket was made
from stainless steel of 0.25μm diameter mesh. The wire mesh basket was placed
inside the oven and thermocouples were properly positioned according to the
coordinate shown in Table 5.1. The experiments were repeated for three different
sample volumes, Bulk 1 (216cm3), Bulk 2 (512 cm3) and Bulk 3 (1000 cm3), with
dimensions stated in Table 5.1.

Chapter 5:Experimental study of the thermal runaway in bulk tests
97
Figure 5.5: Location of the thermocouple in the experiments.
Figure 5.5 shows the positions for the thermocouples inside the bulk, which are T1 in
the middle, T2 halfway from the centre to the wall (radial), T3 at the wall of the bulk
and T4 at the opposite wall of the bulk. Lastly, T5 is for oven temperature
measurement. The tips of thermocouples were kept at the same axial level from the
bottom. The locations of the tips for each sample volume are based on their vertical
and radial coordinates as shown in Table 5.1. The temperatures were being recorded
by a data acquisition system.
Table 5.1: Locations of the thermocouples based on vertical and radial coordinates
Length, L
(mm)
Height, H
(mm)
Width, W
(mm) T1 T2 T3 T4 T5
Bulk
1 60 60 60 (0,0) (30,15) (30,30) (30,-30) Oven
Bulk
2 80 80 80 (0,0) (40,20) (40,40) (40,-40) Oven
Bulk
3 100 100 100 (0,0) (50,25) (50,50) (50,-50) Oven

Chapter 5:Experimental study of the thermal runaway in bulk tests
98
After the thermocouples had been properly positioned and the wire mesh basket was
suspended at the centre of the oven, the samples were fully filled into the wire mesh
basket. Figure 5.6 shows the example of wire mesh basket that is fully filled with
microwave torrefied sample. The oven temperature was maintained at a selected
constant temperature.
Figure 5.6: Wire mesh basket filled with microwave torrefied sample
The samples were subjected to the selected temperature until the reading of the
thermocouple at the centre (T1) exceeded the oven temperature (T5). The exceeded
temperature is an indication that self-heating had occurred in bulk followed by the
ignition. If the ignition occurred, the oven is turned off, and the samples were let to
burn fully. The oven was then cooled down to room temperature before the next
batch is set up using the same method. The full list of a bulk heating experiment
done is presented in Table 5.2.
Table 5.2: List of oven temperatures used during bulk heating experiments
Sample Bulk Oven temperature
Non-torrefied sample
Bulk 1 180ºC Bulk 1 200ºC Bulk 2 200ºC Bulk 3 200ºC
Torrefied sample
Bulk 1 180ºC Bulk 2 180ºC Bulk 3 180ºC Bulk 1 170ºC Bulk 1 190ºC

Chapter 5:Experimental study of the thermal runaway in bulk tests
99
5.3 Self-heating and thermal runaway in bulk tests
The bulk experiment test involved boundary heating of an initially cold exothermic
material exposed to a hot environment with a constant temperature. This experiment
is adapted from basket heating method described by Chen (1999), which intended to
determine the kinetic analysis of self-heating process. However, this experimental
work is anticipated to examine the self-heating propensity of the samples without the
consideration of its kinetics. The heating behaviours of the sample were investigated
using various cubic shape wire mesh bulk, as shown in Figure 5.1. The bulk was
filled with the samples, and the constant oven temperature was maintained
throughout the experiment.
The experimental works are designed to investigate the thermal stability of the
samples based on the bulk size and the oven temperature, by comparing the induction
time of the sample to ignite. The induction time in this experimental works is defined
as the time taken for the centre temperature (T1) to exceed the oven temperature
(T5). Based on the discussion in Section 2.5.2, the temperature profile of the samples
followed the supercritical curves when self-ignition occurred in the system. The
supercritical state represents that the sample reaches the critical temperature, which
the self-heating follows by the thermal runaway occur. Meanwhile, if there is no self-
heating detected, the temperature profile follows the subcritical curve. The
subcritical curve indicates that the heat generation is equal to the heat dissipation.
Thus equilibrium state with no rapid increases of temperature is achieved.
5.3.1 Discussion of the self-heating propensity of the samples
Based on the kinetic study of the biomass fuels presented in Section 4.3, the non-
torrefied sample has higher apparent activation energy compare to the microwave
torrefied sample. By doing this set of experiment, the heating behaviour of the fuel in
larger scale can be examined. Thus, in order to confirm the results, the bulk test is
performed at an oven temperature of 180°C using wire mesh Bulk 1 (side length
60mm) for both samples.

Chapter 5:Experimental study of the thermal runaway in bulk tests
100
Figure 5.7 shows the temperature profiles of T1 (thermocouple at the centre) for both
samples. The rapid temperature rise can be seen in the temperature profile of
microwave torrefied sample. This rapid temperature rise exhibits that the microwave
torrefied sample experienced self-heating stage that leads to the thermal runaway.
The temperature profile follows the supercritical behaviour, where the heat
production exceeded the heat loss of the system that result in unsteady state. In
contrast to the microwave torrefied sample, the curve for non-torrefied sample shows
the subcritical behaviour where the sample become hotter approaching oven
temperature but no ignition observed.
The observation from the heating tests confirmed the findings of the kinetic
parameter of the samples, where at the same heating condition, self-heating that lead
to thermal runaway can only be detected for microwave torrefied sample. Whereas,
there is no self-heating phenomenon detected for the non-torrefied sample. This
observation confirms that the microwave torrefied sample is more reactive compared
to the non-torrefied sample.
Figure 5.7: The comparison of the temperature profiles of the samples at 180°C
heated using Bulk 1
We will move on to discuss further temperature profiles obtained for each sample.
There are significant different between the temperature profile during heating
process of the non-torrefied sample and the microwave torrefied sample.
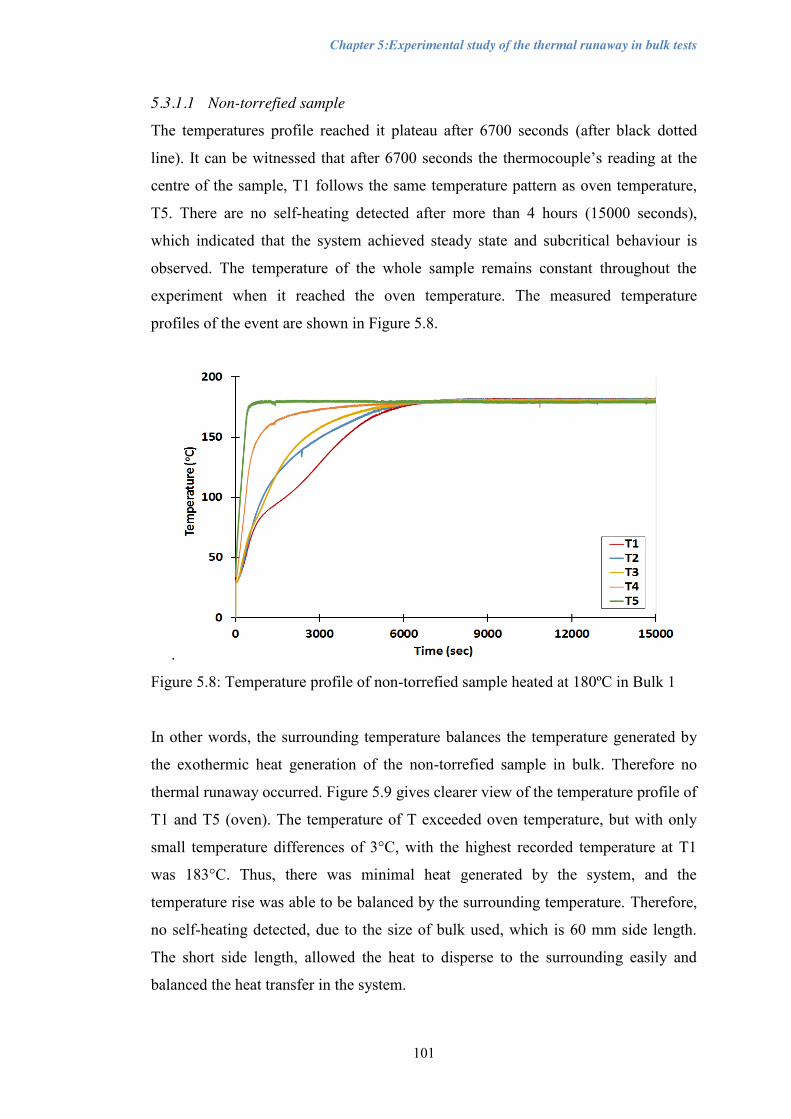
Chapter 5:Experimental study of the thermal runaway in bulk tests
101
5.3.1.1 Non-torrefied sample
The temperatures profile reached it plateau after 6700 seconds (after black dotted
line). It can be witnessed that after 6700 seconds the thermocouple’s reading at the
centre of the sample, T1 follows the same temperature pattern as oven temperature,
T5. There are no self-heating detected after more than 4 hours (15000 seconds),
which indicated that the system achieved steady state and subcritical behaviour is
observed. The temperature of the whole sample remains constant throughout the
experiment when it reached the oven temperature. The measured temperature
profiles of the event are shown in Figure 5.8.
.
Figure 5.8: Temperature profile of non-torrefied sample heated at 180ºC in Bulk 1
In other words, the surrounding temperature balances the temperature generated by
the exothermic heat generation of the non-torrefied sample in bulk. Therefore no
thermal runaway occurred. Figure 5.9 gives clearer view of the temperature profile of
T1 and T5 (oven). The temperature of T exceeded oven temperature, but with only
small temperature differences of 3°C, with the highest recorded temperature at T1
was 183°C. Thus, there was minimal heat generated by the system, and the
temperature rise was able to be balanced by the surrounding temperature. Therefore,
no self-heating detected, due to the size of bulk used, which is 60 mm side length.
The short side length, allowed the heat to disperse to the surrounding easily and
balanced the heat transfer in the system.

Chapter 5:Experimental study of the thermal runaway in bulk tests
102
Figure 5.9: Temperature profile of T1 and oven temperature (T5)
5.3.1.2 Microwave torrefied sample
The same heating condition applied to the microwave torrefied sample (oven
temperature 180°C heated in Bulk 1. The comparison of the temperature profiles for
T1, T3 and T5 thermocouples are shown in Figure 5.10, while the temperature
reading for all the thermocouples shown in Appendix A-1. Following the
experimental technique, the comparisons of those thermocouples reading are
significant in the observation of the self-heating behaviour.
Figure 5.10: Temperature profile of microwave torrefied sample at 180ºC in Bulk 1
Chapter 5:Experimental study of the thermal runaway in bulk tests
103
Based on Figure 5.10, the temperature of the centre (T1) becomes higher than the
temperature at the edge of bulk (T3) and oven temperature (T5) indicates that the
self-heating phenomena followed by thermal runaway occurred in the system. The
microwave torrefied sample started to self-heat at 4002 seconds (66.7 minutes),
where the T1 reading indicating rapid increases in temperature and thermal runaway
is detected at this stage. The rapid growth is the indicator that the heat generated by
the exothermic reaction of the material is more than the heat dissipated to the
surrounding. At this point, it can be established that a self-heating process had started
and followed by the self-ignition of the sample.
Consequently, by comparing the behaviour of both samples, it can be established that
microwave torrefied sample is more reactive towards heat compared to non-torrefied
sample. This finding also in agreement to the kinetic analysis results discussed in
Section 4.3, which the apparent activation energy of the microwave torrefied sample
is lower than the non-torrefied sample. Therefore, the heating behaviour reflected
that the thermal stability of microwave torrefied sample is less than the non-torrefied
sample.
5.3.2 Discussion of effect of bulk size on self-heating behaviour
a) Non-torrefied sample
The effect of different bulk sizes is tested for non-torrefied samples, where the
samples were heated in the cubic shape bulk with different volume Bulk 1 (216cm3),
Bulk 2 (512cm3) and Bulk 3 (1000cm3) and the oven temperature was set at 200°C
for each experiment. Based on the experiments, it can be seen that the temperature
profile of T1 for the samples shifted to the longer induction time as the volume is
larger as illustrated in Figure 5.11. The temperature reading of T1 for non-torrefied
sample heated in a largest cubic volume of 1000 cm3, showed that the longest time
taken before it reached its critical stage. While T1 for the non-torrefied sample
heated at the same oven temperature in smallest cube taken shortest to reached its
critical stage.

Chapter 5:Experimental study of the thermal runaway in bulk tests
104
Figure 5.11: Comparison of temperature reading at the centre (T1) of non-torrefied
sample heated at 200°C at different volumes
The shift of temperature profile is due to the longer time taken of the heat from the
surrounding to dissipate to the centre of the bulk, as the size is larger. The heating
process of the whole bulk is taking longer for greater volume. The pattern follows
the pattern of previous researchers that shows the critical storage time correlate
linearly with the storage volumes in their work (García-Torrent et al., 2012; Ramírez,
García-torrent, & Tascón, 2010; Yan et al., 2005).
The experiment managed to establish the relationship between the bulk size and the
induction time. The data obtained in Figure 5.11 can be found from the temperature
profile of each test. The induction time for each bulk size is 5767 seconds for Bulk 1
(as shown in Figure 5.12), 8159 seconds for Bulk 2 (as illustrated in Figure 5.13),
and 11487 seconds for Bulk 3 (as illustrated in Figure 5.14). The complete
thermocouple readings of the tests can be seen in Appendix A-2 for Bulk 1,
Appendix A-3 for Bulk 2 and lastly Appendix A- 4 for Bulk 3.

Chapter 5:Experimental study of the thermal runaway in bulk tests
105
Figure 5.12: Induction time of non-torrefied sample heated at 200ºC in Bulk 1
Figure 5.14: Induction time of non-torrefied sample heated at 200°C in Bulk 3
Figure 5.13: Induction time of non-torrefied sample heated at 200°C in Bulk 2

Chapter 5:Experimental study of the thermal runaway in bulk tests
106
A linear graph had been plotted using the information of induction time and volume
of the bulk used for heating test. The linear graph to show the relationship between
the volume and the induction time of the non-torrefied sample heated at 200°C is
shown in Figure 5.15. It can be concluded that, the larger the volume; the longer time
taken for the samples to reached it critical stage. Much longer time to achieve
supercritical condition indicating that it takes longer time for the heat to transfer to
the centre of the bulk to trigger the ignition.
Figure 5.15: Induction time vs V/A of non-torrefied sample at 200°C
The linear relationship of the side length and the induction time is shown in Figure
5.16. It follows the same pattern linear relationship as the relationship between
induction time and V/A, as the side length represent the size of the bulk.
Figure 5.16: Relationship between side length and induction time of non-torrefied
sample heated at 200°C

Chapter 5:Experimental study of the thermal runaway in bulk tests
107
b) Microwave torrefied sample
To examine the effect of bulk size on the microwave torrefied sample, the sample
had been heated at 180°C in various bulk volumes. For this tests, lower oven
temperature had been chosen due to the fact that microwave torrefied sample is more
reactive compared to the non-torrefied sample. Figure 5.17 shows the induction time
for microwave torrefied sample heated up in Bulk 1. The temperature profile of T1
started to heat up and slowly reaching towards the oven temperature at 180°C. Then
at 4002 seconds, the centre of the sample started to self-heat and followed by a rapid
temperature increased afterwards. The rapid temperature increased showed that the
sample had undergone a thermal runaway.
Figure 5.17: Temperature profile of microwave torrefied sample heated at 180°C
Bulk 1
Figure 5.18 shows the induction time for microwave torrefied sample heated up in
Bulk 2. The temperature profile of T1 started to heat up and slowly reaching towards
the oven temperature at 180°C. However, the time taken for the sample in Bulk 2 to
self-heat was longer that Bulk 1. The induction time for the Bulk 2 was 5066
seconds. The self-heat also followed by a rapid temperature increased afterwards.
The rapid temperature increased showed that the sample had undergone a thermal
runaway.
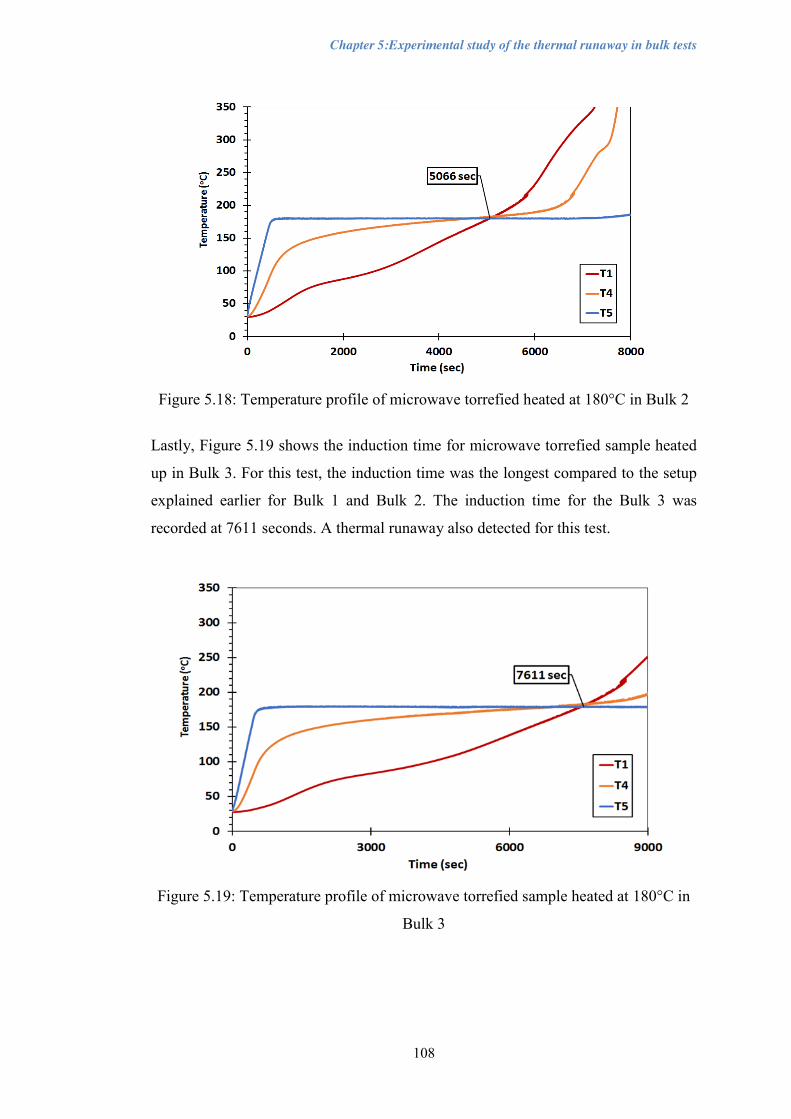
Chapter 5:Experimental study of the thermal runaway in bulk tests
108
Figure 5.18: Temperature profile of microwave torrefied heated at 180°C in Bulk 2
Lastly, Figure 5.19 shows the induction time for microwave torrefied sample heated
up in Bulk 3. For this test, the induction time was the longest compared to the setup
explained earlier for Bulk 1 and Bulk 2. The induction time for the Bulk 3 was
recorded at 7611 seconds. A thermal runaway also detected for this test.
Figure 5.19: Temperature profile of microwave torrefied sample heated at 180°C in
Bulk 3
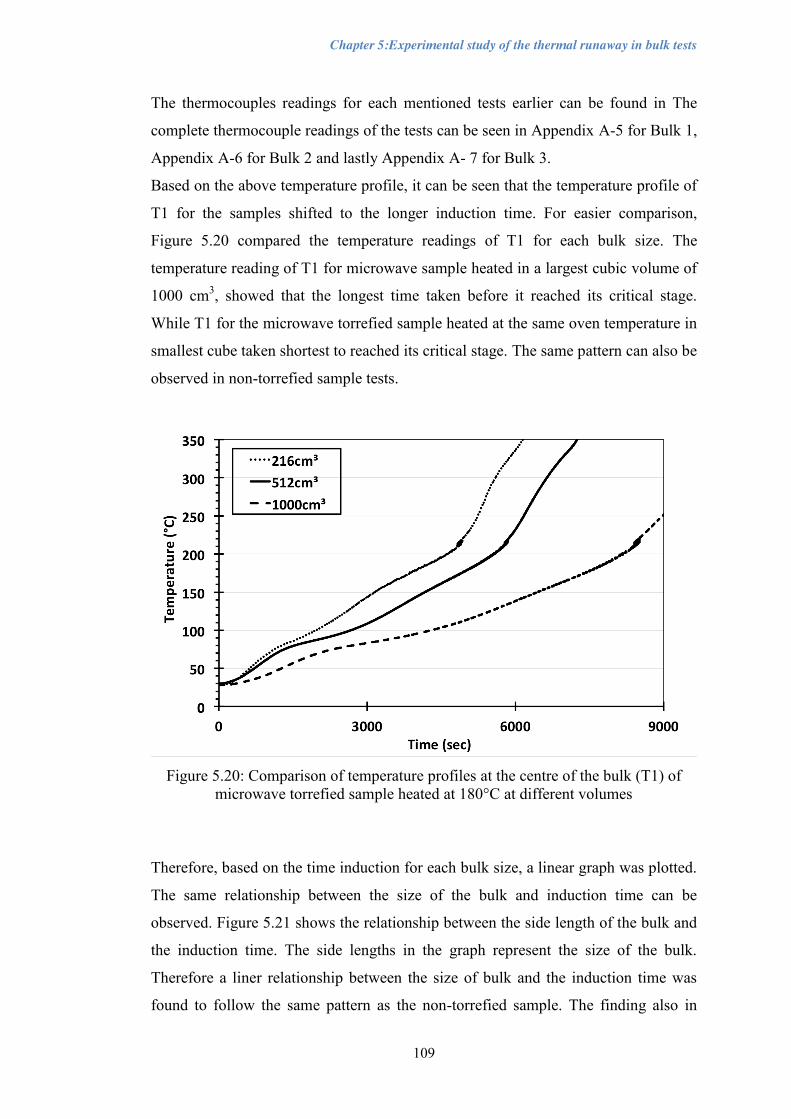
Chapter 5:Experimental study of the thermal runaway in bulk tests
109
The thermocouples readings for each mentioned tests earlier can be found in The
complete thermocouple readings of the tests can be seen in Appendix A-5 for Bulk 1,
Appendix A-6 for Bulk 2 and lastly Appendix A- 7 for Bulk 3.
Based on the above temperature profile, it can be seen that the temperature profile of
T1 for the samples shifted to the longer induction time. For easier comparison,
Figure 5.20 compared the temperature readings of T1 for each bulk size. The
temperature reading of T1 for microwave sample heated in a largest cubic volume of
1000 cm3, showed that the longest time taken before it reached its critical stage.
While T1 for the microwave torrefied sample heated at the same oven temperature in
smallest cube taken shortest to reached its critical stage. The same pattern can also be
observed in non-torrefied sample tests.
Figure 5.20: Comparison of temperature profiles at the centre of the bulk (T1) of
microwave torrefied sample heated at 180°C at different volumes
Therefore, based on the time induction for each bulk size, a linear graph was plotted.
The same relationship between the size of the bulk and induction time can be
observed. Figure 5.21 shows the relationship between the side length of the bulk and
the induction time. The side lengths in the graph represent the size of the bulk.
Therefore a liner relationship between the size of bulk and the induction time was
found to follow the same pattern as the non-torrefied sample. The finding also in

Chapter 5:Experimental study of the thermal runaway in bulk tests
110
agreement with the studies done by Graham (2015); Saddawi et al. (2013); Pauner &
Bygbjerg (2005) where the larger the bulk size the longer the induction time.
Figure 5.21: Relationship between side length and induction time for microwave
torrefied sample heated at 180°C
5.3.3 Discussion of effect of oven temperature on self-heating behaviour
Various oven temperature had been chosen to examine the effect of ambient
temperature towards the tendency of self-heating of the samples. The ambient
temperature played an important role towards the induction time of the sample before
self-heating was detected during the experiments. Thus, to examine the behaviour of
the microwave torrefied sample in various oven temperatures, smallest size of the
bulk was chosen. The smaller size of bulk will resulted in a higher ambient
temperature need for the sample to self-heat (Veznikova et al., 2014; Wolters et al.,
2003).
The samples were heated at oven temperature of 170ºC, 180ºC and 190ºC with the
same size of the cubic bulk of 216 cm3. Figure 5.22 shows the temperature profile of
the microwave torrefied sample heated at 170ºC. Self-heating was detected at 4440
seconds where the reading of thermocouple T1 started to exceeded the oven
temperature.
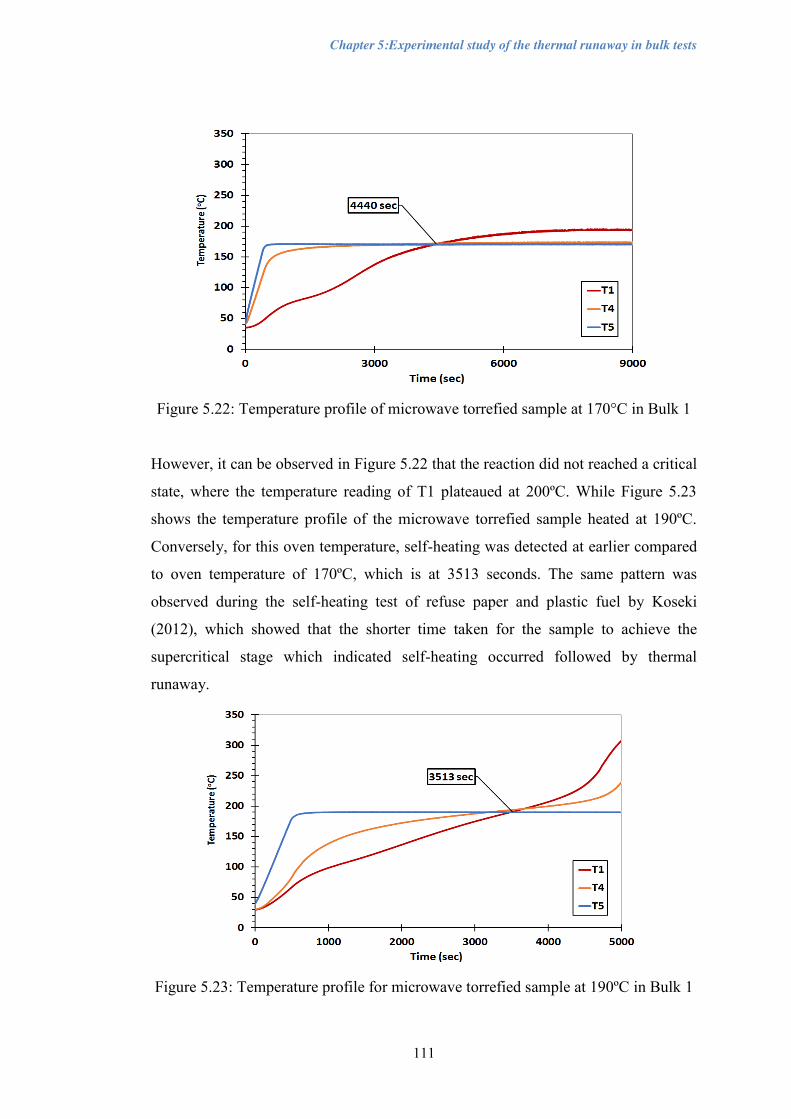
Chapter 5:Experimental study of the thermal runaway in bulk tests
111
Figure 5.22: Temperature profile of microwave torrefied sample at 170°C in Bulk 1
However, it can be observed in Figure 5.22 that the reaction did not reached a critical
state, where the temperature reading of T1 plateaued at 200ºC. While Figure 5.23
shows the temperature profile of the microwave torrefied sample heated at 190ºC.
Conversely, for this oven temperature, self-heating was detected at earlier compared
to oven temperature of 170ºC, which is at 3513 seconds. The same pattern was
observed during the self-heating test of refuse paper and plastic fuel by Koseki
(2012), which showed that the shorter time taken for the sample to achieve the
supercritical stage which indicated self-heating occurred followed by thermal
runaway.
Figure 5.23: Temperature profile for microwave torrefied sample at 190ºC in Bulk 1
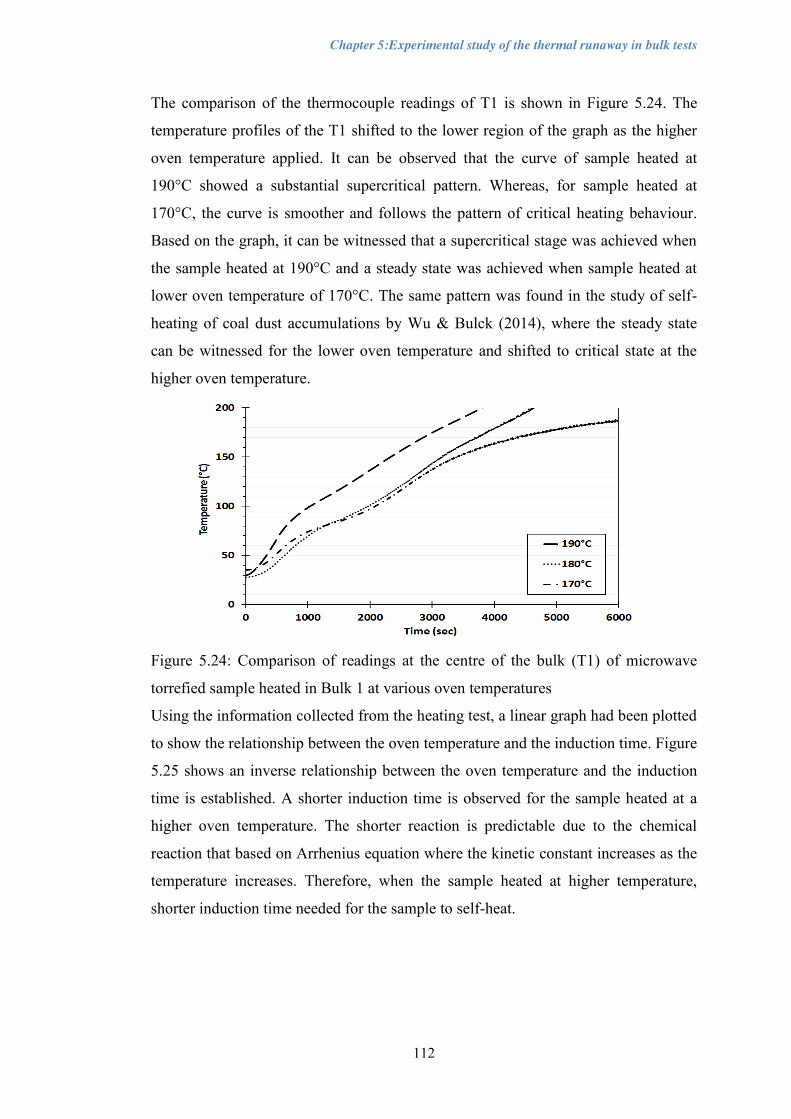
Chapter 5:Experimental study of the thermal runaway in bulk tests
112
The comparison of the thermocouple readings of T1 is shown in Figure 5.24. The
temperature profiles of the T1 shifted to the lower region of the graph as the higher
oven temperature applied. It can be observed that the curve of sample heated at
190°C showed a substantial supercritical pattern. Whereas, for sample heated at
170°C, the curve is smoother and follows the pattern of critical heating behaviour.
Based on the graph, it can be witnessed that a supercritical stage was achieved when
the sample heated at 190°C and a steady state was achieved when sample heated at
lower oven temperature of 170°C. The same pattern was found in the study of self-
heating of coal dust accumulations by Wu & Bulck (2014), where the steady state
can be witnessed for the lower oven temperature and shifted to critical state at the
higher oven temperature.
Figure 5.24: Comparison of readings at the centre of the bulk (T1) of microwave
torrefied sample heated in Bulk 1 at various oven temperatures
Using the information collected from the heating test, a linear graph had been plotted
to show the relationship between the oven temperature and the induction time. Figure
5.25 shows an inverse relationship between the oven temperature and the induction
time is established. A shorter induction time is observed for the sample heated at a
higher oven temperature. The shorter reaction is predictable due to the chemical
reaction that based on Arrhenius equation where the kinetic constant increases as the
temperature increases. Therefore, when the sample heated at higher temperature,
shorter induction time needed for the sample to self-heat.

Chapter 5:Experimental study of the thermal runaway in bulk tests
113
Figure 5.25: Relationship between the temperature and induction time
5.4 Conclusion
x The oven temperature used for non-torrefied sample is greater than 180oC as
the lower temperature does not give a sufficient heating that lead to self-heat.
While at 180o, the microwave torrefied sample showed self-heating
phenomena that led to thermal runaway.
x The microwave torrefied sample is more reactive compared to the non-
torrefied sample. Thus, agreeable to the findings of apparent kinetic
parameters.
x The induction time increased with the increased of the bulk volume. While
the induction time decreased when the oven temperature increased.
x The inversed relationship between oven temperature and induction time was
found from the test.
x The same pattern of the relationship between the induction time and the bulk
volume as well as the ignition time and the oven temperature is observed
when non-torrefied sample is used.

Chapter 6:Development of numerical models to simulate the self-heating process in bulk storage area
114
Chapter 6 Development of numerical models to simulate the self-heating process in bulk storage area
This chapter details the work undertaken in the development of self-heating model
based on mass and energy transfer equations for bulk storage using the properties
and the kinetic parameters determined from the experiments. The comparisons of the
thermal behaviour of both samples are based on the temperature profiles predicted
during the self-heating process. The model was used to predict the critical ambient
temperature and induction time of the self-heating process leading to ignition. The
effect of height of bulk and the ambient temperature of the storage as well as
properties of the material were investigated. Lastly, the model was verified by
comparing the temperature profiles of the bulk scale experiments to the simulations
results.
6.1 Self-heating of biomass fuels in open storage area
Self-heating within the biomass material causes the temperature rise during its
storage phase. The self-heating process leading to ignition is a problem in the
biomass fuels handling and storage. Self-ignition process of bulk biomass is started
when the heat produced inside the pile through exothermic process unable to be
dissipated to the surroundings. This situation is highly concerned when it comes to
the storage of large amount of biomass that can lead to uncontrolled positive heat
feedback that can lead thermal runaway.
Figure 6.1: Heat loop that leading to thermal runaway
Heat
Exothermic reaction
Increased in reaction
rate Heat dissipated
slows the reaction

Chapter 6:Development of numerical models to simulate the self-heating process in bulk storage area
115
Additional heat source may be precursor to the self-heating, such as physical
processes and biological activities. However, these models only consider the
exothermic reaction of chemical process. The biomass fuel is assumed to have a very
low moisture content that inhibit the growth of microorganisms, therefore the
exothermic reaction due to biological activities is ignored. In addition, heat from the
water adsorption/condensation is not included in the model as the reaction happens at
low temperature.
This work considers the heating process in rectangular shape pile, where the height is
the critical parameters for simulations. The pile is assumed to be stored indoor
without any aeration thus forced convection is negligible. The model of self-heating
in biomass pile is solved using COMSOL Multiphysics® software Ver. 4.4. For the
purpose of validation, the simulation of the bulk test is done to compare with the
simulations results of this section. The parameters to be studied are the height and
ambient temperature. This is because both are the easier parameter to be controlled
by the workers during handling and storage phase. Thus, it is practical to study these
parameters to give a clearer indications of what can the workers can do to ensure safe
handling of the biomass fuels.
6.2 The model set-up
To simplify the model, a two-dimensional model of heat and mass transfer is used
for the simulation. The bulk pile is deposited on a concrete base plate that was
considered as the insulated wall where the heat conduction between the bulk pile and
storage floor was ignored. Figure 6.2 shows the two-dimensional bulk geometry
model used for the simulation.
The boundary conditions are set as the constant temperature at the beginning of the
process that represents the critical ambient temperature (To) of the storage condition.
The top surface of the bulk geometry is subjected to a convection boundary condition
between the hotter ambient conditions that and the lower temperature of the bulk
pile. The natural convection is the dominant mechanism of oxygen access into the
bulk pile. The top and side surfaces were considered as open boundaries. The heat

Chapter 6:Development of numerical models to simulate the self-heating process in bulk storage area
116
source (Qsource) term is defined using the Arrhenius type rate equations. The kinetic
parameters are measured during the experimental work presented in Section 4.3.
Figure 6.2: Geometry of simplified model of the pile in an open storage.
6.3 Governing equations and computational module
A two-dimensional model is developed to simulate the self-heating process of both
samples examined earlier in the open storage environment. The mathematical model
based on the physic modules in COMSOL Multiphysics® to simulate the process of
heating up and the potential of self ignition processes in the open storage stockpile.
The stockpile is considered as a reactive porous medium where the prediction of
possible self-ignition risk was performed by modelling the equations for heat and
mass transfer, which includes the heat source from the exothermic chemical reaction.
In COMSOL Multiphysics® the numerical model of the self-heating process in the
bulk piles is using a multi-physics coupled heat and mass transfer in porous media.
In self-heating of biomass, the dominant source of heat is the chemical oxidation,
thus based on Blomqvist & Persson (2003) it can be governed fundamentally by the
rates of diffusion and convection of air from the surrounding area
Qsource
qconduction H

Chapter 6:Development of numerical models to simulate the self-heating process in bulk storage area
117
6.3.1 Mathematical model
Considering the complexity nature of the self-heating process, several assumptions
had been adopted to the model in order to simplify the simulation. Thus, the
following assumptions were chosen for this work:
i. The model proposed sufficiently porous and isotropic as well as a
homogenous pile;
ii. The deformation, shrinkage or collapsing of the pile are not considered;
iii. The ambient temperature is considered constant throughout the simulation;
iv. Heat transfer through the body is by conduction in porous media with air
filling the pores;
v. Heat transfers at the surface to the surroundings are by convection and
radiation;
vi. The storage floor is a perfectly concrete slab, which perhaps leads to
maximum heat build-up within the stored material;
vii. Natural convection is considered for the simulation as the stockpile storage
area is assumed not to be equipped with any fan or aeration equipment;
viii. The stockpile is reactive so that the solid percentage volume and gas
percentage volume remain unchanged during the self-heating; and
ix. The effect of moisture in the pile is neglected as the moisture content of the
material studied is considered low and the temperature increase due to
moisture is significantly low.
The governing equation of self-heating is based on the theory of energy conservation
in heat transfer in the porous pile as shown in Eq. 6.1 on 0 ≤ y ≤ h:
[(𝜀𝜌𝑔𝐶𝑔) + (1 − 𝜀)𝜌𝑠𝐶𝑠]𝜕𝑇𝜕𝑡+ 𝜌𝑔𝐶𝑔 (
𝜕𝑇𝜕𝑦) = 𝜆𝑒𝑓𝑓 (
𝜕2𝑇𝜕𝑦2) + (1 − 𝜀)𝐴𝑂2 exp (−
𝐸𝑎𝑅𝑇)
(Eq.6.1)
The effective thermal conductivity in the porous media;
𝜆𝑒𝑓𝑓 = 𝜀𝜆𝑔 + (1 − 𝜀)𝜆𝑠 (Eq. 6.2)
In the case of porous media, the oxygen diffusivity is considered as; 𝐷𝑜,𝑒𝑓𝑓 = 𝜀𝐷𝑜,𝑔

Chapter 6:Development of numerical models to simulate the self-heating process in bulk storage area
118
Thus the transport of oxygen concentration on 0 ≤ y ≤ h
𝜀 𝜕𝑂2𝜕𝑡= 𝐷𝑜,𝑒𝑓𝑓 (
𝜕2𝑂2𝜕𝑦2) − (1 − 𝜀)𝑂2 Aexp (−
𝐸𝑎𝑅𝑇) (Eq. 6.3)
An Arrhenius equation is used to represent the dependence of the kinetic rate
constant k on the temperature, T:
𝑘 = 𝐴 exp (− 𝐸𝑅𝑇) (Eq. 6.4)
A is pre-exponential factor (min-1), E is apparent activation energy (J mol-1), T is
temperature (K) and R is universal gas constant 8.3145 (J mol-1 K-1). The reaction
rate is given by:
𝑟𝑎𝑡𝑒 = 𝑘𝑂2 where rate constant, k is temperature dependent according to the Arrhenius equation
and O2 is the concentration of oxygen.
The storage simulated is based on large piles in an indoor storage. Thus, the effect of
wind is not considered. Thus, the heat transfer equation used in the convection heat
flux on the surface is driven by natural convection. The input parameters determined
from the experimental works used in the simulations are shown in Table 6.1. Specific
heat and thermal conductivity of both material is taken from literature Koufopanos et
al., (1991).
Table 6.1: Model inputs for simulation
Non-torrefied sample Microwave torrefied sample
Specific heat, Cp J/(kg.K) 1112.0+[4.85(T-273)] 1112.0+[4.85(T-273)]
Thermal conductivity, λp W/(m*K) 0.13+[0.0003(T-273)] 0.08-0.0001(T-273)
Bulk density, kg/m3 443 500
True density,ρp (kg/m3) 1451 1442
Porosity, ε 0.695 0.653
Activation energy, Ea (kJ/mol)
77.37 68.3
Pre-exponential factor, s-1 3.85E3 3.24E4

Chapter 6:Development of numerical models to simulate the self-heating process in bulk storage area
119
6.3.2 Mesh
The free triangular shape of mesh with the maximum element size is 0.135 m and the
minimum element size is 0.006 m. Element size for mesh chosen for the simulation
is the once calibrated for fluid dynamic.
Figure 6.3: Free triangular shape mesh was chosen for the simulation
6.4 Model validation
6.4.1 Introduction
To validate the numerical model discussed in Section 6.3.1 against the experimental
data, simulations of the heating behaviour were run based on actual conditions
during the study of the thermal runaway in bulk tests. The simulated results were
compared to the real data collected during the experiments. Hence, the simulations
were based on the effect of the oven temperature towards the bulk sample.
Therefore two separate domains were used to simulate the experiments, namely open
domain and porous domain. The porous domain is for the modelling of the wire
mesh basket while the open domain modelled the heating up by the oven using air as
a conductive medium. The validation model was built in 2-Dimensional
axisymmetric. This type of model was chosen to reduce the computation time and
modelling time. The validation of the model was done by comparing the temperature
profile at the centre of the bulk, which labeled as point T1 in the bulk test. The point
T1 is shown in Figure 6.4. The comparison of the centre temperature is chosen
because the self-heating process of the sample can only be detected when
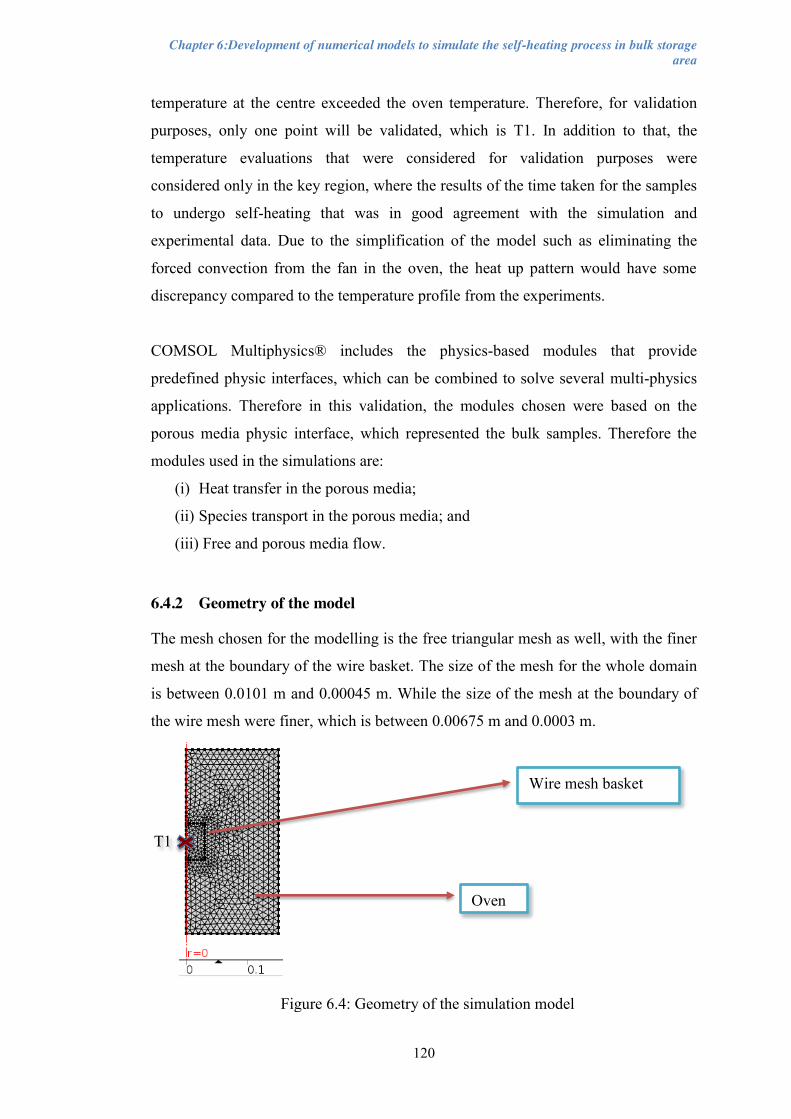
Chapter 6:Development of numerical models to simulate the self-heating process in bulk storage area
120
Wire mesh basket
Oven
Figure 6.4: Geometry of the simulation model
temperature at the centre exceeded the oven temperature. Therefore, for validation
purposes, only one point will be validated, which is T1. In addition to that, the
temperature evaluations that were considered for validation purposes were
considered only in the key region, where the results of the time taken for the samples
to undergo self-heating that was in good agreement with the simulation and
experimental data. Due to the simplification of the model such as eliminating the
forced convection from the fan in the oven, the heat up pattern would have some
discrepancy compared to the temperature profile from the experiments.
COMSOL Multiphysics® includes the physics-based modules that provide
predefined physic interfaces, which can be combined to solve several multi-physics
applications. Therefore in this validation, the modules chosen were based on the
porous media physic interface, which represented the bulk samples. Therefore the
modules used in the simulations are:
(i) Heat transfer in the porous media;
(ii) Species transport in the porous media; and
(iii) Free and porous media flow.
6.4.2 Geometry of the model
The mesh chosen for the modelling is the free triangular mesh as well, with the finer
mesh at the boundary of the wire basket. The size of the mesh for the whole domain
is between 0.0101 m and 0.00045 m. While the size of the mesh at the boundary of
the wire mesh were finer, which is between 0.00675 m and 0.0003 m.
T1

Chapter 6:Development of numerical models to simulate the self-heating process in bulk storage area
121
Figure 6.5: Temperature profile of microwave torrefied sample heat up in Bulk 1 at 190°C oven temperature at 5000 seconds.
6.4.3 Result of the validation
a) Validation of bulks test of microwave torrefied sample
The validation simulation was done for the bulk test using Bulk 1 at 190°C for
microwave torrefied sample. The temperature profile in the 2-D axisymmetric
geometric is shown in Figure 6.5. The higher temperature is detected at the wire
mesh filled with the sample (Bulk 1) after being heated up to 5000 seconds (83.3
minutes). The comparison of the temperature profile is shown in Figure 6.6. The
temperature development tends to slow down at the beginning up to 1750 seconds,
then exceeded the temperature pattern of the experimental result.
As mentioned earlier, only the key region of the simulation is significant in the
model validation. The early stage of the heating process of the simulation did not
follow the same pattern as the bulk test. Nevertheless, even though the patterns of the
temperature profiles were inconsistent before 1500 seconds, both temperature
profiles gave slightly the same induction time, where it can be witnessed that both
temperature profiles exceeded oven temperature at almost the same duration.
Therefore in Figure 6.6, only the temperature profile after 1500 seconds was
discussed.

Chapter 6:Development of numerical models to simulate the self-heating process in bulk storage area
122
The inconsistent temperature profiles at the beginning of the heating up process for
the simulated and the experimented data were predicted due to the simplification of
the model simulated. The air convection due to the fan inside the oven was not
included in the simulation model. According to Yan et al. (2005), the complexity of
the spontaneous ignition problem is due to the strong coupling between the air flow,
heat and mass transfer, physical and chemical reaction. Therefore, by deducting one
of the significant factors such as airflow due to a fan in the oven, it can prevent the
possibility of determining a reliable validation method. Besides that, the loss of
moisture during heating process was also ignored in the simulation. These factors
were significant reason that would contribute to the inconsistent temperature profile
measured for simulation and experimental data. This phenomenon occurred because
to the system was trying to balance the heat build up and the heat dissipated with the
effect of air circulation in the oven.
Then the validation was done for the second sample to see whether the pattern is the
same or not. The sample chosen is microwave torrefied sample in Bulk 1 heated at
180ºC oven temperature. Based on the temperature profiles in Figure 6,7 The
temperature patterns of the simulation result follow the one done earlier, with the
temperature slightly lower at the beginning and then increased afterwards. However,
Figure 6.6: The comparison of temperature profiles at the centre for microwave torrefied sample heated at 190°C.
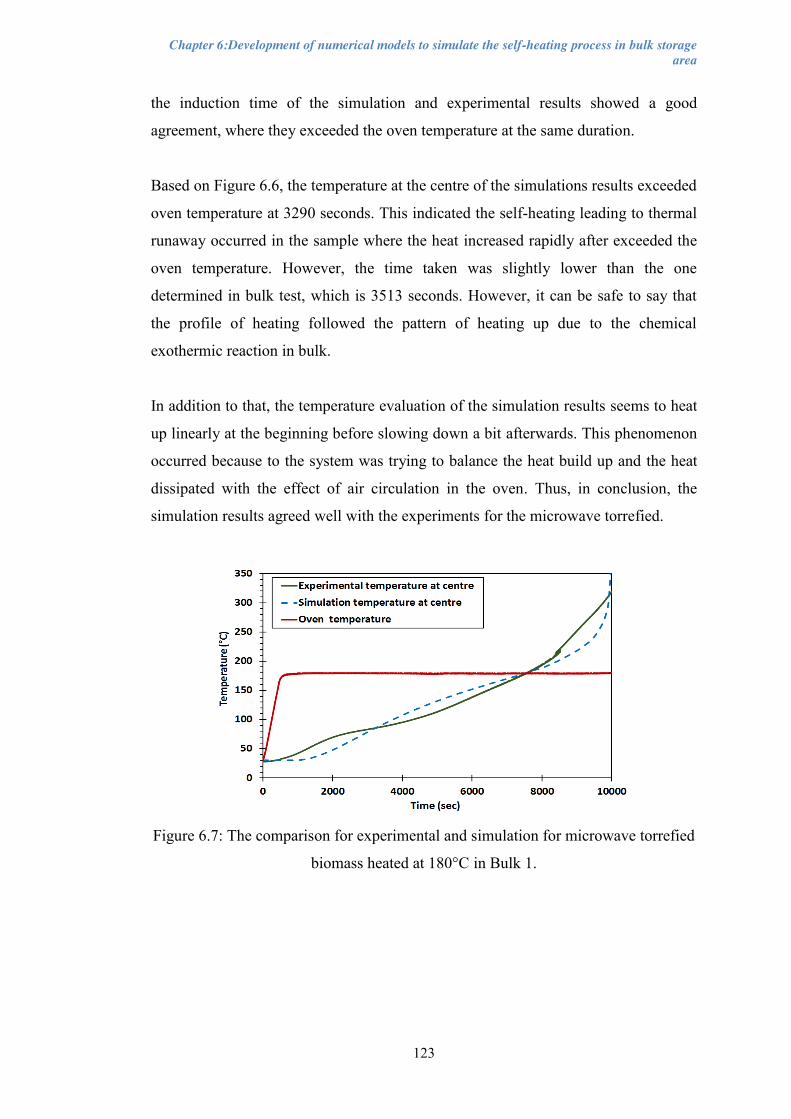
Chapter 6:Development of numerical models to simulate the self-heating process in bulk storage area
123
the induction time of the simulation and experimental results showed a good
agreement, where they exceeded the oven temperature at the same duration.
Based on Figure 6.6, the temperature at the centre of the simulations results exceeded
oven temperature at 3290 seconds. This indicated the self-heating leading to thermal
runaway occurred in the sample where the heat increased rapidly after exceeded the
oven temperature. However, the time taken was slightly lower than the one
determined in bulk test, which is 3513 seconds. However, it can be safe to say that
the profile of heating followed the pattern of heating up due to the chemical
exothermic reaction in bulk.
In addition to that, the temperature evaluation of the simulation results seems to heat
up linearly at the beginning before slowing down a bit afterwards. This phenomenon
occurred because to the system was trying to balance the heat build up and the heat
dissipated with the effect of air circulation in the oven. Thus, in conclusion, the
simulation results agreed well with the experiments for the microwave torrefied.
Figure 6.7: The comparison for experimental and simulation for microwave torrefied
biomass heated at 180°C in Bulk 1.

Chapter 6:Development of numerical models to simulate the self-heating process in bulk storage area
124
b) Validation of bulks test of non-torrefied sample
In order to validate the kinetic parameters of the non-torrefied sample, the model
validation was done at an oven temperature of 180ºC in Bulk 1. Based on Figure 6.8,
the same steady state achieved after the centre temperature reached the oven
temperature. The steady state achieved once the sample reached oven temperature,
which indicated that there is no self-heating occurred for the non-torrefied sample
heating at the specified condition. ,
Figure 6.8: The comparison between temperature patterns at the centre for
experimental and simulation for non-torrefied biomass heated at 180°C
Based on Figure 6.8, the temperature profile of the simulation results seem to follow
the one done in the experiment, but the temperature seems to shift to later time
compared to simulation. The temperature pattern is not consistent with the
experimental result. However it shows then the same finding, which no self-heat is
detected for the non-torrefied sample heated up in Bulk 1 at 180ºC. Overall, the
simulation results agreed well with the experiments. In particular, the time of
induction in the test runs closely matches the model predictions, despite their
inconsistent pattern.

Chapter 6:Development of numerical models to simulate the self-heating process in bulk storage area
125
6.5 Variable analysis
The spatial distribution of temperature is an important parameter to determine the
location of the ignition point. Thus, the results of the variable analysis in this section
are examined based on the temperature contours distribution. The variables study are
the pile height, pile width and the ambient temperature. The hottest point is the
maximum temperature detected within the pile. Thus, the evolution of the hottest
point with the ignition induction time for each simulation is used to predict the
possibility if the self-heating that lead to ignition within the pile. Based on the spatial
distribution, the location of the ignition can be detected. The influences of the
variables on the hottest point (maximum temperature) are evaluated.
6.5.1 Effect of pile height
The effect of the pile height is examined for both samples, where the temperature
profile presented on the left is for microwave torrefied sample and on the right is for
the non-torrefied sample. It was presented side by sides to give an easy comparison
of the temperature evolution. To evaluate the effect of the height of pile for both
sample, the simulation was done at an ambient temperature of 60°C, at different pile
heights of 2, 4, 6, and 8 m for 4500 hours (187.5 days).
The heights are chosen based on the recommendation of stack height in the literature
such as (Krigstin & Wetzel, 2016; Hogland & Marques, 2003; Blomqvist & Persson,
2003). Besides that, Murasawa et al. (2012) had proved that it was not practical to
pile up the biomass material such as more than 10 meters. Based on their study, the
critical ignition temperature of the material can be as low as 50 °C. Therefore, after
taking those literature into consideration, those pile heights was chosen for
simulation purposes to examine the effect of the pile height on the tendency of the
samples to self-heat.

Chapter 6:Development of numerical models to simulate the self-heating process in bulk storage area
126
Figure 6.9: Temperature contours of pile height of 2 m stored at the ambient
temperature of 60°C for 4500hours.
a) Simulation of pile height of 2 m at an ambient temperature of 60°C for 4500 hours.
a) Microwave torrefied sample (b) Non-torrefied sample
Figure 6.9 shows the hottest spots for both samples are at the bottom centre (1.5,0).
The highest temperature detected in a non-torrefied sample is lower that the one in
microwave torrefied sample. Thus indicated that the microwave torrefied sample is
more reactive compared to the non-torrefied sample, where the heat due to the
chemical reaction able to dissipated to the surrounding and balances the heat build up
in the non-torrefied sample.
The simulation conditions for both samples indicated that no ignition detected after
4500 hours (187.5 days). However, at 4500 hours, the highest temperature detected
for microwave torrefied sample was 66.8ºC, which greater than the non-torrefied
sample which is only 61.8ºC. Therefore, 8% increased the highest temperature
compared to the ambient temperature of 60ºC. Thus, at pile height of 2 m and
ambient temperature of 60ºC, the storage condition is considered as safe, which no
self-heating detected.
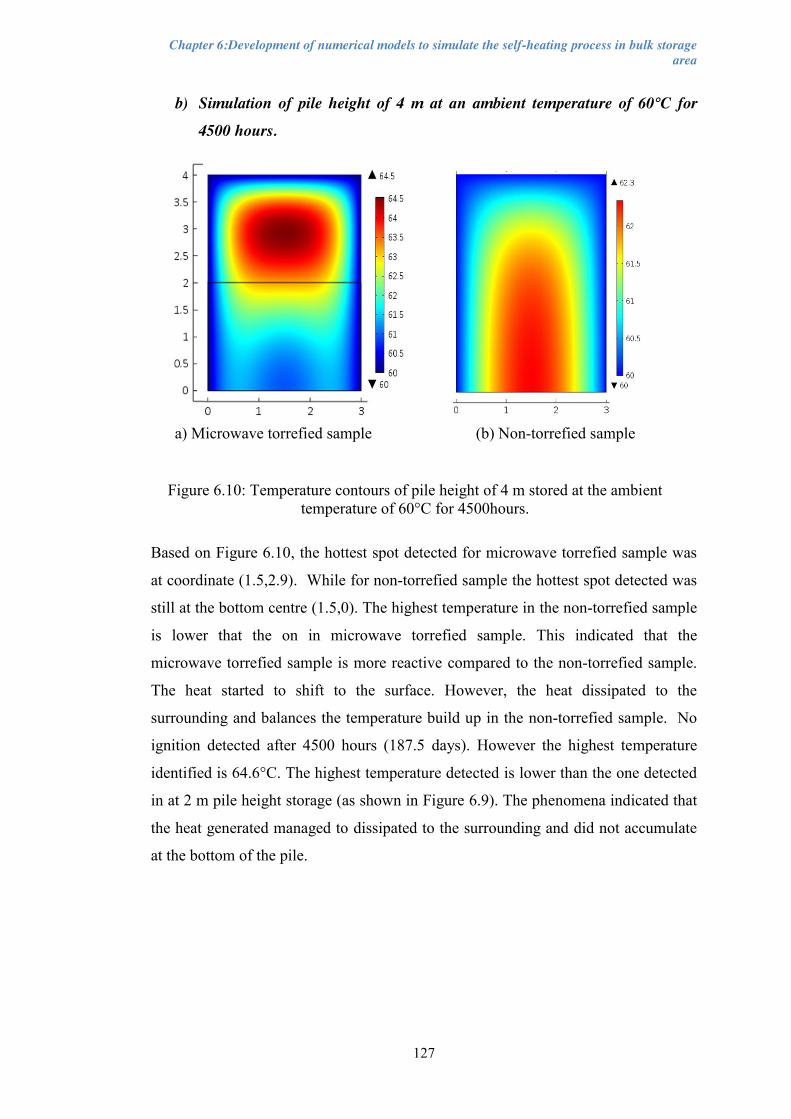
Chapter 6:Development of numerical models to simulate the self-heating process in bulk storage area
127
Figure 6.10: Temperature contours of pile height of 4 m stored at the ambient temperature of 60°C for 4500hours.
b) Simulation of pile height of 4 m at an ambient temperature of 60°C for
4500 hours.
a) Microwave torrefied sample (b) Non-torrefied sample
Based on Figure 6.10, the hottest spot detected for microwave torrefied sample was
at coordinate (1.5,2.9). While for non-torrefied sample the hottest spot detected was
still at the bottom centre (1.5,0). The highest temperature in the non-torrefied sample
is lower that the on in microwave torrefied sample. This indicated that the
microwave torrefied sample is more reactive compared to the non-torrefied sample.
The heat started to shift to the surface. However, the heat dissipated to the
surrounding and balances the temperature build up in the non-torrefied sample. No
ignition detected after 4500 hours (187.5 days). However the highest temperature
identified is 64.6°C. The highest temperature detected is lower than the one detected
in at 2 m pile height storage (as shown in Figure 6.9). The phenomena indicated that
the heat generated managed to dissipated to the surrounding and did not accumulate
at the bottom of the pile.

Chapter 6:Development of numerical models to simulate the self-heating process in bulk storage area
128
Figure 6.11: Temperature contours of pile height of 6 m stored at the ambient
temperature of 60°C for 4500hours.
c) Simulation of pile height of 6 m at the ambient temperature of 60°C for
4500 hours.
a) Microwave torrefied sample (b) Non-torrefied sample
Figure 6.11(a) shows the temperature contour of the hottest spot detected for
microwave torrefied sample was at coordinate (1.5, 4.9) after 4500 seconds. For a
non-torrefied sample, the hottest spot detected is still at the bottom centre (1.5, 0).
The highest temperature in the non-torrefied sample is lower that the on in
microwave torrefied sample. However, no ignition detected after 4500 hours (187.5
days). The region with highest temperature distribution is shifted to the top of the
pile. As the heat losses are tend to be on the surface of the pile.
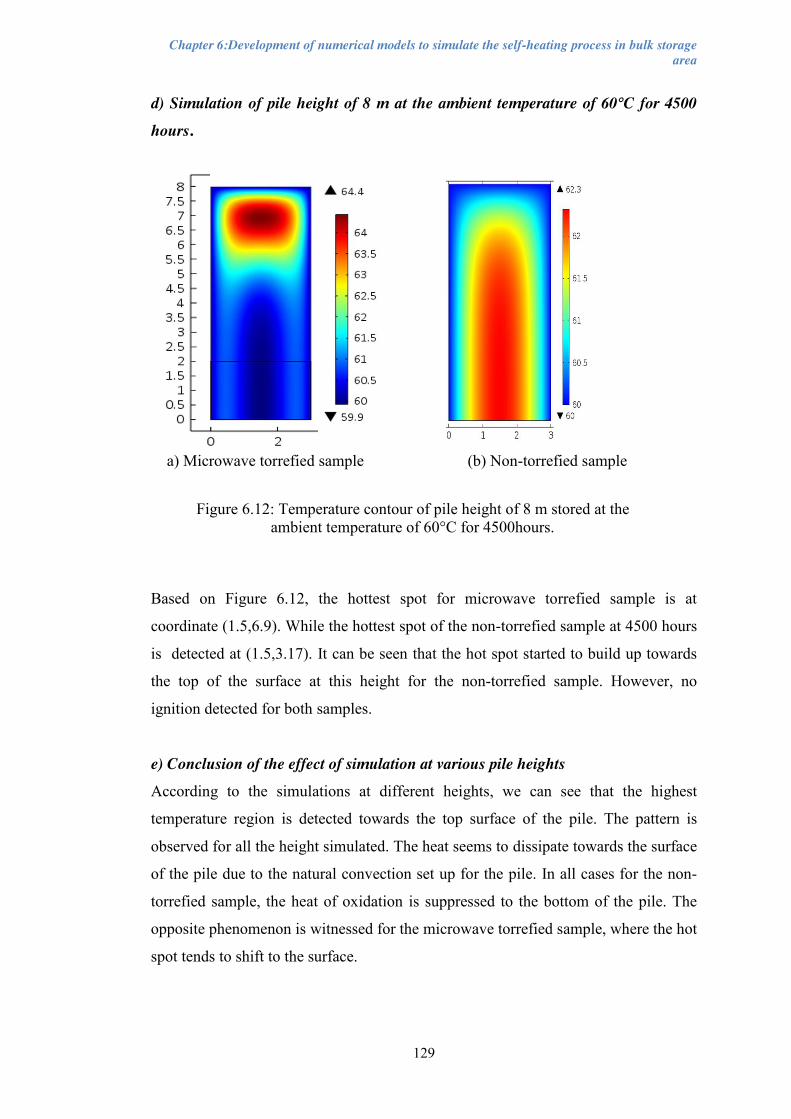
Chapter 6:Development of numerical models to simulate the self-heating process in bulk storage area
129
Figure 6.12: Temperature contour of pile height of 8 m stored at the
ambient temperature of 60°C for 4500hours.
d) Simulation of pile height of 8 m at the ambient temperature of 60°C for 4500
hours.
a) Microwave torrefied sample (b) Non-torrefied sample
Based on Figure 6.12, the hottest spot for microwave torrefied sample is at
coordinate (1.5,6.9). While the hottest spot of the non-torrefied sample at 4500 hours
is detected at (1.5,3.17). It can be seen that the hot spot started to build up towards
the top of the surface at this height for the non-torrefied sample. However, no
ignition detected for both samples.
e) Conclusion of the effect of simulation at various pile heights
According to the simulations at different heights, we can see that the highest
temperature region is detected towards the top surface of the pile. The pattern is
observed for all the height simulated. The heat seems to dissipate towards the surface
of the pile due to the natural convection set up for the pile. In all cases for the non-
torrefied sample, the heat of oxidation is suppressed to the bottom of the pile. The
opposite phenomenon is witnessed for the microwave torrefied sample, where the hot
spot tends to shift to the surface.
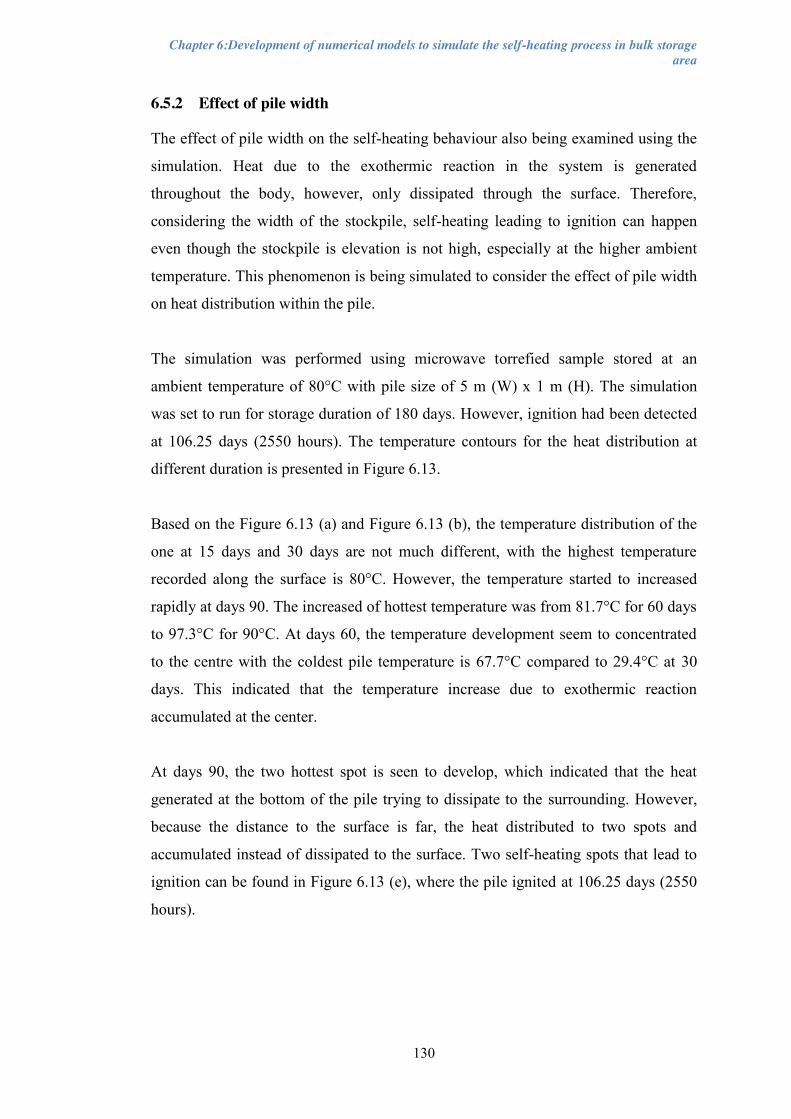
Chapter 6:Development of numerical models to simulate the self-heating process in bulk storage area
130
6.5.2 Effect of pile width
The effect of pile width on the self-heating behaviour also being examined using the
simulation. Heat due to the exothermic reaction in the system is generated
throughout the body, however, only dissipated through the surface. Therefore,
considering the width of the stockpile, self-heating leading to ignition can happen
even though the stockpile is elevation is not high, especially at the higher ambient
temperature. This phenomenon is being simulated to consider the effect of pile width
on heat distribution within the pile.
The simulation was performed using microwave torrefied sample stored at an
ambient temperature of 80°C with pile size of 5 m (W) x 1 m (H). The simulation
was set to run for storage duration of 180 days. However, ignition had been detected
at 106.25 days (2550 hours). The temperature contours for the heat distribution at
different duration is presented in Figure 6.13.
Based on the Figure 6.13 (a) and Figure 6.13 (b), the temperature distribution of the
one at 15 days and 30 days are not much different, with the highest temperature
recorded along the surface is 80°C. However, the temperature started to increased
rapidly at days 90. The increased of hottest temperature was from 81.7°C for 60 days
to 97.3°C for 90°C. At days 60, the temperature development seem to concentrated
to the centre with the coldest pile temperature is 67.7°C compared to 29.4°C at 30
days. This indicated that the temperature increase due to exothermic reaction
accumulated at the center.
At days 90, the two hottest spot is seen to develop, which indicated that the heat
generated at the bottom of the pile trying to dissipate to the surrounding. However,
because the distance to the surface is far, the heat distributed to two spots and
accumulated instead of dissipated to the surface. Two self-heating spots that lead to
ignition can be found in Figure 6.13 (e), where the pile ignited at 106.25 days (2550
hours).

Chapter 6:Development of numerical models to simulate the self-heating process in bulk storage area
131
Figure 6.13: Temperature contours of torrefied sample with pile size 1(H) x 5 (W) meter and ambient temperature 80°C
a) At 15 days b) At 30 days
c) At 60 days d) At 90 days
e) At 106 days
At 720 hours
At 1440 hours

Chapter 6:Development of numerical models to simulate the self-heating process in bulk storage area
132
The temperature profile of the hottest spot (1.5,0) is plotted in Figure 6.14. The
exponential rise of the temperature profile can be seen after 2550 hours. The
simulation indicated that the temperature profile at the hottest spot shows a
supercritical curve. Where the heat production in a pile surpassed the ambient
temperature. The thermal runaway is considered to happen here. Even though the
pile height is just 1 m, it can be seen here that the heat build up from the exothermic
reaction was high as the reaction rate increase with temperature.
Figure 6.14: Temperature profile at the hottest spot of the microwave torrefied
sample after being stored for 2550 hours at ambient temperature of 80°C
6.5.3 Effect of ambient temperature
Different ambient temperature can be simulated to examine the effect of ambient
temperature on the self-heating tendency of the samples. Therefore a critical ambient
temperature can be determined for the samples. The critical ambient temperature is
defined as the ambient temperature at which the internal heat generation exactly
balances with the heat loss in the system (Morrison & Hart, 2012). Consequently,
below are the discussions to examine the effect of ambient temperature on self-
heating behaviour
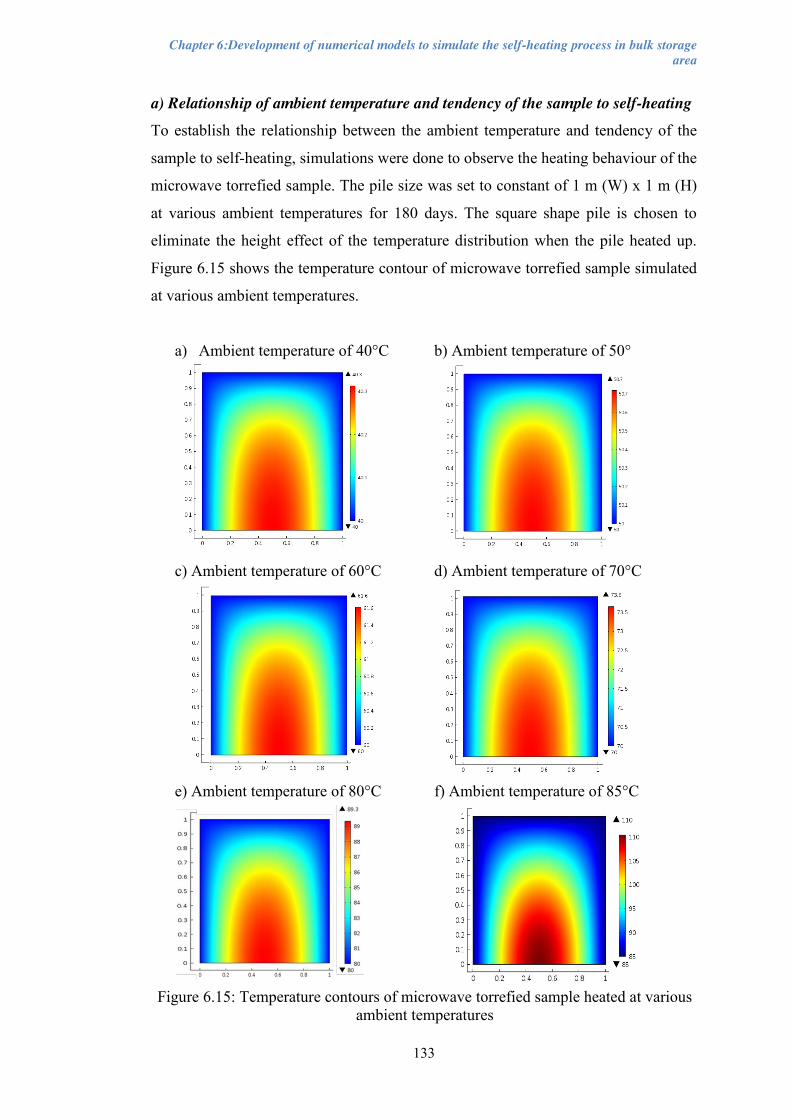
Chapter 6:Development of numerical models to simulate the self-heating process in bulk storage area
133
Figure 6.15: Temperature contours of microwave torrefied sample heated at various ambient temperatures
a) Relationship of ambient temperature and tendency of the sample to self-heating
To establish the relationship between the ambient temperature and tendency of the
sample to self-heating, simulations were done to observe the heating behaviour of the
microwave torrefied sample. The pile size was set to constant of 1 m (W) x 1 m (H)
at various ambient temperatures for 180 days. The square shape pile is chosen to
eliminate the height effect of the temperature distribution when the pile heated up.
Figure 6.15 shows the temperature contour of microwave torrefied sample simulated
at various ambient temperatures.
a) Ambient temperature of 40°C b) Ambient temperature of 50°
c) Ambient temperature of 60°C d) Ambient temperature of 70°C
e) Ambient temperature of 80°C f) Ambient temperature of 85°C

Chapter 6:Development of numerical models to simulate the self-heating process in bulk storage area
134
Figure 6.15 (a) and Figure 6.15 (b) shows the temperature contours of the pile when
the ambient temperature is 40°C and 50°C respectively. Based on the Figure 6.15
(d), the temperature increase is quite small over the pile after 180 days, with just
3.6°C increased after 180 days. Thus the temperature effect of 70°C is still not very
significant to started up the heating process due to the chemical reaction. However, if
the pile heated up for a longer time, the self-heating will be started to show.
After 180 days., the temperature increased in a pile stored at an ambient temperature
of 80°C is 9.3°C. The temperature difference is obvious when the pile stored at an
ambient temperature of 80°C. Thus, 80°C is the temperature that can trigger the self-
heating leading to thermal runaway. At 85°C, the increased of temperature started to
concentrate to the bottom (Figure 6.15 (f)).
The highest temperature achieved when stored at different ambient temperatures
were plotted in Figure 6.16. The relationship between ambient temperature and
highest temperature reached by the pile can be explained, where at 80°C of ambient
temperature, the highest temperature of the pile increased only about 11% from the
ambient temperature. However, at 85°C of ambient temperature simulated, the
highest pile temperature increased up to 110°C, which is an increase of 29%. Thus,
the higher the ambient temperature, the higher the tendency othe pile temperature to
increases, which unfortunately will lead to self-ignition.
Figure 6.16: Relationship between highest pile temperature and the ambient
temperature of microwave torrefied sample

Chapter 6:Development of numerical models to simulate the self-heating process in bulk storage area
135
Figure 6.17: Temperature contours at ambient temperature of 50°C
Based on the previous study done in the industrial food waste, the material will
gradually generate heat through fermentation as well as oxidation process although
stored at near room temperature (Murasawa et al., 2012). Therefore in some cases, it
can cause self-ignition when the heat generated exceeds the heat that can be
dissipated. Furthermore, critical temperature for each material is unique for given
surface to volume ratio, which follows the Arrhenius equation as discussed in
important findings in self-heating theory by Bowes (1971)
b) Comparison of the self-heating tendency of both samples
The effect of temperature was then tested on both samples, and the temperature
profiles were presented side by sides to give an easy comparison of the temperature
evolution. The pile size is 3 x 8 m, and temperature of 50, 60, 80 and 85 °C were
chosen for comparison purposes, and simulation was run for 365 days. The height of
8 meter was chosen in the simulations due to the criticality of the height when
simulated in Section 6.5.1. However, not all samples can be simulated up to 365days
as the self-heating lead to ignition occurs before 365 days.
(i) Ambient temperature of 50°C
For the first simulation, the ambient temperature of 50°C is chosen. Based on the
Figure 6.16, the temperature contours for both samples look slightly the same with
maximum temperature increased after 365 days is only 0.1°C.
a) Microwave torrefied sample (b) Non-torrefied sample

Chapter 6:Development of numerical models to simulate the self-heating process in bulk storage area
136
Figure 6.18: Temperature profile of hottest point at ambient temperature of 50°C
Therefore, no self-heating was detected at the end of the simulation, which implies
that when the sample stored below the critical ambient temperature, the internal heat
generation balances with heat loss in the system (Morrison & Hart, 2012). According
to the simulations, both samples will theoretically pose no risk of self-heating to
ignition if stored at 50°C for a year. However, in order to see the temperature
evolution in bulk, the temperature evolution of the hottest point for each sample was
plotted in Figure 6.18. A different temperature profile patterns can be seen for the
samples, where the non-torrefied samples (Figure 6.18 (b)) shows the steady state
curve after 100 days. However, for microwave torrefied sample, a smooth
temperature increases can be seen after 150 days. This pattern suggested that there is
a possibility for the microwave torrefied sample to undergo self-heating if stored
more than 365 days. This simulation stops at 365 days, due to the realism of the
storage duration of biomass fuels in energy industry which will not be more than a
year. Though there is higher risk of microwave torrefied sample to self-heat than the
non-torrefied sample to self-heat, there is still relatively low risk of self-heating
occurance for both samples stored in 50°C.
a) Microwave torrefied sample (b) Non-torrefied sample
(ii) Ambient temperature of 60°C
The simulations were extended for the higher ambient temperature of 60°C for 365
days. The results of the temperature contours from the simulations of both samples
were shown in Figure 6.19. Based on the temperature contours for both samples, it
can be witnessed that the evolution of the hottest point is shifted to the top centre of
the pile in the microwaved torrefied sample (see Figure 6.19 (a)). The hottest point is
detected at (1.5, 4.5) compared the hottest point of the non-torrefied samples that

Chapter 6:Development of numerical models to simulate the self-heating process in bulk storage area
137
occurred at the bottom of the pile. In addition to that, the highest temperature
measured in microwave torrefied sample was 145°C compared to only 62.6°C for the
non-torrefied sample. The temperature rise in the bulk for microwave torrefied
sample indicated that self-heating occurred if stored for 365 days.
a) Microwave torrefied sample (b) Non-torrefied sample
Figure 6.19: Temperature contour at ambient temperature of 60°C
The analysis was extended with the plotted temperature of the hottest spot for both
samples. As shown in Figure 6.20, there is an obvious distinctive pattern between
Figure 6.20 (a) and Figure 6.20 (b); which in Figure 6.20 (b) the steady state is
reached by the non-torrefied sample after roughly 90 days, which is much shorter
than the one showed for the non-torrefied sample stored at 50ºC. The shorter
duration showed that the system achieved steady state faster in higher ambient
temperature.
a) Microwave torrefied sample (b) Non-torrefied sample
Figure 6.20: Temperature profile of hottest point at ambient temperature of 60°C

Chapter 6:Development of numerical models to simulate the self-heating process in bulk storage area
138
However, for microwave torrefied sample, a supercritical behaviour is However, no
ignition is detected for the non-torrefied samples stored at 60°C; it is unlikely that
this condition simulated would have reached spontaneous ignition witnessed in
Figure 6.20 (a). The rapid increased of temperature can be seen and the thermal
runaway pattern was detected at 320 days. The same supercritical behaviour that
indicated the self-ignition due to self-heating process can also be seen in the several
studies of self-heating behaviour (Chen, Sidhu, & Nelson, 2013; Ramírez, García-
torrent, & Tascón, 2010; Jones & Vais, 1991). The comparison of the hottest point in
Figure 6.20, shows that the non-torrefied sample is much less reactive in both
temperatures, however at the ambient temperature of 60ºC the reaction rate
increased. The exothermic reaction in of the system seems to increase with the
increase of the ambient temperature (Garcia Torrent et al., 2015). Therefore the
steady state is reached earlier when simulated in an ambient temperature of 60ºC
compared to the one simulated in an ambient temperature of 50ºC.
(iii) Ambient temperature of 80°C
To examine the effect of higher ambient temperature, 80°C was chosen for
simulations. Based on Figure 6.21, a different pattern of the temperature contours of
the pile at an ambient temperature of 80ºC is witnessed. The hottest region of the
microwave torrefied sample followed the same pattern as observed at an ambient
temperature of 80°C, where the location of the hottest region shifted to the surface of
the pile.
a) Microwave torrefied sample (b) Non-torrefied sample
Figure 6.21: Temperature contour of hottest point at ambient temperature of 80°C
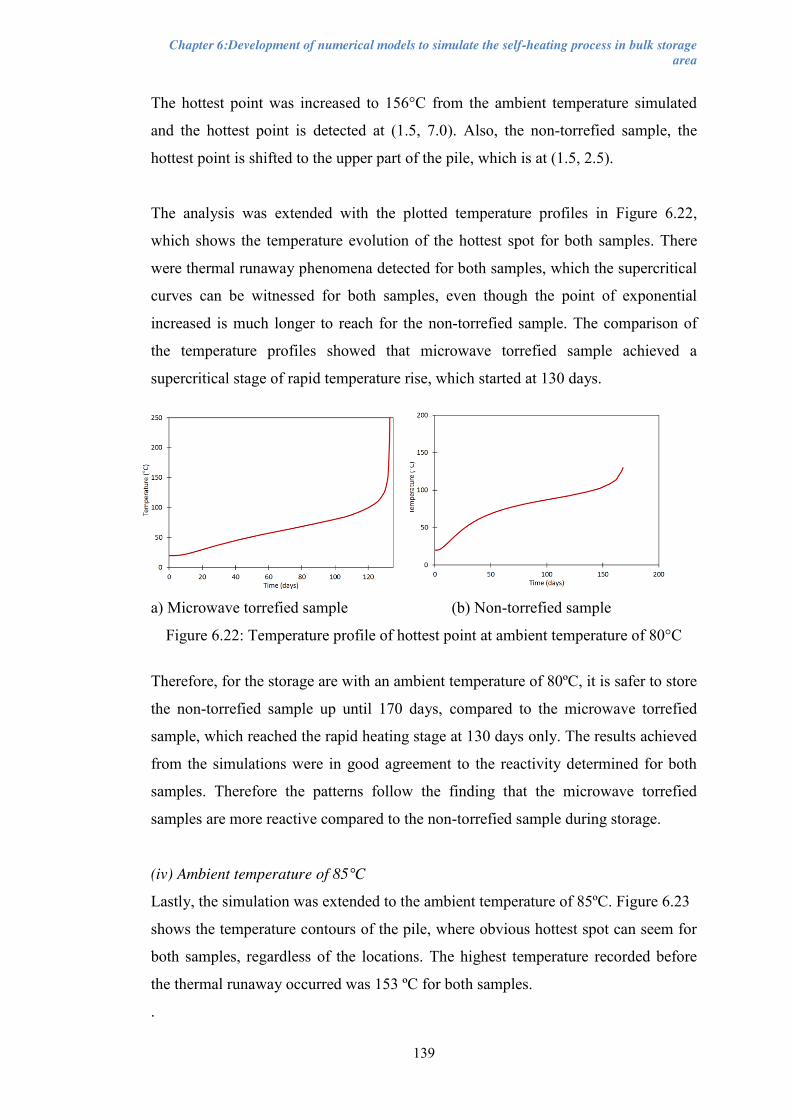
Chapter 6:Development of numerical models to simulate the self-heating process in bulk storage area
139
The hottest point was increased to 156°C from the ambient temperature simulated
and the hottest point is detected at (1.5, 7.0). Also, the non-torrefied sample, the
hottest point is shifted to the upper part of the pile, which is at (1.5, 2.5).
The analysis was extended with the plotted temperature profiles in Figure 6.22,
which shows the temperature evolution of the hottest spot for both samples. There
were thermal runaway phenomena detected for both samples, which the supercritical
curves can be witnessed for both samples, even though the point of exponential
increased is much longer to reach for the non-torrefied sample. The comparison of
the temperature profiles showed that microwave torrefied sample achieved a
supercritical stage of rapid temperature rise, which started at 130 days.
a) Microwave torrefied sample (b) Non-torrefied sample
Figure 6.22: Temperature profile of hottest point at ambient temperature of 80°C
Therefore, for the storage are with an ambient temperature of 80ºC, it is safer to store
the non-torrefied sample up until 170 days, compared to the microwave torrefied
sample, which reached the rapid heating stage at 130 days only. The results achieved
from the simulations were in good agreement to the reactivity determined for both
samples. Therefore the patterns follow the finding that the microwave torrefied
samples are more reactive compared to the non-torrefied sample during storage.
(iv) Ambient temperature of 85°C
Lastly, the simulation was extended to the ambient temperature of 85ºC. Figure 6.23
shows the temperature contours of the pile, where obvious hottest spot can seem for
both samples, regardless of the locations. The highest temperature recorded before
the thermal runaway occurred was 153 ºC for both samples.
.
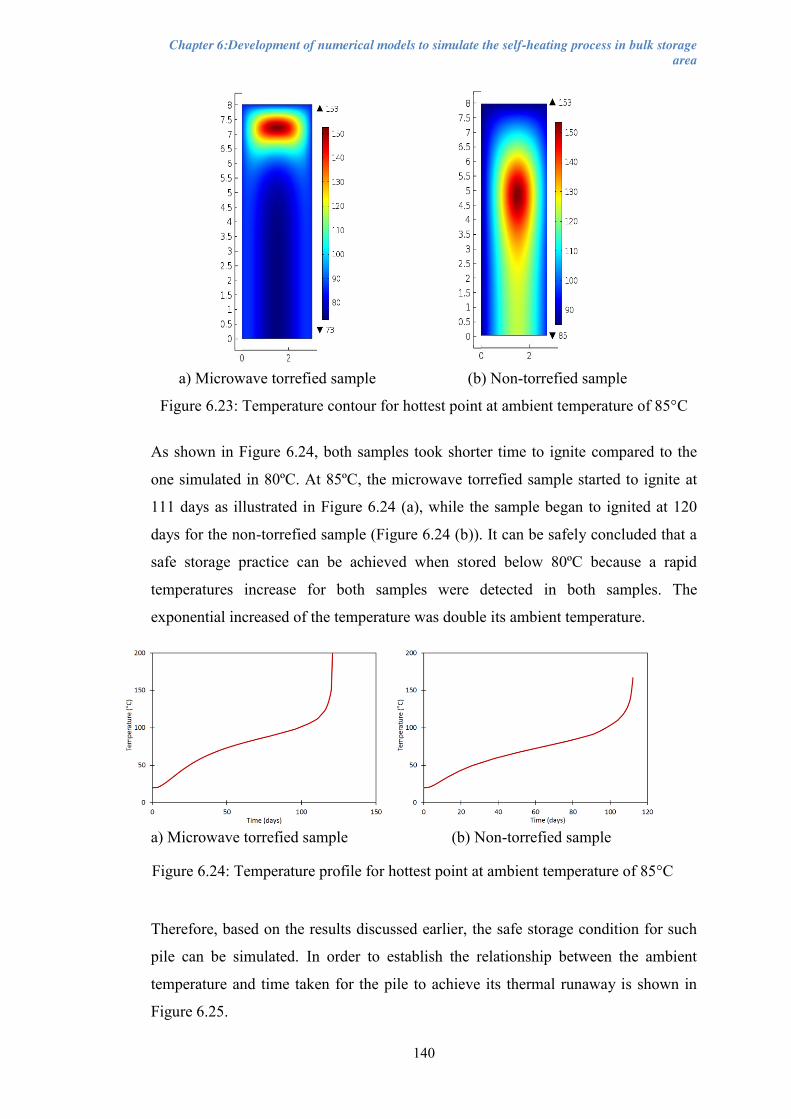
Chapter 6:Development of numerical models to simulate the self-heating process in bulk storage area
140
Figure 6.24: Temperature profile for hottest point at ambient temperature of 85°C
a) Microwave torrefied sample (b) Non-torrefied sample
Figure 6.23: Temperature contour for hottest point at ambient temperature of 85°C
As shown in Figure 6.24, both samples took shorter time to ignite compared to the
one simulated in 80ºC. At 85ºC, the microwave torrefied sample started to ignite at
111 days as illustrated in Figure 6.24 (a), while the sample began to ignited at 120
days for the non-torrefied sample (Figure 6.24 (b)). It can be safely concluded that a
safe storage practice can be achieved when stored below 80ºC because a rapid
temperatures increase for both samples were detected in both samples. The
exponential increased of the temperature was double its ambient temperature.
a) Microwave torrefied sample (b) Non-torrefied sample
Therefore, based on the results discussed earlier, the safe storage condition for such
pile can be simulated. In order to establish the relationship between the ambient
temperature and time taken for the pile to achieve its thermal runaway is shown in
Figure 6.25.

Chapter 6:Development of numerical models to simulate the self-heating process in bulk storage area
141
Figure 6.25: Relationship between the ambient temperature and induction time for microwave torrefied sample
Based on the relationship between the ambient temperature and induction time for
microwave torrefied sample, if the ambient temperature reached 80°C, the
microwave torrefied sample cannot be kept more than 133 days. However, based on
this thermal stability map, for long term storage, the microwave torrefied sample is
safer to be stored at normal room temperature, or somehow below 50°C. Therefore
microwave torrefied material is safe to store in the short-term period, for example,
less than three months to avoid the self-heating that lead to self-ignition of the
samples to occur.
6.6 Discussions on effect of the variables
Morrison & Hart (2012) had stated that the possibilities for a biomass bulk material
to self-heat is an important chemical reactivity hazard that must be effectively
managed to limit the possibilities of thermal runaway to occur due to self-heat. The
result of the effect of height towards self-heating tendency showed the same
conclusion as made by researchers such as Zhu et al. (2013) on coarse coal stockpile,
Jirjis (2005) on willow shoots, Guo (2013b) on wood pellets. All the researchers had
concluded that effect of height could be an ideally controllable variable to avoid the
spontaneous heating problem from occurring.
Safe region
Possible to ignite

Chapter 6:Development of numerical models to simulate the self-heating process in bulk storage area
142
Based on the finding from Section 6.5.1, we can see that the shorter pile height will
make it easier for heat accumulated in the system to dissipate to the surrounding
through the surface area. All the increase of the temperature determined from the
simulation is less than 7 % increase. Furthermore, even though no ignition detected
when the samples simulated for each of the simulation, it is still a bad practice to let
a biomass pile heat, as it will degrade the quality of the biomass itself.
Storage below critical ambient temperature leads to a steady state condition, which
the heat dissipated to the surrounding balances the internal heat generation. Morrison
& Hart (2012) described that the biomass will theoretically pose no risk of self-
heating that leads to self-ignition. Section 6.5.2 showed that, when the ambient
temperature increases, the temperature of the pile gradually increased towards a rapid
temperature increased. Consequently, a critical ambient temperature should be
determined to achieve a safe storage and handling condition. Many researchers such
as Luo et al. (2016); Larsson et al. (2012); Bygbjerg & Pauner (2006) managed to
find the unique relationship between critical ambient temperature and the type of the
biomass tested as well as the size of the pile. The higher critical ambient temperature
is determined for the non-torrefied sample due to its reactivity. Based on the
reactivity study done, it is concluded that the microwave torrefied sample is more
reactive, thus the critical ambient temperature for handling and storage purposes is
lower compared the non-torrefied sample.
The biomass fuels need to be store in a smaller pile, to avoid the self-heating that
lead to ignition. In addition to that, existing practice in the biomass handling and
storage also prevent the pile of the stockpile in great width. Therefore, for
practicality and safety issues, the pile should be piled up horizontally and avoid a
long horizontal pile. This conclusion is in agreement with the findings by Saddawi et
al. (2013).
Chapter 6:Development of numerical models to simulate the self-heating process in bulk storage area
143
6.7 Summary
x The validation of simulation model agreed well with the experiments. In
particular, the time of induction in the test runs closely matches the model
predictions, despite their inconsistency in temperature pattern. The highest
temperature region tends to fall at the surface at the pile
x At 80°C of ambient temperature, the maximum temperature of the pile
increased about 11% from the ambient temperature and at 85°C of ambient
temperature simulated, the highest pile temperature increased up to 110°C,
which is an increase of 29%.
x The exponential graph is plotted based on the relationship between the
ambient temperature and the highest temperature within the piles. The
exponential increase is detected after the ambient temperature of 80°C.
x The simulation can provide some suggestions on how to control the
parameters to retard or suppress the self-heating taking place in the biomass
fuel piles and as the guides in performing a larger scale of simulations.
x Based on the simulation, it can be concluded that the microwave torrefied
sample is more reactive than the non-torrefied sample
x 80°C is considered as critical ambient temperature for the storage condition
of the pile, where the exponential pattern is observed to start at 80ºC for 1x1
m pile of microwave torrefied sample in the relationship between highest pile
temperature and the ambient temperature.
x The height and ambient temperature are the critical parameters in the storage
of bulk biomass and the higher ambient temperature, the faster the pile
ignited.

Chapter 7:Conclusions and Recommendations for Future Research
144
Chapter 7 Conclusions and Recommendations for Future Research
7.1 Conclusions
In this work, the self-heating behaviour of the non-torrefied and microwave torrefied
biomass has been studied experimentally and numerically. The conclusions from the
study are:
x The study has shown that the microwave torrefaction technology can improve
the combustion properties of the biomass fuel. The properties of torrefied
biomass are comparable to the one in low ranking coal. The calorific value of
torrefied biomass increased to 22MJ/kg from 18.4MJ/kg in the non-torrefied
sample. The O/C and H/C ratio decreased after the torrefaction process,
where the O/C ratio is 0.67 in the non-torrefied sample and 0.45 in
microwave torrefied sample. The H/C ratio is 0.14 in the non-torrefied
sample and 0.11 in microwave torrefied sample.
x The proximate analysis showed that the volatile matter in biomass was
reduced from 85.6% to 68.7% after the torrefaction. While the fixed carbon
content is increased from 3.9% to 18.6% after torrefaction. The ash content in
torrefied biomass samples rose to 10.5% from only 4.7% in the non-torrefied
sample.
x The thermal degradation was carried out using thermogravimetric analysis for
both torrefied and non-torrefied sample in air and nitrogen with the heating
rate of 5ºC/min to obtain the temperature of maximum weight loss and the
temperature of the initial combustion.
x Thermogravimetric analysis in the air has shown that the temperature
maximum weight loss (TMWL) for the non-torrefied sample is 310°C, while
for the torrefied sample is 312°C. The temperature of the initial combustion
(TIC) 268ºC for non-torrefied sample 283ºC for microwave torrefied sample.
Chapter 7:Conclusions and Recommendations for Future Research
145
x Thermogravimetric analysis in oxygen has shown that the characteristic
temperature (Tcharac) for non-torrefied sample is higher than the torrefied
sample. Tcharac non-torrefied sample, which is 331°C and 329°C respectively.
x The activation energy derived from thermal decomposition in air of the non-
torrefied sample is between 64.5 to 84.4 kJ/mol, while for torrefied sample
the range is lower which is between 53.1 to 70.7 kJ/mol. The activation
energy for thermal decomposition in air shows that microwave torrefied
sample is more reactive comparing to non-torrefied sample.
x The lower activation energy for torrefied biomass fuel indicated that the
material is reactive and have a higher tendency to self-heating. The risk
ranking graph; is drawn based on the activation energy and characteristic
temperature of the samples against other materials from literature. Both
samples are classified as a medium risk, but with microwave torrefied sample
in the rank of higher tendency to self-ignite comparing to the non-torrefied
sample.
x The test showed that when the oven temperature is below and at 180ºC no
ignition is detected for the non-torrefied sample. However, microwave
torrefied sample started to self-heat at 4002 seconds (66.7 minutes). It can be
concluded that the torrefied sample is more reactive compared to the non-
torrefied sample.
x Series of the bulk test is carried out in the uniformly heated oven at constant
air temperature to study the thermal heating behaviour independently. The
test showed the ignition induction time for microwave torrefied sample
heated at 180ºC is 4002 seconds at Bulk 1, 5066 for Bulk 2 and 7611 for Bulk
3. The ignition induction time increased with the decreasing of the bulk
volume. The ignition induction time is decreasing when the oven temperature
is increased.
Chapter 7:Conclusions and Recommendations for Future Research
146
x The numerical simulation of heat and mass transfer was modelled using
COMSOL Multiphysics® modules, consists of heat transfer in the porous
media, species transport in the porous media as well as free and porous media
flow using the kinetic parameters from the experimental data to determine the
heat generated from the exothermic reaction.
x The simulations carried out for the bulk tests for both samples. The
temperature profiles obtained in the simulation were compared with the
experimental data, and it was shown the temperature profiles in good
agreement between measured and simulated. Therefore, the numerical model
is validated against the experiments and could be used for the study of other
conditions in confidence.
x Based on the simulation, the safe practice to store the biomass is by piling up
horizontally is safer than horizontally. The resulting form the simulations
show two hot spots can be detected when the pile was pile with a wider
width.
x 80°C is considered as critical ambient temperature for the pile , where the
exponential pattern is observed to start at 80ºC in the relationship between
highest pile temperature and the ambient temperature of the microwave
torrefied sample in 1x2 m pile.
x Examples of simulation in large storage area presented here showed that the
model could predict the development of the hot spot in the piles, therefore
can be used to help identify the possible self-heating phenomena that lead to
ignition.

Chapter 7:Conclusions and Recommendations for Future Research
147
7.2 Recommendations for future research
Although the self-heating propensity of biomass material had been extensively
studied, more research is needed for the biomass fuels such as torrefied material
especially the fuels produced using microwave torrefaction method. This works
managed to show that the higher reactivity of fuels produced using microwave
torrefaction method. The methods of experimental study and numerical model
developed can be used for other types of biomass material, as well as simulations
with different storage conditions. Therefore, it would be interesting to understand the
effect of torrefaction process parameters such as reaction time and reaction
temperature towards self-heating parameters. In addition to that, the effect of the
various torrefaction methods on self-heating propensity is an interesting topic to
focus on too. The methods of torrefaction that produced a material with the less
reactive fuels could be determined. Furthermore, it would be interesting to study the
effect of physical properties of the torrefied biomass fuels such as porosity, density
and moisture content towards its self-heating propensity. Therefore a safe handling
of the fuels with upgraded physical properties from the torrefaction process can be
achieved.
Finally, the simulation works on the storage of biomass fuels can also be extended
towards the effect of the physical properties of the fuels. For example, the
relationship between the physical properties and the critical storage condition can be
established. Besides that, various storage conditions can also be studied, which could
include the possibilities of outdoor storage with the study of critical wind velocity.
Furthermore, the geometry of the piles could be simulated in another shape such as
the pile with side slope. The works can also be extended to the simulation of the
storage condition with different oxygen concentration as well as the possibilities of
inert storage condition.
References
148
References
AEBIOM. (2012). European Bioenergy Outlook 2012. Brussels.
AEBIOM. (2016). European Biomass Association Statical Report 2016: Key
Findings. Brussels.
Agar, D. & Wihersaari, M. (2012). Torrefaction Technology for Solid Fuel
Production. Global Change Biology Bioenergy, 4(5), 475–478.
Akgun, F. & Essenhigh, R. H. (2001). Self-Ignition Characteristics of Coal
Stockpiles: Theoretical Prediction from a Two-Dimensional Unsteady-State
Model. Fuel, 80(3), 409–415.
Anwar, J., Shafique, U., Waheed-uz-Zaman, Rehman, R., Salman, M., Dar, A.,
Anzano, J. M., Ashraf, U. & Ashraf, S. (2015). Microwave Chemistry: Effect of
Ions on Dielectric Heating in Microwave Ovens. Arabian Journal of Chemistry,
8(1), 100–104.
Arias, B., Pevida, C., Fermoso, J., Plaza, M. G., Rubiera, F. & Pis, J. J. (2008).
Influence of Torrefaction on the Grindability and Reactivity of Woody
Biomass. Fuel Processing Technology, 89(2), 169–175.
Arisoy, A. & Akgun, F. (2000). Effect of Pile Height on Spontaneous Heating of
Coal Stockpiles. Combustion Science and Technology, 153, 157–168.
Arvind Atreya. (1998). Ignition of Fires. Philosophical Transactions : Mathematical
, Physical and Engineering Sciences, 356(1748), 2787–2813.
Audigane, N., Bentele, M., Ferreira, J. F., Gyurik, A., Jossart, J.-M., Mangel, A.-C.,
Martin, M., Masdemont, P. R., Hampus Mörner, Paniz, A., Pieret, N.,
Rechberger, P., Rakos, C., Christian Schlagitweit, Sievers, A. K. & Tuohiniitty,
H. (2012). European Pellet Report 2012.
Avila, C., Pang, C. H., Wu, T. & Lester, E. (2011). Morphology and Reactivity
Characteristics of Char Biomass Particles. Bioresource Technology, 102(8),
5237–5243.
Avila, C. R. (2012). Predicting Self-Oxidation of Coals and Coal/biomass Blends
Using Thermal and Optical Methods.
Bach, Q.-V. V., Tran, K.-Q. Q., Khalil, R. A., Skreiberg, Ø. & Seisenbaeva, G.
(2013). Comparative Assessment of Wet Torrefaction. Energy & Fuels, 27(11),
6743–6753.
References
149
Badiei, M., Asim, N., Jahim, J. M. & Sopian, K. (2014). Comparison of Chemical
Pretreatment Methods for Cellulosic Biomass. APCBEE Procedia, 9(Icbee
2013), 170–174.
Balat, M. (2006). Biomass Energy and Biochemical Conversion Processing for Fuels
and Chemicals. Energy Sources, Part A: Recovery, Utilization, and
Environmental Effects, 28(6), 517–525.
Beamish, B. B., Barakat, M. A. & St. George, J. D. (2000). Adiabatic Testing
Procedures for Determining the Self-Heating Propensity of Coal and Sample
Ageing Effects. Thermochimica Acta, 362(1–2), 79–87.
Beamish, B., Lin, Z. & Beamish, R. (2012). Investigating the Influence of Reactive
Pyrite on Coal Self-Heating, in: Coal Operators’ Conference, (pp. 294–299).
Beever, P. F. (1995). The SFPE Handbook of Fire Protection Engineering, in:
DiNenno, P. J., Beyler, C. L., Custer, R. L. P., Walton, W. D., Watts, J. J. M.,
Drysdale, D., and Hall, J. J. R. (Eds.), The SFPE Handbook of Fire Protection
Engineering, (pp. 2-180-189). Quincy, MA: National Fire Protection
Associationss.
Ben, H. & Ragauskas, A. J. (2012). Torrefaction of Loblolly Pine. Green Chemistry,
14(1), 72–76.
Benitez, A. M. C. (2014). Thermal Processing of Michanthus, Sugarcane Bagasse,
Sugarcane Trash and Their Acid Hydrolysis Residues.
Bergman, P. C. A. (2005). Combined Torrefaction and Pelletisation : The TOP
Process. Netherlands.
Bergman, P. C. A. & Kiel, J. H. A. (2005). Torrefaction for Biomass Upgrading, in:
14th European Biomass Conference and Exhibition. Paris, France.
van Blijderveen, M., Bramer, E. a. & Brem, G. (2013). Modelling Spontaneous
Ignition of Wood, Char and RDF in a Lab-Scale Packed Bed. Fuel, 108, 190–
196.
van Blijderveen, M., Gucho, E. M., Bramer, E. a. & Brem, G. (2010). Spontaneous
Ignition of Wood, Char and RDF in a Lab Scale Packed Bed. Fuel, 89(9), 2393–
2404.
Blomqvist, P. & Persson, B. (2003). Spontaneous Ignition of Biofuels - A Literature
Survey of Theoretical and Experimental Methods. Borås, Sweden.
Bowes, P. C. (1971). Application of the Theory of Thermal Explosion to the Self-
Heating and Ignition of Organic Materials, in: Internation Symposium on Self-
References
150
heating of Organic Materials. Delft.
Bridgeman, T. G., Jones, J. M., Shield, I. & Williams, P. T. (2008). Torrefaction of
Reed Canary Grass, Wheat Straw and Willow to Enhance Solid Fuel Qualities
and Combustion Properties. Fuel, 87(6), 844–856.
BS 15188. (2007). BS EN 15188:2007 Determination of the Spontaneous Ignition
Behaviour of Dust Accumulations. , 3.
Bygbjerg, H. & Pauner, M. A. (2006). Spontaneous Ignition in Storage and
Production Lines. Hvidovre, Denmark.
Carrier, M., Auret, L., Bridgwater, A. & Knoetze, J. H. (2016). Using Apparent
Activation Energy as a Reactivity Criterion for Biomass Pyrolysis. Energy &
Fuels, 30, acs.energyfuels.6b00794.
Cassel, B., Menard, K. & Earnest, C. (2012). Application Note: Proximate Analysis
of Coal and Coke Using the STA 8000 Simultaneous Thermal Analyzer.
Waltham, USA.
Casson Moreno, V. & Cozzani, V. (2015). Major Accident Hazard in Bioenergy
Production. Journal of Loss Prevention in the Process Industries, 35, 135–144.
Chen, W.-H. & Kuo, P.-C. (2011). Torrefaction and Co-Torrefaction
Characterization of Hemicellulose, Cellulose and Lignin as Well as Torrefaction
of Some Basic Constituents in Biomass. Energy, 36, 803–811.
Chen, W.-H., Lu, K.-M., Liu, S.-H., Tsai, C.-M., Lee, W.-J. & Lin, T.-C. (2013).
Biomass Torrefaction Characteristics in Inert and Oxidative Atmospheres at
Various Superficial Velocities. Bioresource technology, 146C(x), 152–160.
Chen, X. D. (1999). On Basket Heating Methods for Obtaining Exothermic
Reactivity of Solid Materials: The Extent and Impact of the Departure of the
Crossing-Point Temperature from the Oven Temperature. Process Safety and
Environmental Protection, 77(4), 187–192.
Chen, X. D., Sidhu, H. & Nelson, M. (2013). A Linear Relationship between
Dimensionless Crossing-Point-Temperature and Frank–Kamenetskii Reactivity
Parameter in Self-Heating Test at Infinite Biot Number for Slab Geometry. Fire
Safety Journal, 61, 138–143.
Chiang, K. Y., Chien, K. L. & Lu, C. H. (2012). Characterization and Comparison of
Biomass Produced from Various Sources: Suggestions for Selection of
Pretreatment Technologies in Biomass-to-Energy. Applied Energy, 100, 164–
171.
References
151
Cruz Ceballos, D. C., Hawboldt, K. & Hellleur, R. (2015). Effect of Production
Conditions on Self-Heating Propensity of Torrefied Sawmill Residues. Fuel,
160, 227–237.
Demirbas, A. (2004). Combustion Characteristics of Different Biomass Fuels.
Progress in Energy and Combustion Science, 30(2), 219–230.
Deutmeyer, M., Bradley, D., Hektor, B., Hess, R., Tumuluru, J., Nikolaisen, L. &
Michael Wild. (2012). Possible Effect of Torrefaction on Biomass Trade.
Dhungana, A. (2011). Torrefaction of Biomass. , (August).
DTI. (2013). Final Report Torrefaction of Biomass.
Energy. 2030 Energy Strategy. Retrieved January 14, 2017, from
https://ec.europa.eu/energy/node/163
Eriksson, A. (2011). Energy Efficient Storage of Biomass at Vattenfall Heat and
Power Plant.
Escudey, M., Moraga, N., Zambra, C. & Antilén, M. (2011). Sewage Sludge
Disposal and Applications : Self-Heating and Spontaneous Combustion of
Compost Piles - Trace Metals Leaching in Volcanic Soils After Sewage Sludge
Disposal (Prof. Fernando Sebastián GarcÃa Einschlag, Ed.). InTech.
Eseyin, A. E., Steele, P. H. & Jr., C. Y. P. (2015). Current Trends in the Production
and Applications of Torrefied Wood/biomass - A Review. BioResources, 10(4),
8812–8858.
Evarts, B. (2011). Fires Caused by Spontaneous Combustion or Chemical Reaction
Fact Sheet. Quincy, Massachusetts.
Fan, F. & Dong, L. (2011). Research Progress and Comparison of Methods for
Testing Self Ignition Materials. Procedia Engineering, 11, 91–99.
Fei, Y., Aziz, a. A., Nasir, S., Jackson, W. R., Marshall, M., Hulston, J. & Chaffee,
a. L. (2009). The Spontaneous Combustion Behavior of Some Low Rank Coals
and a Range of Dried Products. Fuel, 88(9), 1650–1655.
Ferrero, F., Lohrer, C., Schmidt, B. M., Noll, M. & Malow, M. (2009). A
Mathematical Model to Predict the Heating-up of Large-Scale Wood Piles.
Journal of Loss Prevention in the Process Industries, 22(4), 439–448.
Ferrero, F., Malow, M., Schmidt, M. & Krause, U. (2008). COMPUTATIONAL
MODELLING OF THE SELF-IGNITION PROCESS TO ACHIEVE SAFE
STORAGE OF BIOMASS, in: First International Workshop for Young
Scientists, (pp. 1–10). Tsukuba, Japan.
References
152
Fierro, V., Miranda, J. ., Romero, C., Andrés, J. ., Arriaga, a & Schmal, D. (2001).
Model Predictions and Experimental Results on Self-Heating Prevention of
Stockpiled Coals. Fuel, 80(1), 125–134.
Fisher, E. M., Dupont, C., Darvell, L. I., Commandré, J. M., Saddawi, A., Jones, J.
M., Grateau, M., Nocquet, T. & Salvador, S. (2012). Combustion and
Gasification Characteristics of Chars from Raw and Torrefied Biomass.
Bioresource Technology, 119, 157–165.
Frank-Kamenetskii, D. A. (1955). Diffusion and Heat Exchange in Chemical
Kinetics. Princeton: Princeton University Press.
Fu, Z.-M., Koseki, H. & Iwata, Y. (2006). Investigation on Spontaneous Ignition of
Two Kinds of Organic Material with Water. Thermochimica Acta, 440(1), 68–
74.
García-Torrent, J., Ramírez-Gómez, Á., Querol-Aragón, E., Grima-Olmedo, C. &
Medic-Pejic, L. (2012). Determination of the Risk of Self-Ignition of Coals and
Biomass Materials. Journal of Hazardous Materials, 213–214, 230–5.
García, R., Pizarro, C., Lavín, A. G. & Bueno, J. L. (2012). Characterization of
Spanish Biomass Wastes for Energy Use. Bioresource Technology, 103(1),
249–258.
Garcia Torrent, J., Fernandez Anez, N., Medic Pejic, L. & Montenegro Mateos, L.
(2015). Assessment of Self-Ignition Risks of Solid Biofuels by Thermal
Analysis. Fuel, 143, 484–491.
García Torrent, J., Ramírez-Gómez, Á., Fernandez-Anez, N., Medic Pejic, L. &
Tascón, A. (2016). Influence of the Composition of Solid Biomass in the
Flammability and Susceptibility to Spontaneous Combustion. Fuel, 184, 503–
511.
Gardbro, G. (2014). Techno-Economic Modeling of the Supply Chain for Torrefied
Biomass.
Gašparovič, L., Koreňová, Z. & Jelemenský, Ľ. (2010). Kinetic Study of Wood
Chips Decomposition by TGA. Chemical Papers, 64(2), 174–181.
Graham, S. L. . ( 2015 ). (2015). Degradation of Biomass Fuels during Long Term
Storage in Indoor and Outdoor Environments.
Gronnow, M. J., Budarin, V. L., Mašek, O., Crombie, K. N., Brownsort, P. a.,
Shuttleworth, P. S., Hurst, P. R. & Clark, J. H. (2013). Torrefaction/biochar
Production by Microwave and Conventional Slow Pyrolysis - Comparison of

References
153
Energy Properties. GCB Bioenergy, 5(2), 144–152.
Guo, F., Chen, P., Wang, X. & Jin, K. (2012). Study on Thermal Decomposition and
Kinetics of Timber Used in Houses on Stilts under Air Atmosphere. Procedia
Engineering, 43, 65–70.
Guo, W. (2013a). Self-Heating and Spontaneous Combustion of Wood Pellets during
Storage. , (February).
Guo, W. (2013b). Self ‐ Heating of Stored Biomass and Pellets Background ‐
Harmsen, P. F. H., Huijgen, W. J. J., López, L. M. B. & Bakker, R. C. C. (2010).
Literature Review of Physical and Chemical Pretreatment Processes for
Lignocellulosic Biomass. Netherlands.
Henderson, C. (2015). Cofiring of Biomass in Coal-Fired Power Plants – European
Experience The Role of Biomass in Europe, in: FCO/IEA CCC Workshops on
Policy to Introduce Clean Coal Technology. China.
Herminé Nalbandian. (2010). Propensity of Coal to Self-Heat. London.
Heydari, M., Rahman, M. & Gupta, R. (2015). Kinetic Study and Thermal
Decomposition Behavior of Lignite Coal. , 2015.
Hogland, W. & Marques, M. (2003). Physical, Biological and Chemical Processes
during Storage and Spontaneous Combustion of Waste Fuel. Resources,
Conservation and Recycling, 40(1), 53–69.
Huang, Y.-F., Chiueh, P.-T., Kuan, W.-H. & Lo, S.-L. (2016). Microwave Pyrolysis
of Lignocellulosic Biomass: Heating Performance and Reaction Kinetics.
Energy, 100, 137–144.
Huang, Y.-P. & Hsu, H.-C. (2012). Characteristics of Biofuel from the Torrefied
Bamboo by Microwave Heating. Ferroelectrics, 434(1), 1–9.
Huang, Y. F., Chen, W. R., Chiueh, P. T., Kuan, W. H. & Lo, S. L. (2012).
Microwave Torrefaction of Rice Straw and Pennisetum. Bioresource
technology, 123, 1–7.
Huang, Y. F., Kuan, W. H., Lo, S. L. & Lin, C. F. (2008). Total Recovery of
Resources and Energy from Rice Straw Using Microwave-Induced Pyrolysis.
Bioresource Technology, 99(17), 8252–8258.
Hull, A. S., Lanthier, J. L., Chen, Z. & Agarwal, P. K. (1997). The Role of the
Diffusion of Oxygen and Radiation on the Spontaneous Combustibility of a
Coal Pile in Confined Storage Bi M. Combustion and Flame, 110, 479–493.

References
154
IEA. (2016). Key World Energy Trends: Excerpt from World Energy Balances.
Järvinen, T. & Agar, D. (2014). Experimentally Determined Storage and Handling
Properties of Fuel Pellets Made from Torrefied Whole-Tree Pine Chips,
Logging Residues and Beech Stem Wood. Fuel, 129, 330–339.
Jirjis, R. (2005). Effects of Particle Size and Pile Height on Storage and Fuel Quality
of Comminuted Salix Viminalis. Biomass and Bioenergy, 28(2), 193–201.
Jones, J. C. & Vais, M. (1991). Factors Influencing the Spontaneous Heating of
Low-Rank Coals. Journal of Hazardous Materials, 26(2), 203–212.
Jones, J. M., Bridgeman, T. G., Darvell, L. I., Gudka, B., Saddawi, a. & Williams,
a. (2012). Combustion Properties of Torrefied Willow Compared with
Bituminous Coals. Fuel Processing Technology, 101, 1–9.
Jones, J. M., Saddawi, A., Dooley, B., Mitchell, E. J. S., Werner, J., Waldron, D. J.,
Weatherstone, S. & Williams, A. (2015). Low Temperature Ignition of
Biomass. Fuel Processing Technology, 134.
Kan, T., Strezov, V. & Evans, T. (2016). Effect of the Heating Rate on the
Thermochemical Behavior and Biofuel Properties of Sewage Sludge Pyrolysis.
Energy and Fuels, 30(3), 1564–1570.
Khan, A. A., de Jong, W., Jansens, P. J. & Spliethoff, H. (2009). Biomass
Combustion in Fluidized Bed Boilers: Potential Problems and Remedies. Fuel
Processing Technology, 90(1), 21–50.
Kleinschmidt, C. P. (2011). Overview of International Developments in Torrefaction,
in: Central European Biomass Conference. Graz, Austria.
Kopczyński, M., Plis, A. & Zuwała, J. (2015). Thermogravimetric and Kinetic
Analysis of Raw and Torrefied Biomass Combustion. Chemical and Process
Engineering, 36(2), 209–223.
Koppejan, J., Sokhansanj, S., Melin, S. & Madrali, S. (2012). Status Overview of
Torrefaction Technologies, IEA Bioenergy Task 32 Report. France.
Koseki, H. (2012). Safety Evaluation and Cause Investigation of the Fire in Various
Solid Biomass Fuels and Organic Rubble Pile Using High Sensitivity
Calorimeters. Energy & Fuels, 26(9), 5962–5967.
Koufopanos, C. a, Papayannakos, N., Maschio, G. & Lucchesi, a. (1991). Modelling
of the Pyrolysis of Biomass Particles. Studies on Kinetics, Thermal and Heat
Transfer Effects. The Canadian Journal of Chemical Engineering, 69(4), 907–
915.

References
155
Krause, U. (2009). Fires in Silos (U. Krause, Ed.). Weinheim, Germany: Wiley-VCH
Verlag GmbH & Co. KGaA.
Krause, U., Schmidt, M. & Lohrer, C. (2006). A Numerical Model to Simulate
Smouldering Fires in Bulk Materials and Dust Deposits. Journal of Loss
Prevention in the Process Industries, 19(2–3), 218–226.
Krigstin, S. & Wetzel, S. (2016). A Review of Mechanisms Responsible for Changes
to Stored Woody Biomass Fuels. Fuel, 175, 75–86.
Krishnaswamy, S., Agarwal, P. K. & Gunn, R. D. (1996). Low-Temperature
Oxidation of Coal. 3. Modelling Spontaneous Combustion in Coal Stockpiles.
Fuel, 75(3), 353–362.
Kymäläinen, M., Mäkelä, M. R., Hildén, K. & Kukkonen, J. (2015). Fungal
Colonisation and Moisture Uptake of Torrefied Wood, Charcoal, and Thermally
Treated Pellets during Storage. European Journal of Wood and Wood Products.
L. Montenegro Mateos, J. Garcia Torrent, J. Castilla Gomez, N. Fernandez Anez &
L. Medic Pejic. (2013). Physical Characteristics of Biomass and Its Influence in
Self-Combustion, in: 13th SGEM GeoConference on Energy And Clean
Technologies, (pp. 169–176).
Lanigan, B. A. (2010). Microwave Processing of Lignocellulosic Biomass for
Production of Fuels.
Larsson, I., Blomqvist, P., Lönnermark, A. & Persson, H. (2012). Medium-Scale
Reference Tests and Calculations of Spontaneous Ignition in Wood Pellets - the
LUBA Project. Borås, Sweden.
Leslie, G. (2014). The Spontaneous Combustion of Railway Ties and Asphalt
Shingles. , (August).
Li, B., Chen, G., Zhang, H. & Sheng, C. (2014). Development of Non-Isothermal
TGA-DSC for Kinetics Analysis of Low Temperature Coal Oxidation prior to
Ignition. Fuel, 118, 385–391.
Li, H., Liu, X., Legros, R., Bi, X. T., Jim Lim, C. & Sokhansanj, S. (2012).
Pelletization of Torrefied Sawdust and Properties of Torrefied Pellets. Applied
Energy, 93, 680–685.
Li, X.-R., Koseki, H. & Momota, M. (2006). Evaluation of Danger from
Fermentation-Induced Spontaneous Ignition of Wood Chips. Journal of
Hazardous Materials, 135(1–3), 15–20.
Liu, Z. & Han, G. (2015). Production of Solid Fuel Biochar from Waste Biomass by

References
156
Low Temperature Pyrolysis. Fuel, 158, 159–165.
Liu, Z., Hu, W., Jiang, Z., Mi, B. & Fei, B. (2016). Investigating Combustion
Behaviors of Bamboo, Torrefied Bamboo, Coal and Their Respective Blends by
Thermogravimetric Analysis. Renewable Energy, 87, 346–352.
Lohrer, C., Krause, U. & Steinbach, J. (2005). Self-Ignition of Combustible Bulk
Materials Under Various Ambient Conditions. Process Safety and
Environmental Protection, 83(2), 145–150.
Luangwilai, T., Sidhu, H. S., Nelson, M. . I. & Chen, X. D. (2010). Modelling Air
Flow and Ambient Temperature Effects on the Biological Self-Heating of
Compost Piles. Asia-Pacific Journal of Chemical Engineering, 5(May), 609–
618.
Luo, Q., Liang, D. & Shen, H. (2016). Evaluation of Self-Heating and Spontaneous
Combustion Risk of Biomass and Fishmeal with Thermal Analysis (DSC-TG)
and Self-Heating Substances Test Experiments. Thermochimica Acta, 635, 1–7.
Mansaray, K. G. & Ghaly, A. E. (1999). Determination of Kinetic Parameters of
Rice Husks in Oxygen Using Thermogravimetric Analysis. Biomass and
Bioenergy, 17(1), 19–31.
Mašek, O., Budarin, V., Gronnow, M., Crombie, K., Brownsort, P., Fitzpatrick, E. &
Hurst, P. (2013a). Microwave and Slow Pyrolysis Biochar - Comparison of
Physical and Functional Properties. Journal of Analytical and Applied
Pyrolysis, 100, 41–48.
Mašek, O., Budarin, V., Gronnow, M., Crombie, K., Brownsort, P., Fitzpatrick, E. &
Hurst, P. (2013b). Microwave and Slow Pyrolysis biochar—Comparison of
Physical and Functional Properties. Journal of Analytical and Applied
Pyrolysis, 100, 41–48.
Matthews, F. (2015). Global Wood Pellet Market Outlook. WPAC Annual
Conference, (November).
McKendry, P. (2002). Energy Production from Biomass (Part 3): Gasification
Technologies. Bioresource technology, 83(1), 55–63.
Medic, D. (2012). Investigation of Torrefaction Process Parameters and
Characterization of Torrefied Biomass. Investigation of Torrefied Process
Parameters and Characterization of Torrefied Biomass.
Melin, S. (2011). Torrefied Wood: A New Emerging Energy Carrier. Presentation by
Wood Pellet Association of Canada. Retrieved from

References
157
http://www.pellet.org/linked/2011-05-11 torrefaction - staffan.pdf
Moqbel, S., Reinhart, D. & Chen, R.-H. (2010). Factors Influencing Spontaneous
Combustion of Solid Waste. Waste management (New York, N.Y.), 30(8–9),
1600–7.
Morrison, D. T. & Hart, R. J. (2012). Guidelines for Identifying and Mitigating
Thermal Hazards of Sustainable Materials. Process Safety Progress, 31(2).
Murasawa, N., Koseki, H., Iwata, Y. & Gao, L. (2012). Study on Spontaneous
Ignition of Stored Food Waste to Be Used for Recycling. Fire and Materials.
Naik, S., Goud, V. V., Rout, P. K., Jacobson, K. & Dalai, A. K. (2010).
Characterization of Canadian Biomass for Alternative Renewable Biofuel.
Renewable Energy, 35(8), 1624–1631.
Nhuchhen, D., Basu, P. & Acharya, B. (2014). A Comprehensive Review on
Biomass Torrefaction. International Journal of Renewable Energy & Biofuels,
2014, 1–56.
Nunes, L. J. R., Matias, J. C. O. & Catalão, J. P. S. (2013). Characterization of
Torrefied Biomass Pellets for Co-Firing with Coal in Thermal Power Plants, in:
Proceedings of the 13th Spanish Portuguese Conference on Electrical
Engineering. Valencia.
Nunes, L. J. R., Matias, J. C. O. & Catalão, J. P. S. (2014). A Review on Torrefied
Biomass Pellets as a Sustainable Alternative to Coal in Power Generation.
Renewable and Sustainable Energy Reviews, 40, 153–160.
Patel, B. & Gami, B. (2012). Biomass Characterization and Its Use as Solid Fuel for
Combustion. Iranica Journal of Energy & Environment, 3(2), 123–128.
Pauner, M. A. & Bygbjerg, H. (2005). Spontaneous Ignition in Storage and
Production Lines. Part 4: Investigation of 6mm Wood Pellets.
Pauner, M. A. & Bygbjerg, H. (2007). Spontaneous Ignition in Storage and
Production Lines : Investigation on Wood Pellets and Protein Powders. Fire and
Materials, 31(May), 477–494.
Peng, J. H., Bi, H. T., Lim, C. J. & Sokhansanj, S. (2013). Study on Density,
Hardness, and Moisture Uptake of Torrefied Wood Pellets. Energy & Fuels,
27(2), 967–974.
Phanphanich, M. & Mani, S. (2011). Impact of Torrefaction on the Grindability and
Fuel Characteristics of Forest Biomass. Bioresource Technology, 102(2), 1246–
1253.

References
158
Poudel, J. & Oh, S. (2014). Effect of Torrefaction on the Properties of Corn Stalk to
Enhance Solid Fuel Qualities. Energies, 7(9), 5586–5600.
Prins, M. J. (2005). Thermodynamic Analysis of Biomass Gasification and
Torrefaction.
Prins, M. J., Ptasinski, K. J. & Janssen, F. J. J. G. (2006). More Efficient Biomass
Gasification via Torrefaction. Energy, 31(15), 3458–3470.
Prins, M. J., Ptasinski, K. J. & Janssen, F. J. J. G. (2006). Torrefaction of Wood. Part
1. Weight Loss Kinetics. Journal of Analytical and Applied Pyrolysis, 77(1),
28–34.
Ramírez, Á., García-torrent, J. & Tascón, A. (2010). Experimental Determination of
Self-Heating and Self-Ignition Risks Associated with the Dusts of Agricultural
Materials Commonly Stored in Silos. Journal of Hazardous Materials, 175,
920–927.
Ren, S., Lei, H., Wang, L., Bu, Q., Chen, S. & Wu, J. (2013). Thermal Behaviour
and Kinetic Study for Woody Biomass Torrefaction and Torrefied Biomass
Pyrolysis by TGA. Biosystems Engineering, 116(4), 420–426.
Ren, S., Lei, H., Wang, L., Bu, Q., Wei, Y., Liang, J., Liu, Y., Julson, J., Chen, S.,
Wu, J. & Ruan, R. (2012). Microwave Torrefaction of Douglas Fir Sawdust
Pellets. Energy & Fuels, 26(9), 5936–5943.
Ren, S., Lei, H., Wang, L., Yadavalli, G., Liu, Y. & Julson, J. (2014). The Integrated
Process of Microwave Torrefaction and Pyrolysis of Corn Stover for Biofuel
Production. Journal of Analytical and Applied Pyrolysis, 108, 248–253.
Renewable Energy Directive. (2009). Directive 2009/28/EC of the European
Parliament and of the Council of 23 April 2009 on the Promotion of the Use of
Energy from Renewable Sources and Amending and Subsequently Repealing
Directives 2001/77/EC and 2003/30/EC. , 16–62.
Rousset, P., Aguiar, C., Labbé, N. & Commandré, J. M. (2011). Enhancing the
Combustible Properties of Bamboo by Torrefaction. Bioresource Technology,
102(17), 8225–8231.
Sadaka, S., Sharara, M., Ashworth, A., Keyser, P., Allen, F. & Wright, A. (2014).
Characterization of Biochar from Switchgrass Carbonization. Energies, 7(2),
548–567.
Saddawi, A., Jones, J. M., Williams, A., Aslam, M., Baxter, X., Taylor, I. H. R. &
Way, G. (2013). Assessment of the Self-Ignition Characteristics of Raw and
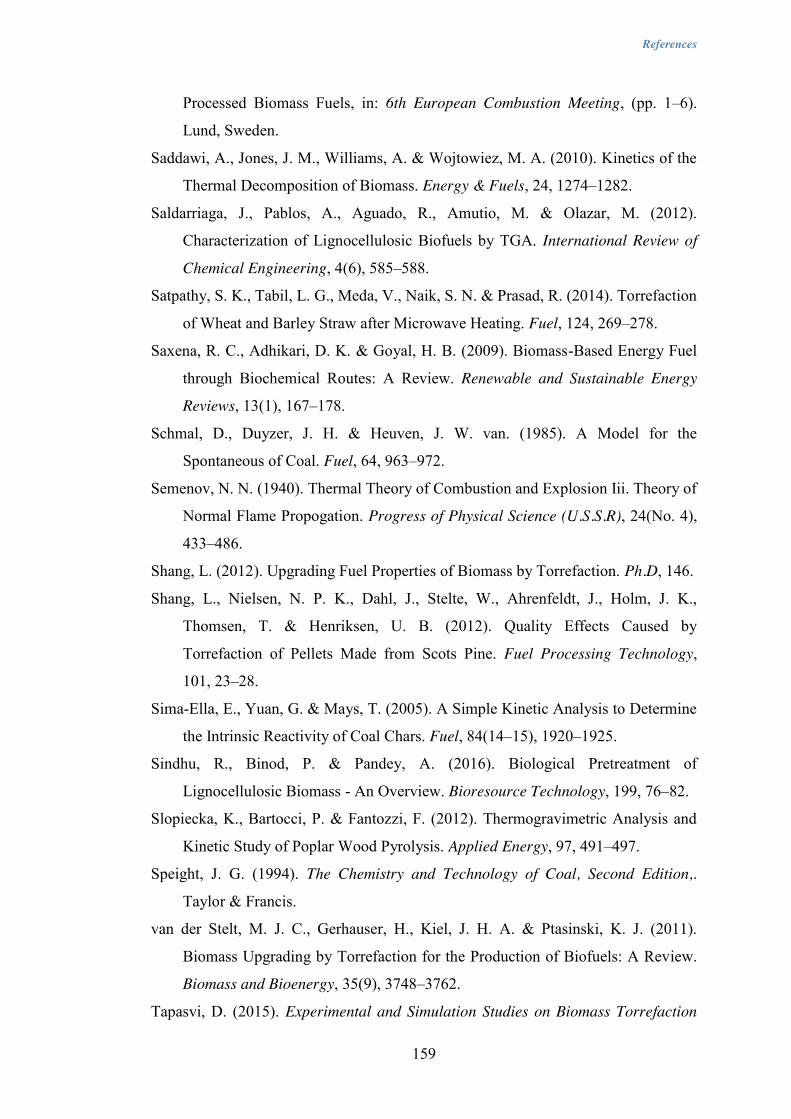
References
159
Processed Biomass Fuels, in: 6th European Combustion Meeting, (pp. 1–6).
Lund, Sweden.
Saddawi, A., Jones, J. M., Williams, A. & Wojtowiez, M. A. (2010). Kinetics of the
Thermal Decomposition of Biomass. Energy & Fuels, 24, 1274–1282.
Saldarriaga, J., Pablos, A., Aguado, R., Amutio, M. & Olazar, M. (2012).
Characterization of Lignocellulosic Biofuels by TGA. International Review of
Chemical Engineering, 4(6), 585–588.
Satpathy, S. K., Tabil, L. G., Meda, V., Naik, S. N. & Prasad, R. (2014). Torrefaction
of Wheat and Barley Straw after Microwave Heating. Fuel, 124, 269–278.
Saxena, R. C., Adhikari, D. K. & Goyal, H. B. (2009). Biomass-Based Energy Fuel
through Biochemical Routes: A Review. Renewable and Sustainable Energy
Reviews, 13(1), 167–178.
Schmal, D., Duyzer, J. H. & Heuven, J. W. van. (1985). A Model for the
Spontaneous of Coal. Fuel, 64, 963–972.
Semenov, N. N. (1940). Thermal Theory of Combustion and Explosion Iii. Theory of
Normal Flame Propogation. Progress of Physical Science (U.S.S.R), 24(No. 4),
433–486.
Shang, L. (2012). Upgrading Fuel Properties of Biomass by Torrefaction. Ph.D, 146.
Shang, L., Nielsen, N. P. K., Dahl, J., Stelte, W., Ahrenfeldt, J., Holm, J. K.,
Thomsen, T. & Henriksen, U. B. (2012). Quality Effects Caused by
Torrefaction of Pellets Made from Scots Pine. Fuel Processing Technology,
101, 23–28.
Sima-Ella, E., Yuan, G. & Mays, T. (2005). A Simple Kinetic Analysis to Determine
the Intrinsic Reactivity of Coal Chars. Fuel, 84(14–15), 1920–1925.
Sindhu, R., Binod, P. & Pandey, A. (2016). Biological Pretreatment of
Lignocellulosic Biomass - An Overview. Bioresource Technology, 199, 76–82.
Slopiecka, K., Bartocci, P. & Fantozzi, F. (2012). Thermogravimetric Analysis and
Kinetic Study of Poplar Wood Pyrolysis. Applied Energy, 97, 491–497.
Speight, J. G. (1994). The Chemistry and Technology of Coal, Second Edition,.
Taylor & Francis.
van der Stelt, M. J. C., Gerhauser, H., Kiel, J. H. A. & Ptasinski, K. J. (2011).
Biomass Upgrading by Torrefaction for the Production of Biofuels: A Review.
Biomass and Bioenergy, 35(9), 3748–3762.
Tapasvi, D. (2015). Experimental and Simulation Studies on Biomass Torrefaction

References
160
and Gasification.
Thomas, P. H. & Bowes, P. C. (1961). Some Aspects of the Self-Heating and
Ignition of Solid Cellulosic Materials. British Journal of Applied Physics,
222(12).
Tumuluru, J. S., Jim Lim, C., Bi, X. T., Kuang, X., Melin, S., Yazdanpanah, F. &
Sokhansanj, S. (2015). Analysis on Storage off-Gas Emissions from Woody,
Herbaceous, and Torrefied Biomass. Energies, 8(3), 1745–1759.
Tumuluru, J. S., Sokhansanj, S., Hess, J. R., Wright, C. T. & Boardman, R. D.
(2011). A Review on Biomass Torrefaction Process and Product Properties for
Energy Applications. Industrial Biotechnology, (october).
Valix, M., Katyal, S. & Cheung, W. H. (2016). Combustion of Thermochemically
Torrefied Sugar Cane Bagasse. Bioresource Technology, (October).
Vargas-Moreno, J. M., Callejón-Ferre, a. J., Pérez-Alonso, J. & Velázquez-Martí, B.
(2012). A Review of the Mathematical Models for Predicting the Heating Value
of Biomass Materials. Renewable and Sustainable Energy Reviews, 16(5),
3065–3083.
Vassilev, S. V., Baxter, D., Andersen, L. K. & Vassileva, C. G. (2010). An Overview
of the Chemical Composition of Biomass. Fuel, 89(5), 913–933.
Vassilev, S. V., Vassileva, C. G. & Vassilev, V. S. (2015). Advantages and
Disadvantages of Composition and Properties of Biomass in Comparison with
Coal: An Overview. Fuel, 158, 330–350.
Verhoest, C. & Ryckmans, Y. (2012). Industrial Wood Pellets Report. , (March).
Veznikova, H., Perdochova, M., Bernatik, a. & Binkau, B. (2014). Safe Storage of
Selected Fuels with Regard to Their Tendency to Spontaneous Combustion.
Journal of Loss Prevention in the Process Industries, 29, 295–299.
Wang, C., Peng, J., Li, H., Bi, X. T., Legros, R., Lim, C. J. & Sokhansanj, S. (2013).
Oxidative Torrefaction of Biomass Residues and Densification of Torrefied
Sawdust to Pellets. Bioresource technology, 127, 318–25.
Wang, M. J., Huang, Y. F., Chiueh, P. T., Kuan, W. H. & Lo, S. L. (2012).
Microwave-Induced Torrefaction of Rice Husk and Sugarcane Residues.
Energy, 37(1), 177–184.
Wilěn Carl & Rautalin, A. (1993). Handling and Feeding Of Biomass to Pressurized
Reactors: Safety Engineering. Bioresource Technology, 46, 77–85.
Wolters, F. C., Pagni, P. J., Frost, T. R. & Cuzzillo, B. R. (2003). Size Constraints on

References
161
Self Ignition of Charcoal Briquets. Fire Safety Science, 7, 593–604.
Wu, C., Budarin, V. L., Wang, M., Sharifi, V., Gronnow, M. J., Wu, Y.,
Swithenbank, J., Clark, J. H. & Williams, P. T. (2015). CO2 Gasification of
Bio-Char Derived from Conventional and Microwave Pyrolysis. Applied
Energy.
Wu, D. & Bulck, E. Van Den. (2014). Numerical Analysis of the Self-Heating
Behaviour of Coal Dust Accumulations, in: Comsol Conference, (p. 15188).
Cambridge.
www.iowaenergycenter.org. Bioenergy Buzzwords: Terms You Should Know.
Retrieved from www.iowaenergycenter.org
Yan, Z., Blomqvist, P., Göransson, U., Holmstedt, G., Wadso, L. & Patrick Van.
(2005). Validation of CFD Model for Simulation of Spontaneous Ignition in
Biomass Fuel Storage, in: Fire Safety Science (8th International Symposium),
(pp. 151–162).
Yin, C., Rosendahl, L. A. & Kær, S. K. (2008). Grate-Firing of Biomass for Heat and
Power Production. Progress in Energy and Combustion Science, 34, 725–754.
Della Zassa, M., Biasin, A., Zerlottin, M., Refosco, D. & Canu, P. (2013). Self-
Heating of Dried Industrial Wastewater Sludge: Lab-Scale Investigation of
Supporting Conditions. Waste Management, 33(6), 1469–77.
Zhu, H., Song, Z., Tan, B. & Hao, Y. (2013). Numerical Investigation and
Theoretical Prediction of Self-Ignition Characteristics of Coarse Coal
Stockpiles. Journal of Loss Prevention in the Process Industries, 26(1), 236–
244.

Appendix A
162
Appendix A: Thermocouples readings for bulk tests
Appendix A - 1: Thermocouples readings of microwave torrefied sample heated in
180°C for Bulk 1
a)
b)
c)
d)
e)

Appendix A
163
Appendix A - 2: Thermocouples readings of non-torrefied at 200ºC in Bulk 1
a)
c)
d) e)
b)

Appendix A
164
b)
Appendix A – 3: Thermocouples readings of non-torrefied sample at 200ºC in Bulk 2
c)
a)
d)
e)

Appendix A
165
Appendix A – 4: Thermocouples readings of non-torrefied sample at 200ºC in Bulk 3
a) b) c) d)
e)

Appendix A
166
Appendix A – 5: Thermocouples readings of microwave torrefied sample heated
at180°C in Bulk 1
a)
b)
c)
a)
b)
d)
e)

Appendix A
167
Appendix A - 6: Thermocouples readings of microwave torrefied heated at 180°C in
Bulk 2
a)
b)
c) d) e)
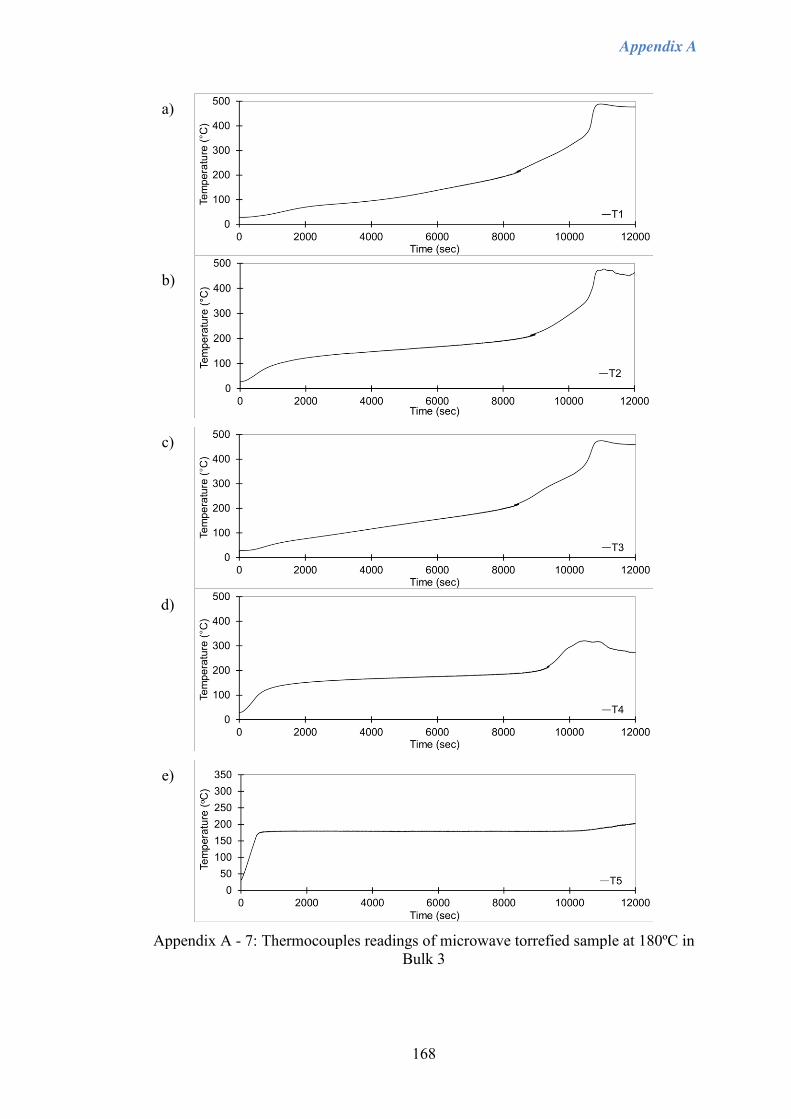
Appendix A
168
Appendix A - 7: Thermocouples readings of microwave torrefied sample at 180ºC in
Bulk 3
a)
b)
c)
d)
e)
Appendix A
169
Appendix A - 8: Thermocouples readings of microwave torrefied sample at 170ºC in
Bulk 1
a) b) c) d) e)

Appendix A
170
Appendix A – 9:Temperature profile for microwave torrefied sample at 190ºC in
Bulk 1
a)
b)
c)
d)
e)
Appendix B
171
Appendix B: Publication originated from the thesis
Tengku Noor Tg. Azhar & Yajue Wu Modelling of Self-Heating Behaviour During Storage Of Torrefied Biomass Fuel. Proceedings of the 14th International Conference and Exhibition on Fire Science and Engineering (INTERFLAM 2016), 4-6th JULY 2016, Royal Holloway College, London, UK, VOLUME 2, (1357-1368) ISBN 978 0 9556548-9-3, 2016


