
Experimental analysis of microplastics in beach sediment samples by density separation and microscopic examination
Ritesh Sharma
Degree Thesis
Material processing technology
2019

DEGREE THESIS
Arcada
Degree Programme: Material processing technology
Identification number: 17405
Author: Ritesh Sharma
Title: Experimental methods to analyze microplastics in beach
sediment sample through microscopic examination.
Supervisor (Arcada): Stewart-Makkonen Craig
Abstract:
This thesis mainly deals with microplastics, its sources and experimental approach to
investigate the presence of microplastics in environment. Microplastics are threat to
environment in recent years. Its adverse effect is directed towards aquatic animals. This
thesis will provide the information about the sources of microplastics and how it ends up
to the marine environment. The main objectives of this thesis project are to review the
methods to analyze microplastics, develop methods to collect microplastic samples from
local terrestrial environment and the procedure to analyze them in Arcada’s laboratory.
Sediment samples collected from 4 different locations were examined using microscopic
analysis. Two different methods were employed to analyze collected sediments samples.
Sodium chloride was used as a density separator to extract microplastics from sample.
Results obtained from microscopic analysis showed the presence of colored microplastics
and fibers in all the collected sediment samples.
Keywords: Microplastics, Wet peroxide oxidation, NOAA,
Microscopy, Density separation
Number of pages: 48
Language: English
Date of acceptance: 21.01.2019

Table of Contents
1. INTRODUCTION ................................................................................................................................ 1
1.1. History & background ................................................................................................................... 1
1.2. Objectives ..................................................................................................................................... 1
1.3. Thesis framework .......................................................................................................................... 2
2. LITERATURE REVIEW ..................................................................................................................... 3
2.1. Plastics in general ......................................................................................................................... 3
2.2. Microplastics ................................................................................................................................. 5
2.2.1. Types of microplastics .......................................................................................................... 5
3. MICROPLASTICS IN THE MARINE ENVIRONMENT .................................................................. 7
4. REVIEW ON SAMPLE COLLECTING METHODS ....................................................................... 12
4.1. Sampling of sediments ................................................................................................................ 13
4.2. Biota sampling ............................................................................................................................ 14
4.3. Sample separation and purification ............................................................................................. 15
4.3.1. Flotation .............................................................................................................................. 15
4.3.2. Sieving and rinsing microplastics sample ........................................................................... 16
4.3.3. Sample purification ............................................................................................................. 16
4.4. Review on identification process ................................................................................................ 16
4.4.1. Visual identification ............................................................................................................ 17
4.4.2. Identification by chemical composition .............................................................................. 17
4.4.3. Identification using laboratory methods.............................................................................. 19
5. EXPERIMENT AND METHODOLOGY .......................................................................................... 21
5.1. Materials and equipment ............................................................................................................. 21
5.2. Sample and sampling location .................................................................................................... 22
5.3. Filter design process ................................................................................................................... 24
5.4. Beach sample preparation process .............................................................................................. 25
5.5. Density separation ....................................................................................................................... 25
5.6. Wet Peroxide oxidation (WPO) .................................................................................................. 26
5.7. Using saturated NaCl solution to extract MPs ............................................................................ 27
6. RESULTS AND ANALYSIS ............................................................................................................. 29
6.1. Results of wet peroxide oxidation process (WPO) ..................................................................... 29
6.2. Analysis....................................................................................................................................... 34
7. CONCLUSION ................................................................................................................................... 36
8. REFERENCES ................................................................................................................................... 38

List of tables Table 1: Six types of plastic polymers produced worldwide (Nerlannd et al., 2014). .................... 4
Table 2: Types of plastic in marine environment (Andrady, 2011) ................................................ 8
Table 3: Organisms susceptible to MPs and the pathway led to ingestion (Wright, 2013). ........ 11
Table 4: Sampling equipment used to collect MPs (A.B. Silva et al, 2018) ................................ 12
Table 5: Specific densities and solubility of salts at room temperature (Stolte, 2014) ............. 15

List of figures Figure 1: Thesis framework ............................................................................................................ 2
Figure 2: strong crosslinking thermosets (Klein, 2011).................................................................. 3
Figure 3: Linear and chained thermoplastic molecules (Klein, 2011). ........................................... 4
Figure 4:Formation of microplastics by degradation of macroplastics (Wagner, 2017) ...... 5
Figure 5:Primary sources of MPs (Boucher, 2017) ........................................................................ 6
Figure 6:MPs from break down of macroplastics (Nerlannd et al., 2014) ..................................... 6
Figure 7: Ways of MPs ending up in marine environment (Stolte, 2014) ...................................... 7
Figure 8: Transport of MPs in environment through various process (Kärrman et al., 2016)........ 7
Figure 9: Fluorescence marked MP ingested by copepods (left panel); Ingested MP particles in
mussel tissues produced for human consumption(Right panel). (Stolte, 2014) ........................... 10
a) Figure 10:Equipment used during sample collection process is: a) neuston net, b) is manta
trawl, c) is a catamaran which is used for mid water level sampling and d) is a bongo net (A.B.
Silva et al, 2018). .......................................................................................................................... 13
s Figure 11: High tide line (Sartain, 2018) .................................................................................. 14
Figure 12: Using spoon to get sediment sample (Sartain, 2018) .................................................. 14
Figure 13: Plastics litter ingested by fish (Mytilineou, 2015) ...................................................... 15
Figure 14: Schematic diagram of pyrolysis process. (Wampler, 2014) ........................................ 17
Figure 15: Schematic representation of FTIR (Mccluskey, 2000) ............................................... 18
Figure 16: Schematic representation of Raman process (Jefriyanto, 2016) ................................. 19
Figure 18: Beach sediment sample collected from different beaches around the world for
microplastic examination. ............................................................................................................. 22
Figure 19: Aberdeen beach (Visitscotland.com) .......................................................................... 22
Figure 20: Tigaki beach, Greece (www.kosinfo.gr) ..................................................................... 23
Figure 21: Kardamena beach, Greece (Tripadvisor.com) ............................................................. 23
Figure 22: Filter making process .................................................................................................. 24
Figure 23:Filters with various mesh size ...................................................................................... 24
Figure 24: (A) Adding distilled water in sample, (B) After vigorous stirring, (C) MPs after
density separation.......................................................................................................................... 25
Figure 25:WPO: (A) Beaker is placed on hot plate; (B) After 20% hydrogen peroxide added, (C)
Bubbles observed after the temperature reached at 75 °C. ........................................................... 26
Figure 26: 50 µm sieve is used to filter the solution. .................................................................... 27
Figure 27: MPs particles in filter .................................................................................................. 28
Figure 28: Slides for microscopic examination ............................................................................ 28
Figure 29: Results from WPO showing organic matters and insect shells. .................................. 29
Figure 30: A: Blue colored MP 25 µm size sieve, B: Red colored fiber from 50 µm size sieve C:
Red colored MP and organic material from 50 µm size sieve; D: Blue colored MP from 25 µm
size sieve. ...................................................................................................................................... 30
Figure 31: A: Blue colored MP along with some undissolved NaCl crystals, B: Blue colored MP
and some organic matters from 130 size sieve; C: Blue colored fiber from 25 µm size sieve; D:
Blue colored fiber (likely cotton) from 25 µm size sieve. ............................................................ 31
Figure 32: A: Blue colored MP from 130 µm size sieve; B: Blue colored fiber and some
undissolved NaCl crystals from 25 µm size sieve, C: Blue colored fiber along with some organic

matters from 50 µm size sieve; D: Blue colored fiber and some salts crystals from 25 µm size
sieve. ............................................................................................................................................. 32
Figure 33: A: Blue colored fiber and organic matter from 50 µm size sieve; B: Blue colored fiber
from 50 µm size sieve; C: Blue colored fiber along with some salts crystal from 50 µm size
sieve; D: MP from 25 µm size sieve. ........................................................................................... 33
Figure 34: Undigested organic matter in beaker after completion of test..................................... 34
Figure 35: Flow chart explaining analytical procedure of analyzing microplastics sample ......... 36

Abbreviations NOAA: National oceanic and atmospheric administration
MPs: Microplastics
PP: Polypropylene
PE: Polyethylene
PVC: Polyvinyl chloride
PS: Polystyrene
H2O2: Hydrogen peroxide
ZnCl2: Zinc Chloride
NaCl: Sodium chloride
WPO: Wet peroxide oxidation
FTIR: Fourier transform infrared spectroscopy

Acknowledgement
I would like to express my sincere gratitude to my supervisor Mr. Stewart Makkonen- Craig for
his continuous help and support throughout my thesis work. His guidance helped me in all the time
of my experimental work and thesis writing. At the same time, I take this opportunity to thank all
the members of Energy and Material technology department at Arcada. I am also thankful to my
colleague and dear friend Derya, who helped me during sample collection procedure.
Finally, this wouldn’t have been possible without the help of my family members. I would like to
thank my family members for their continuous support throughout my study. I am forever indebted
to my parents for giving me opportunity and guidance that have made me who I am. I dedicate this
milestone to them.
Helsinki
January 2019.

1
1. INTRODUCTION
1.1. History & background Plastics are synthetic organic materials which consist of long chain polymers and have high
average molecular weights. They are made up of either synthetic or natural polymers, also
called as resins. Plastics are cheap, lightweight, durable, which make them perfect choice for
any applications. The same features that make plastic as one of the most usable material also
contribute to become a serious pollution threat. Recent studies suggest that 4.8 to 12.7 million
metric tons of plastic were disposed to ocean in 2010 (Herrera et al., 2018). Plastics production
is accelerating in developing countries and they are now used to the use-and-dispose culture of
plastics.
Plastic litter in the marine environment is a recent concern from a global environmental
perspective. Plastics is the main waste which can be found in the marine environment and 70%
of marine debris is plastic, where it accumulates and persists due to its durable nature (Melissa
B. Phillips, 2014). The occurrence of small plastics on marine and coastal environment was
first noticed in 1970s but the term microplastics was not used yet then. The effects of large
plastics items in marine environment can be noticed as the death and accidents are reported
from marine animals due to ingestion, and entanglement of plastics. However, the large portion
of plastics found in the marine environment is in the microscopic level. These plastics particles
are known as microplastics (MPs). Their size ranges from 1 to 5 mm and belong microplastics
group (Kershaw, 2015). Microplastics are synthetic materials with a high polymer content
which are insoluble in water and non-degradable in nature. Microplastics have emerged as a
recent threat to the global environment.
The main aim of this thesis is to establish the methods of marine microplastic sample collection
and methods of examining the collected samples at Arcada’s laboratory.
1.2. Objectives • To review the methods of microplastics sampling and analysis
It includes the literature review of various journal articles, books, research papers which
have information on the methods of MPs sampling and analysis.
• To determine the most suitable method for analyzing microplastics in Arcada by
using resources available at Arcada’s laboratory
Among various methods and analysis techniques for MPs, this thesis will focus on the
best suitable method for MPs analysis, considering the resources available at Arcada’s
chemistry laboratory.
• To develop the sample collection methods from local environment
Thesis will cover the information on how the samples from local environment are
collected and what is the best guideline to follow while collecting the samples.

2
• To develop the separation methods for collected microplastic samples
Collected samples from local environment will be separated in laboratory using best
suitable separation methods. Thesis will cover different types of separation methods of
MP samples.
1.3. Thesis framework
Figure 1: Thesis framework
One of the aims of this thesis was to conduct a literature review of articles published on MP.
Therefore, this thesis explained the views of various researchers and authors about MP, their
presence in marine environment and experimental methods to analyze MP. Literature review
section explained general information on MP, their classification and how they end up in the
marine environment. The literature review section is followed by MP in marine environment;
which described about presence of different types of plastics in the marine environment,
different marine animals which are susceptible to MP and effect of MP on them. Review on
sample collection section explained the sample collecting methods from water, sediments and
biota and described protocol while collecting each sample. Experimental section described a
laboratory examination of sediment samples collected from 4 different beaches around the
world using two different methods and lastly the result and analysis section focused on the
results from microscopic analysis of the sediment samples.

3
2. LITERATURE REVIEW Over the last few decades, microplastics has been a threat to marine environment. In 2012
some of the reviews focused on some areas of microplastics sample collection and analyzing
methods particularly from sea water and freshwater (A.B. Silva et al, 2018). During the
process of analyzing, the toxicological effects of microplastics towards living organisms
has also been thoroughly examined. On the other hand, the presence of microplastics in
environment has also been assessed through methods such as extracting the materials from
their matrices and their identification is studied through quantitative and qualitative
measurement of chemicals presence on them (A.B. Silva et al, 2018).
2.1. Plastics in general Plastics are made up of long and repeating chains of monomers. A monomer is a base molecule
which repeat throughout the polymers. Like wood, paper and wool, plastics are also organic
materials. Materials like cellulose, coal, natural gas, salt, crude oil are the main raw materials
for plastics. (Anon., ei pvm)
Plastics can be divided into mainly two groups: thermosets and thermoplastics.
• Thermosets
Thermosets are synthetic materials which on heating can strengthen but cannot be
remolded or reheated to their initial phase. These types of plastics are crosslinked with
narrow chains. Thermosets are hard and brittle. Examples of thermosets are phenolic
resins, polyester resins, and epoxies.
Figure 2: strong crosslinking thermosets (Klein, 2011)
• Thermoplastics
Thermoplastics consists of macromolecules chains without crosslinking between the
chains. Thermoplastics are softened when heated and get harden when cooled.
Thermoplastics can be changed into different shapes by applying heat, but the
chemical composition remains same. (Anon., 2018) The chemistry of thermoplastics

4
helps it to have a resistance against the environmental effects like UV radiation.
(Klein, 2011). Examples of thermoplastics are polycarbonate (PC), polystyrene (PS),
polyvinylchlorides (PVC), and polysulphone (PSU).
Figure 3: Linear and chained thermoplastic molecules (Klein, 2011).
The main problem with plastics is that they do not degrade easily. It is possible that they may
break into smaller pieces but take too much time for degradation. Following table gives clear
view on worldwide production of plastics. The mismanaged of these plastic leads to the
formation of microplastics.
Table 1: Six types of plastic polymers produced worldwide (Nerlannd et al., 2014).
Plastic type
Abbreviation
Production in
tones
(%)
Polyethylene
PE 85 30
Polypropylene PP 54 18
Polyvinyl chloride PVC 31 11
Polystyrene Expanded
polystyrene
PS, PS-E 21 7
Polyethylene terephthalate PET 19 7
Polyurethanes PUR 21 7

5
2.2. Microplastics Microplastics pollution is widespread and major threat to the environment in recent
times. Microplastics are smaller plastics with ≤5 mm size. There are various ways in
which microplastics can enter the environment. The most common way is the
degradation of macroplastics. The breakdown of macroplastics can happen through
various mechanism.
Figure 4:Formation of microplastics by degradation of macroplastics (Wagner, 2017)
The most common ways are: chemical degradation, tire abrasion, physical weathering of
macroplastics. (Boucher, 2017)
2.2.1. Types of microplastics
The main basis on which microplastics are categorized is whether the particles are originally
manufactured to be that size or they break down in smaller pieces. Mainly two types of
microplastics are contributing the contamination in marine life. They can be divided as:
• Primary microplastics
The main sources of primary microplastics are cosmetic and personal care products like
cleansers, scrub (as skin exfoliators) shower gels, toiletries agents. They can also be
generated

6
Figure 5:Primary sources of MPs (Boucher, 2017)
through other various means: erosion of tyres while driving, abrasion of synthetic textiles during
laundry, road markings, marine coatings, and city dust.
• Secondary microplastics
The secondary sources of microplastics are the larger plastics which break downs into
smaller pieces through the process of photo degradation which are caused by ultraviolet
rays from the sun and other mechanical forces. This happens to mismanaged waste like
used large plastics bags and fishing nets (Boucher, J et al., 2017).
Figure 6:MPs from break down of macroplastics (Nerlannd et al., 2014)

7
3. MICROPLASTICS IN THE MARINE ENVIRONMENT Growing evidences suggests that MPs are rapidly entering the environment. MPs have been a
major concern of debate among the scientists, politicians and public around the world. It is
scary to see how fast MPs are entering to the environment.
Figure 7: Ways of MPs ending up in marine environment (Stolte, 2014)
MP particles have been found widespread in numerous sites: from costal region to remote
offshore areas (Hidalgo-ruz et al., 2012). The occurrence of MPs depends on the nature and
location of sources and the environmental conditions. The sources of MPs can be unmanaged
plastic waste on land or ocean, leakage from transport of goods, fishing equipment, waste water
treatments plants etc. Several variables are responsible for MPs’ distribution in the
environment.
Figure 8: Transport of MPs in environment through various process (Kärrman et al., 2016)

8
One factor is the buoyancy of plastic polymers; for instance, PE and PP are float on the water
surface as they have lower density than the water. In same way PVC and PET have higher
densities than water, hence that is why they found below the water surface (Kärrman et al.,
2016). MP distribution in the environment depends on the particle size of MPs. As Kärrman et
al. suggested macro particles are capable of being transported in water longer distance in
comparison to the micro particles (Kärrman et al., 2016).
Occurrence in the water column
Microplastics are widely distributed in the world’s oceans. In the case of water column
sampling they have been found in both the Atlantic and the Pacific oceans (Nerlannd et al.,
2014). From the samples collected worldwide research studies have shown that the presence of
MP is 60% in the northwest Atlantic, 61% of Portugal, 74% in Corsica in western
Mediterranean, 89% in the Celtic sea and 97% in an estuary on the North Sea (Nerlannd et al.,
2014). The most abundantly found MPs are fiber, granules and films. There is no record of
research done in deeper water regarding the presence. Following table shows the presence of
different types of plastics in water column and their origin.
Table 2: Types of plastic in marine environment (Andrady, 2011)
Plastic Class
Specific
Gravity
Production
worldwide
Products and typical origin
Low-density
polyethylene
LDPE
LLDPE
0.91–
0.93
21% Plastic bags, six-pack rings,
bottles, netting, drinking straws
High-density
polyethylene
HDPE 0.94 17% Milk and juice jugs
Polypropylene PP 0.85–
0.83
24% Rope, bottle caps, netting
Polystyrene PS 1.05 6% Plastic utensils, food
containers
Foamed
Polystyrene
Floats, bait boxes, foam cups
Nylon PA
<3% Netting and traps
Thermoplastic
Polyester
PET 1.37 7% Plastic beverage bottles
Poly (vinyl
chloride)
PVC 1.38 19% Plastic film, bottles, cups
Cellulose
Acetate
CA
Cigarette filters

9
Occurrence in beach sediments
The occurrence of MPs in sediments were reported back in the late 1970s. The early
observations were made in various countries such as Spain, New Zealand, Canada, Bermuda,
and Lebanon. This helps to understand the MPs distribution worldwide from the late 1970s
(Van Cauwenberghe Lisbeth, 2015).
The main way of MPs entering the aquatic system is through the plastic litter from various
sources such as municipal wastes, activities in shores, illegal dumping of domestic and
industrial wastes, and from sewage treatment systems. Kärrman et al. suggested that the plastic
waste generated from coastal countries worldwide in 2010 was approximately 192 tons and out
of it 2–5% was mismanaged which later end up in ocean (Kärrman et al., 2016).
Various reports suggested that in the UK, MPs and fibers were found in 23 out of 30 submerged
sediments samples (Stolte, 2014). This indicates that how MPs can be effectively transported
from water column to sediments. The macroplastics loads in beaches can affect in the presence
of MPs. For example, a high number of MPs were detected in Hawai’ian beaches and in Greek
beaches (Stolte, 2014). Similarly, the accumulation of litter on German Baltic Sea and North
Sea beaches is dominated by plastics comprising of 59% of whole litter.
The main sources of MP accumulation in sediments are local plastic industry, large ports, large
number of pellets and wastes from recreational activities on shore (Hidalgo-ruz et al., 2012).
Effect of MPs on aquatic organisms
When MPs through various means of carriers end up in the aquatic environment they will
interact with their surroundings and their biological fate and mobility depends on their size,
shape and other different properties. Aquatic organisms are hugely affected by the MPs present
in water. The main pathway is through ingestion of MPs by aquatic animals. Since MPs can be
found in sediments, thus the detritus feeding animals are likely susceptible (Wright, 2013).
Recently, several controlled laboratory experiments have been performed to find out the reason
behind the ingestion of MPs by marine biota. The main reason of ingestion of MPs particles in
many cases can be taken as an accident because often the MPs is mistaken as food by marine
organisms.
The consumption of MPs can cause harm on marine organisms in physical and chemical ways.
It may affect the mobility through attachment of polymer in external surfaces. It can also clog
the digestive tract and can cause inflammation (Auta, 2017). From the laboratory experiments,
it has been observed that the MPs ingestion is found in variety of marine organisms.
For example: Blue Mussel, copepods, amphipods, barnacles and lugworms represents some of
the most omnipresent zooplankton which are highly susceptible species in ocean (Stolte,
2014). A recent study from the Baltic Sea examined the presence of 10 µm PS spheres by
zooplankton (Jönsson, 2014)
10
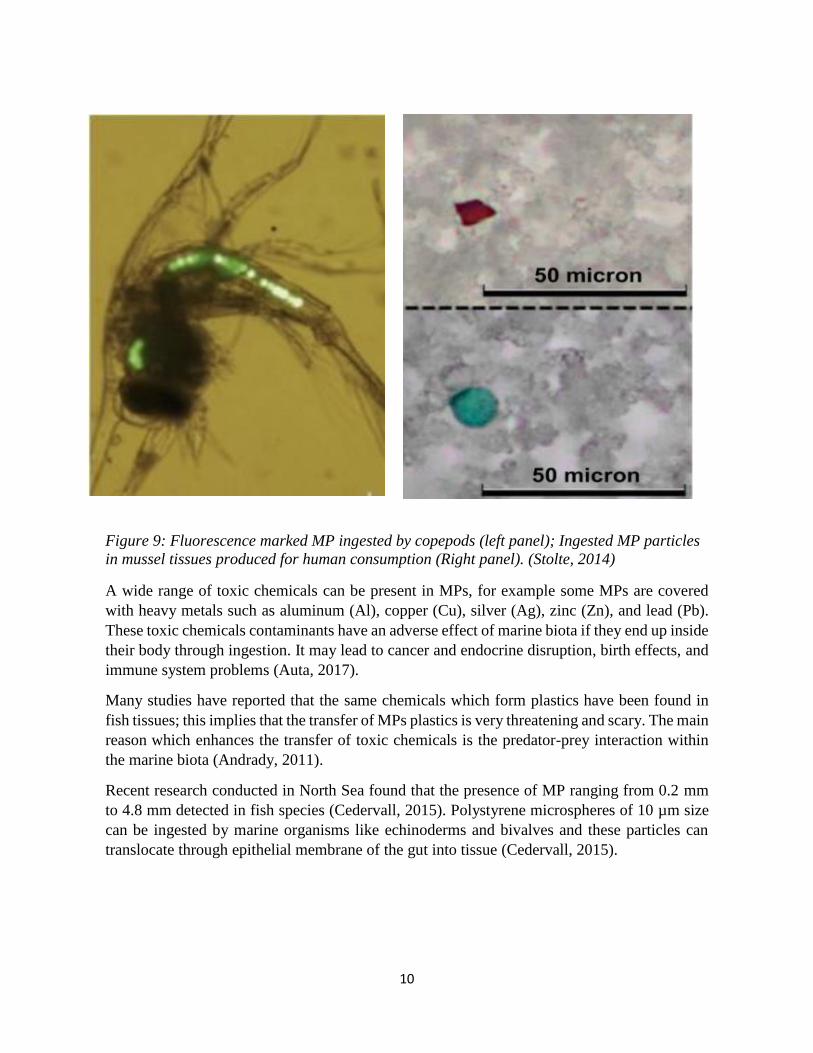
Figure 9: Fluorescence marked MP ingested by copepods (left panel); Ingested MP particles
in mussel tissues produced for human consumption (Right panel). (Stolte, 2014)
A wide range of toxic chemicals can be present in MPs, for example some MPs are covered
with heavy metals such as aluminum (Al), copper (Cu), silver (Ag), zinc (Zn), and lead (Pb).
These toxic chemicals contaminants have an adverse effect of marine biota if they end up inside
their body through ingestion. It may lead to cancer and endocrine disruption, birth effects, and
immune system problems (Auta, 2017).
Many studies have reported that the same chemicals which form plastics have been found in
fish tissues; this implies that the transfer of MPs plastics is very threatening and scary. The main
reason which enhances the transfer of toxic chemicals is the predator-prey interaction within
the marine biota (Andrady, 2011).
Recent research conducted in North Sea found that the presence of MP ranging from 0.2 mm
to 4.8 mm detected in fish species (Cedervall, 2015). Polystyrene microspheres of 10 µm size
can be ingested by marine organisms like echinoderms and bivalves and these particles can
translocate through epithelial membrane of the gut into tissue (Cedervall, 2015).

11
The following table below shows which marine organisms are susceptible to MPs ingestion and
their leading pathways to the MP ingestion.
Table 3: Organisms susceptible to MPs and the pathway led to ingestion (Wright, 2013)
Species Encounter pathway
Marine algae e.g. Scenedesmus
Grazing microzooplankton e.g.
the marine ciliate Strombidium
sulcatum
Adsorbs Nano plastics, especially when positively charged.
Size-based selectivity indicates potential to ingest microplastics of
appropriate size.
Benthic deposit feeders e.g. the
polychaete Arenicola marina and
the holothurian floridana
The sea bed is a sink for high-density microplastics; size-based,
deposit- feeding strategies
adopted by A. marina indicate potential to ingest microplastics of
appropriate size; H. Floridana selectively ingests plastic particles,
showing a preference for fibrous shapes.
Benthic scavengers e.g. the
crustacean Nephrops norvegicus
Fibrous microplastics have been found to accumulate in marine
sediments; gut content analysis has shown plastic microfibers are
being ingested in the environment; ingestion is passive via food it
scavenges or sediment.
Mesozooplankton e.g. echinoderm
larvae, calanoid copepods,
chaetognaths
Low density microplastics present on the sea surface with greatest
abundances in gyres and industrial harbors; size-based selectivity
indicates potential to ingest microplastics of appropriate size.
Benthic suspension feeders e.g.
the bivalve Mytilus edulis
Susceptible to sinking microplastics; have been found to ingest
microplastics despite low qualitative value.

12
4. REVIEW ON SAMPLE COLLECTING METHODS This section explains the various methods on sample collection employed by many researchers
during their experimental work. MP sample collection and sample handling process is a very
delicate process. Therefore, it is very important to identify the sources of contamination. The
material like synthetic fibers, gears, clothing and other unwanted can contribute to the
contamination of microplastics samples. To prevent these risks of contamination, the sample
collecting equipment should be cleaned thoroughly, samples should be covered between use
and polymer free clothing should be worn while performing tests.
The microplastics samples can be collected in following ways
Table 4: Sampling equipment used to collect MPs (A.B. Silva et al, 2018)
Matrix Equipment
Water
Surface:
Mid water level
Sediments
Bottom sediments
Surface samples
Seabed samples
Biological tissue
Collection with trawl having rectangular
opening and a net which relates to net or a bag.
Collection using bongo nets
Collection with a box corer
Collection with iron spoons or non-plastics
spades
Collection with core or bottom trawl
Dissection marine animals, egestion.
Water sample
Water sample is collected using different kind of nets. Most widely used nets are neuston net,
manta trawl, bongo nets. These nets have sample collection container at their tail end. The size
of nets varies from 53 µm to 3 mm, which influence the volume and the types of microplastics
samples obtained during sampling process (A.B. Silva et al, 2018). These nets are mostly used
for large scale sample collection. Whereas, laboratory sample collection bottle can be used for
small scale sample collection procedure. The collected sample should be labelled with the GPS
location, collected date, project name and the name of a person who collected the sample.

13
a) Figure 10:Equipment used during sample collection process is: a) neuston net, b) is
manta trawl, c) is a catamaran which is used for mid water level sampling and d) is a
bongo net (A.B. Silva et al, 2018).
Manta nets and trawls are recommended for the large-scale sample collection for surface water
sampling in lakes and seas. Due to the large surface areas of seas and lakes neustonic nets are
used for surface water sampling at depths of 0–5 m (Lei Mai et al, 2018).
4.1. Sampling of sediments This is the method of sampling where the microplastics are collected from coastal beaches or
from the lake bottom. The sample collection in beaches is easier and more convenient. There is
not one specific way to be followed during sampling process. It solely depends on individual
and the place of sampling. Most researches prefer to use tidelines, sampling depth to collect
samples from beaches (Lei Mai et al, 2018).
The procedure of sample collection is simple as it is done by using stainless steel tools like a
shovel or spoon. Using latex gloves and cotton clothes during the sampling process helps to
minimize the contamination in samples.
Sediment sample collection process can be done in following way: First try to find the high tide
line, where the debris that washed away with tide get accumulated. Then randomly select the
location tide line and place the quadrat with the tide line as shown in the figure below. After
selecting the location make sure to remove large pieces of debris from the selected location. At
last use shovel or stainless-steel spoon to pick up the sample from the top 3 cm of sand. Then
the collected sample should be placed in sample collection bottles and marked with the label
having information on date of sample collection, place, GPS location.

14
Figure 11: High tide line (Sartain, 2018)
Figure 12: Using spoon to get sediment sample (Sartain, 2018)
4.2. Biota sampling Biota samples can be used to determine the range of microplastics present in the aquatic
environment since microplastics can be ingested by aquatic animals like fish, sea turtles,
seagulls and many other planktons. The samples are collected from the digestive tracts of
animals (Lei Mai et al, 2018). The marine animals are dissected in laboratory to collect the
samples from their digestive tract.

15
Figure 13: Plastics litter ingested by fish (Mytilineou, 2015)
4.3. Sample separation and purification
4.3.1. Flotation
Sample separation and purification can be done in many ways. The most widely used in
microplastics sampling is density separation. It is used to isolate the particles which have low-
density from higher density particles like sand, mud, and sediments. Microplastics such as PP,
PE, have lower density in the comparison to sea water (1.10 g/cm3) (Lei Mai et al, 2018). In
the case of higher densities microplastics like PVC (1.40 g/cm3) or greater than that, different
kinds of density solutions are used to separate microplastics from them. Saturated NaCl is
mostly used during this process, because of its nonhazardous characteristics. It is also cheap
and quite easily available in market. There are also some disadvantages of using NaCl solution
as a density separator. In the case of sample which have higher density (PVC) may not be
completely extracted during the process.
Another widely used solution during the flotation process is ZnCl2, which is very helpful to
extract almost all microplastics with different densities. The predominant materials like PP and
PE have a specific low density than the ZnCl2 and CaCl2 solutions (Stolte, 2014). The drawback
of using ZnCl2 is that it is toxic in nature. Various other flotation solution is used as a density
separator, but the overall procedure is quite same.
Table 5: Specific densities and solubility of crystalline salts at room temperature (Stolte,
2014)
Salt Specific density
g/cm3
Solubility
g/ml
NaCl
CaCl2
ZnCl2
2.17
2.15
2.91
1.20
1.47
2.14
16
The process of density separation begins with mixing a salt solution with a sample and shaking
it properly to homogenize the slurry (Lei Mai et al, 2018). Then it is allowing to settle down for
few hours, which let higher densities particles (sand) to settle down on the base. The solution
above the sediment is separated using filtration and in this way extraction of microplastics can
be done using flotation method.
• Centrifugal density separation method
Recent research on MPs suggest that many researchers use the intensive density
separation methods to extract synthetic polymers from the sand grains. The centrifugal
density separation method is one of them. The first step starts with air venting of the
sample, using high density solution, preferably aqueous ZnCl2 at 1.4–1.6 g/ml densities
(Stolte, 2014). Air venting is applied for several hours before the light weight plastics
material are observed on the surface.
4.3.2. Sieving and rinsing microplastics sample
This method of microplastics separation is applicable for many common plastics like PE, PP,
and PVC. Microplastic samples with size ranges from 5 mm to 0.3 mm can be analyzed using
this method (Masura et al, 2015). The size of sieve may change according to sample. For
instance: water samples and beach samples, generally a 5 mm sieve is used but for bed samples
a 0.3 mm sieve is used. The sieving process is done by using stainless steel sieves rather than
plastics ones to avoid contamination of microplastics samples. The drawback of this method is
clogging of sieve aperture and length of sample processing time.
4.3.3. Sample purification
Sample purification is done to obtain reliable data about microplastics present in samples. Much
organic matter is attached to the surface of microplastic samples which are obtain from various
parts. These samples need to be purified before going for identification processes. To do so, a
solution of 30% H2O2 has been frequently used (Lei Mai et al, 2018). Many other digestion
techniques are also employed to take the organic matter away from the sample. Most of those
techniques are reliable to extract the microplastic samples from tissue of zooplankton (Herrera
et al., 2018). A recent study suggested that the presence of vegetal material like algae,
seagrasses and along with various small residue is abundant in microplastics samples obtained
from beaches. These materials can be sorted by naked eyes or using sieving, but the other small
residue cannot be sorted with naked eyes. To overcome these residues from microplastics
sample, an efficient procedure is discovered. which is less time consuming and likely to extract
all the small vegetal residual from microplastics sample (Herrera et al., 2018). The procedure
is based on a 5-digestion protocol using chemicals like HCL, NaOH, KOH, and H2O2 treatments
along with density separation process using 96% ethanol. The digestion process is very useful
to eradicate the vegetal contamination present in microplastic samples.
4.4. Review on identification process After sample preparation, microplastics can be identified from various techniques. Among all
the microplastics identification techniques, visual identification is the most common approach
to identify microplastics. Which is then followed by confirmation through the chemical
composition by using optical and spectroscopic techniques (A.B. Silva et al, 2018).
17
4.4.1. Visual identification
This is the first step toward the microplastics identification process. In case of large
microplastics, it can be sorted out directly. While in the case of small sized microplastics there
is a need for further observation under a microscope. Visual identification is not applicable to
the particles size <500 µm because the chances of misidentification is very high (Bergmann et
al., 2015). Therefore, (Hidalgo-ruz et al., 2012) suggested that the particle size limit is 1 mm
for the visual identification process. This method is specially employed for large sized
microplastics; therefore, the need of other techniques can be avoided in this case. Which finally
can save time and resources throughout the process.
The drawback of this method is the size limitation of the sample, for instance: particles below
certain size cannot be differentiated. Another drawback is that it depends on the individual
involved during the counting process, therefore if something goes wrong than it directly effects
on data collection procedure.
4.4.2. Identification by chemical composition
This method, with the help of molecular composition of plastic polymer can determine their
polymer origin (Bergmann et al., 2015). Furthermore, this process gives clear way to identify
samples using polymer identification methods like FTIR, Raman analyses, pyrolysis along with
GC and MS.
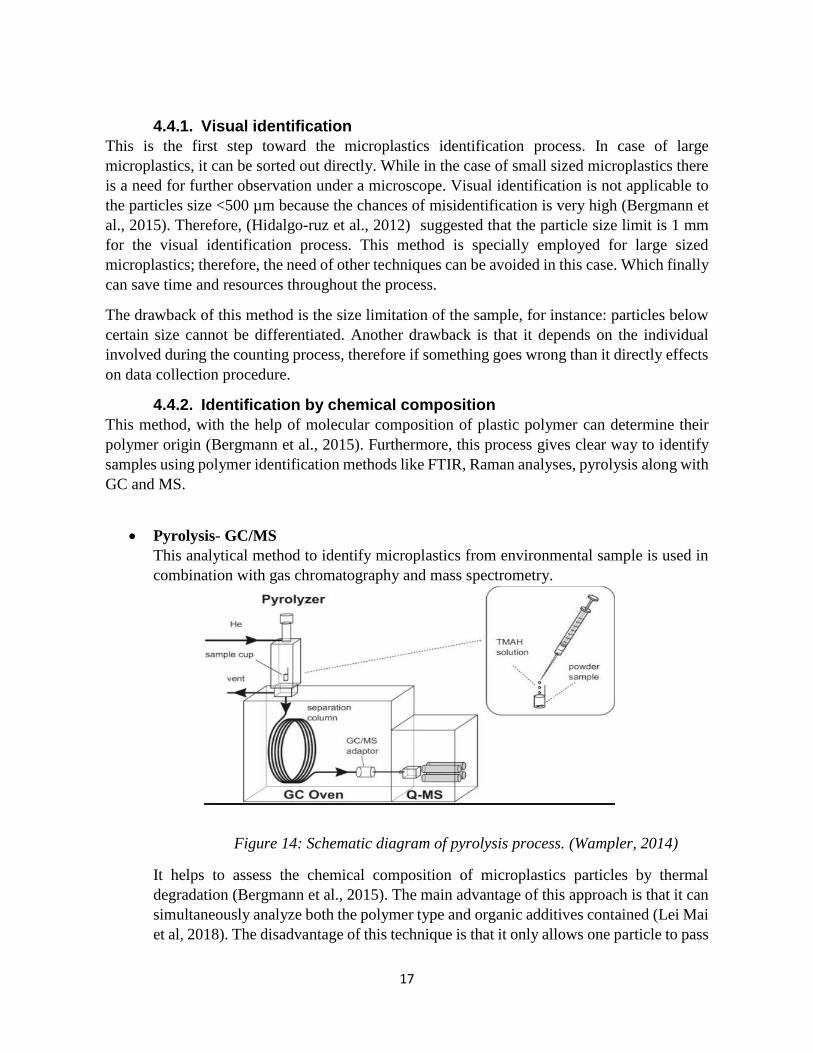
• Pyrolysis- GC/MS
This analytical method to identify microplastics from environmental sample is used in
combination with gas chromatography and mass spectrometry.
Figure 14: Schematic diagram of pyrolysis process. (Wampler, 2014)
It helps to assess the chemical composition of microplastics particles by thermal
degradation (Bergmann et al., 2015). The main advantage of this approach is that it can
simultaneously analyze both the polymer type and organic additives contained (Lei Mai
et al, 2018). The disadvantage of this technique is that it only allows one particle to pass

18
through pyrolysis tube at one time and hence more time consuming and lengthy process.
It has also size limitation and cannot be used for large size samples.
• FTIR spectroscopy
This method is suitable to determine the polymer origin and composition of
microplastics particle in samples (Bergmann et al., 2015). In addition, it offers the
chance of exact identification of particles accordingly their characteristic IR spectra.
The main advantage of using this technique is that it excites the molecular vibrations
while interacting with sample. In the case of a plastic sample, it makes easier with this
technique to obtain highly specific IR spectra with distinct band patterns. Furthermore,
FTIR spectroscopy also provide information on weathering of sampled plastic particles
by detection level of oxidation (Bergmann et al., 2015). The other optimized
technologies such as attenuated total reflectance (ATR) FT-IR and focal array detector
based micro FT-IR imaging are also used to study about microplastics sample (Lei Mai
et al, 2018). In case of microplastics samples with irregular shapes, ATR FT-IR stand
out as best technique due its ability to obtain spectra more clearly than any other
technique. To obtain high quality data and to reduce the measurement time, a resolution
of 8 cm-1 is suggested (Bergmann et al., 2015). The main drawback of this technique is
the size limitation of sample. There is still problem to analyze particles size < 1 µm.
Figure 15: Schematic representation of FTIR (Mccluskey, 2000)

19
• Raman spectroscopy
This is one of the best analytical technique available to determine the chemical
composition of unknown plastic fragments with high reliability (Hidalgo-ruz et al.,
2012). The main advantage of Raman spectroscopy is that it can examine small size
sample (1 µm) and it has also better response toward non-polar functional groups in
comparison to other analytical methods (Lei Mai et al, 2018). The process begins with
the exposure of sample to monochromatic laser source, which helps to irradiate the
sample. The wavelengths available for laser process are within the range of 500 and 800
nm (Bergmann et al., 2015). When the sample come under the interaction of laser light
then it starts to vibrate and results in the spectra, which is also called Raman shift. It is
also a surface technique to analyze microplastic samples, the large amount of visually
sorted MPs samples can be analyzed along with microscopy (Bergmann et al., 2015).
Figure 16: Schematic representation of Raman process (Jefriyanto, 2016)
4.4.3. Identification using laboratory methods
The process of microplastic identification in laboratory can be done in various ways.
There are different approaches to identify them in laboratory and it depends on sample
source. The methods are different for each sample. The National Oceanic and
Atmospheric Administration (NOAA) has categorized the process as follows:

20
• Analysis method for water samples
The main aim of this method is to analyze the presence of plastic debris as suspended
solids in water samples. The process begins with collecting samples from various places
using manta net. The collected samples include hard plastics, foams, films, fibers and
sheets (Masura et al, 2015). Samples are filtered using 0.3 mm sieves. The obtained
material is taken for drying process which helps to determine the exact weight of solid
material present in collected sample. In the presence of Fe(II), wet peroxide text is
carried out to digest the organic matter. The further treatment is carried out in presence
of aqueous NaCl to isolate plastic debris using filtration (Masura et al, 2015). A density
separator is used to separate denser undigested material form floating solids.
Furthermore, the floating solids are collected using a 0.3 mm filter and then air dried.
Then the plastics material is removed and proceed further to determine the exact weight
of microplastics present in sample.
• Analysis method for beach samples
This method is used to analyze plastic debris which are collected from beaches. The
method starts with sieving the dry beach samples using 5 mm sieve to remove large size
plastics. The plastics debris analyzed using this method ranges from 0.3 mm to 5 mm.
The process starts with preparing sample and let it to dry at 900 C till the sample get dry.
Then the process is followed by density separation using aqueous lithium metatungstate
(d = 1.62 g/mL) solution or NaCl solution and taken for visual observation under
microscope at 40X power (Masura et al, 2015).
• Analysis method for bed samples
This method is used to determine very common plastics like PE, PP, PVC and PS. The
sample are collected from bed sediments, which includes films, soft and hard plastics,
fibers, sheets. The process starts with disaggregating the dried sediments and then it is
sieved using 5 mm and 0.3 mm sieves. Wet peroxide oxidation is done to the MPs
collected in 0.3 mm sieves in the presence of Fe (II) catalyst which helps to digest
organic matter present in the sample (Masura et al, 2015). Then the process is followed
by density separation using NaCl(aq) to isolate the remaining plastic waste through
floatation. At last, the floating plastics debris is collected using a 0.3 mm filter and then
air dried and taken for examine to determine the MPs concentration.

21
5. EXPERIMENT AND METHODOLOGY In this chapter the sampling of beach sediments is introduced, and the methodology applied
for density separation, WPO for digestion of organic materials present in MPs samples is
described. The author follows the suggestion of (Hidalgo-ruz et al., 2012) in general steps
like sieving, filtration, and density separation.
The experimental processes were carried out at Arcada’s chemistry laboratory. Two
different methods were followed during the experimental process:
1. Following NOAA guidelines (Wet peroxide oxidation process)
2. Using saturated NaCl solution for density separation and microscopic
examination.
Prior to the experimental work, various articles, journals and books related to MPs
identification were studied. The guidelines recommended by NOAA marine debris program
were followed during the WPO process, filter design process and microscopic examination
process.
The reason behind choosing NOAA guidelines to do the experimental work is because it
covers all the necessary information regarding MP sampling and experimental processes. It
is easy to follow the pattern and format which are listed in NOAA guidelines. Most of the
researchers also follows the same NOAA guidelines in their research articles.
5.1. Materials and equipment The materials used in experimental process were restricted to glass to avoid the
contamination of plastics. The following are the materials used during the
experimental process and which came direct in contact with the samples.
• Glass beakers: 800 mL and 500 mL
• Weighing balance precise to 0.1 mg
• Drying oven
• Chemicals: NaCl, Iron Fe (II) solution (0.05 M), FeSO4.7H2O (278.02 g/mol)
• 30% Hydrogen peroxide: To digest the organic matter present in sample.
• Stir bar: It helps in stirring process and solution get mixed easily.
• Watch glass
• Laboratory hot plate
• Bottle contacting distilled water
• Sodium chloride
• Microscope
• Metal forceps
• Various size sieves
• Glass slides
• Double – sided Tape
• Funnel
22
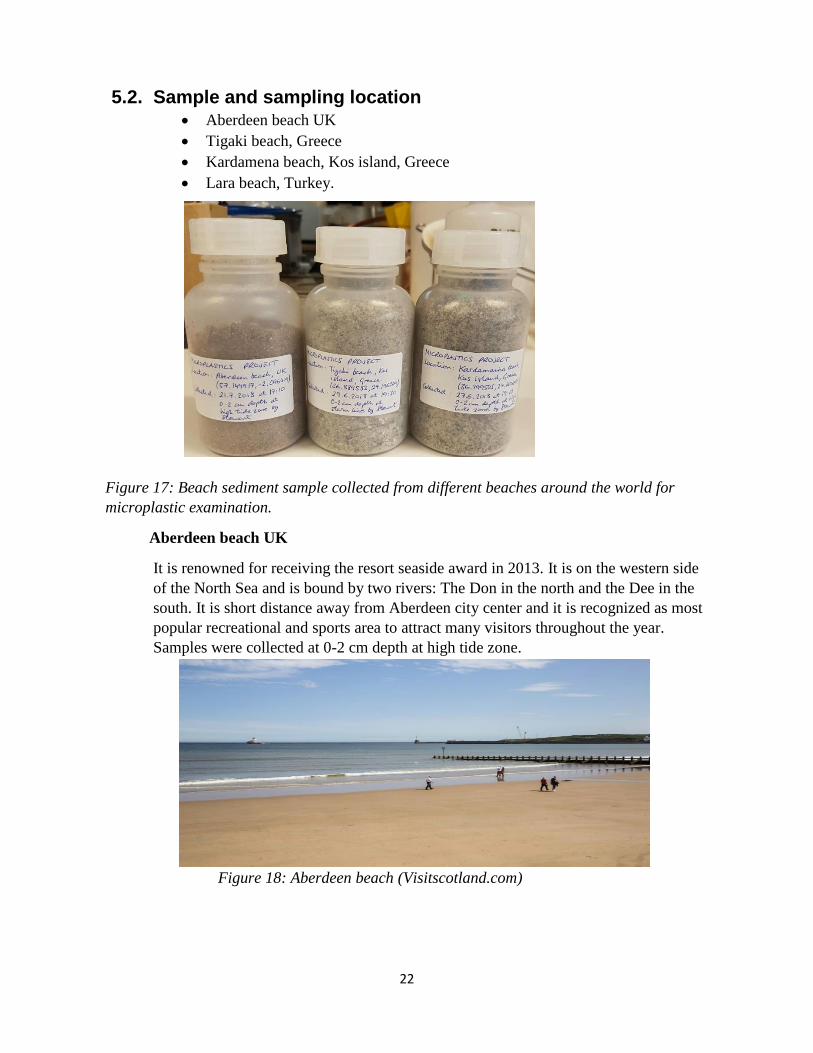
5.2. Sample and sampling location • Aberdeen beach UK
• Tigaki beach, Greece
• Kardamena beach, Kos island, Greece
• Lara beach, Turkey.
Figure 17: Beach sediment sample collected from different beaches around the world for
microplastic examination.
Aberdeen beach UK
It is renowned for receiving the resort seaside award in 2013. It is on the western side
of the North Sea and is bound by two rivers: The Don in the north and the Dee in the
south. It is short distance away from Aberdeen city center and it is recognized as most
popular recreational and sports area to attract many visitors throughout the year.
Samples were collected at 0-2 cm depth at high tide zone.
Figure 18: Aberdeen beach (Visitscotland.com)

23
Tigaki beach Greece
It is one of the popular holiday destination which attract many tourists each year. It is located
11 kilometers away from Kos town and 7 kilometers away from north of Asfendiou village.
Samples were collected at 0-2 cm depth at storm line.
Figure 19: Tigaki beach, Greece (www.kosinfo.gr)
Kardamena beach
It is one of the busiest beach in Greece. It is most popular tourist destination; the beach is
covered with soft sand and stretches for over 3 km. Samples were collected at 0-2 cm depth at
high tide zone.
Figure 20: Kardamena beach, Greece (Tripadvisor.com)
24
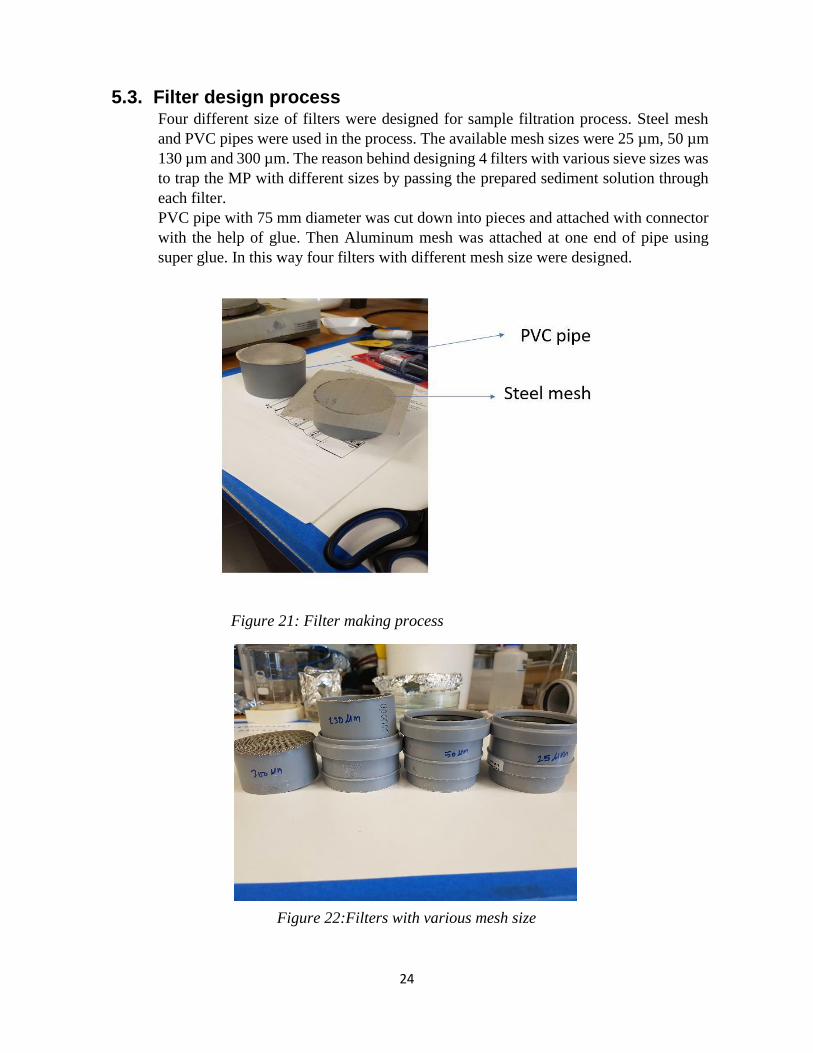
5.3. Filter design process Four different size of filters were designed for sample filtration process. Steel mesh
and PVC pipes were used in the process. The available mesh sizes were 25 µm, 50 µm
130 µm and 300 µm. The reason behind designing 4 filters with various sieve sizes was
to trap the MP with different sizes by passing the prepared sediment solution through
each filter.
PVC pipe with 75 mm diameter was cut down into pieces and attached with connector
with the help of glue. Then Aluminum mesh was attached at one end of pipe using
super glue. In this way four filters with different mesh size were designed.
Figure 21: Filter making process
Figure 22:Filters with various mesh size

25
5.4. Beach sample preparation process
Sample preparation started with weighing 100 g of wet samples by putting them in 800
mL beaker. Prior to the further analysis, the test samples were dried in standard hot- air
drying oven at 900 C overnight. Then the samples were left to air dry for overnight.
Now, the final weight of sample was calculated by subtracting the final weight of
sample from initial weight.
Sample 1: Aberdeen beach UK.
Calculations:
Weight of wet sample taken = 100 g
Final weight of sample after drying = 97 g
5.5. Density separation Density separation methods include use of NaCl to extract the largest fraction of MPs from
the samples.
1.25 M (d = 0.073 g/mL) of NaCl was added into 800 mL of distilled water and volume was
adjusted to 1 L by adding distilled water in it.
Weight of NaCl used = 73 g
Metal spatula was used to stir the sand and water vigorously. It helps to float MPs in the
surface.
Figure 23: (A) Adding distilled water in sample, (B) After vigorous stirring, (C) MPs after
density separation.
After vigorous stirring It was observed that the MP particles were floating on the surface. Using
0.3 mm size sieve all the solids were transferred to another beaker. Particles with size more
than 0.5 mm were removed. The collected solids were left for oven drying at 900C for 24 h.

26
• Mass of collected solids after using 0.3 mm sieve = 0.28 g.
• Weight of sample after drying = 0.23 g
5.6. Wet Peroxide oxidation (WPO) WPO is a highly reactive. One should follow the laboratory safety and policies before starting
the test. The WPO is very important test in the whole MPs analysis process. The main aim to
perform this was to reduce the organic matter presents in the sample. To perform the WPO
test on sample following procedure was followed:
20 mL of aq. 0.05 M Fe (II) was added to beaker which contained the samples. 0.05 M of Fe
(II) was prepared by adding 7.5 g of FeSO4.7H2O to 500 mL of distilled water and 3 mL of
concentrated sulfuric acid.
20 mL of hydrogen peroxide was added in the beaker and the mixture was kept in room
temperature for 5 minutes before following the next step. A stir bar was added in the beaker
and the beaker was covered with a watch glass. The beaker was placed on a hotplate;
maintaining the temperature of 75 °C. Temperature was kept below 750C to avoid overflow of
solution.
The whole process was done inside fume hood to minimize the potential chemical risk.
After few minutes of heating on hotplate, still natural organic matters were visible in the beaker,
so to digest the organic matter 20 mL of 30% hydrogen peroxide was again added to the beaker.
To increase the density of solution 6 g NaCl was added. Then the mixture was left to heat on
hot plate until the added salt dissolved.
Figure 24:WPO: (A) Beaker is placed on hot plate; (B) After 20% hydrogen peroxide added,
(C) Bubbles observed after the temperature reached at 75 °C.

27
5.7. Using saturated NaCl solution to extract MPs Saturated NaCl solution was used as a density separator to extract MPs from samples.
Excess of NaCl was mixed into distilled water to make saturated NaCl solution. The
solubility of NaCl in water is 35 g/100 mL at 200C. Therefore, 100 g of NaCl is enough in
200 mL of distilled water.
This was the second method followed in this thesis to analyze the MPs. It is simple and
straight method where saturated NaCl solution was mixed with sample and the whole
mixture was sieved using filters with various mesh sizes. Then the double-sided tape was
used to extract MPs particles from filter surface and the tape was attached on glass slides;
which was further used for microscopic examinations.
Four samples were used in this process;
• Lara beach sample, Antalya turkey
• Aberdeen Beach sample, UK.
• Tigaki beach sample, Greece
• Kardamena beach sample, Greece
General procedure
36 gm of NaCl was mixed in 100 ml of distilled water to make saturated NaCl solution. The
solution was properly mixed and poured into the beaker which contain 50 gm of beach sample.
The whole mixture was swirled with the help of metal spatula. When the sample and saturated
NaCl solution get properly mixed then it was passed through the filters with various mesh sizes.
Figure 25: 50 µm sieve is used to filter the solution.
After the solution was passed through the filter, MPs particles get trapped in the mesh. The
particles more than 5 mm size should be removed, and the filter was left for dry until couple of
hours. Double-sided tape was used to get the MPs particles less than 5 mm size from the mesh

28
surface when the mesh gets dried. The tape was now attached on the glass slide and taken for
microscopic examination.
Figure 26: MPs particles in filter
Figure 27: Slides for microscopic examination
Same process was repeated for other 3 remaining samples. The slides were named according
to the filter size used and the location from where sample were collected.

29
6. RESULTS AND ANALYSIS
6.1. Results of wet peroxide oxidation process (WPO)
The author followed the NOAA guideline during first experimental part while analyzing MPs
sample. The process of sieving, sample collection, filtration is same in both methods. NOAA
guidelines suggests using WPO method to digest the organic materials present in sample.
Before beginning the WPO, the author was expecting to extract MP less than 5 mm size from
the sample. NOAA guidelines also suggested that the use of 30 % of hydrogen peroxide will
digest all the organic matters present in the sample. But, in this case it didn’t work as the organic
matters were still visible in the sample. Unfortunately, the expected results were not obtained
at the end of the WPO. However, process was repeated more than 5 times using various samples.
As shown in Figure 23, only chitin -based crustacean or insect shells were found in the sample
along with some organic material, but no traces of MPs were observed.
Figure 28: Results from WPO showing organic matters and insect shells.
Results from density separation method (using saturated NaCl solution)
After not getting the expected results from WPO. The author followed the direct method of
using saturated NaCl solution for density separation suggested by (Hidalgo-ruz et al., 2012).
Saturated NaCl solution is used as a mean to separate lightweight particles from the sediments
in 50 g of sample.

30
Beach samples from 4 different beaches around the world were examined in this process. The
result obtained from this process are as follows:
Results of Aberdeen beach sample
Following pictures are obtained from microscopic examination of MPs sample:
Sieve used: 25 µm and 50 µm.
Pictures obtained from examination of Aberdeen beach sample showed the number of colored
MP and fibers along with some organic materials on it. Fibers detected in the test samples
showed the uniform structure and diameter, which suggest being from synthetic origin (Figure
B). Nevertheless, fibers were very difficult to distinguish under the microscopic examination
and needs advance technology to determine their origin and characteristics.
Figure 29: A: Blue colored MP 25 µm size sieve, B: Red colored fiber from 50 µm size sieve
C: Red colored MP and organic material from 50 µm size sieve; D: Blue colored MP from 25
µm size sieve.

31
Results of Kardamena beach sample, Greece
Two different filters with sieve size 130 µm and 25 µm were used to filter the MP sample
obtained from Kardamena beach. In figure A: two blue colored fibers can be seen along with
some undissolved NaCl crystals. In figure B: MP with some organic matters can be seen. Figure
A and B were obtained by using smaller magnification. While figure C and D were obtained
using higher magnification and bright field microscopy. Distinct blue colored fibers can be seen
in figure C and D. In Kardamena beach samples the presence ratio of colored fibers is high in
comparison to the colored particles.
Figure 30: A: Blue colored MP along with some undissolved NaCl crystals, B: Blue colored
MP and some organic matters from 130 µm size sieve; C: Blue colored fiber from 25 µm size
sieve; D: Blue colored fiber (likely cotton) from 25 µm size sieve.

32
Results of Tigaki beach sample, Greece
The visual inspection of Tigaki beach samples showed that the presence of distinct colored MP
particles and fibers along with organic matters. The detection of colored particles and fibers can
be seen in picture below. Like in other sediment samples, Tigaki beach samples also showed
the colored fiber count is higher than the particles present in the sample.
Figure 31: A: Blue colored MP from 130 µm size sieve; B: Blue colored fiber and some
undissolved NaCl crystals from 25 µm size sieve, C: Blue colored fiber along with some organic
matters from 50 µm size sieve; D: Blue colored fiber and some salts crystals from 25 µm size
sieve

33
Results of Lara beach sample, Turkey
Visual inspection of Lara beach samples showed the presence of uniform size blue colored
fibers. The fiber size ranges from 210 µm to 500 µm. The MP particles found in this sample
were very few in compare to the colored fibers. In figure B: the fiber looks like from synthetic
origin because of its uniformity in structure. Some undissolved salt crystals and sand particles
can be seen in figure from lower panel.
Figure 32: A: Blue colored fiber and organic matter from 50 µm size sieve; B: Blue colored
fiber from 50 µm size sieve; C: Blue colored fiber along with some salts crystal from 50 µm
size sieve; D: MP from 25 µm size sieve.

34
6.2. Analysis Analysis on method used
One of the objectives of this thesis was to develop the method to analyze MPs sample at Arcada
chemistry laboratory. This thesis covers two different types of methods to analyze the MPs
sample which are collected from various beaches around the world. The first method described
in this thesis was the method suggested by NOAA guidelines using H2O2 as a digestor. The
main reason of following NOAA guidelines while performing the experimental part is because
it is the base for all the research articles published till now on experimental methods to analyze
MPs in laboratory. Most of the researchers who published the articles has cited the NOAA
guidelines as their main source.
It is supposed to digest all the organic material present in the sample. But in contrary, the
process did not work as expected and many organic matters remain undigested in the sample.
Undigested organic matter can be seen in the figure 34 below. Another unexpected result
obtains from this method is that absence of MPs particles less than 0.5 mm size after completion
of test. There might be various reason behind the test did not work for this specific sample. One
reason could be the use of quantity of sample (100 gm) during the experimental procedure.
Figure 33: Undigested organic matter in beaker after completion of test.
In figure 29, the organic matter is not completely digested even the 30% H2O2 was used three
times as suggested by the NOAA guidelines. Another method explained in this thesis is the
direct method of using saturated NaCl solution for density separation and proceeding the sample
for microscopic examination. For microscopic examination of sample, it does not make any

35
difference whether there is presence of organic matter or not. At the end one can differentiate
between microplastics and organic matter present in it.
Analysis of scientific sample collected from 4 different locations
All the samples collected were processed according to the procedure described in section 5.5
and 5.7 using two different methods. While analyzing the pictures obtained from the first
procedure one can see that there is no presence of MPs particles (Figure 29) only the undigested
organic matter can be seen.
But in microscopic examination of the same samples, one can see that the presence MPs with
distinct blue and red color and the presence of blue colored fiber in huge amount in every sample
(Figures 32 and 33). During the visual inspection of all the test samples, the presence of colored
fibers was higher than the colored particles. Most of the fibers detected showed the uniform
structure and diameter. This implies that their origin must be synthetic, but it was very difficult
to distinguish through visual inspection.
General observation of the test samples showed the presence of red and blue particles with
smooth surface and were frequently detected in all 4 sediment samples.
The colored fibers count was high in every samples than the colored particles except in
Aberdeen beach samples. In Aberdeen beach sample the presence of colored MP particles was
higher than the fiber (Figure 30). All the test samples contained from minimum of 1-7 colored
fibers and 1-5 colored particles. The detection of colored particles and fibers are displayed from
figure 30-33 above.
Visual inspection of all the test samples also showed the presence of organic matters like
insect’s shells, water plants blades (fig 31 B) and sand particles. During the sediment separation
process the organic matter clogged the filter surface area. In this experiment, double-sided tape
was used to get the microplastic from the filter surface and organic matters get attached to the
tape along with the MP particles. This is the reason why an organic material was visible during
the visual inspection of samples.

36
7. CONCLUSION This thesis has provided an overview on various analytical methods used to analyze MPs sample
collected from coastal environments. It also provides information on various methods of MPs
sampling techniques, extraction and quantification MPs. Due to use various approach while
analyzing MPs samples the data might get different from the existing data. The comparison of
MPs contamination worldwide only can be done if the procedures and methodologies got
standardized globally. In a nutshell analytical procedure can be explained with the help of
following flow chart:
Figure 34: Flow chart explaining analytical procedure of analyzing microplastics sample
In this thesis only, the scientific samples collected from beach sediments were analyzed using
microscopic examination method. Due to the lack of advanced analytical methods like Raman
spectroscopy, FTIR, and pyrolysis GC/MS, it is difficult to understand the origin of the MPs.
Microscopic analysis can only help to characterize the MPs.
As the objective of this thesis was also to do the literature review on experimental methods of
analyzing MPs samples, author can give following recommendations based on study:
• For the sediment sampling process selection of the site is highly important. One should
have to find the site which can provide the representative of MPs contamination in that
specific site.
• Various types of water sample collecting nets described in the literature review section
of this thesis can used to collect the water sample in large scale. The small-scale
collection can be done with sample collection bottle.
• Density separation is very important during the purification process and is strongly
recommended. In this thesis, the author chose to use the NaCl solution in the density

37
separation process but other denser salts like ZnCl2 and CaCl2 are also highly
recommended to get the effective results.
• Wet peroxide oxidation procedure done to digest the organic matter present in the
sample did not provide very satisfactory results. Other strong digesting agents can be
recommended. But when it comes to microscopic examination, this part can be avoided.

38
8. REFERENCES A.B. Silva et al, 2018. Microplastics in the environment: Challenges in analytical chemistry -
A review, Analytica Chimica Acta, s.l.: Science direct,
al., M. e., 2015. Enivronmental science process and impacts. Royal society of chemistry, Issue
12, pp. 1-11.
al., M. e., 2015. Nano-plastics in aquatic environment.. Royal society of chemistry, Issue 10,
pp. 1-11.
al, k. M. e., 2015. Environmental sciecne processes and impacts, s.l.: s.n.
Andrady, A. L., 2011. Microplastics in the marine environment. Elsevier, 62(8), p. 10.
Anon., 2018. Thomasnet. [Online]
Available at: https://www.thomasnet.com/about/thermoset-plastics-61020277.html
[Accessed 19 september 2018].
Anon., 2018. Wikipedia. [Online]
Available at: https://en.wikipedia.org/wiki/Fourier-
transform_infrared_spectroscopy#/media/File:FTIR_Interferometer.png
[Accessed 09 December 2018].
Anon., n.d. Plastic Europe. [Online]
Available at: https://www.plasticseurope.org/en/about-plastics/what-are-plastics
[Accessed 19 September 2018].
Auta, H. e. a., 2017. Distribution and importance of microplastics in the marine environment :
A review of sources, fate,effects and potential solutions. Environment international, Volume
102, pp. 165-176.
Bergmann et al., 2015. Methodology Used for the Detection and Identification of
Microplastics—A Critical Appraisal, Helgoland, Germany: Polar and Marine Research,
Marine Station.
Booth et al, n.d. toxicotoxicological impacts of microplastics on marine organisms, including
species providing a source of food, Toronto: Materials and chemistru.
Boucher, J et al., 2017. Primary Microplastics in the Oceans: A Global Evaluation of
Sources, Gland: IUCN, Gland, Switzerland.
Boucher, J. a. F. D., 2017. Primary microplastics in the oceans:A global evaluation of
sources. Gland: IUCN .
Cedervall, e. a., 2015. Nano-plastics in the aquatic environment. Environmental science.
Processes & impacts, Volume 17.
Herrera et al., 2018. Novel methodology to isolate microplastics from vegetal-rich samples.
Science direct, Volume 129, p. 9.

39
Hidalgo-ruz et al., 2012. Microplastics in the marine environment: A review of the methods
used for identification and quantification. Environmental Science and Technology, s.l.: s.n.
Jefriyanto, W., 2016. Raman spectroscopy, s.l.: Slideshare.
Jönsson, R., 2014. Microplastics in the oceanic ecosystem, Gothenberg: epartment of
biological and environmental sciences, University of Gothenburg.
Kärrman et al., 2016. Exposure and Effects of Microplastics on Wildlife, Örebro: swedish
environmental protection agency.
Kershaw, P. J. e., 2015. Sources, fate and effects of microplastics in the marine environment:
a global assessment, london: INTERNATIONAL MARITIME ORGANIZATION .
Klein, R., 2011. Laser welding of plastics. s.l.:Wiley-VCH Verlag GmbH & Co. KGaA..
Lei Mai et al, 2018. A review of methods for measuring microplastics in aquatic
environments. [Online]
Available at: https://doi.org/10.1007/s11356-018-1692-0
[Accessed 5 April 2018].
Masura et al, 2015. Laboratory Methods for the Analysis of Microplastics in the Marine
Environment, Silver Spring MD: National Oceanic and Atmospheric Administration,.
Mccluskey, M., 2000. Local Vibrational Modes of Impurities in Semiconductors.. Journal of
Applied Physics, Volume 87, pp. 3593-3617.
Melissa B. Phillips, 2014. THE OCCURRENCE AND AMOUNT OF MICROPLASTICS
INGESTED BY FISHES IN THE WATERSHEDS OF THE GULF OF MEXICO, Texas: Texas
State University.
Mytilineou, C., 2015. Protocal for macrolitter ingested in fish stomach, s.l.: hellenic center of
marine research.
Nerlannd et al., 2014. Microplastics in marine environments: Occurrence, distribution , Oslo:
Norwegian Institute for Water Research.
Sartain, M., 2018. Microplastics and processing guidebook, Mississippi: Mississippi State
University.
Stolte, A., 2014. The detection of microplastics in beahc sediments, Rostock: Universität
rostock.
Van Cauwenberghe Lisbeth, D. L. F. R. J. C. R., 2015. Microplastics in sediments: A review
of techniques, occurence and efects. Marine environmental research, Volume 111, pp. 5-17.
Wagner, M. a. L. S., 2017. Freshwater Microplastics: Emerging threat contaminants. s.l.:s.n.
Wampler, T., 2014. Pyrolysis gas chromatography. Science direct.
Wright, S. e. a., 2013. The physical impact of microplastics on marine organisms: A review
enviromental pollution.. Elsevier, Volume 30, pp. 1-10.

40


