Existing approaches to costing, financing and estimating cost-efficiencies for nutrition February 2016
Meera Shekar Global Lead for Nutrition
1

Stunting Prevalence: 20 -30% 30-40% >40% 85% of stunting concentrated in 37 countries
2
Source: UNICEF, WHO, and World Bank. 2015.
Source: UNICEF, WHO, and World Bank. 2015.
Global Stunting Rates 159 million children stunted worldwide

3
Child Stunting Prevalence Global and regional trends, Children under 5 (1990-2014)
Source: UNICEF, WHO, and World Bank 2015.
EUROPE & CENTRAL ASIA
MIDDLE EAST & NORTH AFRICA
LATIN AMERICA & CARIBBEAN
EAST ASIA & PACIFIC
SUB-SAHARAN AFRICA
SOUTH ASIA
GLOBAL
0
20
40
60
1990 1995 2000 2005 2010 2014
Pre
vale
nce
,, (%
)
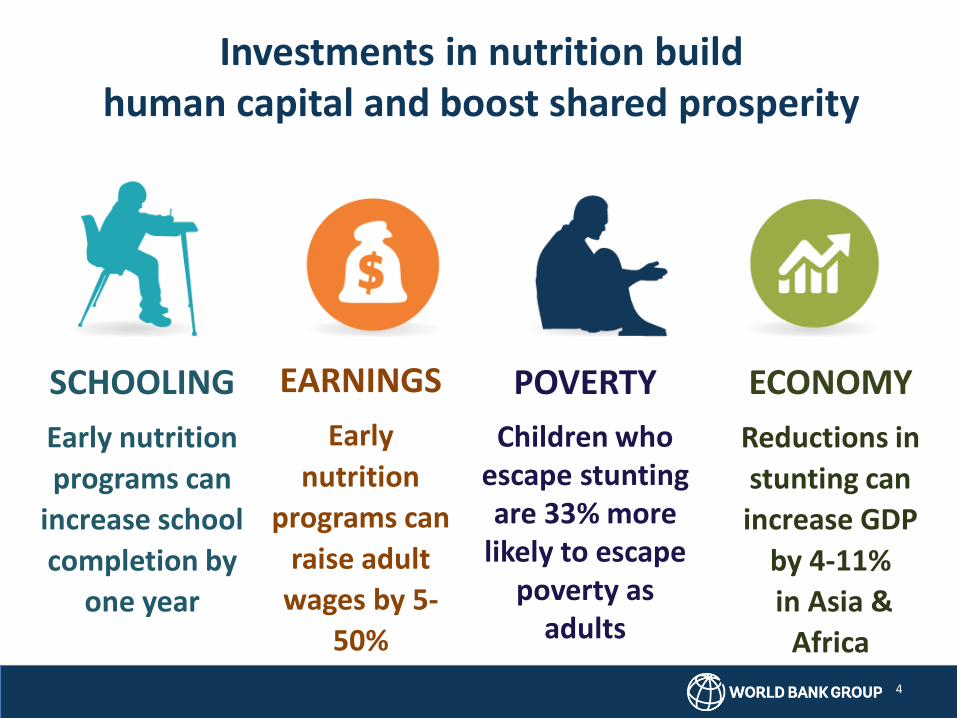
Investments in nutrition build human capital and boost shared prosperity
SCHOOLING
Early nutrition
programs can
increase school
completion by
one year
EARNINGS
Early
nutrition
programs can
raise adult
wages by 5-
50%
POVERTY
Children who escape stunting are 33% more
likely to escape poverty as
adults
ECONOMY
Reductions in
stunting can
increase GDP
by 4-11%
in Asia &
Africa
4

5 Source: Heckman & Masterov (2004)
Investments in First 1,000 Days
Have GREATEST IMPACT First 1,000 days is
tipping point for: • Childhood disease • Chronic disease • Cognitive deficits • Economic losses
Nutrition Investments in First 1000 Days lock-in human capital for life
Global Costs & Impact Estimates
6

7
Three global studies that estimate costs of Scaling-Up Nutrition interventions
Source: World Bank, forthcoming.
World Bank
2010
• Focus on estimating Costs, not impacts; covers all forms of undernutrition
• Includes interventions to address all forms of malnutrition
• Assumes going from current coverage to 90% in 1 year
• Addl cost to scale up: US$ 10.3 billion/yr
Bhutta et al.
2013
• Focus on estimating costs and some impact estimations for stunting
• Includes interventions to address all forms of malnutrition
• Assumes going from current coverage to 90% in 1 year
• Addl cost to scale up: US$ 9.6 billion/yr
World Bank
2016
• Focus on costs and impacts on 4 out of 6 SGD targets (stunting, anemia, exclusive BF, wasting)
• More realistic scale-up scenario: increasing current coverage to 90% over 10 yrs
• Declines in stunting over time are modelled, rather than assumed
• Addl cost to scale up: US$ 49.7 billion over 10 yrs

8
An affordable package of interventions to reduce stunting
• Improving nutrition for women during
pregnancy
• Improving infant and young child
feeding practices, including exclusive
breastfeeding for the first six months
• Improving child nutrition, including
micronutrient supplementation
• Improving policy coordination,
capacity and evaluation
ANNUAL ADDITIONAL
COST PER CHILD UNDER-5
$9.60
$42 billion additional financing for 37 highest burden
countries over 10 years
$49.7 billion additional
financing globally over ten years
Source: World Bank, forthcoming

$34.3 billion required for 2021-2025 $16.4 billion required for 2016-2020
~ 63 million fewer
children stunted in 2025†
Nutrition-specific interventions
*Includes food availability and diversity, women’s education and health and water, sanitation and hygiene. **Median estimate for a sample of 17 high burden countries as reported in Hoddinott, Alderman, Behrman, Haddad, & Horton (2013). The economic rationale for investing in nutrition. Maternal and Child Nutrition 9(Suppl. 2): 69-82. † Compared to 2015 baseline
159 m stunted
Underlying determinants of stunting*
$1 invested in stunting ≈ $18
economic returns**
~100m stunted by 40% by 2025
Total $49.7 billion over ten years
9
Estimated Costs & Impacts on Child Stunting
Source: World Bank, forthcoming

Estimating Costs & Impacts at country level
10

11
For the General Population: Iron fortification of staple foods Salt iodization
Breastfeeding counseling Complementary feeding education Iron and Folic Acid supplements
Vitamin A supplements Therapeutic zinc supplementation Micronutrient powders Deworming Public provision of complementary food Treatment of Severe Acute Malnutrition
10 Key Nutrition-specific Interventions that produce results

12
There is a wide range of government spending on nutrition-specific programs across 26 high-burden countries
28,29
19,42
9,83
5,64 3,88 3,68 3,15
2,92 2,29
0,83 0,78 0,78
0,66 0,65
0,53 0,44 0,29 0,29
0,28 0,25 0,24
0,14 0,09
Ban
glad
esh
Ind
on
esia
Bu
run
di
Nig
er
Ken
ya
Bra
zil
Paki
stan
Ph
ilip
pin
es
Tan
zan
ia
Uga
nd
a
Zam
bia
Mad
agas
car
Vie
tnam
Ben
in
Co
te d
’Ivo
ire
Nep
al
Eth
iop
ia
Mal
awi
Cam
bo
dia
DR
C
Gu
atem
ala
11.05
Sou
th A
fric
a
Mex
ico
Ind
ia
US$/child
Excludes spending on overweight and obesity control
Can we get more nutrition results for the money that is being spent?
Can we get more money for nutrition?
13
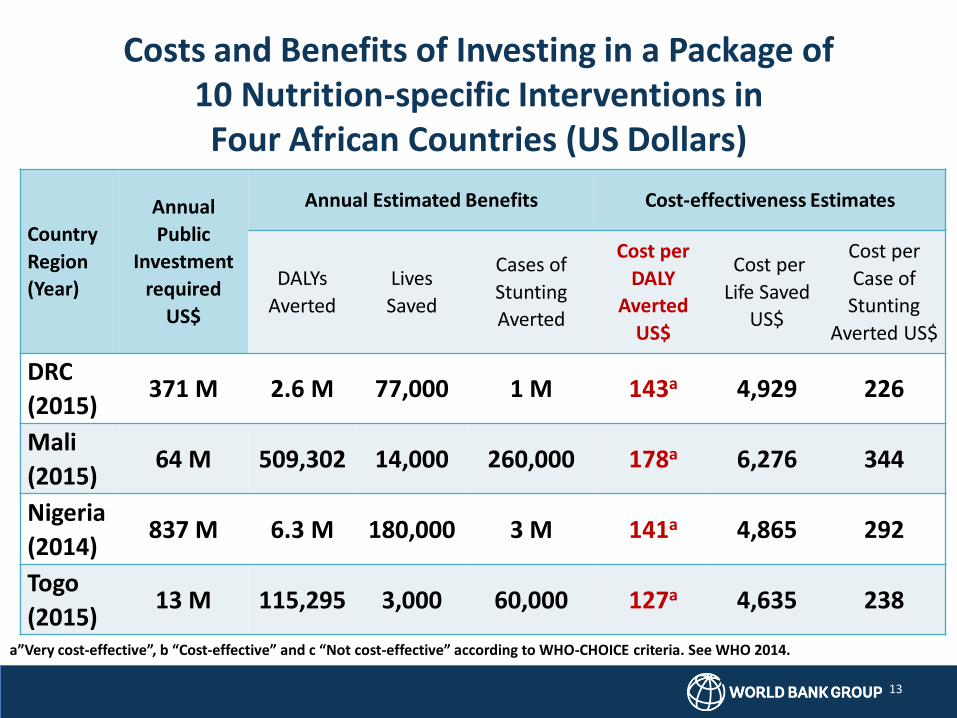
Costs and Benefits of Investing in a Package of 10 Nutrition-specific Interventions in Four African Countries (US Dollars)
Country
Region
(Year)
Annual
Public
Investment
required
US$
Annual Estimated Benefits Cost-effectiveness Estimates
DALYs
Averted
Lives
Saved
Cases of
Stunting
Averted
Cost per
DALY
Averted
US$
Cost per
Life Saved
US$
Cost per
Case of
Stunting
Averted US$
DRC
(2015) 371 M 2.6 M 77,000 1 M 143a 4,929 226
Mali
(2015) 64 M 509,302 14,000 260,000 178a 6,276 344
Nigeria
(2014) 837 M 6.3 M 180,000 3 M 141a 4,865 292
Togo
(2015) 13 M 115,295 3,000 60,000 127a 4,635 238
a”Very cost-effective”, b “Cost-effective” and c “Not cost-effective” according to WHO-CHOICE criteria. See WHO 2014.

a”Very cost-effective”, b “Cost-effective” and c “Not cost-effective” according to WHO-CHOICE criteria. See WHO 2014.
14
Maximizing Efficiencies: Some interventions are more cost-effective than others
Intervention*
Cost/DALY Averted
DRC
(2015)
Mali
(2015)
Nigeria
(2014)
Togo
(2015)
Community nutrition programs for
growth promotion 77a 49a 32a 40a
Vitamin A supplementation 43a 14a 50a 321 a Therapeutic zinc supplementation
with ORS 71a 41a 84a 59a
Iron-folic acid supplementation** 101a 95a 198 a 236a
Public provision of
complementary food for moderate
acute malnutrition 478 c 803 c 738 b 580 c
Community-based treatment of
severe acute malnutrition 174a 87a 172 a 47 a
15
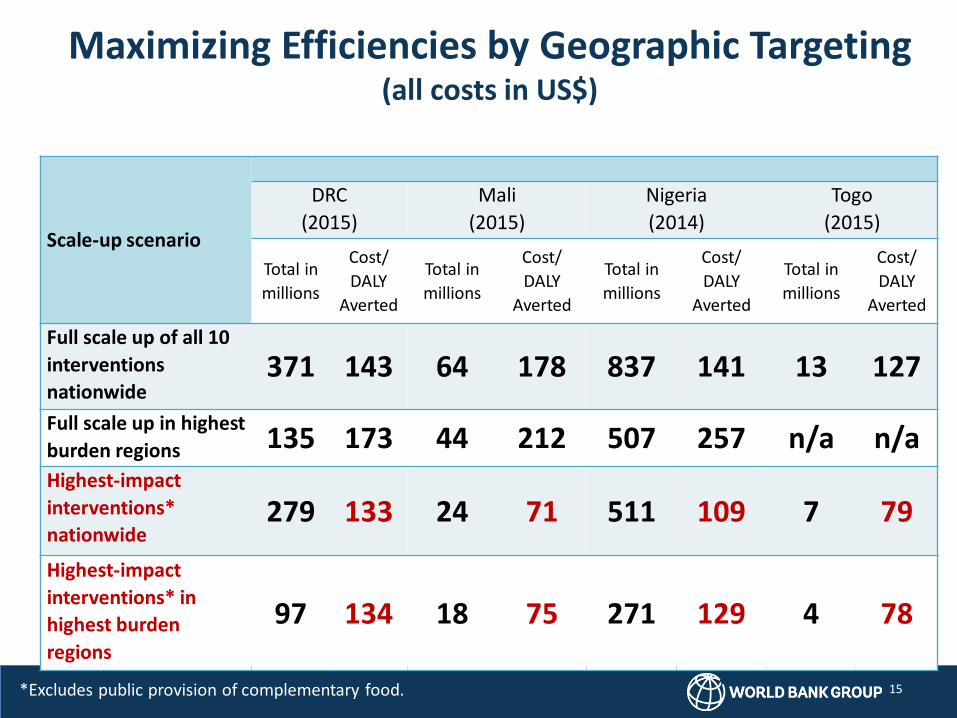
Maximizing Efficiencies by Geographic Targeting (all costs in US$)
Scale-up scenario
DRC
(2015)
Mali
(2015)
Nigeria
(2014)
Togo
(2015)
Total in
millions
Cost/
DALY
Averted
Total in
millions
Cost/
DALY
Averted
Total in
millions
Cost/
DALY
Averted
Total in
millions
Cost/
DALY
Averted
Full scale up of all 10
interventions
nationwide 371 143 64 178 837 141 13 127
Full scale up in highest
burden regions 135 173 44 212 507 257 n/a n/a Highest-impact
interventions*
nationwide 279 133 24 71 511 109 7 79
Highest-impact
interventions* in
highest burden
regions
97 134 18 75 271 129 4 78
*Excludes public provision of complementary food.

Existing Approaches to Modelling for nutrition
16

17
Existing tools to estimate costs, impacts and cost-effectiveness
• OneHealth
• LiST
• PROFILES
• FANTA CMAM costing tool
• WBCi Infant and Young Child Feeding (IYCF) financial planning tool
• UC Davis optimization tool for Vitamin A for allocative efficiencies

18
OneHealth
• Developed under guidance of UN Inter-Agency Working Group (IAWG) on Costing; launched in 2012.
• Build on/incorporates existing tools: MBB, WHO Stop TB, LiST, FamPlan, AIM/GOALs/Resource Needs Model, others. • Models costs and impacts
• Guiding principle: • Plan and cost holistically, from the health system perspective.
• Demonstrate possible impact resulting from the investments.
• Includes high impact nutrition interventions • Used to generate Lancet 2013 series cost estimates.
• Does not include prioritization/optimization functions.
Economic impacts
Health impacts Coverage Cost Optimization & prioritization

19
Lives Saved Tool (LiST)
• Models the impact of health intervention on maternal and child mortality and morbidity • Includes high impact, evidence-based nutrition interventions
• Outcomes include some key nutrition indicators: stunting and wasting (but no anemia, no overweight/BMI, no DALYs)
• No economic impact
• Includes a costing module (LiST Cost) – linked to/based on One Health
• No cost-effectiveness or benefit estimates
• Currently being revised (expected in mid 2016?)
Economic impact
Health impact Coverage Cost Optimization & prioritization

20
PROFILES • Developed by USAID and FHI 360 in the 1990s
• Intended as an advocacy tool – not for policy and program planning purposes
• Estimates health and economic impact of improving nutritional status of women and children • Health impact: maternal and child morality; permanent disability
• Economic impact: productivity gains
• Compares 2 scenarios: status quo and improved nutrition outcomes
• Improvements in nutrition outcomes are assumed - no link with specific interventions
Economic impact Health impact Coverage Cost Optimization & prioritization

21
FANTA CMAM Costing Tool
• Developed by USAID and FHI 360 in 2011
• Intended as a program planning and budgeting tool for community-based management of acute malnutrition (CMAM)
• No impact estimates
Economic impact
Health impact Coverage Cost Optimization & prioritization
22
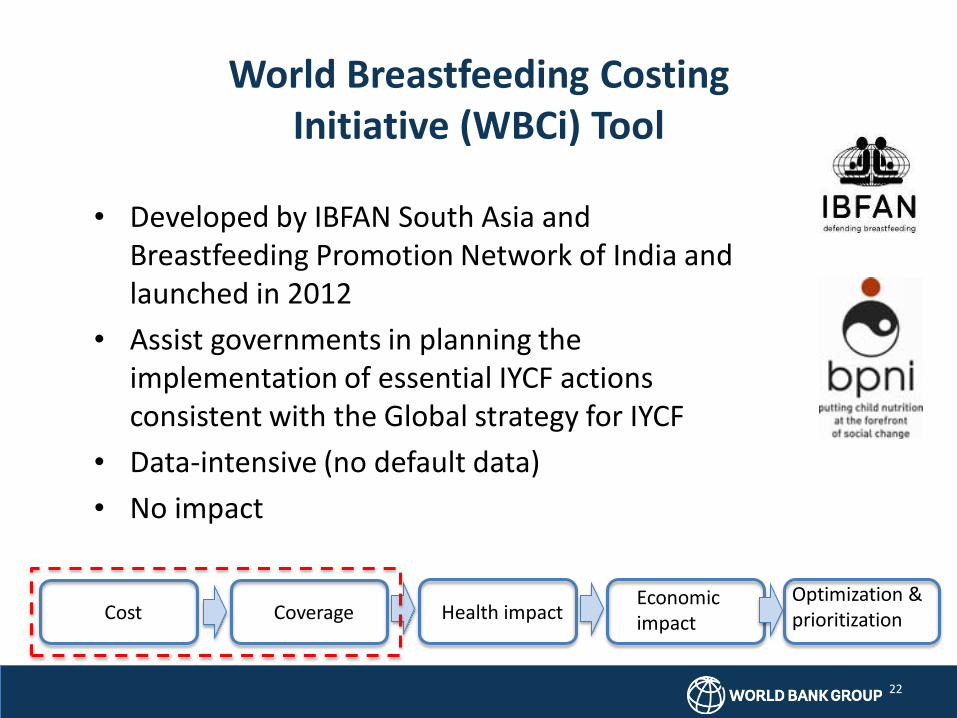
World Breastfeeding Costing Initiative (WBCi) Tool
• Developed by IBFAN South Asia and Breastfeeding Promotion Network of India and launched in 2012
• Assist governments in planning the implementation of essential IYCF actions consistent with the Global strategy for IYCF
• Data-intensive (no default data)
• No impact
Economic impact
Health impact Coverage Cost Optimization & prioritization
23
UC Davis Tool for Optimization of Vitamin A Supplementation
• Estimates allocative efficiencies for Vit A supplementation
• Limited to single micronutrient and single intervention (Vitamin A supplementation)
• Very data intensive; tested in one country (Cameroon) only
• Current version complex and not user-friendly and not usable by policy-makers

24
Existing Tools: Key Strengths and Weaknesses Tool Strengths Weaknesses
One Health
• Comprehensive planning and costing/budgeting tool
• Considers the health system • Integrates cost and impact
• Less useful for single program/issue • No efficiency analysis
LiST • Integrated RMCH and nutrition tool • Includes key high impact interventions (Lancet
2013) • Impact and cost: includes the LiST cost module
linked to One Health costing tool
• No DALYs • No cost-effectiveness analysis • No efficiency analysis
PROFILES • Estimates of health impact • Estimates of economic impact
• Impact of interventions is assumed (no explicit modelling)
• No links to cost • No effectiveness or efficiency analysis
FANTA CMAM tool
• Comprehensive costing tool - considers all major cost drivers in a standardized fashion
• Manageable data needs-wise • Excel-based and easy to use
• Single intervention • No impact • No effectiveness or efficiency analysis
WBCi costing tool
• Comprehensive list of EBF interventions • Excel-based and easy to use
• Single intervention • Data-intensive (no defaults) • No impact • No effectiveness or efficiency analysis
UC Davis Vit A tool
• Aims to optimize spending on Vitamin A supplementation

25
Next Steps in Nutrition costing, impact modeling and cost-effectiveness estimations
• Good understanding of approaches to estimate costs and impact • Strong evidence base of what works
• Currently no tools that allow for cost-effectiveness analyses or for allocative efficiency assessments (except UC Davis tool for Vit A)
• Stronger, user-friendly tools needed that combine assessments of
• costs, impacts, cost-benefit analyses
• maximize technical and allocative efficiency
• Can “Optima Nutrition” fill this gap?
More $ for nutrition More nutrition for the $


