Examining the Efficacy of Emoji Anchors for the O*NET Interest
Profiler Short Form
James Rounds, Wei Ming Jonathan Phan, Rachel Amrhein University of Illinois Urbana-Champaign
Phil Lewis National Center for O*NET Development
Prepared for
U.S. Department of Labor Employment and Training Administration
Office of Workforce Investment Division of National Programs, Tools, & Technical
Assistance Washington, DC
March 25, 2016
www.onetcenter.org
National Center for O*NET Development, Post Office Box 27625, Raleigh, NC, 27611
2
Table of Contents
Executive Summary ............................................................................................................ 4
Introduction ......................................................................................................................... 7
Background ......................................................................................................................... 7
Study 1: Selecting a Set of Emoji Anchors ......................................................................... 9
Study 1 Results ................................................................................................................. 10
Final Selection of Emoji Set ......................................................................................... 13
Study 2: Testing Equivalence of Scale Anchors with a Randomized Block Design ........ 19
Study 2 Results ................................................................................................................. 20
Reliability ...................................................................................................................... 20
High Point Code Stability ............................................................................................. 25
RIASEC Profile Stability .............................................................................................. 27
Doubly MANOVA (Repeated Measures Profile Analysis) ........................................... 27
Plotted Mean RIASEC Scale Scores............................................................................. 31
Structural Validity ......................................................................................................... 36
Summary ........................................................................................................................... 38
References ......................................................................................................................... 40
Appendix ........................................................................................................................... 42

3
List of Tables
Table 1. Emoji Set 1 Results…………………………………………………………………….14
Table 2. Emoji Set 2 Results………………………………………………………………….…15
Table 3. Emoji Set 3 Results………………………………………………………………….…16
Table 4. Emoji Set 4 Results………………………………………………………………….....17
Table 5. Emoji Set 5 Results…………………………………………………………………….18
Table 6. Block 1 (Traditional-Traditional) RIASEC Scale Correlations......................................21
Table 7. Block 2 (Emoji-Emoji) RIASEC Scale Correlations………………………………......22
Table 8. Block 3 (Traditional-Emoji) RIASEC Scale Correlations………………………….….23
Table 9. Block 4 (Emoji-Traditional) RIASEC Scale Correlations………………………….….24
Table 10. High Point Code Agreement and RIASEC Profile Correlations……………………...26
Table 11. Doubly MANOVA Results for Effects of RIASEC Scale, Time, and Block………....29
List of Figures
Figure 1. Block 1 (Traditional-Traditional) Mean Dimensions……………………………..…...32
Figure 2. Block 2 (Emoji-Emoji) Mean Dimensions…………………………………………….33
Figure 3. Block 3 (Traditional-Emoji) Mean Dimensions………………………………….....…34
Figure 4. Block 4 (Emoji-Traditional) Mean Dimensions…………………………….…………35
4
Executive Summary
This report summarizes two studies designed to test the validity of an emoji-anchored
Interest Profiler Short Form (Short-IP; Rounds, Su, Lewis & Rivkin, 2010). The Short-IP is a 60-
item inventory that assesses vocational interests according to Holland’s (1997) Realistic,
Investigative, Artistic, Social, Enterprising and Conventional (RIASEC) personality types.
Emojis are ideograms commonly used in text messaging and email platforms (e.g., Facebook,
Android text messaging, Gmail). These simple images most commonly depict faces expressing
different affective responses (e.g., smiley face). As O*NET explores the possibility of moving
the Short-IP onto a mobile platform, it is important to determine whether emojis can serve as
anchors in the response scale. Besides being compact and ideal for use on small screens,
similarly constructed “face rating scales” are often preferred by respondents (Champion et al.,
2010) and may even be more accurate at capturing affective responses in some populations
(Kunin, 1955; Izard, 2007; Lindquist, Barrett, Bliss-Moreau, & Russell, 2006).
Two studies were conducted to determine the efficacy of emoji-anchored Short-IP scales.
In the first study, we identified five sets of emojis that represented an array of affective responses
and had unrestricted use and licensing permission rights. A sample of 36 participants sorted the
emojis in these sets according to the traditional lexical categories (strongly dislike, dislike,
unsure, like, and strongly like). Based on the total percentage usage (portion of participants
sorting an emoji into a particular category) as well as the percentage of misclassifications, we
determined the set of emojis that would be used in study 2.
Study 2 used a randomized block design in which people completed two interest
inventories (separated by a filler task). 569 working adults were randomly assigned to one of
four blocks: (1) two traditionally anchored Short-IP scales, (2) two emoji anchored Short-IP

5
scales, (3) a traditional anchored scale followed by an emoji anchored scale, (4) and an emoji
anchored scale followed by a traditional scale. We assessed test-retest (pre-post) reliability and
found that emoji anchors were just as reliable as traditional anchors. We then tested whether
emoji scales would predict the same RIASEC high point codes as traditional anchors. The Kappa
index of agreement indicated substantial high-point code agreement between emoji and
traditional anchors, indicating emoji-anchored inventories produce the same high-point codes as
traditional inventories. We then tested the rank order stability of individuals’ entire RIASEC
interest profiles. The correlations between profiles across time for all four blocks were high (r ≥
.85). This provides evidence of substantial rank-order stability in RIASEC profiles regardless of
how the scale is anchored.
A doubly MANOVA was performed to rule out possible order (emoji or traditional) and
time (pre and post) effects on RIASEC scores by checking that proper randomization was
achieved in a four block experiment. Although there were significant main effects of RIASEC
scale and time, there was no three-way interaction between RIASEC scale, time, and block,
suggesting that scores did not differ as a function of time and block assignment (i.e.,
randomization was successful). Furthermore, there was no interaction between block and time,
suggesting that across blocks pre and post scores did not differ. Finally, there was no interaction
of RIASEC scores and blocks, suggesting that RIASEC scores across the different blocks do not
differ. These results suggest that means are very similar across all RIASEC scales regardless of
the anchors used and that no order effects influenced results.
The structural validity of RIASEC scores was examined via two analyses: the
randomization test (Rounds, Tracey, & Hubert, 1992) and circular unidimensional scaling
(Armstrong, Hubert, & Rounds, 2003). These analyses test whether resultant RIASEC scores had
6
inter-relationships that were characteristic of Holland’s vocational interest model (Holland,
1997). Results from these structural analyses demonstrated that RIASEC scores from the Interest
Profiler, using either traditional or emoji anchors, conformed well to the circular-ordered, inter-
relationships of interest scores expected in Holland’s model.
Altogether, these studies were able to identify a set of emoji anchors for use in the
Interest Profiler without compromising psychometric properties of the scale. We conclude that
researchers and practitioners can use an emoji-anchored interest inventory just as they would the
traditional inventories to measure vocational interests.
7
Introduction
This report presents the results of two studies intended to test the use of an emoji-
anchored scale for use in the O*NET Interest Profiler Short Form (Short-IP, Rounds, Su, Lewis
& Rivkin, 2010). An emoji-anchored scale uses ideograms symbolizing facial expressions for
each point on the response scale, rather than traditional text descriptions (e.g., “strongly like”).
Emojis have become widely recognized and are automatically incorporated into most
technological communication (e.g., text messaging keyboards on Apple and Android phones;
built-in options for expressing mood in Facebook statuses and Gmail communication). As such,
there may be advantages to using these widely recognized images, rather than lexical
descriptions, to indicate affect towards interest items on the Short-IP. This report presents results
from two studies that provide evidence supporting the use of an emoji anchor scale. Study 1 used
substantive validity techniques to determine which version of emojis should be used as anchors
among several non-licensed options available. Study 2 implemented the set of anchors selected
in Study 1 within a randomized block design to provide evidence that an emoji-anchored Short-
IP is psychometrically equivalent to a traditionally anchored Short-IP.
Background
Emojis are ideograms used in electronic communication that symbolize an idea in a
single, simple image. While emojis come in many varieties, the most commonly used and
recognized are emojis that resemble faces and express different emotions (Novak, Smailovic,
Sluban, & Mozetic, 2015). There are several reasons to explore the use of emoji anchors as an
alternative to traditional lexical anchors, particularly in interest inventories. First, their
widespread use in modern technology across the globe makes them ideal for transitioning the
Short-IP to a more mobile platform. Emojis are already used in virtually every messaging
application, as well as Facebook and Google applications. These succinct images can easily be
8
applied to interest inventories so that they are easily viewed on small-scale screens, such as
mobile phones and tablets, while still maintaining the meaning of the response options in a clear
and visually appealing way. Second, there may actually be some advantages to using a visual
rather than lexical approach to measuring attitudes. Previous research has shown that participants
often prefer using scales that are anchored with depictions of faces rather than text descriptions
of affect or attitudes (Champion et al., 2000). Furthermore, images may actually be better at
capturing feelings than words, as affective responses are often “lost in translation” when
participants have to translate their responses into language and then locate the corresponding
option on the response scale (Kunin, 1955).
Emojis (and their similarly constructed predecessors called “emoticons”) can serve the
same role in electronic communication as non-verbal facial expressions do in face-to-face
communication (Derks, Bos & Grumbkow, 2007), suggesting that people easily associate
affective social and emotional responses with these graphical representations. The limitation of
traditional lexical anchors in accurately capturing felt emotions and affective attitudes is
especially relevant to special populations who may have poor language skills or emotion
regulation (Champion et al., 2000; Wong & Baker, 1988). Humans develop the ability to
recognize emotions in the self and in others’ facial expressions before they are able to articulate
these emotions (Izard, 2007; Lindquist, Barrett, Bliss-Moreau, & Russell, 2006). As such, when
people are able to identify and relate to affect expressed in facial expressions, fewer cognitive
resources are used than when they have to translate those emotions in words. Furthermore,
sentiment analyses of the content on Twitter demonstrate that emojis succinctly reflect feelings
and attitudes expressed in language using less space (Novak, Smailovic, Sluban & Mozetic,
2016). Therefore, an emoji-anchored scale could make the Short-IP both more accessible and
appealing to users.

9
Study 1: Selecting a Set of Emoji Anchors
Seemingly intuitive, selecting a set of emojis to represent a continuum, presents a number
of problems. Emojis are typically designed to depict a set of discrete emotions rather than
gradations of affect. This raises two issues regarding which emojis to select as a basis for a
bipolar continuum. First, how should we properly differentiate between adjacent anchors? If, for
example, a smiling emoji depicts “like,” which emoji should denote greater intensity (i.e.,
“strongly like”)? There are many features of an emoji that can be used to indicate a greater level
of interest: a wider smile, a change of eyes into ‘hearts,’ or even a change in color. Second, given
that people disproportionately use emojis displaying positive emotions (happiness, excitement)
(Novak et al., 2015), do the sets of available emojis have images that adequately capture negative
emotions as they relate to lack of vocational interest? Negative affect is more ambiguous and
varied than positive affect. A number of discrete emotions can be semantically linked to the word
‘dislike’: anger, anxiety, disgust, and boredom (Russell & Barrett, 1999; Watson & Tellegen,
1985). As such we need to determine which negative emoji best depicts disliking a task on an
interest inventory.
To empirically answer these questions, we identified five different sets of public domain
emojis to be evaluated. We employed a substantive validity approach to test which (if any) sets
of emojis were most consistent with the traditional lexical labels on the Short-IP scale. All
emojis were sorted by subject matter experts to remove faces that displayed irrelevant emotions
or actions (e.g., emoji blowing kisses). This review resulted in 12-15 emojis per set. For the
licensure details of each set, see Appendix I.
The survey was administered electronically and embedded in a survey about expected job
satisfaction that was administered to a group of college students in the United States. Participants

10
were asked to choose and sort up to two emojis that they thought best represented the definition
of five categories: strongly like, like, unsure, dislike, and strongly dislike. 56 participants
completed the survey. We did not include participants that identified themselves as international
students to limit any confounding effects of culture on emotion recognition and interpretation
(Markus & Kitayama, 1991), resulting in a final sample size of 36 students. This sample size is
consistent with recommendations suggested for substantive validity sorting tasks (Anderson &
Gerbing, 1991). The sample was 44% male, had a mean age of 19.58 years, and was ethnically
diverse (45% White; 19% Hispanic; 19% African American; 14% Asian).
To analyze the data, we first calculated an overall usage percentage. This percentage is
defined as the percentage of participants that selected a given emoji for sorting. This statistic
quantifies the popularity of each emoji in general, given that a maximum of two emojis could be
sorted into each of the five categories. The frequencies each emoji was sorted into a category
was converted into two percentages: a) percent (total): a ratio between the frequency an emoji
was sorted into a category to the total participants (N = 36) and; b) percent (usage): a ratio
between the frequency an emoji was sorted into categories to the number of participants who
selected and sorted that particular emoji. To measure central tendency we used the mode. Based
on the usage, percent (usage), and mode, one emoji that best corresponded to the traditional
anchor label was selected.
Study 1 Results
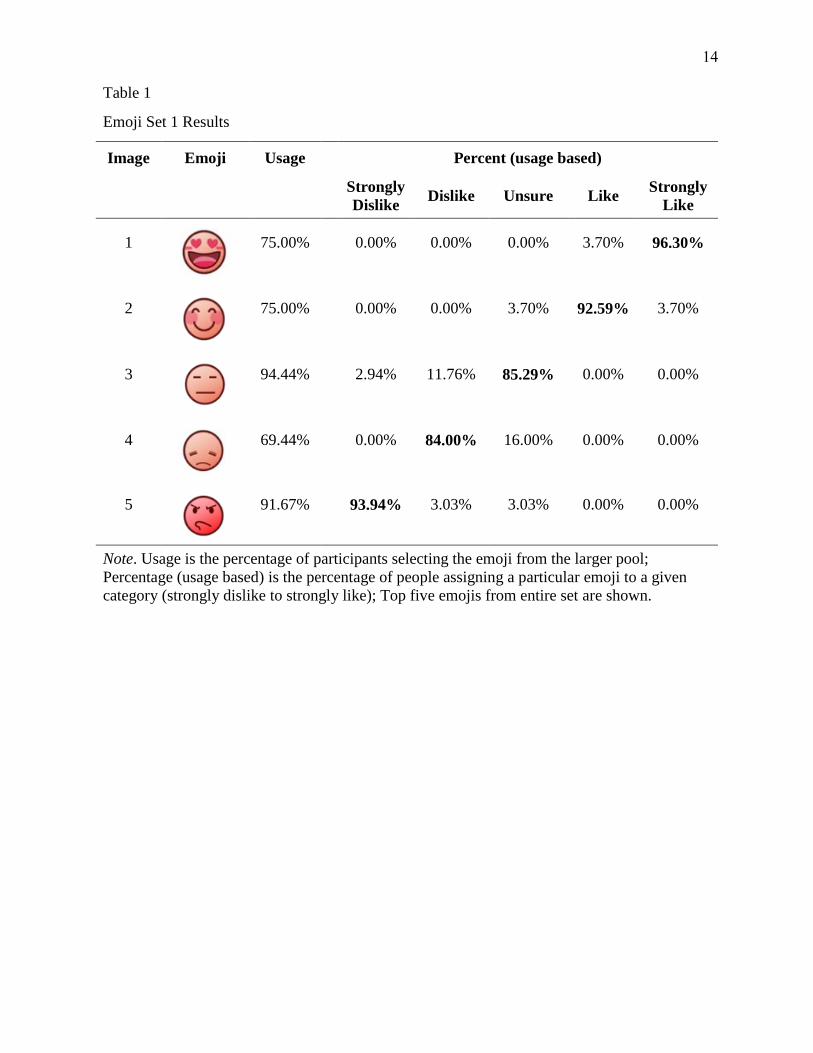
Tables 1-5 show the results for emojis in each of the five sets that were most consistent
with the traditional scale categories. Modes are indicated in bold. The five best emojis for each
category from Emoji Set 1 had high percent (usage) across all emojis, suggesting that when an
emoji was selected, it was generally because its meaning was unambiguous and that it typically
11
was sorted into the same category across all participants. However, Emoji Image 3 and 4 for the
categories “unsure” and “dislike” had relatively lower usage (86% and 84%) compared to other
emojis within the same set. That is, although 86% of participants choosing emoji 3 categorized it
into “like,” nearly 12% reported it best represented “dislike” and nearly 3% reported it
represented “strongly dislike.” Although Emoji Image 4 was only sorted into one of two
categories, a sizeable 16% of participants reported the emoji represented a neutral “unsure”
category rather than a negative “dislike.”
The second set of emojis (shown in Table 2) generally had high percent (usage), but
emoji 2 was only categorized as “like” by 78% of the participants. Since 22% of the participants
categorized emoji 2 into “strongly agree,” these faces do not appear to clearly distinguish
between the five categories as well as the traditional labels.
Set 3 also has high percent (usage) for each emoji. This set also has the least amount of
ambiguity in categorization. Table 3 presents the top seven emojis in this set according to usage.
There were two emojis that were frequently sorted into the “like” (emoji image 2 and 2*) and
“strongly dislike” (emoji image 5 and 5*) categories. For completeness, all seven emojis are
presented in Table 3. Although 2* and 5* had slightly higher usage statistics, both sets (2 and 2*
and 5 and 5*) showed reasonably high usage rates and correct categorization. Given that the
inventory scale as a whole is meant to be bipolar, it was necessary to ensure that emojis
representing opposite poles (i.e., like and dislike) differed only in the affective expression
displayed and not in other characteristics of the picture. Since the shape of the eyes and mouth in
2* are visually inconsistent with the single emoji selected for “like” it was determined that image
2 should be retained in favor of 2*. Having 2 and 4 representing “like” and “dislike” being
similar in all but the valence of their emotion creates a response scale that signals bipolarity. It is
12
important that participants interpret the responses as being a bipolar continuum, rather than
representing five separate reactions. It was also important to select emojis that show clear
distinctions between categories. Although 5* has higher overall usage than emoji 5, emoji 5 is
much more distinct from emoji 4 (4 and 5 differ only slightly in the shape of the eyes).
Unsurprisingly, emoji 5* has more misclassifications than 5 (12% versus 5%). For these reasons,
we retained 2 and 5. Using these emojis maintains the validity of Set 3 without potentially
creating a non-bipolar scale or creating too much similarity between emojis representing adjacent
categories.
Set 4 resulted in categorization comparable to the other sets, but had two faces (image 2
and 4) that had overall low usage (75% and 61%). The low usage indicates that respondents
disagreed on which emojis from the set best captures the “like” and “dislike” responses. This
result suggests that the images are not the best depictions of these categories. Additionally, the
face most commonly categorized as “strongly dislike” is a different color than the other images
(red rather than yellow), which could potentially create response biases in which participants are
either more attracted to or more avoidant of this emoji.
Set 5 showed similar patterns to Set 4 in that there was a reasonably low rate of
disagreement in the categorization of the emoji based on percent (usage), but low overall usage
rates for the most popular emojis. In other words, participants were consistent in categorizing the
emojis, but were inconsistent in selecting the same emojis from the large pool to represent the
categories. This poses a similar problem to Set 4 and suggests that these images may not be the
best representation of the strongly dislike to strongly like anchors.

13
Final Selection of Emoji Set
Selecting a final set of emojis required balancing four criteria: (1) flexibility in licensing
and legal usage that would allow us to adapt the images for our use in the Short-IP; (2) high
selection rate of each image within the set (usage); (3) consistent categorization of each emoji
into a single response label (percent usage); and (4) a set of emojis that holistically represent a
bipolar continuum. Using the top 5 emojis from Set 3 (dropping 2* and 5*) provides us with a
set of emoji anchors that best corresponded to the traditional lexical labels (i.e., “strongly
dislike” to “strongly like”), while also providing consistently high overall selection rates. Set 3
provides a set of anchors that were not only frequently chosen from a greater pool of emojis to
represent the traditional labels, but also demonstrated low frequency of misclassification. Aside
from the desirable results obtained from this substantive validity study, we also verified that
these emojis are non-licensed and can be easily adapted for use in the Short-IP without any legal
restrictions or copyright limitations. For these reasons, we chose the emojis in Set 3 to serve as
anchors for the Short-IP in subsequent analyses.
14
Table 1
Emoji Set 1 Results
Image Emoji Usage Percent (usage based)
Strongly
Dislike Dislike Unsure Like
Strongly
Like
1
75.00% 0.00% 0.00% 0.00% 3.70% 96.30%
2
75.00% 0.00% 0.00% 3.70% 92.59% 3.70%
3
94.44% 2.94% 11.76% 85.29% 0.00% 0.00%
4
69.44% 0.00% 84.00% 16.00% 0.00% 0.00%
5
91.67% 93.94% 3.03% 3.03% 0.00% 0.00%
Note. Usage is the percentage of participants selecting the emoji from the larger pool;
Percentage (usage based) is the percentage of people assigning a particular emoji to a given
category (strongly dislike to strongly like); Top five emojis from entire set are shown.

15
Table 2
Emoji Set 2 Results
Image Emoji Usage Percent (usage based)
Strongly
Dislike
Dislike Unsure Like
Strongly
Like
1
75.00% 0.00% 0.00% 0.00% 0.00% 100.00%
2
88.89% 0.00% 0.00% 0.00% 78.13% 21.88%
3
72.22% 3.85% 0.00% 96.15% 0.00% 0.00%
4
83.33% 10.00% 90.00% 0.00% 0.00% 0.00%
5
88.89% 96.88% 3.13% 0.00% 0.00% 0.00%
Note. Usage is the percentage of participants selecting the emoji from the larger pool;
Percentage (usage based) is the percentage of people assigning a particular emoji to a given
category (strongly dislike to strongly like); Top five emojis from entire set are shown.

16
Table 3
Emoji Set 3 Results
Image Emoji Usage Percent (usage based)
Strongly
Dislike Dislike Unsure Like
Strongly
Like
1
91.67% 0.00% 0.00% 0.00% 0.00% 100.00%
2
72.22% 0.00% 0.00% 0.00% 92.31% 7.69%
2*
86.11% 0.00% 0.00% 0.00% 96.77% 3.23%
3
91.67% 0.00% 0.00% 96.97% 3.03% 0.00%
4
77.78% 0.00% 89.29% 10.71% 0.00% 0.00%
5
55.56% 95.00% 5.00% 0.00% 0.00% 0.00%
5*
69.44% 88.00% 12.00% 0.00% 0.00% 0.00%
Note. Usage is the percentage of participants selecting the emoji from the larger pool;
Percentage (usage based) is the percentage of people assigning a particular emoji to a given
category (strongly dislike to strongly like); Top seven emojis from the set are shown.

17
Table 4
Emoji Set 4 Results
Image Emoji Usage Percent (usage based)
Strongly
Dislike Dislike Unsure Like
Strongly
Like
1
86.11% 0.00% 0.00% 0.00% 0.00% 100.00%
2
75.00% 0.00% 0.00% 11.11% 85.19% 3.70%
3
86.11% 0.00% 6.45% 93.55% 0.00% 0.00%
4
61.11% 0.00% 86.36% 13.64% 0.00% 0.00%
5
94.44% 100.00% 0.00% 0.00% 0.00% 0.00%
Note. Usage is the percentage of participants selecting the emoji from the larger pool;
Percentage (usage based) is the percentage of people assigning a particular emoji to a given
category (strongly dislike to strongly like); Top five emojis from entire set are shown.

18
Table 5
Emoji Set 5 Results
Image Emoji Usage Percent (usage based)
Strongly
Dislike Dislike Unsure Like
Strongly
Like
1
72.22% 0.00% 0.00% 0.00% 0.00% 100.00%
2
72.22% 0.00% 0.00% 0.00% 100.00% 3.85%
3
77.78% 0.00% 3.57% 96.43% 0.00% 0.00%
4
83.33% 0.00% 100.00% 0.00% 0.00% 0.00%
5
61.11% 95.45% 4.55% 0.00% 0.00% 0.00%
Note. Usage is the percentage of participants selecting the emoji from the larger pool;
Percentage (usage based) is the percentage of people assigning a particular emoji to a given
category (strongly dislike to strongly like); Top five emojis from entire set are shown.
19
Study 2: Testing Equivalence of Scale Anchors with a Randomized Block Design
To test the equivalence of using emojis rather than lexical labels for the response scale in
the Short-IP, we employed a randomized four-block design. Participants were adults from the
United States who participated in an online survey administered through Amazon’s Mechanical
Turk platform. Six hundred participants were each paid a nominal fee to complete a 40-minute
study about occupations and work tasks. Several quality assurance items were embedded in the
study. These items required participants to read the question text and identify a correct response
based on the information clearly provided. Participants failing at least one of the quality
assurance items were removed from the dataset, resulting in a final sample size of 569. The final
sample was 55% male, averaged 33.7 years of age, and was employed an average of 38 hours per
week. The majority of the sample had completed at least some college (87%) with nearly half
earning a Bachelor’s degree (47%). The majority of participants identified as White/Caucasian
(75%), but the sample also included participants identifying as Asian (9%), African
American/Black (7%), and Hispanic (5%). As the Short-IP was developed with American users
in mind, only people with internet protocol addresses based in the United States were permitted
to participate. Ninety-five percent of the sample indicated that they were born in the United
States and the average length of time spent living in the United States was about 33 years
(similar to the average age of the sample). Given that emoji anchors may be used to assess
vocational interests on mobile devices, we wanted to ensure that we had a wide range of ages and
that we sampled participants from older generations as well as young adult populations. The ages
in our sample range from 20 to 85 years old with 8.5% over the age of 50.
Participants were randomly assigned one of four blocks. In each block, participants first
completed an interest inventory (Short-IP items), followed by a filler task about job satisfaction
of hypothetical occupations, and finally a second interest inventory (Short-IP items). The
20
assigned blocks determined the scale anchors of each interest inventory: Block 1 completed two
traditional-anchored inventories, Block 2 completed two emoji-anchored inventories, Block 3
completed a traditional-anchored inventory followed by an emoji-anchored inventory, and Block
4 completed an emoji-anchored inventory followed by a traditional-anchored inventory. This
design allowed us to compare inventory scores for each type of anchor within the same
participant while also controlling for order effects that might result from participants taking two
interest inventories within a short time span.
Study 2 Results
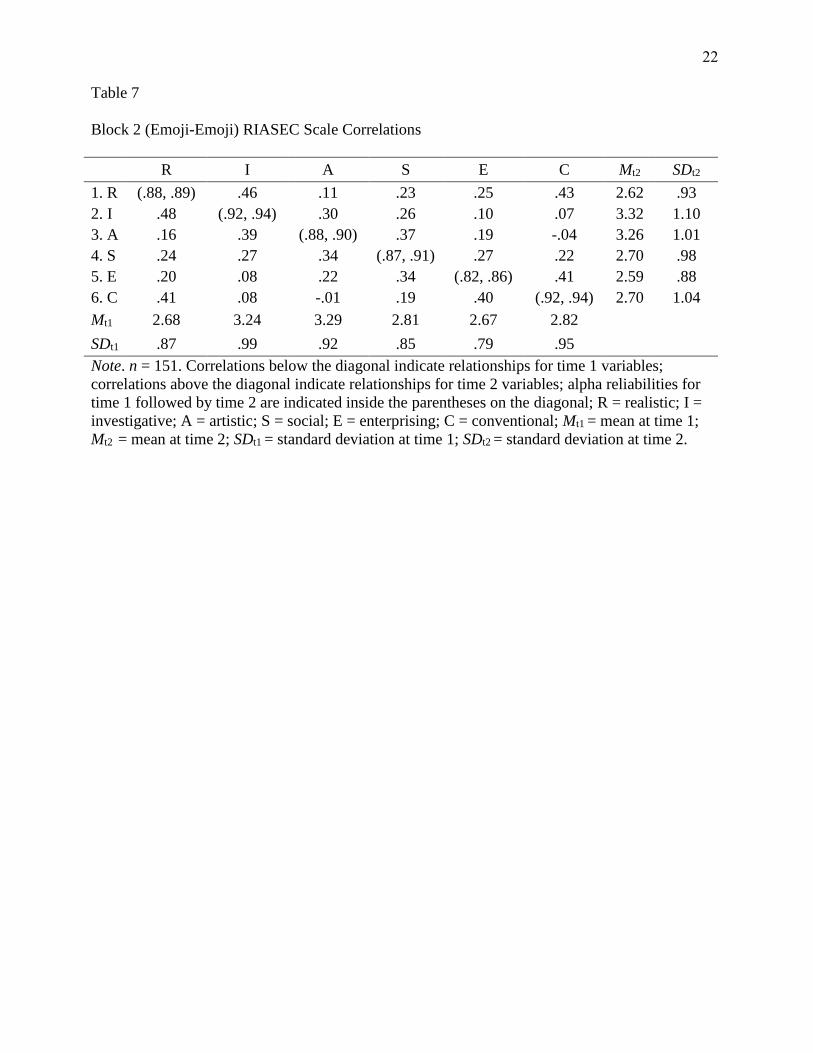
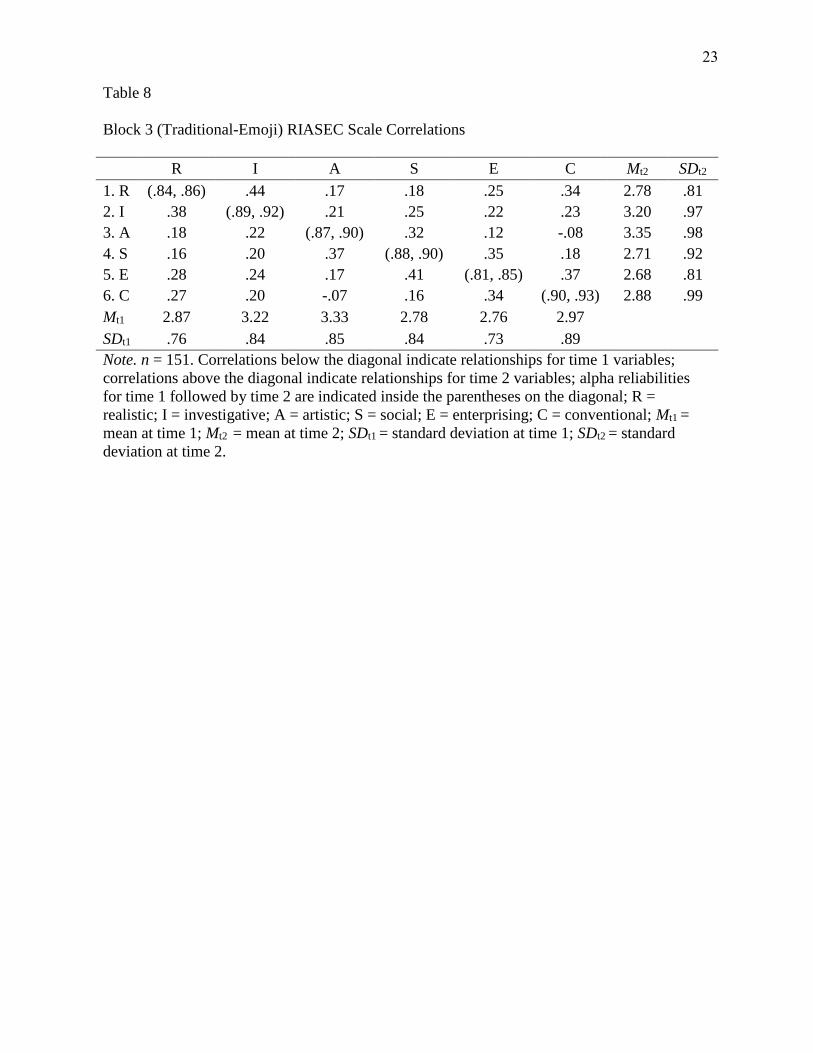
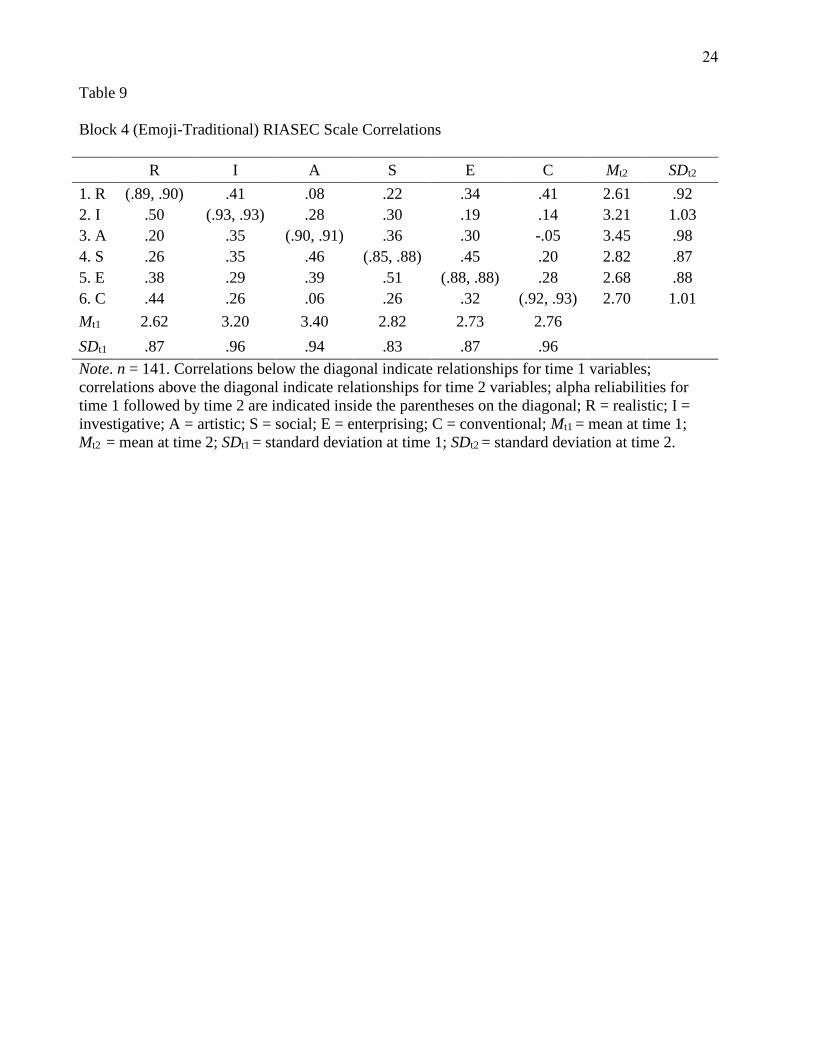
Reliability
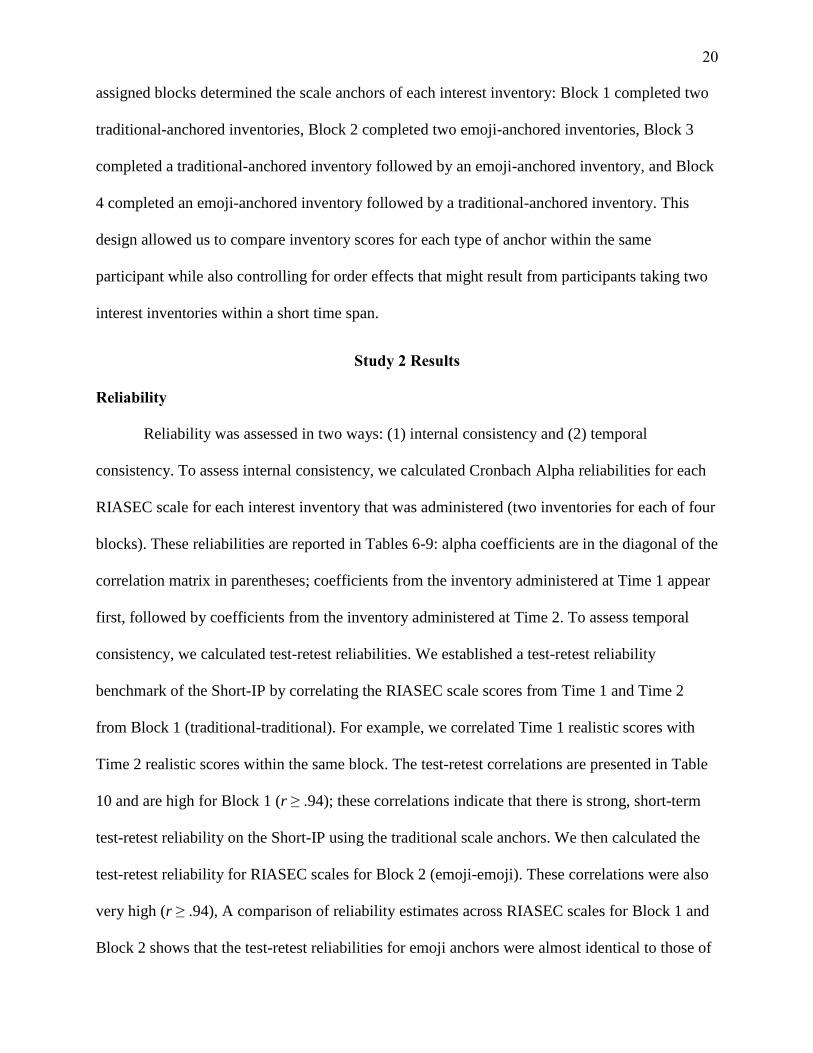
Reliability was assessed in two ways: (1) internal consistency and (2) temporal
consistency. To assess internal consistency, we calculated Cronbach Alpha reliabilities for each
RIASEC scale for each interest inventory that was administered (two inventories for each of four
blocks). These reliabilities are reported in Tables 6-9: alpha coefficients are in the diagonal of the
correlation matrix in parentheses; coefficients from the inventory administered at Time 1 appear
first, followed by coefficients from the inventory administered at Time 2. To assess temporal
consistency, we calculated test-retest reliabilities. We established a test-retest reliability
benchmark of the Short-IP by correlating the RIASEC scale scores from Time 1 and Time 2
from Block 1 (traditional-traditional). For example, we correlated Time 1 realistic scores with
Time 2 realistic scores within the same block. The test-retest correlations are presented in Table
10 and are high for Block 1 (r ≥ .94); these correlations indicate that there is strong, short-term
test-retest reliability on the Short-IP using the traditional scale anchors. We then calculated the
test-retest reliability for RIASEC scales for Block 2 (emoji-emoji). These correlations were also
very high (r ≥ .94), A comparison of reliability estimates across RIASEC scales for Block 1 and
Block 2 shows that the test-retest reliabilities for emoji anchors were almost identical to those of
21
traditional anchors. Furthermore, the test-retest reliabilities for Blocks 3 and 4 show similar
patterns that indicate high test-retest reliability regardless of the order in which scales appear for
participants who responded to both emoji and traditional inventories. Altogether, these data
provide evidence for the equivalence of emoji anchor reliability to traditional anchor reliability.
Table 6
Block 1 (Traditional-Traditional) RIASEC Scale Correlations
R I A S E C Mt2 SDt2
1. R (.89, 89) .47 .12 .10 .23 .46 2.73 .97
2. I .51 (.89, .93) .29 .42 .22 .11 3.23 1.03
3. A .16 .36 (.88, .89) .40 .00 -.18 3.36 .95
4. S .18 .50 .40 (.87, .90) .40 .02 2.88 .99
5. E .24 .24 .04 .46 (.84, .87) .33 2.76 .87
6. C .44 .21 -.14 .07 .32 (.92, .94) 2.93 1.08
Mt1 2.80 3.22 3.35 2.91 2.80 3.03
SDt1 .92 .94 .91 .88 .81 .98
Note. n = 159. Correlations below the diagonal indicate relationships for time 1 variables;
correlations above the diagonal indicate relationships for time 2 variables; alpha reliabilities for
time 1 followed by time 2 are indicated inside the parentheses on the diagonal; R = realistic; I =
investigative; A = artistic; S = social; E = enterprising; C = conventional; Mt1 = mean at time 1;
Mt2 = mean at time 2; SDt1 = standard deviation at time 1; SDt2 = standard deviation at time 2.
22
Table 7
Block 2 (Emoji-Emoji) RIASEC Scale Correlations
R I A S E C Mt2 SDt2
1. R (.88, .89) .46 .11 .23 .25 .43 2.62 .93
2. I .48 (.92, .94) .30 .26 .10 .07 3.32 1.10
3. A .16 .39 (.88, .90) .37 .19 -.04 3.26 1.01
4. S .24 .27 .34 (.87, .91) .27 .22 2.70 .98
5. E .20 .08 .22 .34 (.82, .86) .41 2.59 .88
6. C .41 .08 -.01 .19 .40 (.92, .94) 2.70 1.04
Mt1 2.68 3.24 3.29 2.81 2.67 2.82
SDt1 .87 .99 .92 .85 .79 .95
Note. n = 151. Correlations below the diagonal indicate relationships for time 1 variables;
correlations above the diagonal indicate relationships for time 2 variables; alpha reliabilities for
time 1 followed by time 2 are indicated inside the parentheses on the diagonal; R = realistic; I =
investigative; A = artistic; S = social; E = enterprising; C = conventional; Mt1 = mean at time 1;
Mt2 = mean at time 2; SDt1 = standard deviation at time 1; SDt2 = standard deviation at time 2.
23
Table 8
Block 3 (Traditional-Emoji) RIASEC Scale Correlations
R I A S E C Mt2 SDt2
1. R (.84, .86) .44 .17 .18 .25 .34 2.78 .81
2. I .38 (.89, .92) .21 .25 .22 .23 3.20 .97
3. A .18 .22 (.87, .90) .32 .12 -.08 3.35 .98
4. S .16 .20 .37 (.88, .90) .35 .18 2.71 .92
5. E .28 .24 .17 .41 (.81, .85) .37 2.68 .81
6. C .27 .20 -.07 .16 .34 (.90, .93) 2.88 .99
Mt1 2.87 3.22 3.33 2.78 2.76 2.97
SDt1 .76 .84 .85 .84 .73 .89
Note. n = 151. Correlations below the diagonal indicate relationships for time 1 variables;
correlations above the diagonal indicate relationships for time 2 variables; alpha reliabilities
for time 1 followed by time 2 are indicated inside the parentheses on the diagonal; R =
realistic; I = investigative; A = artistic; S = social; E = enterprising; C = conventional; Mt1 =
mean at time 1; Mt2 = mean at time 2; SDt1 = standard deviation at time 1; SDt2 = standard
deviation at time 2.
24
Table 9
Block 4 (Emoji-Traditional) RIASEC Scale Correlations
R I A S E C Mt2 SDt2
1. R (.89, .90) .41 .08 .22 .34 .41 2.61 .92
2. I .50 (.93, .93) .28 .30 .19 .14 3.21 1.03
3. A .20 .35 (.90, .91) .36 .30 -.05 3.45 .98
4. S .26 .35 .46 (.85, .88) .45 .20 2.82 .87
5. E .38 .29 .39 .51 (.88, .88) .28 2.68 .88
6. C .44 .26 .06 .26 .32 (.92, .93) 2.70 1.01
Mt1 2.62 3.20 3.40 2.82 2.73 2.76
SDt1 .87 .96 .94 .83 .87 .96
Note. n = 141. Correlations below the diagonal indicate relationships for time 1 variables;
correlations above the diagonal indicate relationships for time 2 variables; alpha reliabilities for
time 1 followed by time 2 are indicated inside the parentheses on the diagonal; R = realistic; I =
investigative; A = artistic; S = social; E = enterprising; C = conventional; Mt1 = mean at time 1;
Mt2 = mean at time 2; SDt1 = standard deviation at time 1; SDt2 = standard deviation at time 2.

25
High Point Code Stability
A common way to report RIASEC interest inventory scores is to identify an individual’s
High Point Code (HPC). An individual’s HPC is the highest scale score among the six RIASEC
scales. HPC is important for individuals who may be using the Short-IP in conjunction with
O*NET to identify potential career paths. These users will primarily be interested in which
RIASEC scale they scored highest on. Additionally, several fit indices that map RIASEC
interests to occupations rely on weighting of HPCs (see Brown & Gore, 1994). Thus, it is
important to ensure that an emoji-anchored scale will result in the same HPCs as a traditional
scale.
To assess consistency in HPC, we calculated a Cohen’s Kappa agreement index between
all HPCs at Time 1 and Time 2 for each block (shown in Table 10). We used Block 1
(traditional-traditional) as a baseline benchmark. Block 1 Kappa agreement was .62. Although
there are no set cut-off scores for Cohen’s Kappa, values between .60 and .80 are generally
considered to indicate high agreement (Landis & Koch, 1977). All other blocks demonstrated
even greater Kappa coefficients. Block 2 (emoji-emoji) Kappa of .74 is within range of “high
agreement.” The emoji anchors result in more stable HPCs compared to traditional anchors.
Blocks 3 (Kappa = .69) and Block 4 (Kappa = .67) show that there is also a high level of HPC
agreement across inventories using different anchors.

26
Table 10
High Point Code Agreement (Kappa), RIASEC Profile Correlations (r), and Test-Retest
Correlations by RIASEC Scale
Block n Anchor Kappa r Test- Retest correlations
Time 1 Time 2 R I A S E C
1 149 Traditional Traditional .62 .85 .96 .94 .96 .95 .94 .96
2 144 Emoji Emoji .74 .93 .96 .95 .94 .95 .95 .94
3 151 Traditional Emoji .69 .89 .91 .91 .94 .93 .93 .92
4 133 Emoji Traditional .67 .91 .95 .97 .95 .95 .96 .96
Note. Kappa = agreement between High Point Code between time 1 and time 2; r = profile
correlation between time 1 and time 2 RIASEC scores; R = Realistic; I = Investigative; A =
Artistic; S = Social; E = Enterprising; C = Conventional.
27
RIASEC Profile Stability
High Point Code (HPC) is an important method to assess the stability of interest
inventory results. Another approach is to compare an individual’s RIASEC profile across two
time points. Profile stability is often more informative for predicting important outcomes and
matching people to particular occupations. To link RIASEC interests to occupations, the O*NET
matches an individual’s RIASEC profile with Occupation Interest Profiles (Kroustalis, Lewis, &
Rivkin, 2010). Therefore, we compared the stability of an emoji-anchored RIASEC profile to a
traditional-anchored RIASEC profile. Additionally, we wanted to ensure that the emoji-anchored
scale resulted in the same RIASEC profile across time. To evaluate the profile stability, we
calculated RIASEC profile correlations between Time 1 and Time 2 for each block (see Table
10, column r). Block 1 (traditional-traditional) provided a baseline with which to benchmark the
other blocks. All profile correlations were very high relative to the baseline (r = .85), suggesting
high stability in RIASEC profile across blocks. Moreover, when participants completed one of
each of the inventories, the rank-order stability remained very high. Block 3 (traditional-emoji; r
= .89) and Block 4 (emoji-traditional; r = .91) were both greater than the baseline (r = .85).
Moreover, Block 2 (emoji-emoji) had a slightly higher profile correlation from Time 1 to Time 2
(r = .93) compared to Block 1 (traditional-traditional; r = .85). This indicates that the emoji
anchors provide a similar level of consistency in overall RIASEC profiles as the traditional
anchors across time. Overall, these data suggest that emoji anchors maintain the same rank-order
stability of RIASEC profiles as the traditional anchors.
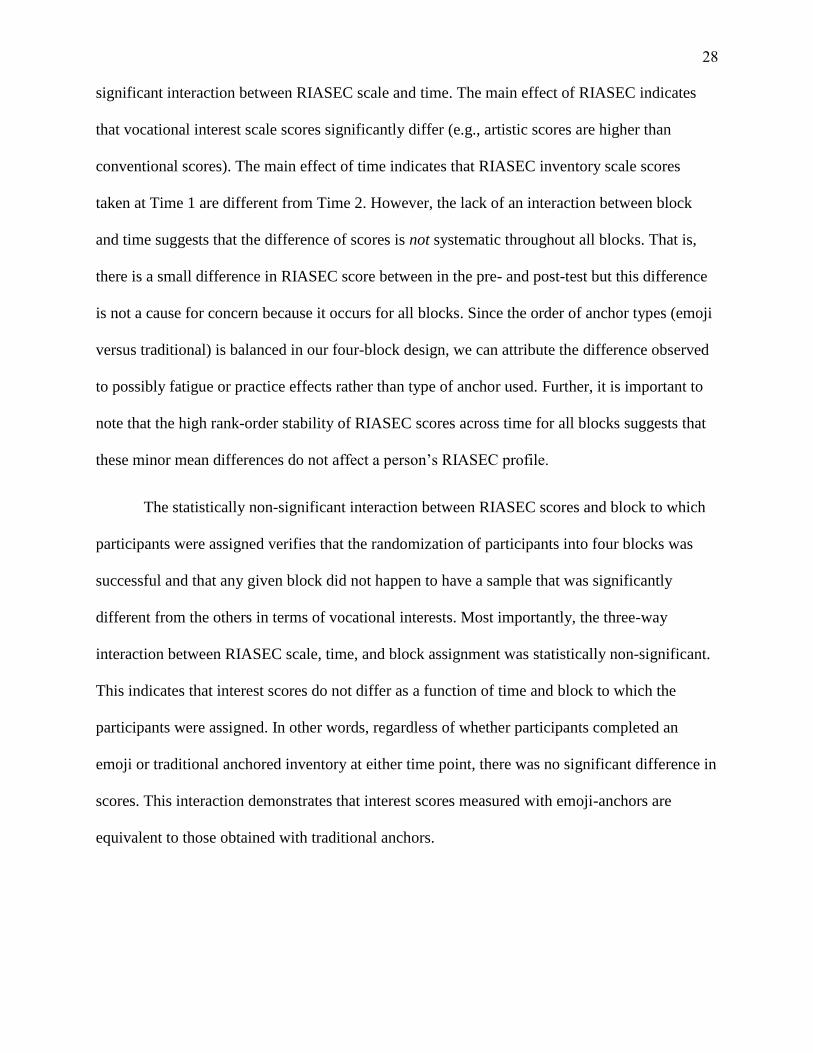
Doubly MANOVA (Repeated Measures Profile Analysis)
To test for block by time interactions in predicting RIASEC scores, we conducted a
doubly MANOVA. Results indicate that there are main effects of RIASEC scale on score and
main effects of time on score, but that there is no main effect of block on scores and no
28
significant interaction between RIASEC scale and time. The main effect of RIASEC indicates
that vocational interest scale scores significantly differ (e.g., artistic scores are higher than
conventional scores). The main effect of time indicates that RIASEC inventory scale scores
taken at Time 1 are different from Time 2. However, the lack of an interaction between block
and time suggests that the difference of scores is not systematic throughout all blocks. That is,
there is a small difference in RIASEC score between in the pre- and post-test but this difference
is not a cause for concern because it occurs for all blocks. Since the order of anchor types (emoji
versus traditional) is balanced in our four-block design, we can attribute the difference observed
to possibly fatigue or practice effects rather than type of anchor used. Further, it is important to
note that the high rank-order stability of RIASEC scores across time for all blocks suggests that
these minor mean differences do not affect a person’s RIASEC profile.
The statistically non-significant interaction between RIASEC scores and block to which
participants were assigned verifies that the randomization of participants into four blocks was
successful and that any given block did not happen to have a sample that was significantly
different from the others in terms of vocational interests. Most importantly, the three-way
interaction between RIASEC scale, time, and block assignment was statistically non-significant.
This indicates that interest scores do not differ as a function of time and block to which the
participants were assigned. In other words, regardless of whether participants completed an
emoji or traditional anchored inventory at either time point, there was no significant difference in
scores. This interaction demonstrates that interest scores measured with emoji-anchors are
equivalent to those obtained with traditional anchors.
29
Table 11
Doubly MANOVA Results for Effects of RIASEC Scale, Time, and Block
Effect Test Value F df Error df p value Partial eta
squared
RIASEC Pillai's
Trace
.40 73.60b 5 561.00 .00 .40
Wilks'
Lambda
.60 73.60b 5 561.00 .00 .40
Hotelling's
Trace
.66 73.60b 5 561.00 .00 .40
Roy's
Largest
Root
.66 73.60b 5 561.00 .00 .40
RIASEC*
Block
Pillai's
Trace
.02 .93 15 1689.00 .53 .01
Wilks'
Lambda
.98 .92 15 1549.08 .54 .01
Hotelling's
Trace
.03 .92 15 1679.00 .54 .01
Roy's
Largest
Root
.01 1.52c 5 563.00 .18 .01
Time Pillai's
Trace
.04 23.34b 1 565.00 .00 .04
Wilks'
Lambda
.96 23.34b 1
565.00 .00 .04
Hotelling's
Trace
.04 23.34b 1 565.00 .00 .04
Roy's
Largest
Root
.04 23.34b 1 565.00 .00 .04
Time* Block Pillai's
Trace
.01 1.25b 3 565.00 .29 .01
Wilks'
Lambda
.99 1.25b 3 565.00 .29 .01
Hotelling's
Trace
.01 1.25b 3 565.00 .29 .01
Roy's
Largest
Root
.01 1.25b 3 565.00 .29 .01
(table continues)

30
Table 11 (continued)
Effect Test Value F df Error df p value Partial eta
squared
RIASEC*
Time
Pillai's
Trace
.09 11.39b 5 561.00 .00 .09
Wilks'
Lambda
.91 11.39b 5 561.00 .00 .09
Hotelling's
Trace
.10 11.39b 5 561.00 .00 .09
Roy's
Largest
Root
.10 11.39b 5 561.00 .00 .09
RIASEC*
Time*
Block
Pillai's
Trace
.04 1.55 15 1689.00 .08 .01
Wilks'
Lambda
.96 1.56 15 1549.08 .08 .01
Hotelling's
Trace
.04 1.56 15 1679.00 .08 .01
Roy's
Largest
Root
.03 3.25c 5 563.00 .01 .03
Note. b = exact statistic; c = statistic is upper bound on F that yields lower bound on
significance level.

31
Plotted Mean RIASEC Scale Scores
In addition to establishing the rank-order consistency of RIASEC profiles across different
anchors, we also calculated mean RIASEC scores (see Tables 6-9). Consistency in mean scores
ensures that, regardless of rank-order, participants are not systematically endorsing items within
a RIASEC scale more or less with any given anchor type. Figures 1-4 show the plots of RIASEC
mean scores for each block. Blue lines indicate the inventory given at Time 1; green lines
indicate the inventory given at Time 2. Block 1 (traditional-traditional) provides a baseline for
mean score consistency and shows that mean scores for Realistic, Investigative, Artistic, and
Social scales are almost identical with slight deviations for Enterprising and Conventional.
Overall, the traditional-anchored scale results in very consistent mean scores across time.
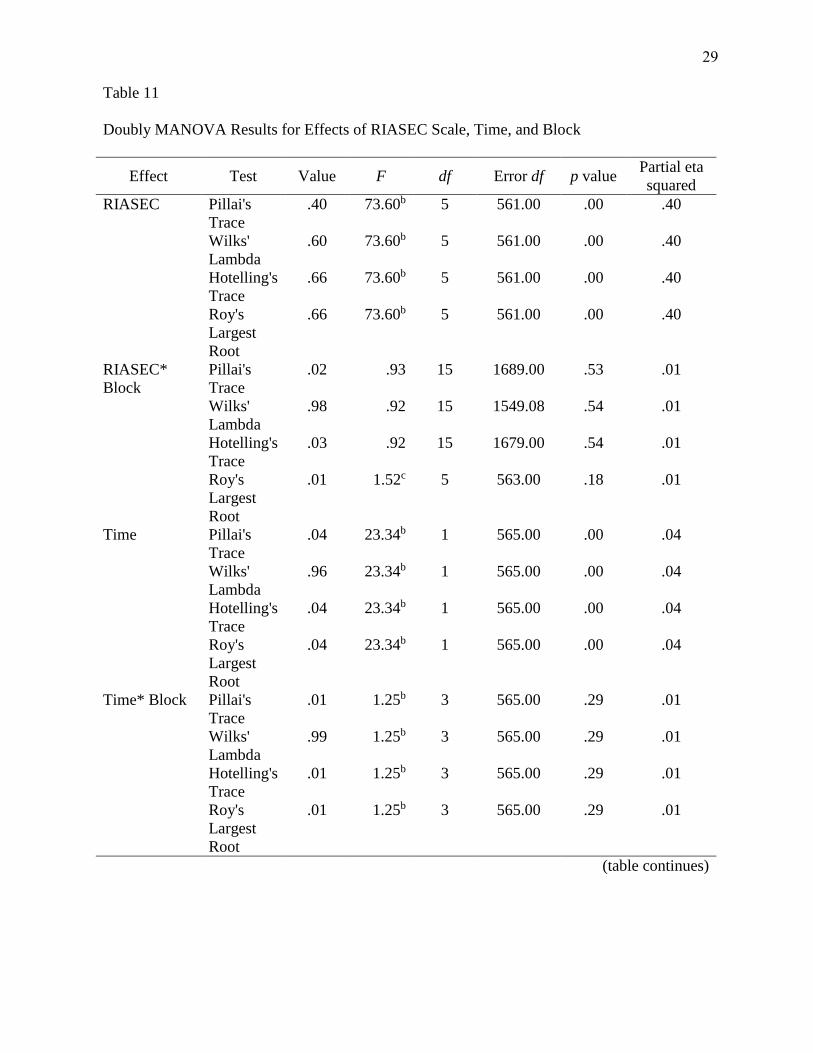
We compared these results to Block 2 (emoji-emoji; see Figure 2). The mean scores are a
little less consistent across time points than Block 1, but still show very similar results. The
largest discrepancies between mean scores across time using emoji anchors are never greater
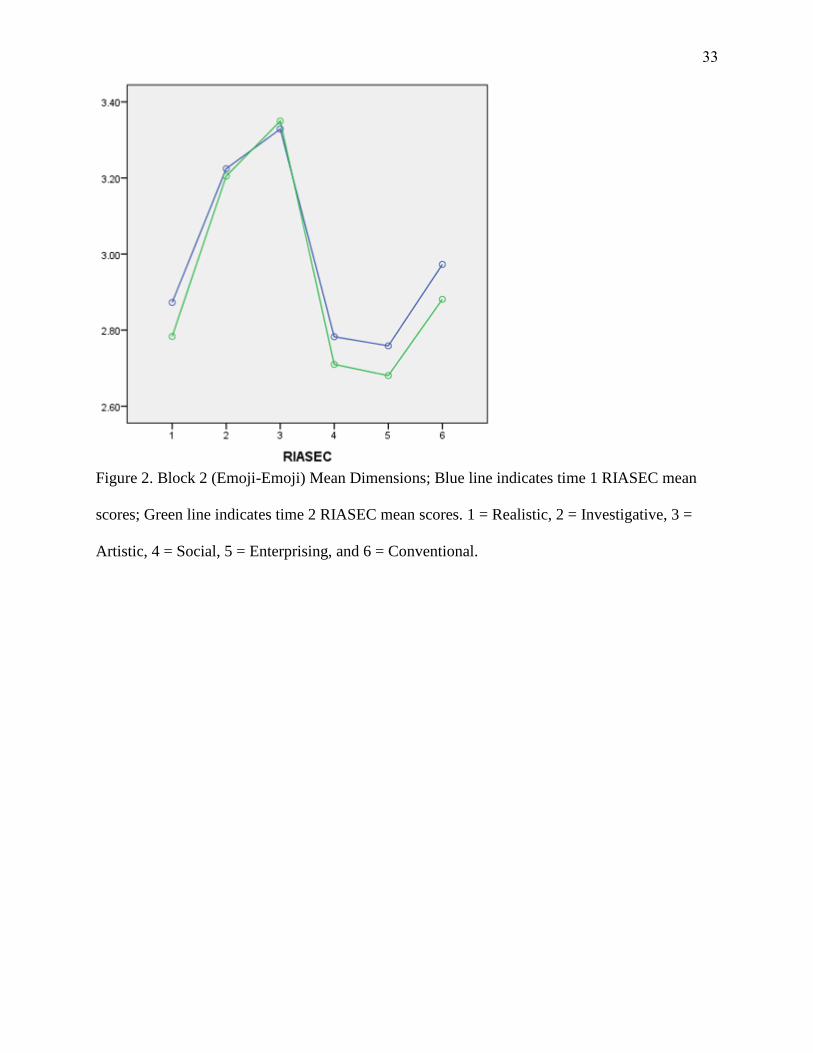
than .10 on a 5-point scale. Furthermore, results of blocks using one of each anchor type show
high consistency of scores across time regardless of which anchor type was presented first. Block
3 (traditional-emoji) shows very little difference between RIASEC means across time and results
in a plot that is very similar to that of the baseline block (Figure 1). Block 4 (emoji-traditional)
also has very little deviation in mean scores from Time 1 to Time 2. These results suggest that
not only do emoji anchors have similar consistency in mean RIASEC scale scores across time,
but also these emoji means are similar to those resulting from traditional anchors.

32
Figure 1. Block 1 (traditional-traditional) Mean Dimensions. Blue line indicates time 1 mean
RIASEC scores; Green line indicates time 2 mean RIASEC scores. 1 = Realistic, 2 =
Investigative, 3 = Artistic, 4 = Social, 5 = Enterprising, and 6 = Conventional.
33
Figure 2. Block 2 (Emoji-Emoji) Mean Dimensions; Blue line indicates time 1 RIASEC mean
scores; Green line indicates time 2 RIASEC mean scores. 1 = Realistic, 2 = Investigative, 3 =
Artistic, 4 = Social, 5 = Enterprising, and 6 = Conventional.
34
Figure 3. Block 3 (traditional-emoji) Mean Dimensions; Blue line indicates time 1 RIASEC
mean scores; Green line indicates time 2 RIASEC mean scores. 1 = Realistic, 2 = Investigative, 3
= Artistic, 4 = Social, 5 = Enterprising, and 6 = Conventional.
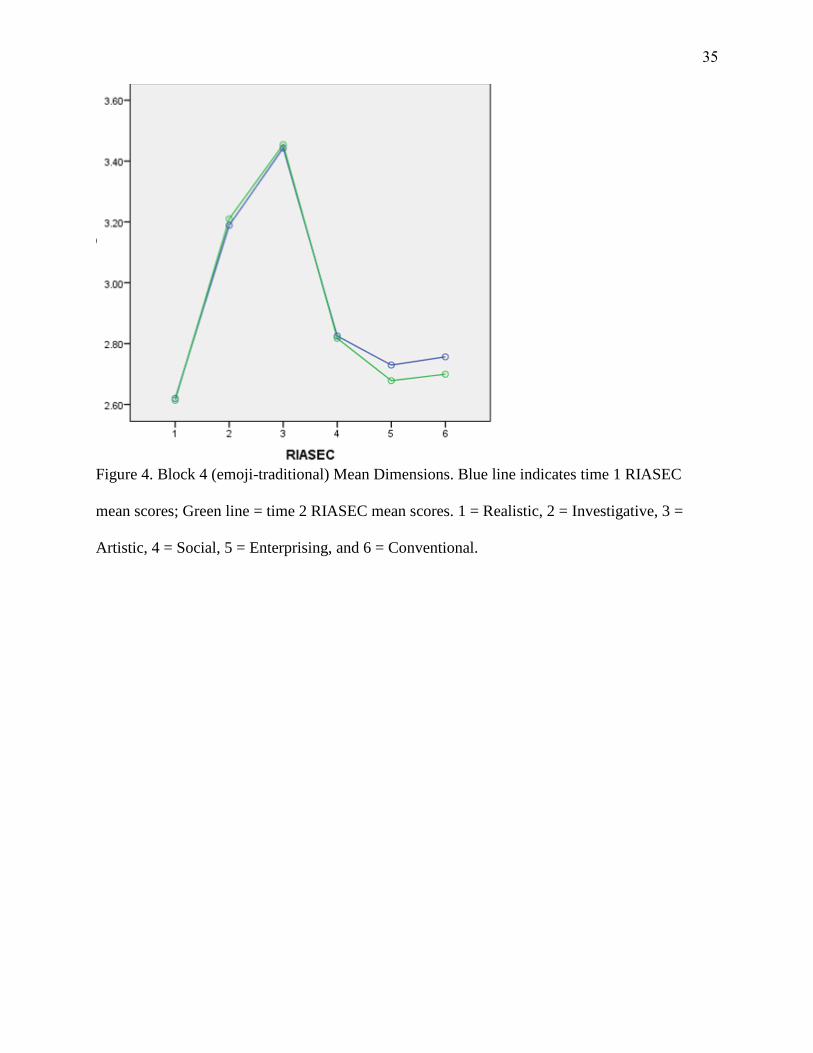
35
Figure 4. Block 4 (emoji-traditional) Mean Dimensions. Blue line indicates time 1 RIASEC
mean scores; Green line = time 2 RIASEC mean scores. 1 = Realistic, 2 = Investigative, 3 =
Artistic, 4 = Social, 5 = Enterprising, and 6 = Conventional.
36
Structural Validity
We examined the inter-relationship between the six RIASEC interest scales. Given that
the Interest Profiler was developed to measure Holland’s (1997) circumplex model of interest,
there is an expected clockwise, circular ordering of the R-I-A-S-E-C personality types. This
expected circular ordering was evaluated for each RIASEC correlation matrix by time point by
block, yielding eight analyses. We tested the RIASEC circular structure using a randomization
test (Rounds, Tracey, & Hubert, 1992) and circular unidimensional scaling (Armstrong, Hubert,
& Rounds, 2003).
Results from both statistical methods (presented in Table 12) show that regardless of
anchors used (lexical or emoji) and time (1 or 2) the expected ordering was confirmed. The
correspondence index (CI) from the randomization test showed that the observed RIASEC
correlation matrices met orderings predicted by Holland’s model at a statistically significant
level. Similarly, results from the circular unidimensional scaling (CUS) showed that the
correlation matrices conformed to the expected circumplex ordering. For CUS, the variance
accounted for (R2) serves as an indicator for how well the correlation matrices fit the circumplex
ordering. A R2 of .60 or higher is expected for a sample from the United States and suggests
excellent fit with the circumplex model (Armstrong et al., 2003). All correlation matrices
examined had excellent fit to the circumplex. The emoji label scales do slightly better than
traditional scales in conforming the expected ordering.

37
Table 12
Results from Randomization Test and Circular Unidimensional Scaling
Anchor label Randomization Test Circular Unidimensional
Scaling
Predictions met CI R2 Fit
Block 1
Emoji time 1 60 .71 .73 Excellent
Traditional time 2 61 .69 .71 Excellent
Block 2
Emoji time 1 66 .85 .80 Excellent
Emoji time 2 67 .86 .71 Excellent
Block 3
Traditional time 1 59 .65 .63 Excellent
Traditional time 2 62 .72 .63 Excellent
Block 4
Traditional time 1 63 .76 .69 Excellent
Emoji time 2 62 .74 .75 Excellent
R2 in circular unidimensional scaling is for fitting the data to a quasi-
circumplex model. CI = Correspondence index. CI is a ratio of met and
unmet predictions out of 72 possible RIASEC predictions (Rounds et al.,
1992). All CI presented are significantly different from chance p < .05. Cut
offs for circular unidimensional scaling: Good fit = .60, Moderate fit = .44,
Minimum = .36 (Armstrong et al., 2003).
38
Summary
These studies resulted (1) in the identification of a set of emoji anchors that are consistent with
traditional lexical anchor labels used in the Interest Profiler Short Form (Short-IP) and (2)
evidence demonstrating that emoji anchors are psychometrically equivalent to traditional
anchors. Five sets of emojis were identified based on images that were available for open use and
could be adapted for the Short-IP without any required licensing or other legal permissions.
These sets were then evaluated using a substantive validity technique. The emoji faces comprised
a pool from which a group of participants (N = 36) could select up to two images to sort into
each of the five traditional anchor categories (strongly like, like, unsure, dislike, and strongly
dislike). Emojis were selected that had the highest percentage of participants selecting those
images to represent the anchor categories and the fewest disagreements. A second study was
conducted to determine the efficacy of the emojis as anchors in the Short-IP. Participants (N =
569) all completed two versions of the Short-IP interest inventory (Time 1 inventory, followed
by a filler task, and then Time 2 inventory). A randomized block design assigned participants to
one of four blocks (1) Time 1 traditional anchors/Time 2 traditional anchors (2) Time 1 emoji
anchors/Time 2 emoji anchors (3) Time 1 traditional anchors/Time 2 emoji anchors (4) Time 1
emoji anchors/Time 2 traditional anchors. This design allowed us to compare emoji anchors to
the traditional lexical anchors while accounting for any order effects (i.e., whether participants
first saw tradition or emoji anchors). Results demonstrate that emoji anchors maintain the same
internal consistency and test-retest reliability, high-point scores, RIASEC profile correlations,
and mean RIASEC scale scores as traditional anchors on the Short-IP. Thus, emoji anchors result
in the same interest profiles and maintain the same rank-order stability over time as the more
traditional anchors. Together these studies were able to identify a set of emoji anchors for use in
the Interest Profiler that resulted in no loss in psychometric information by using emoji

39
compared to traditional anchors. We conclude that researchers and practitioners can use an
emoji-anchored interest inventory just as they would the traditional inventories to measure
vocational interests.

40
References
Anderson, J. C., & Gerbing, D. W. (1991). Predicting the performance of measures in a
confirmatory factor analysis with a pretest assessment of their substantive
validities. Journal of Applied Psychology, 76(5), 732.
Armstrong, P. I., Hubert, L., & Rounds, J. (2003). Circular unidimensional scaling: A new look at
group differences in interest structure. Journal of Counseling Psychology, 50(3), 297–
308. http://doi.org/10.1037/0022-0167.50.3.297
Brown, S. D. & Gore, P.A. (1994). An evaluation of interest congruence indices: Distribution
characteristics and measurement properties. Journal of Vocational Behavior, 45(3), 310-
327.
Champion, H. R., Holcomb, J. B., Lawnick, M. M., Kelliher, T., Spott, M. A., Galarneau, M. R.,
& Eastridge, B. J. (2010). Improved characterization of combat injury. Journal of
Trauma and Acute Care Surgery, 68(5), 1139-1150.
Derks, D., Bos, A. E., & Von Grumbkow, J. (2007). Emoticons and social interaction on the
Internet: The importance of social context. Computers in Human Behavior, 23(1), 842-
849.
Izard, C. E. (2007). Basic emotions, natural kinds, emotion schemas, and a new paradigm.
Perspectives on Psychological Science, 2(3), 260-290.
Holland, J. L. (1997). Making vocational choices: A theory of vocational personalities and work
environments (3rd ed.). Odessa, FL: Psychological Assessment Resources.
Kroustalis, C., Lewis, P., & Rivkin, D. (2010). Linking Client Assessment Profiles to O*NET
Occupational Profiles Within the O*NET Interest Profiler Short Form. Raleigh, NC:
National Center for O* NET Development. Retrieved from
http://www.onetcenter.org/reports/IPSF_Linking.html

41
Kunin, T. (1955). The construction of a new type of attitude measure. Personnel
Psychology, 8(1), 65-77.
Landis, J. R. & Koch, G. G. (1977). The measurement of observer agreement for categorical
data. Biometrics, 33(1), 159-174.
Lindquist, K. A., Barrett, L. F., Bliss-Moreau, E., Russell, J. A. (2006). Language and the
perception of emotion. Emotion, 6(1), 125-138.
Markus, H. R., & Kitayama, S. (1991). Culture and the self: Implications for cognition, emotion,
and motivation. Psychological Review, 98(2), 224.
Novak, P. K., Smailović, J., Sluban, B., & Mozetič, I. (2015). Sentiment of emojis. PloS
One, 10(12).
Rounds, J. B., Tracey, T. J., & Hubert, L. (1992). Methods for evaluating vocational interest
structural hypotheses. Journal of Vocational Behavior, 40, 239-259.
Rounds, J., Su, R., Lewis, P., Rivkin, D. (2010). O*NET® Interest Profiler Short Form:
Psychometric Characteristics. National Center for O*Net Development, Raleigh, NC.
http://www.onetcenter.org/reports/IPSF_Psychometric.html
Russell, J. A., & Barrett, L. F. (1999). Core affect, prototypical emotional episodes, and other
things called emotion: Dissecting the elephant. Journal of Personality and Social
Psychology, 76(5), 805–819.
http://doi.org/http://dx.doi.org.proxy2.library.illinois.edu/10.1037/0022-3514.76.5.805
Watson, D., & Tellegen, A. (1985). Toward a consensual structure of mood. Psychological
Bulletin, 98(2), 219–235.
http://doi.org/http://dx.doi.org.proxy2.library.illinois.edu/10.1037/0033-2909.98.2.219
Wong, D. L., & Baker, C. M. (1988). Pain in children: Comparison of assessment
scales. Pediatric Nursing, 14(1), 9-17.

42
Appendix
Table A
Legal Use Information for Five Emoji Sets Used in Study 1
Set Name Sample
Image License More information
1 Phantom
Open
Emoji
SIL Open Font
License, MIT
License and
the CC 3.0
License [CC-
By with
attribution
requirement
waived].
Phantom Open Emoji is a completely free
and open source. Use is unrestricted.
Source:
https://github.com/break24/PhantomOpenE
moji
2 Emoji
One
CC-By-SA-4.0 Emoji One is free to share, copy, and
redistribute in any medium or format. These
may be adapted, remixed, or transformed.
Material can be used for any purpose, even
commercially. Licensing terms require
proper attribution (users must give
appropriate credit, provide a link to the
license, and indicate if changes were made).
If images are remixed, transformed, or build
upon these contributions must be distributed
under the same license as the original.
Source:
https://creativecommons.org/licenses/by-
sa/4.0/
3 Square
Emoticons
CC0 1.0
Universal
(CC0 1.0)
Square Emoticons are available for
unlimited educational or commercial use.
The original artist has dedicated the work to
the public domain by waiving all of his or
her rights to the work worldwide under
copyright law, including all related and
neighboring rights, to the extent allowed by
law. Users can copy, modify, distribute and
perform the work, even for commercial
purposes, without asking permission.
Source: https://openclipart.org/may-clipart-
be-used-comparison.
(Table continues)

43
Table A (continued)
Set Name Sample
Image License More information
4 Firefox
OS
Emoji
Apache 2.0 for
code, CC BY
for graphics
Firefox OS Emoji are free to copy and
redistribute in any medium or format. Users
may adapt, remix, transform, and build
upon the material for any purpose, even
commercially.
Source:
https://github.com/mozilla/fxemoji/blob/ma
ster/LICENSE.md
5 Noto
Color
Emoji
SIL Open Font
License,
Version 1.1.
Noto Color Emoji are open source (Open
Font License 1.1.)
Source:
https://github.com/googlei18n/noto-fonts


![UNICODE EMOJI · Instagram] contained emoji.” Individual emoji also vary greatly in popularity (and even by country), as described in the SwiftKey Emoji Report. See emoji press](https://cdn.vdocuments.us/doc/165x107/602a233138d520041a0deb2c/unicode-instagram-contained-emojia-individual-emoji-also-vary-greatly-in-popularity.jpg)