
1
Everybody’s Talking But is Anybody Listening? Stock Market Reactions to Corporate
Social Responsibility Communications
Kun Yu
Shuili Du
C.B. Bhattacharya
Kun Yu ([email protected]) is Assistant Professor of Accounting, College of Management, University of Massachusetts, 100 Morrissey Blvd, Boston, MA 02125, telephone: 617-287-7715. Shuili Du ([email protected]) is Assistant Professor of Marketing, Peter T. Paul College of Business and Economics, University of New Hampshire, 10 Garrison Avenue, Durham, NH 03824, telephone: 603-862-3328. C.B. Bhattacharya ([email protected]) is E.ON Chair Professor in Corporate Responsibility, European School of Management and Technology, Schlossplatz 1, Berlin 10178, telephone: (49) 30-21231-1528.

2
Stock Market Reactions to Corporate Social Responsibility Communications
Abstract This research investigates stock market reactions to corporate social responsibility (CSR) communications, specifically, the release of standalone CSR reports. We develop and test a theoretical framework predicting that (1) CSR performance drives abnormal stock returns to the release of a firm’s CSR report, (2) information environment and R&D moderate the positive relationship between abnormal returns and CSR performance, and (3) CSR reporting enhances the value relevance (i.e., helps predict firm value) of CSR performance. Based on a large-scale secondary dataset, the results show support for this framework. Specifically, the positive association between abnormal returns and CSR performance is stronger for firms in a weak information environment, suggesting that investors of these firms rely more on CSR reports to incorporate CSR performance information in the stock price revaluation. The positive relationship between abnormal returns and CSR performance is stronger for firms with high R&D, indicating that R&D enhances the business value of CSR. Our results offer important implications for CSR theory and practices.
3
1. Introduction
Corporate social responsibility (CSR) has increasingly become an integral part of
corporations’ daily business operation and long-term strategic planning (Porter and Kramer
2011). Spurred in part by the belief that CSR activities, ranging from community outreach,
cause-related marketing, fair labor practices, to environmental stewardship and other initiatives,
could create business value and ultimately enhance financial performance (Bonini et al. 2009),
more than 7,000 corporations across 145 countries have adopted the United Nation’s Global
Compact policy, committing to align their business operations with a set of socially responsible
business principles. Indeed, there is growing evidence suggesting that CSR can generate many
coveted business benefits such as more favorable firm image, customer satisfaction and loyalty,
and customer resilience to negative events (Klein and Dawar 2004; Luo and Bhattacharya 2006).
Seeking to reap maximal benefits from their CSR investments, firms are actively utilizing
various channels such as CSR advertisements, point-of-purchase communication, corporate
websites, and standalone CSR reports to communicate their social responsibility programs to a
variety of stakeholders (Du et al. 2010).
Despite the prominence of CSR on the global corporate agenda today, it still remains a
topic of “hot debate” because of its equivocal impact on bottom line performance. At the center
of this debate is “do investors care about CSR?” The popular press is filled with mixed opinions
on this issue. On one hand, it seems that mainstream investors do not care about CSR. According
to a large-scale study by Accenture in partnership with the U.N., most CEOs believe that the
investor community does not currently reward socially responsible companies, and actually cite a
lack of investor interest as a critical barrier to further investment in CSR (Lacy 2010). More
recently, blogger Joshua Schroeder echoes a similar lack of interest by the investment
4
community: “if being sustainable is so important to companies and consumers then why as investors do
we hardly ever consider it as a factor in investment decisions?”(cite?). On the other hand, there has
been broadening investor concern about the bottom line impacts of social and environmental
issues and investors are increasingly using means such as proxy voting to voice their concerns to
management (Lubber 2011). Furthermore, investors are using data on firm social and
environmental performance in their investment decision models (PriceWaterhouseCooper 2012).
For instance, 722 institutional investors, representing an excess of US$87 trillion in assets, are
currently using the data services of Carbon Disclosure Project (CDP), a non-profit organization,
to integrate firm environmental performance in their investment process (CDP 2013).
This study helps disentangle this key debate by examining investor reactions to firm CSR
communication, more specifically, standalone CSR reports. Standalone CSR reports, due to their
comprehensive content and higher level of detail relative to other forms of CSR information (e.g.,
CSR advertising, third party CSR ratings), is one of the most important means that firms use to
communicate social and environmental performance information to investors (Dawkins 2004;
Dhaliwal et al. 2011; Perrini 2006). The number of firms releasing standalone CSR reports has
increased dramatically over the years; in 2011, more than 5,500 companies around the world
issued CSR reports, up from about 800 a decade ago (Fortune 2012; KPMG 2011). We examine
stock market reactions around the announcement dates of annual stand-alone CSR reports. More
specifically, drawing upon literature on CSR, the marketing-finance interface, and information
disclosure, we develop and test a theoretical framework that hypothesizes (1) the impact of firm
CSR performance on stock market reactions to CSR reports, (2) the role of the information
environment and firm R&D in explaining the cross-sectional variations of this impact and further,

5
(3) the role of CSR reporting in enhancing the value relevance of CSR (i.e., the impact of CSR
performance on the market value of the firm).
Our approach involves an event study that captures the immediate short-term reaction of
the stock market to the release of CSR reports. Following prior literature on event studies (e.g.,
Cready and Hurtt 2002; Bushee et al. 2011), we use both price-based and volume-based proxies
to measure market reactions to CSR reports. We find positive cumulative absolute abnormal
returns and positive abnormal trading volume around the release dates of CSR reports,
suggesting that investors do revise their expectations of future cash flows or risks of a firm based
on the information released in its annual CSR reports. Further multivariate regression analysis
shows a positive association between signed abnormal returns to the release of a firm’s CSR
report and its CSR performance. In other words, all else equal, the higher the CSR performance,
the greater the abnormal returns. Since event study methodology isolates all contextual variables
and enables us to draw causal relationships, this finding provides rigorous evidence that CSR
performance leads to enhanced financial performance.
A key characteristic of our theoretical framework is that, taking an interdisciplinary
approach, we identify two factors, information environment (from the finance and accounting
literature), and R&D (from the marketing and strategy literature), which could help account for
the variability in the impact of CSR performance on abnormal returns. We find that the
association between CSR performance and abnormal returns is more positive for firms in a weak
information environment, consistent with the argument that, for firms in a better information
environment, their investors may have already been aware of these firms’ CSR performance
through other information channels, thus leading to smaller investor reactions. We also find that
the association between CSR performance and abnormal returns is more positive for firms with

6
high R&D, suggesting that R&D is an important strategic lever that magnifies the business value
of CSR (Handelman and Arnold 1999; Luo and Bhattacharya 2006, 2009).
Also importantly, we examine the effect of CSR reporting on the value relevance of CSR
performance. We expect that publishing standalone CSR reports helps reduce information
asymmetry between firms and investors, and increases the timeliness of stock price incorporating
CSR information. Using the Heckman (1979) two-stage procedure to control for self-selection
bias, we document a positive moderating effect of CSR reporting on the association between
stock returns and changes in CSR performance. Specifically, stock returns appears to be
positively associated with changes in CSR performance only for firms that release annual CSR
reports, but not for firms that do not. This finding highlights an important benefit of actively
communicating a firm’s social and environmental performance (e.g., CSR reports) to investors:
such active, strategic communication could enhance the value relevance of CSR performance.
Our study contributes to the literatures in CSR, the marketing finance interface, as well as
the voluntary disclosure literature in accounting and finance. First, while prior research has
mostly focused on CSR communication targeting customers and employees (Bhattacharya, Sen
and Korschun 2011; Du et al. 2010; Schuler and Cording 2006) and emphasized the role of
consumer CSR awareness in accentuating the business value of CSR (e.g., Servaes and Tamayo
2013), our study highlights the importance of CSR communication to investors, an under-
examined yet critically important stakeholder group. Our findings on abnormal stock returns to
the release of CSR reports establish convincing evidence that investors care about CSR;
investors do pay attention to CSR reports and indeed adjust their expectations of future long-term
firm performance based on the information disclosed in the CSR reports. Importantly, strategic
CSR communication such as release of CSR reports greatly reduces the information asymmetry
7
between the firm and its investors, leading to enhanced value relevance of CSR performance. By
relating CSR communication to stock market reactions, our study also responds to the call for
more research where “Marketing Strategy meets Wall Street.”
Further, our study sheds light into the causality between firm CSR performance and firm
financial performance, a link that prior CSR literature has not been able to unambiguously
establish due to several methodological limitations (e.g., omitted variables, associational tests;
Margolis and Walsh 2003). The use of event study methodology, together with the uniqueness of
our event (i.e., the release of standalone CSR report that details a firm’s overall CSR
performance), enables us to draw a causal conclusion that good CSR performance leads to
enhanced financial performance.
Last but not least, our study contributes to the voluntary disclosure literature in finance
and accounting. Prior research tends to focus on voluntary financial disclosure, such as
management forecast (e.g., Hutton et al. 2003). To the best of our knowledge, our study is the
first to examine whether and how stock market reacts to voluntary non-financial disclosure (i.e.,
CSR reports). Our findings show that non-financial CSR reports play a critical role in
supplementing firm financial disclosure and enhancing information transparency to investors and
other important stakeholders.
The rest of this paper is organized as follows. Section 2 reviews the literature and
develops hypotheses. Section 3 outlines research methodology. The data are described in section
4. Sections 5 provide the empirical results. The final section discusses the theoretical and
practical implications.
2. Conceptual Overview and Hypotheses Development
Does CSR Create Value?

8
CSR can contribute to firm value in a variety of ways. Stakeholder theory (Freeman 1985)
suggests that firms with a superior CSR performance will benefit from stronger relationships
with their various stakeholder groups. For example, customers will evaluate socially responsible
firms’ products and services more favorably and are more likely to purchase from and be loyal to
such firms (e.g., Brown and Dacin 1997; Du, Bhattacharya, and Sen 2011). Socially responsible
firms also tend to attract better talent, increase current employees’ morale and commitment,
thereby reducing turnover, recruitment and training costs (Bhattacharya, Sen and Korschun 2011,
Surroca et al. 2010; Turban and Greening 1997). More generally, a positive CSR record will help
firms attain legitimacy and the license to operate at local communities as well as receiving more
favorable treatment from regulators and policy makers (Brown et al. 2006; Fombrun et al. 2000).
In addition to strengthening stakeholder relationships, CSR can also help firms develop
new competencies, resources and capabilities (Barney 1991; Hart 1995; Orlitzky et al. 2003).
The resource-based view suggests that proactively addressing social and environmental
challenges requires firms to cultivate a system-thinking mindset and to enhance employee
involvement and inter-functional coordination (Hart 1995; Porter and Kramer 2011). Several
empirical studies (e.g., Sharma and Vredenburg 1998; Surroca et al. 2010) find that CSR
programs stimulate organizational learning, resulting in valuable intangible resources such as
innovation capabilities and a collaborative, forward-looking corporate culture. In turn, these
resources and capabilities contribute to competitive advantage and long-term financial
performance.
Finally, CSR creates goodwill, or moral capital (Godfrey et al. 2009) that can minimize
firm risk. Typically, when negative events occur, stakeholders are likely to react negatively by
punishing the firm with sanctions such as badmouthing, boycotts, or terminating the relationship

9
with the firm. Research suggests that the goodwill derived from CSR can act as “an insurance
policy” that mitigates the damage to firm during times of crisis (Godfrey et al. 2009; Klein and
Dawar 2004). In support of this reservoir of goodwill idea, Luo and Bhattacharya (2009) find
that higher CSR performance lowers undesirable firm-idiosyncratic risk.
On the other hand, however, there are some theoretical and empirical studies supporting a
negative impact of CSR on firm performance (Griffin and Mahon 1997; Margolis and Walsh
2003; Schuler and Cording 2006). For example, private costs theory posits that CSR represents
costs that the firm bears without commensurate returns (Friedman 1970; Karnani 2010; Preston
and O’Bannon 1997); by engaging in CSR, managers forgo more profitable activities and fail to
maximize the firm’s private returns. Meznar et al. (1994) find that there is a negative return to
firms’ withdrawal from South Africa (a socially responsible action). In spite of the mixed
findings, the evidence supporting a positive relationship between CSR performance and financial
performance seems to overweigh the evidence supporting a negative relationship.
CSR Communication and Standalone CSR Reports
It is widely acknowledged that CSR communication is critical in unlocking the business
value of CSR. Many of CSR’s business benefits discussed in the previous section hinges on
whether stakeholders are aware of a firm’s CSR activities or not. Lack of stakeholder awareness
is a stumbling block for firms seeking to reap maximal business benefits from CSR and effective
CSR communication can overcome this hurdle (Dawkins 2004). Servaes and Tamayo (2013)
find that CSR is positively related to firm value only for firms with high customer CSR
awareness, with the relationship being negative or insignificant for firms with low customer
awareness.
10
CSR communication with stakeholders is accomplished through a variety of means, such
as advertising campaigns about CSR initiatives, CSR information on corporate websites,
standalone CSR reports, and point-of-purchase communication (Du, Bhattacharya and Sen 2010;
Maignan and Ralston 2002; Schuler and Cording 2006). Among these various means of
communication, CSR reports constitute one of the most important ways firms use to
systematically communicate their social and environmental performance to various stakeholders
and have rapidly become “the de facto law for business” (KPMG 2011).
A firm’s voluntary compilation and publication of standalone CSR reports demonstrates
its serious commitment to improving transparency regarding social and environmental
performance. In particular, standalone CSR reports have the following characteristics. First, a
firm’s annual standalone CSR report comprehensively details the firms’ overall social and
environmental performance. A CSR report typically covers a firm’s performance along various
social and environmental dimensions, including human resources, environment, community,
customers, suppliers, corporate governance, and others; within each issue domain, the report will
cover the firm’s actions and performance regarding various aspects of that domain (Perrini 2006).
The length of CSR reports often ranges from several dozen pages to over 100 pages (e.g.,
General Electric’s 2009 CSR report has 46 pages, and Walmart’s 2012 CSR report has 126
pages). In contrast, information provided through other means, such as press releases, CSR
advertising, or third party ratings, is unlikely to contain sufficient and in-depth information about
a firm’s overall CSR performance.
Second, CSR reports provide credible, quantitative information about a firm’s CSR
performance. Du et al. (2010) emphasize that, to reduce stakeholder skepticism, effective CSR
messages should be factual, evidence-driven, and provide quantitative information whenever

11
possible. CSR reports contain quantitative information, or performance indicators, about a firm’s
social and environmental programs. These performance indicators can be compared across
industry peers as well as over the years to discern an increasing or decreasing trend in firm social
and environmental performance (Perrini 2006).
Third, CSR reports reach multiple stakeholders, in particular, the investor community
(Dawkins 2004). Prior research on CSR communication has mostly focused on customers (e.g.,
Du et al. 2007; Schuler and Cording 2006) but has paid scant attention to investors as recipients
of firm CSR communication. Yet engaging investors in a dialog where firms articulate and
communicate the contribution of CSR to firm value is crucial for investors to make decisions that
take into account firm CSR performance. Dhaliwal et al. (2011) find that, for socially responsible
firms, initiation of CSR reporting reduces cost of equity, suggesting that CSR reports reduce
information asymmetry between managers and investors.
Stock Market Reactions to Release of Standalone CSR reports
Several studies show that stakeholder awareness of a firm’s CSR is generally very low
(e.g., Dawkins 2004; Du et al. 2007), highlighting the information asymmetry between the firm
and its stakeholders. Since CSR reports provide comprehensive, detailed, and quantitative
information about a firm’s social and environmental performance, the release of such reports
provide new (i.e., previously unknown to the market/stakeholders) information and lead to
reduced information asymmetry. In particular, investors can use CSR reports to get information
about a firm’s CSR performance and make decisions based on this newly acquired CSR
information.

12
The new information contained in a firm’s CSR report will likely lead to changes in the
firm’s stock price, as long as the information is value-relevant (i.e., helps predict firm value). A
large body of prior research suggests that CSR information is value-relevant (e.g., Godfrey et al.
2009; Luo and Bhattacharya 2006; Surroca et al. 2010). As discussed in a previous section, CSR
performance can contribute to firm financial performance by enhancing stakeholder relationships
(i.e., more customer loyalty, higher employee morale and commitment), cultivating core
competencies (i.e., innovation capabilities), and minimizing damage during times of crisis. These
benefits of CSR will either increase future revenue (e.g., more sales, and the ability to charge a
price premium), reduce future costs (e.g., customer acquisition and retention costs, employee
recruiting, training, and retention costs, and preempting government regulation), or reduce the
risks associated with firm profits. Since stock price reflects the present value of all future cash
flows, discounted by a risk-adjusted rate, we expect that the abnormal returns (i.e., changes in the
stock prices attributed to the release of CSR reports), will be positively related to the firm’s CSR
performance. In other words, the higher a firm’s CSR performance, the greater the abnormal
returns to the release of its CSR report.
H1: The abnormal stock return to the release of a firm’s CSR report will be positively associated with the firm’s CSR performance.
Moderating Role of Information Environment
Information environment, referring to the level of information already available to the
market (stakeholders), is a critical factor influencing the amount of new information (i.e.,
informational content) in a firm’s standalone CSR report: for firms in a rich information
environment, their CSR reports are likely to contain a smaller amount of new information.
Consequently, information environment is likely to influence how the stock market reacts to the

13
release of CSR reports. Indeed, the financial disclosure literature (Atiase 1985; El-Gazzar 1998)
shows that there are systematic cross-sectional differences in the extent to which stock price
reacts to quarterly and annual earnings announcements. Such cross-sectional differences have
been partly attributed to information environment.
Firm size and level of institutional ownership are widely used in the financial disclosure
literature to capture a firm’s information environment (Atiase 1985; El-Gazzar 1998; Ro 1988).
Information environment is positively associated with firm size because the amount of pre-
disclosure information production and dissemination is often an increasing function of firm size.
Therefore, all else equal, the amount of new information conveyed to the market by earnings
reports is inversely related to firm size. Atiase (1985) finds that the degree of stock price
revaluation in response to earnings reports is inversely related to the firm size.
Information environment is also positively associated with the level of institutional
ownership of a firm. Institutional investors, due to their large holdings, are motivated to acquire
private pre-disclosure information or get managers of firms to voluntarily release a high level of
pre-disclosure information. Thus, firms with a high level of institutional ownership will likely
have a better information environment. El-Gazzar (1998) finds that stock price reactions around
earnings announcements are smaller for firms with greater institutional ownership. More recent
research on institutional investors differentiate between dedicated, transient, and quasi-indexer
institutional investors1 and show that it is dedicated institutional investors who play a monitoring
and governance role and who actively acquire information (both financial and non-financial) to
assess firm performance (Busher 1998; Yu 2012). In other words, dedicated institutional
1 Dedicated institutional investors generally hold large stakes in a few firms, and have low turnover and more concentrated portfolio holdings. Transient institutional investors generally trade frequently to earn short-term profits, and are characterized by high portfolio turnover and diversified portfolios. Quasi-indexer institutional investors generally use the index strategy, and have low turnover and diversified portfolio holdings.

14
investors are associated with better information environment where greater amount of pre-
disclosure information is likely to be available.
We expect information environment to play a similar role in affecting stock market
reactions to standalone CSR reports. For firms in a better information environment (e.g., larger
firms, or firms with higher levels of dedicated institutional ownership), more CSR information
will be made available through other communication channels (e.g., CSR information on
corporate websites, CSR advertising, and investor relations office) prior to the release of
standalone CSR reports. For example, Branco and Rodrigues (2008) find that larger firms are
more likely to disclose CSR performance on corporate websites, which are updated frequently
and thus constitute a source of pre-disclosure CSR information. Similarly, a research report by
PriceWaterhouseCooper (2012) suggests that institutional investors are requesting firms to
disclose their social and environmental performance data. In short, we expect that, for firms in a
better information environment, the higher availability of pre-disclosure CSR information will
reduce the information content of standalone CSR reports, leading to a smaller association
between the market reaction to CSR reports and CSR performance. Therefore, our second
hypothesis is formulated as follows.
H2: Information environment moderates the positive relationship between the abnormal stock return to the release of a firm’s CSR report and its CSR performance such that the relationship is less positive for firms in a better information environment.
Moderating Role of R&D
R&D is a strategic investment that results in technological capabilities and subsequently,
product and process innovations. R&D will enhance the positive impact of CSR on firm financial
performance due to several reasons. First, firms with higher R&D are more likely to have
superior corporate ability to produce high quality and innovative products to satisfy marketplace

15
needs (Gatignon and Xuereb 1997; Mizik and Jacobson 2003). Prior research has shown that
such corporate ability interacts positively with a firm’s CSR to influence stakeholders’
perceptions of and loyalty to the firm (Brown and Dacin 1997; Luo and Bhattacharya 2006). For
example, consumers will be more satisfied and thus more motivated to buy from the socially
responsible firm if its products are innovative and of superior quality (Handelman and Arnold
1999; Luo and Bhattacharya 2006). Employees will demonstrate higher organizational
commitment and work morale if the firm can simultaneously fulfill their financial and
ideological (e.g., making a difference) career needs (Thompson and Bunderson 2003). From this
perspective, higher R&D serves to strengthen the positive impact of CSR on a firm’s stakeholder
relationships and consequently on firm financial performance.
Second, R&D will play a valuable facilitating role in helping firms develop business
capabilities from CSR engagement. The resource-based view suggests that, by engaging in CSR
activities, firms cultivate intangible resources and core capabilities (Orlitzky et al. 2003; Russo
and Fouts 1997; Surroca et al. 2010). Firm capabilities are usually the outcome of interdependent
investments and organizational learning processes (Stieglitz and Heine 2007; Winter 2000).
Winter (2000, p. 984, italics added) states that “to create a significant new capability, an
organization must typically make a set of specific and highly complementary investments in
tangible assets, in process development, and in the establishment of relationships that cross the
boundaries of the organizational unit.” Complementarity gives rise to synergy among these
activities, with the total being more than the sum of the parts (Stieglitz and Heine 2007). R&D
and CSR constitute such synergistic activities in fostering business capabilities. In particular,
while CSR stimulates organizational learning from external sources (e.g., more complicated
scanning processes and information system; Hart 1995; Russo and Fouts 1997), R&D creates

16
internal knowledge and technological capabilities, which influence the firm’s ability to
effectively absorb relevant information from external resources (e.g., market knowledge gained
from a community outreach program; Kanter 1999) and leverage it to commercial ends (Zahra
and George 2002).
Overall, because R&D is a critical strategic factor that magnifies the positive impact of
CSR on business, all else equal, we expect stock market reactions to CSR reports to be bigger for
firms with higher R&D spending. Thus,
H3: R&D moderates the relationship between the abnormal stock return to the release of a firm’s CSR report and its CSR performance such that the relationship is more positive for firms with higher R&D investment.
Figure 1 presents the conceptual model on stock market reactions to the release of CSR
reports.
CSR Reporting and the Value Relevance of CSR
Value relevance refers to whether a financial or non-financial measure can provide
incremental information in explaining the value of a firm. The issue of value relevance is of
paramount importance to CSR managers who are under continuous pressure to justify
expenditures on social and environmental programs. We expect CSR reporting will increase the
value relevance of CSR. Our previous hypotheses relate to how stock market adjusts the stock
price valuation of a firm based on the release of its CSR report. More specifically, abnormal
stock returns will be positively related to the firm’s CSR performance, although the extent of the
stock price revaluation will be contingent on the information environment and firm R&D. A
corollary of these hypotheses would be: for firms that release CSR reports, stock market will
immediately incorporate the new information about a firm’s CSR performance (as contained in
the CSR reports) in the stock valuation of these firms. On the other hand, for those firms that do

17
not release CSR reports, investors may not get a complete picture about the firm’s CSR
performance and thus could not adequately incorporate the firm’s CSR performance information
in the stock price valuation. This suggests that, relative to non-reporting firms, firms that release
standalone CSR reports will experience a stronger relationship between CSR performance and
market value of the firm.
H4: The relationship between a firm’s CSR performance and its market value will be stronger for firms that release CSR reports than for firms that do not release CSR reports.
3. Research Methodology
We use event study methodology to test H1-H3; specifically, we examine abnormal stock
returns surrounding the announcement dates of CSR reports and perform multiple regressions to
explain the cross-sectional differences in abnormal stock returns. To test H4, we employ a
changes model, which is less likely to suffer from econometric problems (e.g., omitted variable
bias; Kothari and Zimmerman 1995), to examine the moderating role of CSR reporting in the
CSR performance – market value relationship.
3.1. Dependent Variable for the Event Study: Abnormal Stock Returns
We use the release date of a firm’s standalone CSR report as the event date and calculate
daily abnormal returns using the Fama-French three factor model, which has gained prominence
because of its ability to explain stock market movements. Fama and French (1993) find that the
market return, firm size, and the book-to-market ratio are important determinants of cross-
sectional stock returns. Similarly, Kothari and Warner (2007) emphasize the importance of
considering these three factors when estimating abnormal returns. Specifically, the following

18
model is estimated for each firm during the 80-day estimation period from 100 trading days prior
to the event window to 21 trading days prior to the event window.
itttmtit HMLSMBRR 321 (1)
Rit is the stock return for firm i on day t. Rmt is the return on the CRSP value-weighted
market portfolio on day t. SMBt is the difference between the return on the portfolio of small
stocks and big stocks. HMLt is the difference between the return on the portfolio of stocks with
high book-to-market ratios and stocks with low book-to-market ratios. The abnormal returns for
each firm during the event window are given by equation 2.
)( 321 ttmtitit HMLbSMBbRbaRAR (2)
a, b1, b2, and b3 are the estimates of the coefficients on each factor obtained from
equation 1. Firm-specific cumulative abnormal returns (CAR) are then calculated as the sum of
daily abnormal returns during the event window2.
3.2. Empirical Models
We focus on cumulative abnormal returns (CAR) during the three-day event window (-1,
1) to examine the cross-sectional variation in the market reaction to CSR reports. To test H1, we
look at whether firms with higher CSR performance have more positive abnormal returns to their
CSR reports. In the empirical regression model, we control several firm characteristics to parse
out potential confounding effects. Our model is specified as follows:
dummiesyearandindustryCSRSCORELIQUIDITYLEV
BTMROAFIRSTADRDRINSTRSIZECAR
1098
76543210 __ (3)
A firm’s CSR report provides a comprehensive picture of its overall CSR performance. In
our empirical analysis, we use KLD ratings to proxy for a firm’s overall CSR performance
2 We also use buy-and-hold abnormal returns and estimate abnormal returns using the market model and the Carhart four-factor model (Carhart 1997). The results based on these alternative approaches are qualitatively similar to those based on CAR from the three-factor model.

19
(CSRSCORE) as disclosed in its annual CSR report. KLD ratings make a good proxy for
information content in CSR reports for several reasons. First, KLD ratings have been used
extensively in the literature to measure overall firm CSR performance (e.g., Coombs and Gilley
2005; Dhaliwal et al. 2011; Godfrey et al. 2009; Servaes and Tamayo 2013; Waddock and
Graves 1997) and are considered as “the de facto (CSR) research standard” (Waddock 2003,
369). Second, KLD ratings comprehensively cover multiple social and environmental domains,
including environment, community, diversity, employee relations, product, and human rights,
and corporate governance. These domains capture all key stakeholder groups and are largely
consistent with the issue domains covered in a typical standalone CSR report (Perrini 2006;
Waddock 2008). Third, in addition to being comprehensive in its coverage of social and
environmental issues, KLD ratings also provide adequate depth regarding firm performance
along various key sub-dimensions of an issue domain, capturing both positive and negative
performance. For example, in the environment domain, KLD has 6 indicators on positive
performance (i.e., strengths) and 7 indicators on negative performance (i.e., concerns); in the
employee domain, KLD has 6 indicators on positive performance and 4 indicators on negative
performance. Last but not least, a good CSR performance measure should be benchmarked by
industry average to enable comparison across industries (Dhaliwal et al. 2011). Since 2003, KLD
dataset covers 3,000 largest U.S. companies, therefore allowing us to compute mean industry
CSR performance and get industry-adjusted CSR performance for each firm.
In the KLD dataset, a firm’s social performance in each domain is rated in two ways,
strengths and concerns. Since the numbers of strength and concern indicators have evolved over
the years in the KLD dataset, we scale the number of total strengths (concerns) for each firm-
year by the maximum possible number of strengths (concerns) in each year to obtain a strengths

20
index and a concerns index that range from 0 to 1. We then subtract the concerns index from the
strengths index to obtain a measure of net CSR performance that ranges from -1 to +1 for each
year (see Coombs and Gilley 2005; Waddock and Graves 1997; Servaes and Tamayo 2013 for
similar transformation of KLD data). Finally, we adjust the net CSR performance for each year
by industry means for the prior year to get relative performance scores that are comparable
across industries.3
SIZE_R and INST_R capture aspects of firm information environment that may explain
the market’s reaction in the event window. Following prior literature (e.g., Collins et al. 2003),
we use the rank of firm size and dedicated institutional ownership to facilitate the interpretation
of the regression results and to allow for a nonlinear association between these variables and
stock returns. In particular, we calculate the scaled ranks of firm size and dedicated institutional
ownership for each firm by ranking these variables into ten groups (0 to 9) by decile points and
dividing the group number by 9, so that the scaled rank ranges between 0 and 1. SIZE_R is the
decile ranks of firm size as measured by the logarithm of total assets at the beginning of each
year. To calculate INST_R, we first obtain information on institutional ownership from
CDA/Spectrum database, and then classify institutions based on their investment behaviors using
the widely used factor and cluster analysis approach described in Bushee (1998, 2001). Three
clusters are formed based on institutions’ portfolio turnover and concentration. Specifically,
dedicated institutions are those with lowest portfolio turnover and highest concentration,
transient institutions are those with highest portfolio turnover and lowest concentration, and
quasi-indexer institutions are those with relatively low portfolio turnover and concentration.
INST_R is the decile ranks of dedicated institutional ownership at the end of the quarter prior to
the release of CSR reports. 3 Adjusting CSR performance by industry medians yields qualitatively similar results.

21
RD is R&D intensity, which captures a strategic lever that may influence stock market
reactions to CSR (Luo and Bhattacharya 2009). It is calculated as the R&D expenses deflated by
sales of the previous year. Luo and Bhattacharya (2006, 2009) find that, by improving a firm’s
innovativeness and product performance, RD can enhance the impact of CSR on customer
satisfaction and, subsequently, firm value.
AD is advertising intensity, calculated as the advertising expenses deflated by sales of the
previous year. We control for advertising intensity because it has been found to influence the
relationship between CSR performance and firm value (Servaes and Tamayo (2013).
FIRST is a dummy variable, equal to one if the CSR report is the inaugural CSR report of
the firm, and zero otherwise. We include this variable to account for potential differences in
market reactions to inaugural vs. subsequent CSR reports.
We also include a few key financial metrics that may influence investor reactions to CSR
reports. ROA, return on assets, measures a firm’s profitability and is calculated as income before
extraordinary items for the previous year divided by total assets at the beginning of each year.
BTM, the book-to-market ratio, measures a firm’s growth opportunity and is calculated as the
book value of equity divided by the market value of equity at the beginning of each year. LEV,
financial leverage, measures a firm’s financial risk, and is calculated as total liabilities divided by
total assets at the beginning of each year. LIQUIDITY is number of shares traded in the previous
year divided by the number of shares outstanding at the beginning of each year.
Hypothesis 1 suggests that the coefficient on CSRSCORE, β10, in equation 3, should be
positive. To test hypotheses 2 and 3, we add the moderating effects of firm size, dedicated
institutional ownership, and R&D intensity to the previous model.

22
dummiesyearandindustryCSRSCORERD
CSRSCORERINSTCSRSCORERSIZECSRSCORELIQUIDITY
LEVBTMROAFIRSTADRDRINSTRSIZECAR
*
*_*_
__
13
1211109
876543210
(4)
Hypothesis 2 suggests that β11 and β12 in equation 4 should be negative, while hypothesis
3 suggests that β13 should be positive.
4. Sample and Descriptive Statistics
Our sample consists of Fortune 500 companies that have identifiable release dates of
standalone CSR reports in the period 2005 to 2011. We identify the release dates of standalone
CSR reports issued by Fortune 500 companies by searching various internet sources, including
Corporate Social Responsibility newswire, CorporateRegister.com, Business wire, Reuters,
PRweb, and company websites (the newsroom or investor relations section). We search for press
releases using terms including “Corporate Social Responsibility report,” “release,” “today,” and
other similar terms4. We verify the release dates by reading the press releases. To control for
confounding effects, we check for other major news concerning the firm and eliminate the firm-
date observation if there is annual report release or merger and acquisition announcement on the
same date or the day before or after the date. We exclude firms when their press releases do not
provide the exact release date of the CSR reports (N = 63) and firms who publish integrated
annual reports (e.g., Southwest Airlines, United Technologies). In total, we have 139 firms with
328 release dates of CSR reports in the period from 2005 to 2011.
4 For “Corporate social responsibility report,” we also use similar terms such as corporate responsibility report, corporate/global citizenship report, and sustainability report. For “release,” we also use similar terms such as publish, announce, issue, is/becomes available.
23
We get daily stock prices and trading volume from CRSP, CSR performance from KLD
dataset, company data and financial information from COMPUSTAT, and institutional
ownership data from CDA/Spectrum S34. We delete 6 CSR reports due to missing stock prices
or CSR performance. After merging data from these various sources, our final sample includes
322 CSR report releases for 136 unique firms.
Table 1, Panel A shows the distribution of sample firms by year and the descriptive
statistics of the key variables for sample firms in each year. Overall, there is a steadily increasing
trend in the number of Fortune 500 firms with identifiable release dates of standalone CSR
reports from 5 in year 2005 to 91 in year 2011. Table 1, Panel B presents the distribution of CSR
reports and sample firms by industry, based on Barth et al.’s (1998) industry classifications. The
Durable Manufacturing industry has the largest number of CSR reports (46) as well as the largest
number of unique firms (19). The Food industry and the Retail industry have the second largest
number of CSR reports (38 and 37, respectively) as well as the second largest number of unique
firms (16 for each industry). On the other hand, the Mining and Construction industry and the
Service industry have the smallest number of CSR reports (5 and 7, respectively) and the
smallest number of unique firms (3 and 4, respectively) in our sample.
Table 2 provides descriptive statistics of the main variables and the correlations among
them. The mean CSRSCORE is .069. In our sample, Exxon Mobil, Walmart, and Tyson Foods
are among the firms with the lowest CSR performance (CSRSCOREs in 2010 for these firms are
-.27, -.26, and -.22, respectively). On the other side of the spectrum, Texas Instruments, Xerox,
Proctor & Gamble, and Gap are among the firms with the highest CSR performance
(CSRSCOREs in 2011 for these firms are .50, .45, .43, and .42, respectively); notably, these

24
firms also ranked among top 40 in the well-known Corporate Responsibility Magazine’s 100
Best Corporate Citizens (Corporate Responsibility Magazine 2012).
We find that SIZE is negatively correlated with the level of institutional ownership
(INST). CSR performance (CSRSCORE) is negatively correlated with SIZE and leverage (LEV).
In addition, firms that publish their inaugural standalone CSR reports (i.e., FIRST = 1) tend to
have lower CSR performance relative to firms that have already published several standalone
CSR reports (correlation = -0.16). This is consistent with research indicating that publishing
CSR reports helps improve a firm’s subsequent CSR performance (Bhattacharya et al. 2011).
Finally, a firm’s CSR performance is also positively associated with R&D intensity (RD),
Advertising intensity (AD), and profitability (ROA).
An initial question of interest is whether and how firms that issue standalone CSR
reports (reporting firms) are different from firms that do not issue standalone CSR reports (non-
reporting firms). To examine this, we start with all Fortune 500 firms with non-missing values
for necessary financial information and CSR performance (444 firms). We then classify the firms
into three groups based on whether they release annual stand-alone CSR reports in our study
period (2005-2011): reporting firms with identifiable CSR reporting dates, reporting firms with
unidentifiable CSR reporting dates, and non-reporting firms.
Table 3, Panel A presents descriptive statistics for the main variables separately for these
three groups. We identify 136 (63) firms with identifiable (unidentifiable) reporting dates and
245 non-reporting firms. Relative to non-reporting firms, reporting firms with identifiable dates
are significantly larger (Size: 10.070 versus 9.091, p < .01), more profitable (ROA: .058 vs. .045,
p<.01), and have better CSR performance (CSRSCORE: 0.034 vs. -0.012, p < .01). Relative to

25
non-reporting firms, reporting firms with non-identifiable dates are larger (9.826 vs. 9.091, p
< .01), but have similar CSR performance (CSRSCORE: -.006 vs. -.012, p = .51).
To conduct multivariate analysis of the differences between reporting firms and non-
reporting firms, we estimate the following Probit model on the determinants of voluntary CSR
reporting.
CSRSCORELIQUIDITY
LEVBTMROAADRDINSTSIZEDISCLOSE
00
00000000 (5)
DISCLOSE is a dummy variable equal to zero if the firm is a non-reporting firm which
does not release annual CSR reports during our sample period, and one otherwise. All the
independent variables are as defined in model (3) and are measured as averages over the sample
period 2005-2011. Table 3, Panel B provides the Probit regression results. In Column I, we
exclude reporting firms with non-identifiable reporting dates. In Column II, we include reporting
firms with non-identifiable reporting dates. Regression results are similar across both
specifications of the dependent variable. We find that, all else equal, larger firms and firms with
higher CSR performance are more likely to issue standalone CSR reports. Larger firms face
more stakeholder pressure to disclose their non-financial performance, and are likely to have the
requisite resources to compile standalone CSR reports (KPMG 2011). In addition, firms with
higher CSR performance have a stronger incentive to disclose (Dhaliwal 2011).
Finally, we find that Leverage is negatively associated with likelihood of CSR reporting.
Given that firms with higher financial leverage are less likely to engage in CSR activities (e.g.,
Kim et al. 2012), one possible explanation for this result is that firms with tighter debt constraints
have lower motivation to disclose their CSR performance because of their lower CSR
involvement.
26
5. Empirical Results
5.1. Stock Market Reactions to the Release of CSR Reports
Before testing our hypotheses, we first examine whether the stock market reacts to the
release of CSR reports by looking at the absolute abnormal returns and abnormal trading
volumes, which are metrics of investor responses unconditional on the market expectations.
Following prior literature (e.g., Cready and Hurtt 2002; Bushee et al. 2011), daily absolute
abnormal returns are computed as the difference between abnormal returns (AR) on each event
day and the mean daily abnormal returns during the estimation period, divided by the standard
deviation of daily abnormal returns during the estimation period. Daily absolute abnormal
returns are then aggregated during the event window to get cumulative absolute abnormal returns
(CABS_SAR). Table 4, Panel A provides the mean and median of cumulative absolute abnormal
returns. There is a significant spike in cumulative absolute abnormal returns during the 3-day and
5-day event windows, as indicated by the significantly positive means of CABS_ SAR in both
event windows (0.249 and 0.539, respectively, both p < 0.01). The significant cumulative
absolute abnormal returns suggest that investors do respond to standalone CSR reports,
supporting the information content of standalone CSR reports.
To calculate abnormal trading volume, we first perform log transformation of daily
trading volumes because doing so will decrease the skewness of trading volume and lead to
better specified statistical tests (Bamber et al. 2011). Following Asthana et al. (2004) and Miller
(2010), we define abnormal trading volume, AVOL, as the mean logarithm of daily trading
volume during the event period minus the mean logarithm of daily trading volume during the
estimation period, deflated by the standard deviation of the logarithm of daily trading volume
during the estimation period. The estimation period begins 50 days before the event period and

27
ends 21 days before the event period. Table 4, Panel B provides the descriptive statistics of
abnormal trading volumes. There is a significant increase in trading volumes during the 3-day
and 5-day event windows (mean AVOL: 0.138 and 0.150, respectively, both p < 0.05), providing
evidence for investor reactions to standalone CSR reports.
Table 4, Panel C provides the mean and median of signed cumulative abnormal returns
during the three-day event window (-1, 1) and the five-day event window (-2, 2). The cumulative
abnormal stock returns across the three (five) day event window has a mean of 0.15% (-0.13%)
and a median of 0.04% (0.11%), all are not significant. The insignificant means of signed CAR,
combined with the significantly positive means of CABS_ SAR and AVOL, strongly suggests
that there exists a large amount of cross-sectional variations in abnormal returns across the
sample firms.
Hypotheses 1-3 suggest that the market reactions to releases of CSR reports will be
positively related to a firm’s CSR performance, and that the strength of the relationship between
abnormal returns and CSR performance will depend on firm information environment (i.e., firm
size, dedicated institutional ownership) and R&D intensity. To explore the cross-sectional
variations in the cumulative abnormal returns around the releases of CSR reports, we partition
the full sample into two subsamples based on the median of firm size, dedicated institutional
ownership, and R&D intensity, respectively. We then plot CAR during the three-day event
window (-1, 1) for low corporate social performance firms (CSRSCORE below its median) and
high corporate social performance firms (CSRSCORE above its median) conditional on firm size,
dedicated institutional ownership, and R&D intensity in Figure 1.
Figure 1, Panel A reveals that high CSP firms experience significantly higher CAR than
low CSP firms for the subsample of small firms (untabulated p-value < 0.05), but not for the

28
subsample of large firms. Similarly, Figure 1, Panel B reveals that high CSP firms experience
significantly higher CAR than low CSP firms for the subsample of firms with low dedicated
institutional ownership (untabulated p-value < 0.05), but not for the subsample of firms with
high dedicated institutional ownership. Figure1, Panel C indicates that high CSP firms
experience significantly higher CAR than low CSP firms for the subsample of firms with high
R&D intensity (untabulated p-value < 0.10), but not for the subsample of firms with low R&D
intensity.
Overall, the univariate results from price and volume responses unconditional on news
suggest that annual stand-alone CSR reports have information content and the market reacts to
new information released in these reports. Further, the differences in the market reactions to CSR
reports conditional on firm size, dedicated institutional ownership, and R&D intensity provide
preliminary evidence consistent with hypotheses 1-3.
5.2. Multivariate Analysis of Stock Market Reactions to CSR Reports
Table 5 presents the OLS regression results of our empirical models. In Column I, the
independent variables include all control variables and CSRSCORE. In Column II, we add three
interaction terms, SIZE_R*CSRSCORE, INST_R*CSRSCORE, and RD*CSRSCORE. All
control variables, except LIQUIDITY, are not significant. LIQUIDITY has a significant and
negative coefficient in Column II, suggesting that market reactions to CSR reports are smaller
for firms with higher liquidity.
H1 predicts that abnormal returns to releases of CSR reports are positively related to a
firm’s CSR performance. Across both model specifications, the coefficient of CSRSCORE is
significant and positive (coeff. = 0.029, p < 0.05; coeff. = 0.091, p < 0.01; in Column I, II,

29
respectively), suggesting that, all else equal, market reactions to CSR reports are more positive
for firms with higher CSR performance. Therefore, H1 is supported.
H2 predicts that, for firms in a better information environment, as indicated by a larger
firm size or a higher level of dedicated institutional ownership, the positive association between
CSR performance and abnormal returns is smaller. Table 5, Column II shows that
SIZE_R*CSRSCORE has a significant and negative coefficient (coeff. = -0.066, p < 0.05).
Similarly, INST_R*CSRSCORE also has a significant and negative coefficient (coeff. = -0.088,
p < .01). These results suggest that, consistent with H2, the positive relationship between CSR
performance and abnormal returns becomes smaller as firm size (as well as level of dedicated
institutional ownership) increases.
H3 predicts a positive moderating role of RD in the relationship between CSR
performance and abnormal returns. Consistent with H3, Table 5, Column II shows a significant
and positive coefficient for RD*CSRSCORE (coeff. = 0.421, p < 0.05), suggesting that the
positive relationship between CSR performance and abnormal returns gets larger for firms with
higher R&D intensity.
5.3. CSR Reporting and the Value Relevance of CSR
H4 predicts that the value relevance of CSR performance will be higher for firms issuing
standalone CSR reports. In testing this prediction, we use a changes model to examine the value
relevance of CSR for the sample that includes both reporting firms and non-reporting firms
during the period of 2005-2011 (2,127 observations). Barth et al. (2001) suggest that, if
researchers intend to investigate what is reflected in firm value, they should use a levels model;
however, if the timeliness of accounting amounts is part of the research question, then a changes

30
model is more appropriate. Our inquiry involves determining the effects of standalone CSR
reports on the timeliness of stock prices incorporating CSR performance, suggesting that a
changes model may be more appropriate. Further, compared to a levels model, a changes model
is less likely to be subject to econometric problems, such as the omitted variable bias (Kothari
and Zimmerman 1995). We thus use the following changes model to examine the value
relevance of CSR performance.
it
itititit
effectsyearandfirmfixedLAMBDADISCLOSELAMBDA
CSRSCOREDISCLOSEDISCLOSECSRSCORENITLTAMV
*
*
87
6543210 (6)
Δ represents the changes in the following variables at the end of year t relative to the end
of year t-1. MV is the market value of equity. TA and TL are total assets and liabilities,
respectively. NI is defined as income before extraordinary items. All the variables are deflated by
the market value of equity at the beginning of each year. DISCLOSE is a dummy variable equal
to one if standalone CSR reports are released for the year, and zero otherwise.
Following Givoly et al. (2010), we consider the possible endogeneity problem regarding
the decision to issue CSR standalone reports by using the two-stage Heckman procedure
(Heckman 1979). In the first stage, model (5) is estimated for all the firm-year observations.
Estimates of the Probit model (5) are then used to compute the inverse Mills ratio for each
observation in the sample. In the second stage, we include the inverse Mills ratio (LAMBDA) as
a control variable, and allow the coefficient on the inverse Mills ratio to vary between reporting
firms and non-reporting firms by including the interaction term DISCLOSE*LAMBDA.
Table 6 reports the regression results. Table 6, Column I shows that, without considering
the effect of voluntary CSR disclosure on the value relevance of CSR performance, changes in
CSR performance is not related to changes in market value (coeff. = 0.172, NS). However, after
considering the difference in value relevance of CSR between reporting firms and non-reporting

31
firms, Column II shows a significant and positive coefficient on DISCLOSE* ΔCSRSCORE
(coeff. = 0.637, p < 0.05). The results indicate that when a firm releases a standalone CSR report,
changes in CSR performance is positively related to changes in market value. In other words,
standalone CSR reports significantly increases the value relevance of CSR performance.
6. Discussion
Do investors care about CSR? Should firms devote significant resources to
communicating their CSR performance to investors? Our study helps managers answer these
important questions. This research examines stock market reactions to CSR communications,
specifically, stand-alone CSR reports. We find positive cumulative absolute abnormal returns
and positive abnormal trading volume around the releases of CSR reports, suggesting that
investors are reacting to CSR reports. Further, we document a positive association between the
abnormal returns to a firm’s CSR report and its CSR performance. This association is less
positive for firms in a better information environment, suggesting that CSR information for these
firms may have already been incorporated into stock prices through other information channels
(Atiase 1989). Also importantly, the association between the abnormal returns and CSR
performance is more positive for firms with high R&D, suggesting that R&D magnifies the
business value of CSR (Luo and Bhattacharya 2006, 2009). Finally, we find that CSR reporting
enhances the value relevance of CSR performance.
6.1 Theoretical Implications
This study is the first to look at stock market reactions to strategic firm CSR
communication (i.e., CSR reports). It has significant implications for research on CSR

32
communication, CSR in general, as well as research on voluntary disclosure. While prior
research on CSR communication has largely focused on consumers (e.g., Schuler and Cording
2006; Servaes and Tamayo 2013) and employees (Bhattacharya, Sen and Korschun 2011, 2008),
we examine investor reactions to strategic CSR communication, specifically CSR reports. As
investors become more interested in non-financial, social and environmental performance
information about the firm, and an increasing number of firms issue annual standalone CSR
reports (KPMG 2011), it is a question of high theoretical and practical importance to investigate
whether and how investors react to the release of CSR reports. Our results provide convincing
evidence that investors do care about CSR performance and indeed use information disclosed in
standalone CSR reports to adjust their expectations about a firm’s future financial performance
and the associated risks. This highlights the importance of CSR reports as a strategic means to
communicate a firm’s social and environmental performance to the investor community. Further,
our finding on the moderating role of information environment suggests that CSR reports
function in conjunction with other CSR communication channels. When investors already have
acquired information about a firm’s CSR performance from other sources, as in the case of a
firm with a strong information environment, their reactions to CSR reports are smaller.
By providing insights into the exact relationship between CSR performance and firm
financial performance, our research extends prior CSR literature in several ways. First, prior
research has not been able to unambiguously establish a causal link from CSR to firm financial
performance due to several methodological limitations (e.g., omitted variable bias, use of
association tests; Margolis and Walsh 2003; Servaes and Tamayo 2013). In contrast, event study
methodology isolates contextual variables and thus enables us to draw a causal relationship
between CSR performance and firm financial performance. Our findings rigorously establish a
33
positive causal link from CSR to firm financial performance, as measured by abnormal stock
returns to the release of CSR reports. This helps to resolve the controversies surrounding whether
CSR creates financial value or not, and attests to the importance of CSR as a long-term strategic
investment.
Second, not all CSR performance is equal in the eyes of investors. The positive
moderating role of R&D in the relationship between abnormal returns and CSR performance
indicates that investors are evaluating firm CSR performance not in isolation but in light of the
firm’s key strategic levers such as R&D. Prior research has suggested that R&D affects how
customers react to a firm’s CSR (e.g., Handelman and Arnold 1999; Luo and Bhattacharya 2006);
we extend this line of research by showing that investors, another key stakeholder group, also
positively value the synergy between CSR and R&D.
This study also contributes to the voluntary disclosure literature in finance and
accounting. Prior research tends to focus on voluntary financial disclosure, such as management
forecasts (e.g., Hutton et al. 2003) and conference calls (e.g., Bushee et al. 2004). To the best of
our knowledge, our study is the first to examine whether and how the stock market reacts to
voluntary non-financial disclosure (i.e., CSR reports). Our finding strengthens the argument that
non-financial CSR reports play a critical role in supplementing firm financial disclosure and
enhancing information transparency to investors and other important stakeholders (Dhaliwal et al.
2011, Perrini 2006). Further, the information environment has been shown in prior accounting
research to influence market reactions to financial reports and earnings announcements. We
extend this line of research by documenting that, in the case of voluntary non-financial
disclosure such as CSR reports, the information environment plays a similar role; all else equal,

34
the relationship between abnormal stock returns and CSR performance is less positive for firms
with a superior information environment.
6.2 Practical implications
This study offers several implications strategic CSR communication. CSR
communication is critical for firms seeking to unlock the numerous business benefits from their
CSR. Also, stakeholders increasingly expect firms to be transparent about, and be accountable
for their social and environmental performance (Gray 2006; KPMG 2011; Perrini 2006). Among
various means of CSR communication, standalone CSR reports have gained prominence.
However, many firms are still unsure about whether they should publish CSR reports or not (van
Wensen et al. 2011). CSR reporting may incur considerable costs, such as cost associated with
data compilation and assurance, the reporting procedure, and publication of results. Further,
managers may believe that their most important stakeholders, especially investors, may not value
CSR performance. Our findings showcase the importance and benefits of CSR reporting. Firms,
particularly those with superior CSR performance, will reap significant benefits by releasing
standalone CSR reports. Managers should resort to CSR reporting as an important means to
complement financial disclosure and to better guide investor expectations about long term firm
financial performance.
One interesting finding is that, while our analysis indicates that larger firms are more
likely to issue CSR reports, it is the smaller firms, or more generally, firms in an inferior
information environment, who will reap greater benefits (i.e., greater abnormal returns) from
their CSR performance by issuing CSR reports. The message for practitioners is that firms

35
should conduct careful cost-benefit analysis and make informed decision regarding whether or
not to issue standalone CSR reports.
Our results also have implications for managers and CSR professionals. Too often, firms
pursue CSR strategies in isolation from the broader business strategies. Yet we show that the
relationship between abnormal returns and CSR performance is contingent on key strategic
factor such as R&D intensity. Managers should mindfully connect CSR initiatives with core
business initiatives such as innovation projects or capability building initiatives. Such broad,
holistic approach to CSR has the potential to create maximal long term financial value.

36
References Asthana, S., Balsam, S., and Sankaraguruswamy, S. (2004). Differential response of small versus
large investors to 10-K filings on EDGAR. The Accounting Review, 79(3), 571-589
Atliase, R. K. (1985), “Predisclosure Information, Firm Capitalization, and Security Price Behavior around Earnings Announcements,” Journal of Accounting Research, 23(1), 21-36.
Bamber, L., Barron, O. E., & Stevens, D. E. (2011). Trading Volume around Earnings Announcements and Other Financial Reports: Theory, Research Design, Empirical Evidence, and Directions for Future Research. Contemporary Accounting Research, 28(2), 431-471
Barney, J. (1991), “Firms Resources and Sustained Competitive Advantage,” Journal of Management, 17: 771-792.
Barth, M. E., W. H. Beaver, and W. R. Landsman (1998), “Relative Valuation Roles of Equity Book Value and Net Income as a Function of Financial Health,” Journal of Accounting and Economics, 25: 1-34.
Barth, M. E., Beaver, W. H., & Landsman, W. R. (2001). The relevance of the value relevance literature for financial accounting standard setting: another view. Journal of accounting and economics, 31(1), 77-104.
Bhattacharya, C.B., S. Sen, and D. Korschun (2008), “Using corporate social responsibility to win the war for talent,” MIT Sloan Management Review, 49 (2), 37-44.
Bonini, S., T. M. Koller, and P. Mirvis (2009), “Valuing Social Responsibility Programs,” McKinsey on Finance, 32 (Summer), 11-18.
Branco, M., & L. Rodrigues, (2008). “Factors Influencing Social Responsibility Disclosure by Portuguese Companies,” Journal of Business Ethics, 83(4), 685-701
Brown, T., and P. A. Dacin (1997), “The Company and the Product: Corporate Associations and Consumer Product Responses,” Journal of Marketing, 61 (January), 68-84.
Brown, W., E. Hellan, and J. Smith (2006), “Corporate Philanthropic Practices,” Journal of Corporate Finance, 12 (5), 855-877.
Bushee, B. J. (2001), “Do Institutional Investors Prefer Near-Term Earnings over Long-Run Value?” Contemporary Accounting Research, 18(2), 207-246
Bushee, B. J. (1998), “The Influence of Institutional Investors in Myopic R&D Investment Behavior,” The Accounting Review, 73(3), 305-333.
Bushee, B. J., Jung, M. J., & Miller, G. S. (2011). “Conference Presentations and the Disclosure Milieu,” Journal of Accounting Research, 49(5), 1163-1192.
Clacher, I., and J. Hagendorff (2012), “Do Announcements about Corporate Social Responsibility Create or Destroy Shareholder Wealth? Evidence from the UK,” Journal of Business Ethics, 106, 253-266.
Collins, D. W., Gong, G., & Hribar, P. (2003). Investor sophistication and the mispricing of accruals. Review of Accounting Studies, 8(2-3), 251-276.

37
Cready, W. M., & Hurtt, D. N. (2002). “Assessing Investor Response to Information Events Using Return and Volume Metrics,” The Accounting Review, 77(4), 891-909.
Dawkins, J.: 2004, ‘Corporate Responsibility: The Communication Challenge,’ Journal of Communication Management, 9(2), 108-119.
Dhaliwal, D. S., Oliver Zhen Li, Albert Tsang, and Yong George Yang (2011), “Voluntary Nonfinancial Disclosure and the Cost of Equity Capital: The Initiation of Corporate Social Responsibility Reporting,” The Accounting Review, 86(1), 59-100.
Dhaliwal, D. S., Radhakrishnan, S., Tsang, A., & Yong George, Y. (2012). Nonfinancial Disclosure and Analyst Forecast Accuracy: International Evidence on Corporate Social Responsibility Disclosure. The Accounting Review, 87(3), 723-759.
Du, S., C.B. Bhattacharya, and S. Sen (2011), “Corporate Social Responsibility and Competitive Advantage: Overcoming the Trust Barrier,” Management Science, 57(9), 1528-45.
--, -- and -- (2010), “Maximizing business returns to corporate social responsibility (CSR): the role of CSR communication,” International Journal of Management Review, 12(1), 8-19.
El-Gazzar, S. M. (1998), “Predisclosure Information and Institutional Ownership: A Cross-Sectional Examination of Market Revaluations during Earnings Announcement Periods,” The Accounting Review, 73(1), 119-129.
Fama, Eugene, and K. R. French (1993), “Common Risk Factors in Returns to Stocks and Bonds,” Journal of Financial Economics, 33(1), 3-56.
Fombrun, C. J., & Gardberg, N. A. (2000). “Opportunity platforms and safety nets: Corporate citizenship and reputational risk,” Business & Society Review, 105(1), 85-106.
Forbes (2012), “The Top 10 Trends in CSR for 2012,” accessed in May 2013, available at http: http://www.forbes.com/sites/forbesleadershipforum/2012/01/18/the-top-10-trends-in-csr-for-2012/
Freeman, R. E. (1984), Strategic Management: A Stakeholder Approach, Boston: Pitman.
Friedman, M. (1970), “The Social Responsibility of Business is to Increase Its Profits,” New York Times Magazine, September 13: 122-126.
Gatignon, H., and J. M. Xuereb (1997), “Strategic Orientation of the Firm and New Product Performance,” Journal of Marketing Research, 34(February), 77-90.
Givoly, D., Hayn, C. K., & Katz, S. P. (2010). Does public ownership of equity improve earnings quality? The Accounting Review, 85(1), 195-225.
Godfrey, P. C., C.B. Merrill, and J. M. Hansen (2009), “The Relationship between Corporate Social Responsibility and Shareholder Value: An Empirical Test of the Risk Management Hypothesis,” Strategic Management Journal, 30(4), 425-45.
Gray, R. (2006), Social, Environmental and Sustainability Reporting and Organisational Value Creation? Whose Value? Whose Creation? Accounting, Auditing & Accountability Journal, 6(19), 793-819.
Handelman, J. M., & Arnold, S. J. (1999), “The Role of Marketing Actions with a Social Dimension: Appeals to the Institutional Environment,” Journal of Marketing, 63(3), 33-48

38
Hart, S. L. (1995), “A Natural-Resource-Based View of the Firm,” Academy of Management Review, 20(4), 986-1014.
Heckman, J. J. (1979), “Sample Selection Bias as a Specification Error,” Econometrica, 47(1), 153-161.
Hutton, A. P., Miller, G. S., & Skinner, D. J. (2003). The Role of Supplementary Statements with Management Earnings Forecasts. Journal of Accounting Research, 41(5), 867-890.
Hyman, M. R., & Mathur, I. (2005). “Retrospective and Prospective Views on the Marketing/Finance Interface.,” Journal of The Academy of Marketing Science, 33(4), 390-400.
Kanter, R. (1999). From Spare Change to Real Change. Harvard Business Review, 77(3), 122-132
Klein, J., & Dawar, N. (2004). Corporate Social Responsibility and Consumers' Attributions and Brand Evaluations in a Product–Harm Crisis. International Journal of Research in Marketing, 21(3), 203-217
Kolk, A. (2003). Trends in Sustainability Reporting by the Fortune Global 250. Business Strategy & The Environment, 12(5), 279-291.
Kothari, S. P., and J. B. Warner (2007), “Econometrics of Event Studies,” Handbook of Corporate Finance: Empirical Corporate Finance.
Kothari, S. P., and J. L. Zimmerman (1995), “Price and return models,” Journal of Accounting and economics, 20(2), 155-192.
KPMG (2011), “KPMG International Survey of Corporate Responsibility Reporting 2011,” accessed May 2013, available at: http://www.kpmg.com/PT/pt/IssuesAndInsights/Documents/corporate-responsibility2011.pdf
Lacy, P. (2010), “Investors Don’t Care About Sustainability…” BusinessWeek, November 09, available at http://www.businessweek.com/managing/content/nov2010/ca2010118_925615.htm. Accessed July 22, 2013.
Luo, X., and C.B. Bhattacharya (2006), “Corporate Social Responsibility, Customer Satisfaction, and Market Value,” Journal of Marketing, 70 (October), 1-18.
--, and – (2009), “The Debate Over Doing Good: Corporate Social Performance, Strategic Marketing Levers, and Firm-Idiosyncratic Risk,” Journal of Marketing, 73(6), 198-213.
Maignan, I., and D. A. Ralston: 2002, ‘Corporate Social Responsibility in Europe and the U.S.: Insights from Businesses’ Self-Presentations,’ Journal of International Business Studies, 33(3), 497-514.
Margolis, J. D., and J. P. Walsh (2003), “Misery Loves Companies: Rethinking Social Initiatives by Business,” Administrative Science Quarterly, 48, 268-305.
Meznar, M. B., D. Nigh, and C. C. Y. Kwok (1994), “Effects of Announcements of Withdrawal from South Africa on Stockholder Wealth,” Academy of Management Journal, 37, 1633-1648.

39
Miller, B. P. (2010), “The effects of reporting complexity on small and large investor trading,” The Accounting Review, 85(6), 2107-2143.
Mizik, N., and R. Jacobson (2003), “Trading off Between Value Creation and Value Appropriation: The Financial Implications of Shifts in Strategic Emphasis,” Journal of Marketing, 67(1), 63-76.
Orlitzky, M., F. L. Schmidt, and S. L. Rynes (2003), “Corporate Social and Financial Performance: A Meta-Analysis,” Organization Studies, 24 (3), 403-441.
Perrini, F. (2006). The Practitioner's Perspective on Non-Financial Reporting. California Management Review, 48(2), 73-103.
Porter, M. E. , and M. R. Kramer (2011), “Creating Shared Value,” Harvard Business Review, 89 (1/2), 62-77.
Preston, L. E., and O’Bannon, D. P. (1997), “The Corporate Social – Financial Performance Relationship: A Typology and Analysis,” Business and Society, 36: 419-429.
Ro, B. T. (1988), “Firm Size and the Information Content of Annual Earnings Announcements,” Contemporary Accounting Research, 4(2), 438-449.
Russo, M. V., and P. A. Fouts (1997), “A Resource-based Perspective on Corporate Environmental Performance and Profitability,” Academy of Management Journal, 40, 534-559
Schuler, D. A., & Cording, M. (2006). A Corporate Social Performance – Corporate Financial Performance Behavioral Model for Consumers, Academy Of Management Review, 31(3), 540-558
Servaes, H., & Tamayo, A. (2013). The Impact of Corporate Social Responsibility on Firm Value: The Role of Customer Awareness. Management Science, 59(5), 1045-1061
Sharma, S., and H. Vredenburg (1998), “Proactive Corporate Environmental Strategy and the Development of Competitively Valuable Organizational Capabilities,” Strategic Management Journal, 19(8), 729-753.
Surroca, J., J. A. Tribo, and S. Waddock (2010), “Corporate Responsibility and Financial Performance: The Role of Intangible Resources,” Strategic Management Journal, 31(5), 463-490.
Stieglitz, N., and K.s Heine (2007), “Innovations and the Role of Complementarities in a Strategic Theory of the Firm,” Strategic Management Journal, 28(1), 1-15.
Thompson J. A., and J. S. Bunderson: 2003, ‘Violations of principle: Ideological currency in the psychological contract’, Academy of Management Journal, 28(4), 571-586.
Turban, D. B., Greening D. W. (1997), Corporate Social Performance and Organizational Attractiveness to Prospective Employees, Academy of Management Journal, 40(3), 658-672.
Waddock, S. (2003), “Myths and Realities of Social Investing,” Organization and Environment. 16, 369-380.
Waddock, S., and Samuel B. Graves (1997), “The Corporate Social Performance-Financial Performance Link,” Strategic Management Journal, 18(4), 303-19.

40
Winter, Sidney G. (2000), “The Satisficing Principle in Capability Learning,” Strategic Management Journal, 21(10/11), 981-96.
Zahra, Shaker A. and Gerard George (2002), “Absorptive Capacity: A Review, Reconceptualization, and Extension,” Academy of Management Review, 27(2), 185-203.

41
Figure 1: Stock Market Reactions to CSR Communication
CSR Communication
Release of CSR Reports
Abnormal Stock Returns
Information Environment
R&D Investment
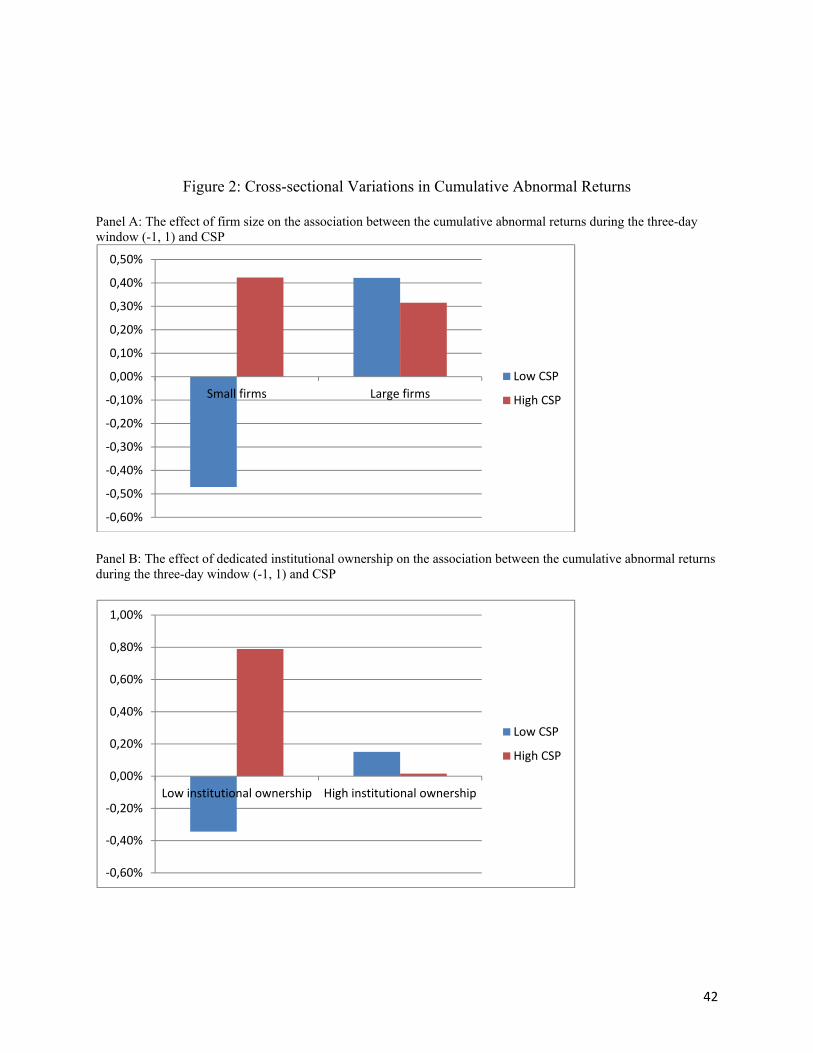
42
Figure 2: Cross-sectional Variations in Cumulative Abnormal Returns
Panel A: The effect of firm size on the association between the cumulative abnormal returns during the three-day window (-1, 1) and CSP
Panel B: The effect of dedicated institutional ownership on the association between the cumulative abnormal returns during the three-day window (-1, 1) and CSP
‐0,60%
‐0,50%
‐0,40%
‐0,30%
‐0,20%
‐0,10%
0,00%
0,10%
0,20%
0,30%
0,40%
0,50%
Small firms Large firms
Low CSP
High CSP
‐0,60%
‐0,40%
‐0,20%
0,00%
0,20%
0,40%
0,60%
0,80%
1,00%
Low institutional ownership High institutional ownership
Low CSP
High CSP

43
Panel C: The effect of R&D intensity on the association between the cumulative abnormal returns during the three-day window (-1, 1) and CSP
‐1,00%
‐0,80%
‐0,60%
‐0,40%
‐0,20%
0,00%
0,20%
0,40%
0,60%
0,80%
Low RD High RDLow CSP
High CSP

44
Table 1: Distribution of Sample Firms Panel A: Means of the main variables by year
Year 2005
(N = 5)
Year 2006
(N=13)
Year 2007
(N = 21)
Year 2008
(N=49)
Year 2009
(N=60)
Year 2010
(N=83)
Year 2011
(N=91)
SIZE 10.259 10.674 10.175 10.346 10.359 10.334 10.279
INST 0.331 0.292 0.339 0.367 0.321 0.330 0.350
RD 0.060 0.030 0.031 0.029 0.033 0.028 0.023
AD 0.027 0.018 0.024 0.016 0.015 0.014 0.012
FIRST 0.200 0.154 0.048 0.143 0.083 0.072 0.088
ROA 0.069 0.071 0.085 0.071 0.054 0.047 0.066
BTM 0.243 0.438 0.268 0.372 0.483 0.474 0.469
LEV 0.257 0.255 0.201 0.239 0.242 0.263 0.249
LIQUIDITY 0.989 1.314 1.740 2.045 2.962 3.174 2.821
CSRSCORE 0.056 0.023 0.076 0.038 0.043 0.029 0.145
Panel B: Distribution by industry Industry No. of CSR reports Percent No. of Firms Percent 1. Mining and construction
5 0.02 3 0.02
2. Food 38 0.12 16 0.12
3. Textiles, printing, and Publishing
11 0.03 5 0.04
4. Chemicals 15 0.05 9 0.07
5. Pharmaceuticals 20 0.06 6 0.04
6. Extractive industries
25 0.08 6 0.04
7. Durable manufacturers
46 0.14 19 0.14
8. Computers 36 0.11 13 0.10
9. Transportation 23 0.07 10 0.07
10. Utilities 27 0.08 16 0.12
11. Retail 37 0.11 16 0.12
12. Financial institutions
25 0.08 12 0.09
13. Services 7 0.02 4 0.03
14. Other 7 0.02 1 0.01
Total 322 1.00 136 1.00

45
Table 2: Summary Statistics and Correlations
MEAN Std Dev. SIZE INST RD AD FIRST ROA BTM LEV LIQUIDITY
SIZE 10.327 1.381
INST 0.338 0.126 -0.25
RD 0.028 0.052 0.00 -0.05
AD 0.015 0.026 -0.09 -0.03 -0.04
FIRST 0.093 0.291 -0.09 0.06 -0.14 0.13
ROA 0.061 0.063 -0.16 -0.01 0.07 0.16 -0.06
BTM 0.440 0.413 0.21 -0.07 -0.04 -0.16 0.02 -0.24
LEV 0.247 0.159 0.08 -0.10 -0.23 0.02 0.16 -0.32 -0.23
LIQUIDITY 2.660 1.784 -0.11 0.11 0.10 -0.09 0.08 -0.30 -0.08 0.07
CSRSCORE 0.069 0.152 -0.10 0.03 0.28 0.19 -0.16 0.14 -0.06 -0.09 -0.02
N=322
A correlation coefficient in bold indicates that the correlation is statistically significant at the 10 percent level or better. See Appendix A for variable definitions.
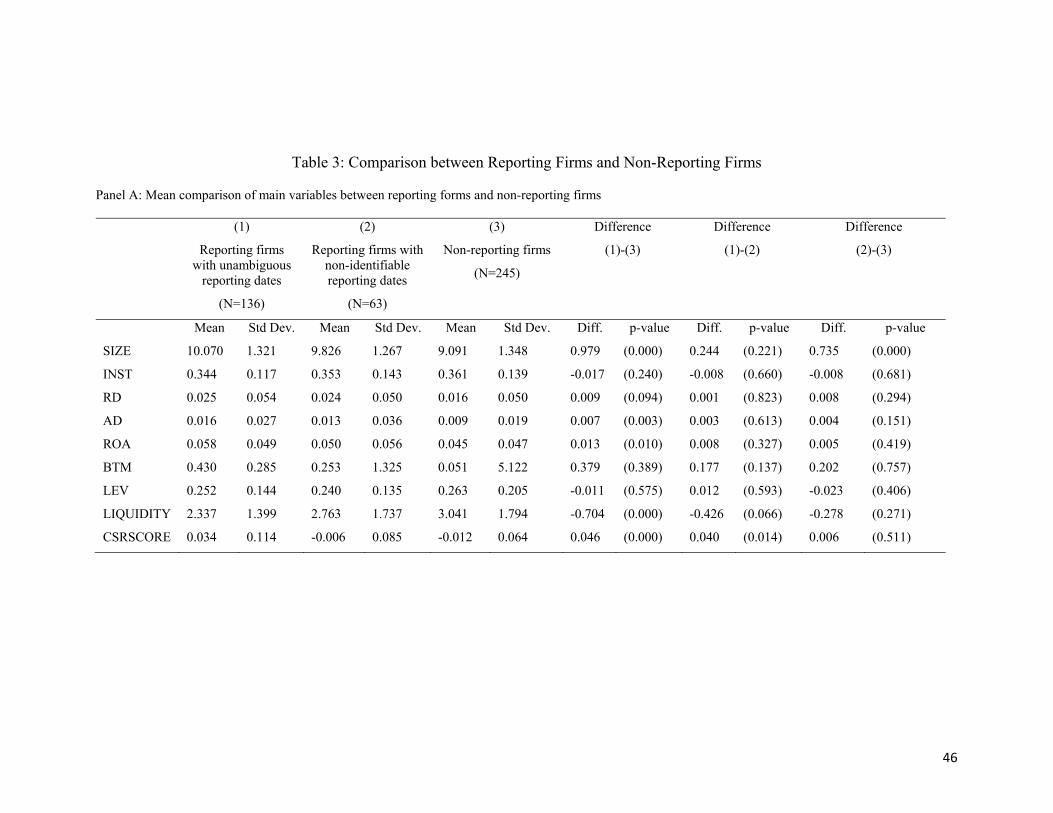
46
Table 3: Comparison between Reporting Firms and Non-Reporting Firms
Panel A: Mean comparison of main variables between reporting forms and non-reporting firms
(1)
Reporting firms with unambiguous
reporting dates
(N=136)
(2)
Reporting firms with non-identifiable reporting dates
(N=63)
(3)
Non-reporting firms
(N=245)
Difference
(1)-(3)
Difference
(1)-(2)
Difference
(2)-(3)
Mean Std Dev. Mean Std Dev. Mean Std Dev. Diff. p-value Diff. p-value Diff. p-value
SIZE 10.070 1.321 9.826 1.267 9.091 1.348 0.979 (0.000) 0.244 (0.221) 0.735 (0.000)
INST 0.344 0.117 0.353 0.143 0.361 0.139 -0.017 (0.240) -0.008 (0.660) -0.008 (0.681)
RD 0.025 0.054 0.024 0.050 0.016 0.050 0.009 (0.094) 0.001 (0.823) 0.008 (0.294)
AD 0.016 0.027 0.013 0.036 0.009 0.019 0.007 (0.003) 0.003 (0.613) 0.004 (0.151)
ROA 0.058 0.049 0.050 0.056 0.045 0.047 0.013 (0.010) 0.008 (0.327) 0.005 (0.419)
BTM 0.430 0.285 0.253 1.325 0.051 5.122 0.379 (0.389) 0.177 (0.137) 0.202 (0.757)
LEV 0.252 0.144 0.240 0.135 0.263 0.205 -0.011 (0.575) 0.012 (0.593) -0.023 (0.406)
LIQUIDITY 2.337 1.399 2.763 1.737 3.041 1.794 -0.704 (0.000) -0.426 (0.066) -0.278 (0.271)
CSRSCORE 0.034 0.114 -0.006 0.085 -0.012 0.064 0.046 (0.000) 0.040 (0.014) 0.006 (0.511)

47
Panel B: Determinants of voluntary CSR reporting
I II Reporting firms (excluding firms with ambiguous
reporting dates) vs. non-reporting firms Reporting firms (including firms with ambiguous
reporting dates) vs. non-reporting firms Coefficient p-value Coefficient p-value
SIZE 0.606 0.000 0.543 0.000
INST 0.175 0.790 -0.155 0.776
RD -1.014 0.687 0.461 0.830
AD 0.247 0.948 2.442 0.422
ROA -0.006 0.998 0.942 0.595
BTM 0.052 0.335 0.032 0.421
LEV -1.237 0.047 -1.375 0.010
LIQUIDITY -0.052 0.340 -0.005 0.918
CSRSCORE 4.553 0.000 3.376 0.000
Industry dummies Yes Yes
Pseudo R2 0.337 0.294
Likelihood ratio 156.50 154.82
No. of Observations with dep. var. = 1
136
199
No. of Observations 381 444

48
Table 4: Stock Market Reactions to the Release of CSR reports
Panel A: Cumulative absolute abnormal returns
Window CABS_SAR
Mean
(p value)
Median
(p value)
(-1, 1) 0.249 -0.163
(0.032) (0.874)
(-2, 2) 0.539 -0.025
(0.002) (0.201)
Panel B: Abnormal trading volumes
Window
AVOL
Mean
(p value)
Median
(p value)
(-1, 1) 0.138 0.042
(0.029) (0.093)
(-2, 2) 0.150 0.043
(0.014) (0.072)
Panel C: Signed cumulative abnormal returns
Window CAR
Mean
(p value)
Median
(p value)
(-1, 1) 0.15% 0.04%
(0.381) (0.737)
(-2, 2) -0.13% 0.11%
(0.515) (0.750)

49
Table 5: Determinants of Abnormal Returns to Standalone CSR Reports
Dependent Variable: CAR (1, -1)
I II
Coefficient t-statistic Coefficient t-statistic
SIZE_R -0.003 -0.39 0.005 0.70
INST_R -0.006 -1.09 0.003 0.45
RD 0.014 0.32 -0.078 -1.31
AD 0.063 1.02 0.049 0.83
FIRST -0.002 -0.30 -0.001 -0.17
ROA -0.013 -0.46 -0.022 -0.80
BTM 0.006 1.47 0.006 1.34
LEV 0.015 1.15 0.018 1.50
LIQUIDITY -0.000 -0.50 -0.002 -1.94*
CSRSCORE 0.029 2.26** 0.091 3.60***
SIZE_R*CSRSCORE -0.066 -2.09**
INST_R*CSRSCORE -0.088 -3.10***
RD*CSRSCORE 0.433 2.20**
Fixed Industry and Year Effects Yes Yes
Adjusted R2 0.025 0.081
No. of Observations 322 322

50
Table 6: Difference in CSR’s value relevance between reporting firms and non-reporting firms
Dependent Variable: ΔMV
Coefficient t-statistic Coefficient t-statistic
ΔTA 0.437 (10.04)*** 0.435 (10.02)***
ΔTL -0.435 (-9.03)*** -0.431 (-8.97)***
ΔNI 0.406 (14.96)*** 0.385 (13.68)***
ΔCSRSCORE 0.172 (1.16) 0.169 (0.81)
DISCLOSE
-0.101 (-1.40)
DISCLOSE* ΔCSRSCORE
0.637 (2.08)**
LAMBDA
0.151 (2.43)**
DISCLOSE*LAMBDA
0.033 (0.62)
Fixed Firms and Year Effects Yes Yes
Adjusted R2 0.400 0.403
No. of Observations 2,127 2,127


