EVALUATION OF THE EFFECTS OF MALTODEXTRIN ANDMICROFLUIDIZATION ON THE RHEOLOGICAL AND TEXTURAL
PROPERTIES OF COOKIE AND COOKIE DOUGH
A THESIS SUBMITTED TOTHE GRADUATE SCHOOL OF NATURAL AND APPLIED SCIENCES
OFMIDDLE EAST TECHNICAL UNIVERSITY
BY
TUĞÇE TOPALOĞLU
IN PARTIAL FULFILLMENT OF THE REQUIREMENTSFOR
THE DEGREE OF MASTER OF SCIENCEIN
FOOD ENGINEERING
JULY 2015


Approval of the thesis:
EVALUATION OF THE EFFECTS OF MALTODEXTRIN ANDMICROFLUIDIZATION ON THE RHEOLOGICAL AND
TEXTURAL PROPERTIES OF COOKIE AND COOKIE DOUGH
submitted by TUĞÇE TOPALOĞLU in partial fulfillment of the requirementsfor the degree of Master of Science in Food Engineering Department,Middle East Technical University by,
Prof. Dr. Gülbin Dural ÜnverDean, Graduate School of Natural and Applied Sciences
Prof. Dr. Alev BayındırlıHead of Department, Food Engineering
Assist. Prof. Dr. Umut YücelSupervisor, Food Engineering Department, METU
Examining Committee Members:
Prof. Dr. Alev BayındırlıFood Engineering Department, METU
Assist. Prof. Dr. Umut YücelFood Engineering Department, METU
Assoc. Prof. Dr. İlkay ŞensoyFood Engineering Department, METU
Assist. Prof. Dr. H. Mecit ÖztopFood Engineering Department, METU
Assist. Prof. Dr. Cem BaltacıoğluFood Engineering Department, Niğde University
Date: July 3, 2015

I hereby declare that all information in this document has been ob-tained and presented in accordance with academic rules and ethicalconduct. I also declare that, as required by these rules and conduct,I have fully cited and referenced all material and results that are notoriginal to this work.
Name, Last Name: TUĞÇE TOPALOĞLU
Signature :
iv
ABSTRACT
EVALUATION OF THE EFFECTS OF MALTODEXTRIN ANDMICROFLUIDIZATION ON THE RHEOLOGICAL AND TEXTURAL
PROPERTIES OF COOKIE AND COOKIE DOUGH
Topaloğlu, Tuğçe
M.S., Department of Food Engineering
Supervisor : Assist. Prof. Dr. Umut Yücel
July 2015, 117 pages
Several health problems like diabetes and obesity are associated with consump-
tion of highly fatty food, leading consumers to be more conscious about what
they eat. This concern has been a driving factor for manufacturers to research
and develop low- or reduced-fat products. Therefore, the baking industry finds
new ways to respond to the demands. For this reason, fat replacement in bakery
products has gained a popularity. Maltodextrin is commonly used to trim fat
from bakery products because it gives some properties to products similar to
those of fat.
The main objective of this study was to investigate the effects of microfluidiza-
tion (MF) and maltodextrin (MD) (DE18) (0%, 3.75%, and 7.5%) on the rheo-
logical and textural properties of cookie and cookie dough. Also, the effects of
type of fat - palm olein (PON) and palm stearin (PS) - on the rheological and
textural properties of both cookie and cookie dough were investigated.
v

In the first part of the study, the rheological (elastic and viscous moduli) and
hardness and cohesiveness of cookie doughs containing different percentages (0%,
3.75%, and 7.5%) of MD were observed. The cookie doughs showed a solid-
like behavior. The elastic and viscous moduli were low in the control dough,
containing 100% PON or PS without no fat replacement, compared to those
of dough with fat replacement. It was observed that the use of MD at 0%,
3.75%, and 7.5% increases both storage and loss moduli in all samples. Also,
the G’ and G” of doughs containing MD at 0%, 3.75%, and 7.5% were affected
by the application of MF at 1000 Bar. The cookie dough containing 3.75% MD,
PON2, had the closest G’ and G” values to the control cookie dough. Dough
hardness increased as the percentage of MD increased whereas increase in the
amount of MD led to reduction in the moisture content of doughs both with MF
and without MF. However, MF did not have a significant effect on the moisture
contents of doughs. Control dough had the highest cohesiveness value. However,
replacement of fat with MD at different percentages decreased cohesiveness of
doughs.
In the second part of this study, the effects of replacement of fat by MD at
0%, 3.75%, and 7.5% on quality of cookies (hardness, moisture content, size,
and color) were determined. There was an increase in the hardness of cookies
with the increasing percentages of MD. Consequently, it could be concluded
that there was a correlated relation between cookie and its dough in terms of
hardness because increase in hardness of both cookie and dough was observed
with increasing MD level. Also, MD increased the moisture content of the
cookies, compared to control cookie. There were no significant changes in the
heights of all types of cookies after 7 day storage. In diameter measurement,
there was no significant difference between the cookies without MF at 0%, 3.75%,
and 7.5% MD. However, there was a significant difference in diameter between
cookies with MF at different MD percentages. On the other hand, the increase
of MD levels in the cookie and the use of MF process did not any significant
effect on the change of the cookie color. The significant effect of MF on color
was only observed with the cookie prepared from 0-day dough including PS.
In the study, it was found that the use of MF at 0%, 3.75%, and 7.5% MD was
vi

not required for the cookie making because no significant effect on hardness and
size of cookie was observed. On the contrary, using MD18 was a good option for
fat replacement in cookie making in terms of textural and rheological properties.
Also, when 3.75% MD was used, the cookie (PON2) with 20% less calorie was
obtained if the control cookie was considered as a baseline.
Keywords: maltodextrin, cookie, rheology, texture, microfluidization
vii
ÖZ
MALTODEKSTRİNİN VE MİKROFLUDİZASYONUN KURABİYENİNREOLOJİK VE YAPISAL ÖZELLİKLERİ ÜZERİNDEKİ ETKİLERİ
Topaloğlu, Tuğçe
Yüksek Lisans, Gıda Mühendisliği Bölümü
Tez Yöneticisi : Yrd. Doç. Dr. Umut Yücel
Temmuz 2015 , 117 sayfa
Diabet ve obezite gibi pek çok sağlık problemi yüksek yağlı gıdalardan kaynak-
lanmaktadır. Bu durum insanları ne yedikleri konusunda daha bilinçli olmaya
yönlendirmektedir. Bu kaygı üreticileri, az ya da azaltılmış yağlı ürünlerin gelişti-
rilmesi konusundaki talepleri karşılamak üzere yeni yolların bulunması için teşvik
etmektedir. Unlu mamuller endüstrisi bu taleplere cevap vermek için yeni yol-
lar bulmaktadır. Bu yüzden unlu mamullerde yağ yerine geçen madde kullanımı
popülarite kazanmıştır. Genellikle maltodextrin unlu mamullerde yağı azaltmak
için kullanılmaktadır çünkü MD ürüne, yağın verdiği özelliklere benzer özellikler
vermektedir.
Bu çalışmanın amacı, microfludizasyon (MF) ve farklı yüzdelerdeki maltodext-
rinin (MD) (DE18) (0%, 3.75%, ve 7.5%) bisküvi ve bisküvi hamurunun reolojik
ve tekstürel özelliklerine etkisinin araştırılmasıdır. Ayrıca, farklı yağ çeşitlerinin
- palm olein (PON) ve palm stearin (PS) - bisküvi ve bisküvi hamurunun reolojik
viii

ve tekstürel özellikleri üzerindeki etkisine de bakılacaktır.
Çalışmanın ilk bölümünde, farklı yüzdelerde maltodextrin (0%, 3.75%, and 7.5%)
içeren bisküvi hamurlarının reolojik (elastik ve viskoz modülleri), sertlik ve ya-
pışkanlık özellikleri gözlenecektir. Bisküvi hamurları katı benzeri bir davranış
göstermektedir. 100% PON ya da PS içeren ve yağ yerine geçen madde kullanıl-
mamış olan kontrol hamurlarındaki elastik ve viskoz modülleri yağ yerine geçen
madde içeren hamurlara kıyasla daha düşüktür. 0%, 3.75%, ve 7.5% MD kulla-
nımının tüm örneklerde elastik ve viskoz modüllerini artırdığı gözlemlenmiştir.
Ayrıca, 0%, 3.75%, ve.5% MD içeren hamurların G’ ve G” değerleri 500 Bar’da
MF uygulanmasından etkilenmektedir. Elastik ve viskoz değerleri kontrol hamur
değerlerine en yakın olan hamur 3.75% maltodextrin içeren bisküvi hamurudur
(PON2). Maltodextrin yüzdesinin artışı hamurların sertliğini artırırken, hamur-
ların nem miktarının azalmasına sebep olmaktadır. Ancak nem miktarındaki
azalış MF prosesinden bağımsız olarak gerçekleşmektedir, diğer bir deyişle MF
prosesinin hamurların nem miktarında dikkate değer bir etkisi yoktur. Kontrol
hamurları en yüksek yapışkanlık değerine sahiptir ve yağın farklı maltodextrin
yüzdeleriyle yer değiştirmesi de hamurların yapışkanlığının azalmasına neden
olmaktadır.
Çalışmanın ikinci bölümünde ise yağın farklı yüzdelerde maltodextrin ile değiş-
tirilmesinin bisküvinin kalitesini (sertlik, nem miktarı, boyut ve renk) nasıl etki-
lediği araştırılmaktadır. Maltodextrin yüzdelerindeki artış bisküvinin sertliğinde
de artışa sebep olmaktadır. Bunun sonucu olarak da sertlik açısından bisküvi ve
bisküvi hamuru arasında ilişki olduğu söylenebilir çünkü MD seviyesinin artırıl-
masıyla bisküvi ve bisküvi hamurunun ikisinin de sertliğinde artış görülmektedir.
Ayrıca MD kullanımı bisküvilerin nem miktarını kontrol bisküviye kıyasla artır-
maktadır. 7 günlük muhafaza sonrasında tüm bisküvilerin yüksekliğinde önemli
bir değişiklik gözlenmemektedir. MF işlemine maruz kalmamış ve maltodekstrin
(0%, 3.75%, ve 7.5%) içeren bisküvilerin çaplarında bir değişiklik görülmüyor.
Ancak MF işlemi uygulanan farklı maltodextrin yüzdesine sahip örneklerin çap-
larında farklılıklar mevcuttur. Diğer taraftan, bisküvi içinde bulunan MD sevi-
yesindeki artış ve MF kullanımı bisküvi renginin değişimi üstünde dikkate değer
bir etkiye sahip değildir. MF’nin renk üzerindeki dikkate değer etkisi sadece PS
ix

içeren 0-günlük hamurundan hazırlanan bisküvide gözlemlenmektedir.
Sonuç olarak, çalışmada, bisküvi yapımı için 0%, 3.75% ve 7.5% MD seviyele-
rinde MF kullanımının gerekli olmadığı bulunmuştur çünkü bisküvilerin sertliği
ve boyutu üzerinde dikkate değer bir etki gözlemlenmemektedir. Tam tersine,
tekstürel ve reolojik açılardan bakıldığında yağ yerine geçen madde olarak mal-
todekstrin kullanılması iyi bir seçenektir. Ayrıca, kontrol bisküvisi baz alınırsa,
3.75% MD kulanıldığında, %20 daha az kalorili bisküvi elde edilmektedir.
Anahtar Kelimeler: maltodekstrin, kurabiye, reoloji, tekstür, mikrofludizasyon
x

To my grandfather, Refik BALCI for his endless love and faith in me...
xi
ACKNOWLEDGMENTS
First and foremost, I must acknowledge my parents, Yüksel & Cemile Topaloğlu
and my sister, Ece Topaloğlu for their understanding, patience and support
which have never ceased. I am indebted to my father for always being with me
during my experiments and to my mother and sister for their endless motivation.
Also, I could have not accomplished this study without my extended family. I
am extremely thankful to my aunts, uncles and cousins for their endless support,
patience and understanding. I am especially thankful to my grandfather, Refik
Balcı for his endless love and faith in me.
My special gratitude goes to Erdem Dikbaş who is my soul mate. He has always
supported me to write and helped with his wisdom. When I decided to give up
completing the thesis, he leaded me with his experience, so I was encouraged
again. I am really grateful to him for his patience. I hope we will always be
together against all other challenges during our lives.
I wish to express my sincere thanks to my supervisor, Umut Yücel, for his valu-
able guidance and support. He continually shared his knowledge and encouraged
me to finish this study.
I would like to thank to my classmate Tuğçe Koç for helping me with her time
and support. She has always been with me during my experiments; we worked
with her till late at nights. Also, my thanks go to Necmiye Ertüzün for providing
inspiration and advices whenever I needed during this thesis. She always advised
me to think positively and stay calm when I felt depressed about thesis, and I
see that she was right, because I was successful to finish it.
I also would like to extend my gratitude to my close friends Kemal Arı and Sinem
Öz without whom I could not have completed this work. They have always
supported and encouraged me with endless understanding and motivation.
xii

Many of friends from METU have helped immensely. Berna Tepeyüksel and
Saliha Acarlı provided motivation with their positive energies when I was de-
moralized, and they supported me to work again and again, so I am grateful for
their sacrifice and friendship. I would like to also extend my sincere thanks to
Özge Çimen for her time and attention to support me whenever I needed.
I wish to thank the research assistants, Elif Yıldız, Sevil Çıkrıkçı, and Selen
Güner. They have been very supportive since the days I began working on my
thesis.
Finally, I would like to express my gratitude to my workmates in UNDP for
reading my thesis and making helpful suggestions and for their understanding
and tolerance in giving me time to study on my thesis.
xiii

TABLE OF CONTENTS
ABSTRACT . . . . . . . . . . . . . . . . . . . . . . . . . . . . . . . . . v
ÖZ . . . . . . . . . . . . . . . . . . . . . . . . . . . . . . . . . . . . . . . viii
ACKNOWLEDGMENTS . . . . . . . . . . . . . . . . . . . . . . . . . . xii
TABLE OF CONTENTS . . . . . . . . . . . . . . . . . . . . . . . . . . xiv
LIST OF TABLES . . . . . . . . . . . . . . . . . . . . . . . . . . . . . . xviii
LIST OF FIGURES . . . . . . . . . . . . . . . . . . . . . . . . . . . . . xix
LIST OF ABBREVIATIONS . . . . . . . . . . . . . . . . . . . . . . . . xxv
CHAPTERS
1 INTRODUCTION . . . . . . . . . . . . . . . . . . . . . . . . . 1
1.1 Cookie Dough . . . . . . . . . . . . . . . . . . . . . . . 1
1.1.1 Cookie Ingredients . . . . . . . . . . . . . . . . 3
1.1.1.1 Flour . . . . . . . . . . . . . . . . . 3
1.1.1.2 Sugar . . . . . . . . . . . . . . . . . 5
1.1.1.3 Fat . . . . . . . . . . . . . . . . . . 6
1.1.1.4 Non-fat Dry Milk . . . . . . . . . . 7
1.1.1.5 Salt . . . . . . . . . . . . . . . . . . 7
xiv
1.1.1.6 Leavening agent . . . . . . . . . . . 7
1.1.1.7 Water . . . . . . . . . . . . . . . . 8
1.1.2 Dough Quality . . . . . . . . . . . . . . . . . . 8
1.1.2.1 Rheology of Cookie Dough . . . . . 10
1.1.3 Cookie Quality . . . . . . . . . . . . . . . . . . 11
1.1.3.1 Texture of Cookie and Cookie Dough 13
1.2 Consumption of Fatty Foods and Health Effects . . . . . 13
1.3 Functions of Fat in Baked Products . . . . . . . . . . . 15
1.4 Reduction of Fat in Cookies/Baked Products . . . . . . 16
1.5 Fat Replacers . . . . . . . . . . . . . . . . . . . . . . . . 16
1.5.1 Lipid-Based Fat Substitutes . . . . . . . . . . . 17
1.5.2 Protein-Based Fat Substitutes . . . . . . . . . 18
1.5.3 Carbohydrate-Based Fat Substitutes . . . . . 19
1.6 Carbohydrate-Based Fat Mimetics, particularly Maltodex-trin, in Baked Products . . . . . . . . . . . . . . . . . . 20
1.6.1 Maltodextrin . . . . . . . . . . . . . . . . . . . 21
1.7 Emulsion . . . . . . . . . . . . . . . . . . . . . . . . . . 22
1.7.1 Homogenization with High-Speed Blenders andMicro-Fluidization Process . . . . . . . . . . . 23
1.7.1.1 High-Speed Blenders . . . . . . . . 24
1.7.1.2 Micro-Fluidization Process . . . . . 24
1.8 Objective of the Study . . . . . . . . . . . . . . . . . . . 25
xv

2 METHODS & MATERIALS . . . . . . . . . . . . . . . . . . . . 27
2.1 Materials . . . . . . . . . . . . . . . . . . . . . . . . . . 27
2.2 Methods . . . . . . . . . . . . . . . . . . . . . . . . . . 27
2.2.1 Preparation of Control Cookie Doughs . . . . . 27
2.2.2 Preparation of Cookie Doughs with EmulsifiedFats . . . . . . . . . . . . . . . . . . . . . . . . 29
2.2.2.1 Preparation of Cookie Doughs with-out Microfluidization . . . . . . . . 29
2.2.2.2 Preparation of Cookie Doughs withMicrofluidization . . . . . . . . . . 31
2.2.3 Dough Analysis . . . . . . . . . . . . . . . . . 33
2.2.3.1 Dough Rheology Analysis . . . . . 33
2.2.3.2 Dough Texture Analysis . . . . . . 34
2.2.4 Cookie Analysis . . . . . . . . . . . . . . . . . 35
2.2.4.1 Cookie Texture Analysis . . . . . . 35
2.2.4.2 Moisture Content Determination . . 35
2.2.4.3 Scanning of Cookie . . . . . . . . . 36
2.2.4.4 Size Determination . . . . . . . . . 36
2.2.4.5 Color Determination . . . . . . . . 36
2.2.4.6 Statistical Analysis . . . . . . . . . 36
3 RESULTS AND DISCUSSION . . . . . . . . . . . . . . . . . . 39
3.1 Dough Texture and Dough Moisture Content . . . . . . 39
3.2 Dough Rheology . . . . . . . . . . . . . . . . . . . . . . 48
xvi

3.2.1 Elastic Property of Doughs . . . . . . . . . . . 48
3.2.2 Viscous Property of Doughs . . . . . . . . . . 55
3.3 Cookie Hardness . . . . . . . . . . . . . . . . . . . . . . 57
3.3.1 Comparison of Dough and Cookie in terms ofHardness . . . . . . . . . . . . . . . . . . . . . 67
3.4 Water Loss in the Cookies . . . . . . . . . . . . . . . . . 67
3.5 Change in Height and Diameter . . . . . . . . . . . . . . 69
3.6 Color Determination . . . . . . . . . . . . . . . . . . . . 75
4 CONCLUSION AND RECOMMENDATION . . . . . . . . . . 85
REFERENCES . . . . . . . . . . . . . . . . . . . . . . . . . . . . . . . . 89
APPENDICES
A PHOTOGRAPHS OF COOKIE SAMPLES . . . . . . . . . . . 99
B A FIGURE RELATED TO CALCULATIONS OF TEXTUREANALYSIS . . . . . . . . . . . . . . . . . . . . . . . . . . . . . 103
C RESULTS OF ELASTIC AND VISCOUS MODULI OF DOUGH 105
xvii

LIST OF TABLES
TABLES
Table 1.1 Comparison of Types of Biscuits (Cauvain & Young, 2008) . . 2
Table 1.2 Comparison of Flours in Bread and Biscuits (Edwards, 2007) . 3
Table 2.1 Control Cookie Dough Recipe-AACC Method 10-52 - Micro
Sugar-Snap Cookies . . . . . . . . . . . . . . . . . . . . . . . . . . . 28
Table 2.2 Naming of Doughs According to Types of Fat Used in The
Preparation of Control Cookie Dough . . . . . . . . . . . . . . . . . 29
Table 2.3 Modified Cookie Dough Recipe . . . . . . . . . . . . . . . . . 30
Table 2.4 Emulsion Formulation . . . . . . . . . . . . . . . . . . . . . . 30
Table 2.5 Naming of doughs according to the percentage of maltodextrin 31
Table 2.6 Naming of doughs according to the exposure of microfluidiza-
tion process and the percentage of maltodextrin . . . . . . . . . . . 33
xviii

LIST OF FIGURES
FIGURES
Figure 1.1 Chemical Sturucture of Maltodextrin (TO: NDA 21-321, 7 ,
n.d.) . . . . . . . . . . . . . . . . . . . . . . . . . . . . . . . . . . . 21
Figure 1.2 Emulsions are thermodynamically unstable systems (Akoh &
Min, 2008). . . . . . . . . . . . . . . . . . . . . . . . . . . . . . . . . 23
Figure 1.3 Homogenization process can be divided into two steps: primary
homogenization and secondary homogenization (Akoh & Min, 2008). 24
Figure 2.1 Homogenizer Instruments . . . . . . . . . . . . . . . . . . . . 32
Figure 3.1 The Effects of MD and MF Process on the 0-day and 7-day
Dough Hardness with PON . . . . . . . . . . . . . . . . . . . . . . . 40
Figure 3.2 The Effects of MD and MF Process on the 0-day and 7-day
Dough Hardness with PS . . . . . . . . . . . . . . . . . . . . . . . . 43
Figure 3.3 Hardness and Moisture Content of 0-day Doughs including
PON being evaluated in terms of the Percentages of Maltodextrin . 44
Figure 3.4 Hardness and Moisture Contents of 7-day Doughs including
PON being evaluated in terms of the Percentages of Maltodextrin . 46
Figure 3.5 Hardness and Moisture Contents of 0-day Doughs including
PS being evaluated in terms of the Percentages of Maltodextrin . . . 47
Figure 3.6 Hardness and Moisture Contents of 7-day Doughs including
PS being evaluated in terms of the Percentages of Maltodextrin . . . 48
xix

Figure 3.7 The Effects of MD and MF Process on the 0- day and 7-day
Cohesiveness of Doughs including PON . . . . . . . . . . . . . . . . 49
Figure 3.8 The Effects of MD and MF Process on the 0- day and 7-day
Cohesiveness of Doughs including PS . . . . . . . . . . . . . . . . . 50
Figure 3.9 The Effects of MD and MF Process on the Elastic Modulus of
0-day Doughs including PON . . . . . . . . . . . . . . . . . . . . . . 51
Figure 3.10 The Effects of MD and MF Process on the Elastic Modulus of
7-day Doughs including PON . . . . . . . . . . . . . . . . . . . . . . 52
Figure 3.11 The Effects of MD and MF Process on the Elastic Modulus of
0-day Doughs including PS . . . . . . . . . . . . . . . . . . . . . . . 53
Figure 3.12 The Effects of MD and MF Process on the Elastic Modulus of
7-day Doughs including PS . . . . . . . . . . . . . . . . . . . . . . . 54
Figure 3.13 The Effects of MD and MF Process on the Viscous Modulus
of 0-day Doughs including PON . . . . . . . . . . . . . . . . . . . . 56
Figure 3.14 The Effects of MD and MF Process on the Viscous Modulus
of 7-day Doughs including PON . . . . . . . . . . . . . . . . . . . . 57
Figure 3.15 The Effects of MD and MF Process on the Viscous Modulus
of 0-day Doughs including PS . . . . . . . . . . . . . . . . . . . . . 58
Figure 3.16 The Effects of MD and MF Process on the Viscous Modulus
of 7-day Doughs including PS . . . . . . . . . . . . . . . . . . . . . 59
Figure 3.17 The Effects of MD and MF Process on the 0- and 7- day
Hardness of Cookies Prepared from 0-day Doughs with PON . . . . 60
Figure 3.18 The Effects of MD and MF Process on the 0- and 7- day
Hardness of Cookies Prepared from 7-day Doughs with PON . . . . 61
Figure 3.19 The Effects of MD and MF Process on the 0- and 7- day Hard-
ness and Moisture Contents of Cookies Prepared from 0-day Doughs
with PS . . . . . . . . . . . . . . . . . . . . . . . . . . . . . . . . . . 62
xx

Figure 3.20 The Effects of MD and MF Process on the 0- and 7- day Hard-
ness and Moisture Contents of Cookies Prepared from 7-day Doughs
with PS . . . . . . . . . . . . . . . . . . . . . . . . . . . . . . . . . . 63
Figure 3.21 The 0th day Hardness and Moisture Contents of 0-day Doughs
including PON being evaluated in terms of the Percentages of Mal-
todextrin . . . . . . . . . . . . . . . . . . . . . . . . . . . . . . . . . 64
Figure 3.22 The 7th day Hardness and Moisture Contents of 0-day Doughs
including PON being evaluated in terms of the Percentages of Mal-
todextrin . . . . . . . . . . . . . . . . . . . . . . . . . . . . . . . . . 65
Figure 3.23 The 0th day Hardness and Moisture Contents of 7-day Doughs
including PON being evaluated in terms of the Percentages of Mal-
todextrin . . . . . . . . . . . . . . . . . . . . . . . . . . . . . . . . . 66
Figure 3.24 The 7th day Hardness and Moisture Contents of 7-day Doughs
including PON being evaluated in terms of the Percentages of Mal-
todextrin . . . . . . . . . . . . . . . . . . . . . . . . . . . . . . . . . 67
Figure 3.25 The 0th day Hardness and Moisture Contents of 0-day Doughs
including PS being evaluated in terms of the Percentages of Maltodex-
trin . . . . . . . . . . . . . . . . . . . . . . . . . . . . . . . . . . . . 68
Figure 3.26 The 7th day Hardness and Moisture Contents of 0-day Doughs
including PS being evaluated in terms of the Percentages of Maltodex-
trin . . . . . . . . . . . . . . . . . . . . . . . . . . . . . . . . . . . . 69
Figure 3.27 The 0th day Hardness and Moisture Contents of 7-day Doughs
including PS being evaluated in terms of the Percentages of Maltodex-
trin . . . . . . . . . . . . . . . . . . . . . . . . . . . . . . . . . . . . 70
Figure 3.28 The 7th day Hardness and Moisture Contents of 7-day Doughs
including PS being evaluated in terms of the Percentages of Maltodex-
trin . . . . . . . . . . . . . . . . . . . . . . . . . . . . . . . . . . . . 71
xxi
Figure 3.29 Comparison between Hardness of Cookie made from 0-day
Dough and Hardness of 0-day Dough with PON . . . . . . . . . . . 72
Figure 3.30 Comparison between Hardness of Cookie made from 0-day
Dough and Hardness of 0-day Dough with PS . . . . . . . . . . . . . 73
Figure 3.31 The Change in Water Loss of Cookies made from 0-day Doughs
with PON during 7-day Storage at Room Temperature . . . . . . . 74
Figure 3.32 The Change in Water Loss of Cookies made from 7-day Doughs
with PON during 7-day Storage at Room Temperature . . . . . . . 75
Figure 3.33 The Change in Water Loss of Cookies made from 0-day Doughs
with PS during 7-day Storage at Room Temperature . . . . . . . . . 76
Figure 3.34 The Change in Water Loss of Cookies made from 7-day Doughs
with PS during 7-day Storage at Room Temperature . . . . . . . . . 77
Figure 3.35 The Effect of MD and MF Process on the Height of the Cookies
made from 0-day Doughs with PON . . . . . . . . . . . . . . . . . . 78
Figure 3.36 The Effect of MD and MF Process on the Height of the Cookies
made from 7-day Doughs with PON . . . . . . . . . . . . . . . . . . 78
Figure 3.37 The Effect of MD and MF Process on the Height of the Cookies
made from 0-day Doughs with PS . . . . . . . . . . . . . . . . . . . 79
Figure 3.38 The Effect of MD and MF Process on the Height of the Cookies
made from 7-day Doughs with PS . . . . . . . . . . . . . . . . . . . 79
Figure 3.39 The Effect of MD and MF Process on the 0th day Hardness
and Diameter of Cookies made from 0-day Doughs with PON . . . . 80
Figure 3.40 The Effect of MD and MF Process on the 0th day Hardness
and Diameter of Cookies made from 7-day Doughs with PON . . . . 80
Figure 3.41 The Effect of MD and MF Process on the 0th day Hardness
and Diameter of Cookies made from 0-day Doughs with PS . . . . . 81
xxii

Figure 3.42 The Effect of MD and MF Process on the 0th day Hardness
and Diameter of Cookies made from 7-day Doughs with PS . . . . . 81
Figure 3.43 The Effect of MD Concentration and MF Process on Color of
Cookie Surface prepared from 0-day dough with PON . . . . . . . . 82
Figure 3.44 The Effect of MD Concentration and MF Process on Color of
Cookie Surface prepared from 7-day dough with PON . . . . . . . . 82
Figure 3.45 The Effect of MD Concentration and MF Process on Color of
Cookie Surface prepared from 0-day dough with PS . . . . . . . . . 83
Figure 3.46 The Effect of MD Concentration and MF Process on Color of
Cookie Surface prepared from 7-day dough with PS . . . . . . . . . 83
Figure A.1 The photo on the left top corner shows the control cookie, PON
day0, made from 0-day dough. The other photos on the top indicate
how different percentages of maltodextrin (DE18) affect the cookies
when they are not exposed to MF, PON1 day0, PON2 day0, PON3
day0, respectively and the bottom three photos represent how the
same percentages of maltodextrin (DE18) affect the cookies with MF,
MFPON1 day0, MFPON2 day0 and MDPON3 day0, respectively. . 99
Figure A.2 The photo on the left top corner shows the control cookie, PON
day7, made from 7-day dough. The other photos on the top indicate
how different percentages of maltodextrin (DE18) affect the cookies
when they are not exposed to MF, PON1 day7, PON2 day7, PON3
day7, respectively and the bottom three photos represent how the
same percentages of maltodextrin (DE18) affect the cookies with MF,
MFPON1 day7, MFPON2 day7 and MDPON3 day7, respectively. . 100
xxiii

Figure A.3 The photo on the left top corner shows the control cookie, PS
day0, made from 0-day dough. The other photos on the top indicate
how different percentages of maltodextrin (DE18) affect the cookies
when they are not exposed to MF, PS1 day0, PS2 day0, PS3 day0,
respectively and the bottom three photos represent how the same per-
centages of maltodextrin (DE18) affect the cookies with MF, MFPS1
day0, MFPS2 day0 and MDPS3 day0, respectively. . . . . . . . . . 100
Figure A.4 The photo on the left top corner shows the control cookie, PS
day7, made from 7-day dough. The other photos on the top indicate
how different percentages of maltodextrin (DE18) affect the cookies
when they are not exposed to MF, PS1 day7, PS2 day7, PS3 day7,
respectively and the bottom three photos represent how the same per-
centages of maltodextrin (DE18) affect the cookies with MF, MFPS1
day7, MFPS2 day7 and MDPS3 day7, respectively. . . . . . . . . . 101
Figure B.1 Texture Profile Analysis (Bourne, 2002) . . . . . . . . . . . . 103
xxiv

LIST OF ABBREVIATIONS
DE Dextrose Equivalent
MD Maltodextrin
MF Microfluidization
PON Palm Olein/Cookie or Cookie dough containing 100% palm olein
PS Palm Stearin/Cookie or Cookie dough containing 100% palmstearin
Melted PON Cookie/Cookie dough containing 100% melted palm olein
Melted PS Cookie/Cookie dough containing 100% melted palm stearin
PON1 Cookie/Cookie dough containing PON and 0% MD without MFprocess
PON2 Cookie/Cookie dough containing PON and 3.75% MD withoutMF process
PON3 Cookie/Cookie dough containing PON and 7.5% MD withoutMF process
PS1 Cookie/Cookie dough containing PS and 0% MD without MFprocess
PS2 Cookie/Cookie dough containing PS and 3.75% MD without MFprocess
PS3 Cookie/Cookie dough containing PS and 7.5% MD without MFprocess
MFPON1 Cookie/Cookie dough containing PON and 0% MD with MFprocess
MFPON2 Cookie/Cookie dough containing PON and 3.75% MD with MFprocess
MFPON3 Cookie/Cookie dough containing PON and 7.5% MD with MFprocess
MFPS1 Cookie/Cookie dough containing PS and 0% MD with MF pro-cess
MFPS2 Cookie/Cookie dough containing PS and 3.75% MD with MFprocess
MFPS3 Cookie/Cookie dough containing PS and 7.5% MD with MF pro-cess
xxv

G’ Elastic Modulus
G” Viscous Modulus
xxvi

CHAPTER 1
INTRODUCTION
1.1 Cookie Dough
The biscuit term includes broad range of baking products such as crackers, cook-
ies, even pet foods and biscuits are one of the most popular bakery products
consumed because of ready to eat nature, good nutritional quality, and avail-
ability in different varieties and affordable cost (Sudha, Vetrimani, & Leelavathi,
2007). Biscuits are classified in terms of dough types as shown in Table 1.1.
Certain kinds of cookies are made of soft dough. For the doughs which are
of soft category, gluten development is not desirable (Zoulias et al., 2000). In
these cookies, gluten development is prevented by the use of high level of sugar
and fat in cookie formulation as shown in Table 1.1. Also, all sugar cannot
dissolve in the water so that the level of sugar is high in these products whereas
most of the dry ingredients are dissolved in water. Additionally, dispersion of
fat and aqueous phase while obtaining dough without hydration of gluten may
result in problem. Therefore, these doughs are obtained by mixing in a two
stage process to firstly form an emulsion of the fat in the water and then to
add flour. Applied energy in the first stage mixing can be high and take a
longer time than in second stage because it contributes to good dispersion and
provides interaction of ingredients by promoting water absorption. The second
mixing stage, where flour is added, is very short to preclude developing the
gluten. According to investigation conducted by Edwards (2007), the results
are like obtaining a satisfactory emulsion in the first stage but avoiding gluten
1
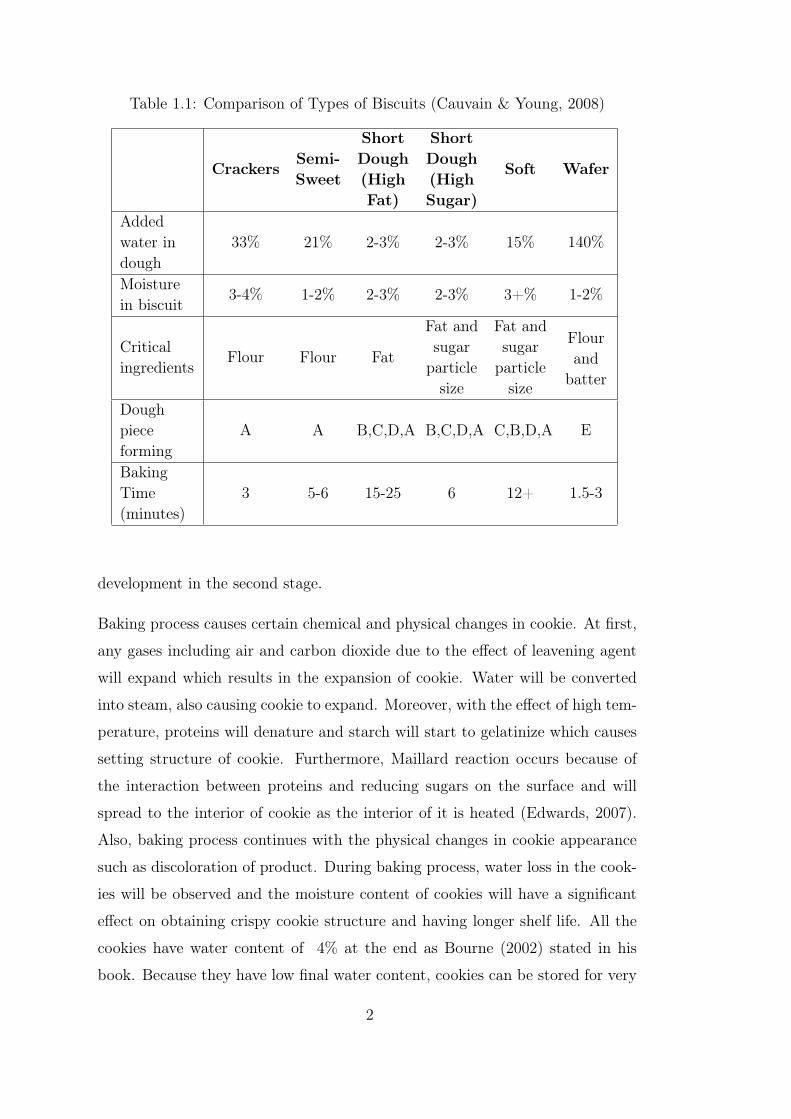
Table 1.1: Comparison of Types of Biscuits (Cauvain & Young, 2008)
CrackersSemi-Sweet
ShortDough(HighFat)
ShortDough(HighSugar)
Soft Wafer
Addedwater indough
33% 21% 2-3% 2-3% 15% 140%
Moisturein biscuit
3-4% 1-2% 2-3% 2-3% 3+% 1-2%
Criticalingredients
Flour Flour Fat
Fat andsugarparticlesize
Fat andsugarparticlesize
Flourand
batter
Doughpieceforming
A A B,C,D,A B,C,D,A C,B,D,A E
BakingTime(minutes)
3 5-6 15-25 6 12+ 1.5-3
development in the second stage.
Baking process causes certain chemical and physical changes in cookie. At first,
any gases including air and carbon dioxide due to the effect of leavening agent
will expand which results in the expansion of cookie. Water will be converted
into steam, also causing cookie to expand. Moreover, with the effect of high tem-
perature, proteins will denature and starch will start to gelatinize which causes
setting structure of cookie. Furthermore, Maillard reaction occurs because of
the interaction between proteins and reducing sugars on the surface and will
spread to the interior of cookie as the interior of it is heated (Edwards, 2007).
Also, baking process continues with the physical changes in cookie appearance
such as discoloration of product. During baking process, water loss in the cook-
ies will be observed and the moisture content of cookies will have a significant
effect on obtaining crispy cookie structure and having longer shelf life. All the
cookies have water content of 4% at the end as Bourne (2002) stated in his
book. Because they have low final water content, cookies can be stored for very
2
long times. Additionally, according to Cauvain and Young (2008), fat rancidity
can occur in cookies as a result of long storage time and low moisture content
of cookies.
1.1.1 Cookie Ingredients
Cookie formulation is generally composed of flour, sugar, fat, milk powder, leav-
ening agent, salt and water while some formulations may also include eggs, flavor
ingredients and nuts, fruits.
However, cookie formulation includes three major components, i.e. flour, sugar,
and fat. Sugar-snap cookie typically consists of 47.5–54% flour, 33.3–42% sugar
and 9.4–18% fat (Bram et al., 2008). Since each component has functions on the
quality of cookie and its dough, any slight change in the amounts and ratios of
all ingredients, especially these principal ones, affects significantly final cookie
quality and its dough quality. Consequently, it is an important point to provide
a balance in cookie formulation; thus, there are many cookie formulations and
procedures in cookie production. Therefore, it is necessary to know the functions
of cookie ingredients and to provide a proper balance in formulation to be able
to obtain cookie with desirable quality.
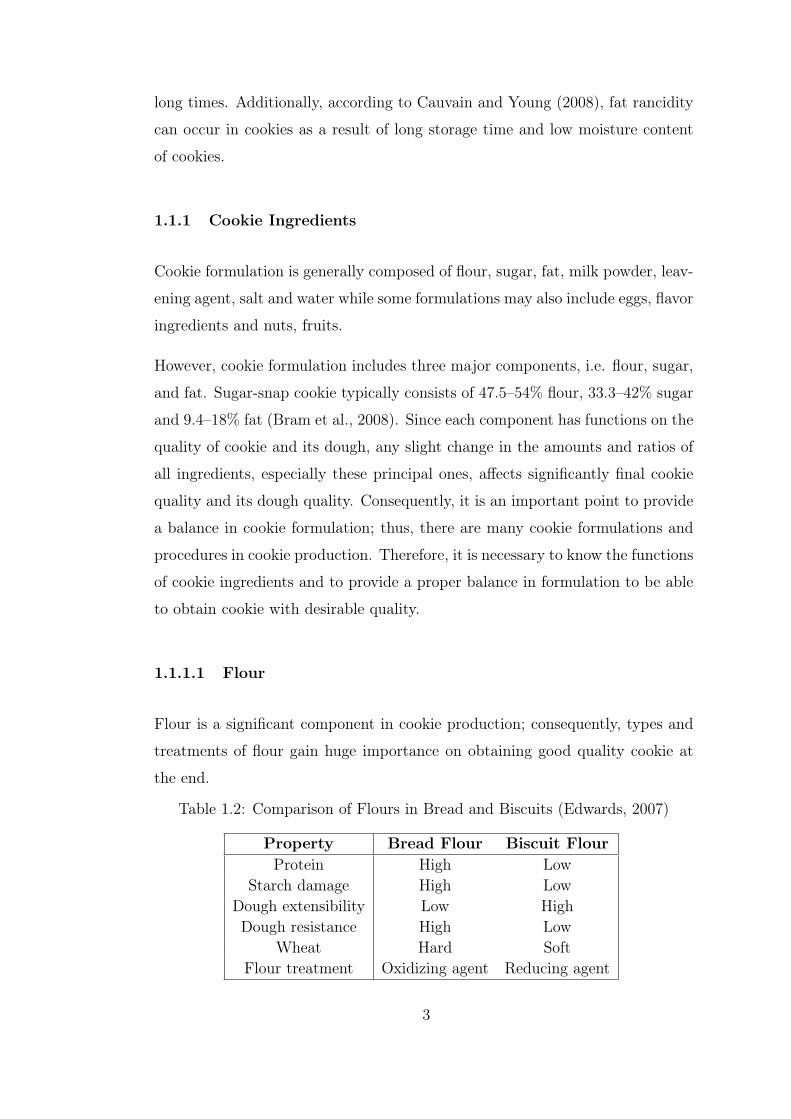
1.1.1.1 Flour
Flour is a significant component in cookie production; consequently, types and
treatments of flour gain huge importance on obtaining good quality cookie at
the end.
Table 1.2: Comparison of Flours in Bread and Biscuits (Edwards, 2007)
Property Bread Flour Biscuit FlourProtein High Low
Starch damage High LowDough extensibility Low HighDough resistance High Low
Wheat Hard SoftFlour treatment Oxidizing agent Reducing agent
3

As shown in Table 1.2, flours used in bread and cookies are compared and flour
used in the cookie production has low protein and starch damage by contrast
with bread flour. Also, soft wheat flour is preferred in the production of cookie.
For cookie, high dough extensibility is preferred while dough resistance in cookie
is not desirable (Edwards, 2007).
Flour consists of proteins, carbohydrates, lipid and fiber. Mostly, proteins and
carbohydrates among its compositions play distinctive role on the flour quality,
rheological property of dough and textural quality of final baked product. Major
ones of flour proteins are gliadins and glutenins, responsible for development
of gluten network that forms the structure of dough; consequently affects the
rheology of dough. In addition to function of proteins, the study conducted by
Bram et al. (2008) concluded that higher gluten levels decreased dough piece
weight, its density, stickiness and hardness.
Also, starch among carbohydrates in the flour mostly comes into prominence
because of the its water absorption ability that enables damaged starch to gela-
tinize. However, starch gelatinization may occur depending on the availability
of water in dough because there is a water competition among sugar, proteins
and starch.
Furthermore, water binding property of flour is an important issue for the pro-
duction of cookie having low moisture content. Thus, flour type which is soft
white wheat flour, consisting of low protein content and low damaged starch due
to their hydrophilic property is mainly preferred in cookie production (Edwards,
2007).
Furthermore, flour does not provide flavor to cookie; but affects texture, hardness
and shape of cookies (Manley, 2000). According to Bram et al. (2008), quality
of soft white wheat flour affects the diameter of cookie. Also, cookies in which
soft wheat flour is used both show large spread and uniform surface cracking
pattern (R. A. Miller & Hoseney, 1997).
4
1.1.1.2 Sugar
Sugar is one of the most important ingredients in cookie because it not only
provides sweetness to the product but also gives nutritional value, improves tex-
ture, volume, appearance, color and affects moisture retention and viscosity. In
addition to the effects of the structural and textural properties of cookies, sugar
contributes to incorporation of air into the fat during cookie dough preparation
(Wehrle et al., 1999).
According to Hoseney et al. (1994), throughout baking, the undissolved sugar
progressively dissolves, and helps cookie spread. Moreover, Hoseney et al. (1994)
states that during baking, sugar recrystallizes at the surface of cookie and that
leads to typical surface cracking pattern. Furthermore, according to the study of
Bram et al. (2008), level of sugar in the cookie dough is important issue because
cookie diameter increases and its height decreases with increasing level sugar.
Apart from these properties of sugar, it has an important function on delaying
the starch gelatinization temperature. It shifts the starch gelatinization point to
a higher temperature thus allowing the dough more time to rise in the oven due
to providing more time to gluten for its stretching (Manley, 2000) In addition,
in the medium where water is limited, sucrose competes with the starch and
gluten for water; thus, so little or no starch gelatinization is observed during
baking (Sanchez et al., 1995). As stated in the thesis of Çıkrıkçı (2013), sugar
has so many roles on the surface appearance, browning and spreading during
cookie production.
There are some investigations of the effect of sugar on the quality of cookie and
cookie dough in the study conducted by Maache-Rezzoug et al. (1998a). One of
them is that increase in the sugar concentration in a cookie dough reduces its
consistency and cohesion. Another study reveals the effects of sugar quantity
and its grain size on biscuit spreading. That is, contribution of a fine grain size
and a high concentration of sugar to a significant spreading of the biscuit is ob-
served. Next study is interested in when the sugar is sufficiently available, sugar
makes the dough softer during storage due to water holding capability of sucrose;
5

however, sugar in excess acts as a hardening agent due to its crystallization.
1.1.1.3 Fat
Many cookies and especially soft type cookies include large amounts of fat and fat
improves texture, provides desirable eating quality, and affects flavor perception.
Also, fat enhances aeration for leavening and makes more breakable cookie.
Thus, fat is a crucial component for the cookies.
Many types of fats are used in bakery industry but in particular shortenings,
partially hydrogenated oil, are widely preferred due to some providing advan-
tages such as ease handling, higher melting point and longer shelf life (Kweon et
al., 2010). Liquid shortening is often used. The use of a hydrogenated vegetable
shortening is mostly suggested for increase in effectiveness at creaming stage
(Matz, 1968).
Not only the type but also the amount of fat added to dough have a significant
effect on the viscoelastic properties of the dough (Jacob & Leelavathi, 2007).
However, the type of fat does not affect the cookie spread; but, the amount of fat
does it (Kweon et al., 2010). Cookie diameter increases when more fat is added to
dough (Pareyt et al., 2009). According to the result of study conducted by Pareyt
et al. (2009), higher fat levels results in higher spread rate (diameter/thickness).
As fat melts and and sucrose dissolves during baking, mobility in the system
increases and system mobility can probably be related to increased mobility.
Moreover, increase in fat amount added to dough raises air incorporation at
creaming stage; thus, cookie dough with lower density is obtained. Furthermore,
higher fat level lower dough hardness (Pareyt et al., 2009; Maache-Rezzoug et
al., 1998a) and reduce elastic properties (Pareyt et al., 2010). The effect of fat
on elastic properties of dough has been related to lubrication, which limits the
formation of a gluten network (Maache-Rezzoug et al., 1998a).
6

1.1.1.4 Non-fat Dry Milk
Milk powder is used in baked products for the purpose of color improvement,
water absorption, and spread-control properties, flavor and nutritional value
(Matz, 1968). Dried milk products are mostly preferred due to the convenience
of use, their longer shelf life and minimum storage space and good stability at
ordinary temperature (Matz, 1968).
Non-fat dry milk includes lactose sugar and proteins, casein, lactalbumin and lac-
toglobulin. One of the major proteins of milk is casein. Casein is the structure-
forming, and water-binding protein and it results in the formation of porous
structure in cookie and crackers. Additionally, the interaction casein with lac-
tose results in browning reactions (Matz, 1968).
1.1.1.5 Salt
Salt is used in baked products as preservative, which contributes to longer shelf
life. Moreover, it advances flavor of other ingredients in the cookie. It also in-
fluences the solubility of proteins (Çıkrıkçı, 2013). Furthermore, gluten network
formation is affected by the salt level in dough (Cauvain & Young, 2008).
1.1.1.6 Leavening agent
In baking industry, ammonium bicarbonate, sodium bicarbonate and baking
powder are mostly used as chemically leavening agent. During decomposition of
sodium bicarbonate, carbon dioxide is produced during mixing process since it
reacts with an acid and then, during baking, heat contributes to release carbon
dioxide (Çıkrıkçı, 2013). The thermal decomposition mechanism is the following
reaction:
2NaHCO3 + Heat −→ Na2CO3 + CO2 + H2O
Leavening agents are mainly inorganic salts and when added to dough, they
produce carbon dioxide which contributes to development of texture of cookie
7

during baking (Manley, 2000). Sodium bicarbonate has popularity as a gas
source because it has some favorable properties such as low cost, lack of toxicity,
ease of handling, relatively tasteless end products, and high purity of commercial
product (Matz, 1968).
Moreover, using sodium bicarbonate in cookie dough is because of adjusting pH
of dough. In addition to its advantages, its solutions are prone to be less alkaline.
If too much sodium bicarbonate is used, the cookie is excessively alkaline, cookie
will appear in a yellow color and have unpleasant taste (Edwards, 2007).
1.1.1.7 Water
Water is a solvent for sugar, salt, leavening agent, non-fat dry milk and other dry
ingredients and regulates moisture content in the final product (Çıkrıkçı, 2013).
It hydrates the flour proteins and gelatinizes starch that contributes to form
structure of cookie. Adding water to dough affects flavor, color, physical assets
of baked products (Matz, 1968). Water used in formulation of cookie is removed
during baking; however, according to Manley, the effects of water continue on
cookie quality because it provides steam that leaven the product (Archilla, 1999).
Also, the water content of final product influence eating quality and shelf life.
1.1.2 Dough Quality
In cookie making, the main ingredients are flour, water, sugar, fat, fat mimetics,
emulsifier, salt etc. The dough quality and cookie quality are governed by the
nature and quantity of the ingredients used.
Flour consists of moisture content, proteins, carbohydrates, lipid and fiber.
Mostly, proteins and carbohydrates among its compositions play distinctive role
on the flour quality, rheological and textural property of dough. Major ones of
flour proteins are gliadins and glutenins, responsible for development of gluten
network that forms the structure of dough; consequently affects the rheology of
dough. In addition to function of proteins, the study conducted by Bram et
al. (2008) concluded that higher gluten levels decreased dough piece weight, its
8

density, stickiness and hardness. Moreover, higher gluten level causes decreasing
cookie spread.
The study conducted by Petrofsky and Hoseney (1995) showed that hard wheat
gluten doughs had low G’ and G” values, indicating a possible less starch-gluten
interaction and vice versa. Also, the G’ and G” increased when proteins were
added in the formula (flour and water), if the water concentration was kept
constant (Maache-Rezzoug et al., 1998a).
Sugar improves texture,volume, appearance, color and affects moisture retention
and viscosity. Sugar also contributes to incorporation of air into the fat during
cookie dough preparation. Furthermore, according to the study of Bram et al.
(2008), level of sugar in the cookie dough is important issue because cookie di-
ameter increases and its height decreases with increasing level sugar. According
to Olewnik and Kulp (1984), increase in the sugar concentration in a cookie
dough reduces its consistency and cohesion.
The fat contributes to the plasticity of the dough and as a lubricant. Also when
mixed with the flour before its hydration, the fat prevents the formation of a
gluten network and produces a less elastic dough (Maache-Rezzoug et al., 1998b).
Fat affects the dough machinability during process and the spread after cutting-
out. Moreover, increase in fat amount added to dough raises air incorporation at
creaming stage; thus, cookie dough with lower density is obtained. Furthermore,
higher fat level lower dough hardness (Pareyt et al., 2009; Maache-Rezzoug et
al., 1998a) and reduce elastic properties (Pareyt et al., 2010). The effect of fat
on elastic properties of dough has been related to lubrication, which limits the
formation of a gluten network (Maache-Rezzoug et al., 1998a).
Water is a solvent for sugar, salt, leavening agent, non-fat dry milk and other
dry ingredients and regulates moisture content in the final product (Çıkrıkçı,
2013). It is necessary for hydrating proteins and carbohydrates that contributes
to form structure of cookie by gelatinizing starch and for the development of
a gluten network (Maache-Rezzoug et al., 1998a). Water has a complex role,
since it determines the conformational state of biopolymers, affects the nature of
interactions between the various constituents of the formula and contributes to
9
dough structuring (Eliasson & Larsson, 1993). It is also an important parameter
for rheological property of doughs (Webb et al., 1970). According to the study
conducted by Hibberd (1970), the elastic (G’) and loss (G”) modulus are reduced
when the water content is increased. Similarly, the study of (Maache-Rezzoug
et al., 1998a) showed that adding water to the formula reduced the viscosity
and increased dough extensibility. Rheological properties strongly depend on
water content of dough (Milašinović Šeremešić et al., 2013). The result of study
conducted by Hardt et al. (2014) shows that increasing water content of dough
reduces both elastic and viscous moduli in dynamic oscillation measurements.
As in further example, Witczak et al. (2010) studied on the effects of maltodex-
trins on gluten-free dough and quality of bread and their result is that increasing
level of maltodextrin in dough causes decreasing value of storage and loss moduli.
1.1.2.1 Rheology of Cookie Dough
Rheology is expressed as the study of the deformation and flow of matter
(Bourne, 2002). It measures the relationships between stress, strain and time.
Rheological measurements are composed of a strain (deformation) or a stress
analysis at a constant frequency combined with a frequency analysis between
0.1 and 100 Hz.
Elastic materials have the inclination of solid materials and when the force is
applied on them, they store all applied energy in materials to be able to return
to their original shape whereas viscous materials have a very large resistance to
motion or flow; thus, they are thick or sticky or adhesive and also, all energy
added to viscous materials is dissipated into heat. In the light of these materials,
Bourne defines the viscoelastic materials which exhibit some of the elastic prop-
erties of an ideal solid and some of the flow properties of an ideal liquid (Bourne,
2002) when exposed to deformation.
The energy stored in the material to recover itself when stress is applied is
decided by the parameter of elastic modulus (G’) while the energy dissipated
into heat shows viscous modulus (G”). Storage (or elastic) modulus G’ is defined
10
as the stress component in phase with the shear strain (Bourne, 2002). On the
contrary, the stress component 90 ◦out of phase with the shear strain is defined
as the loss (or viscous) modulus G” (Bourne, 2002). If G’ is significantly bigger
than G”, the dough shows predominating solid like behavior. Consequently, by
comparing G’ and G”, information about viscoelastic properties of materials is
reached and this information is valuable for the final cookie quality.
Any change of ingredients can affect in rheological and textural properties of
cookie. Rheological properties strongly depend on water content of dough
(Milašinović Šeremešić et al., 2013). Increase in water content of dough reduces
both elastic and viscous moduli in dynamic oscillation measurements (Hardt et
al., 2014). As in further example, Witczak et al. (2010) studied on the effects of
maltodextrins on gluten-free dough and quality of bread and their result is that
increasing level of maltodextrin in dough causes decreasing value of storage and
loss moduli. Also, particle size of ingredients is another important point for the
texture and rheology of product. For instance, Ahmed’s study (2014) results in
that particle size of beta-D-glucan has strong effect on the rheology of dough
and dough indicates a predominating solid-like behavior.
1.1.3 Cookie Quality
Water binding property of flour is an important issue for the production of
cookie having low moisture content. Thus, flour type which is soft white wheat
flour, consisting of low protein content and low damaged starch due to their
hydrophilic property is mainly preferred in cookie production (Edwards, 2007).
Furthermore, flour does not provide flavor to cookie; but affects texture, hardness
and shape of cookies (Manley, 2000). Quality of soft white wheat flour affects
the diameter of cookie (Bram et al., 2008). Also, cookies in which soft wheat
flour is used both show large spread and uniform surface cracking.
The effects of sugar quantity and its grain size on biscuit spreading were studied
by Maache-Rezzoug et al. (1998a). They concluded that a fine grain size and a
high concentration of sugar contribute to a significant spreading of the biscuit.
11
Throughout baking, the undissolved sugar progressively dissolves, and helps
cookie spread (R. A. Miller & Hoseney, 1997). Moreover, he thinks that during
baking, sugar recrystallizes at the surface of cookie and that leads to typical
surface cracking pattern. Apart from these properties of sugar, it has an im-
portant function on delaying the starch gelatinization temperature. It shifts the
starch gelatinization point to a higher temperature thus allowing the dough more
time to rise in the oven due to providing more time to gluten for its stretching
(Manley, 2000). In addition, in the medium where water is limited, sucrose
competes with the starch and gluten for water; thus, so little or no starch gela-
tinization is observed during baking (Sanchez et al., 1995). As stated in the
thesis of Çıkrıkçı (2013), sugar has so many roles on the surface appearance,
browning and spreading during cookie production.
Cookie diameter increases when more fat is added to dough (Pareyt et al., 2009).
According to the result of their study, higher fat levels results in higher spread
rate. As fat melts and and sucrose dissolves during baking, mobility in the sys-
tem increases and system mobility can probably be related to increased mobility.
Cookie density decreases when fat levels increase (Maache-Rezzoug et al., 1998a)
because more air is incorporated at the dough stage and expansion of the gas
cells during baking is more pronounced (Pareyt et al., 2009). Cookie diameter
increases when more fat is used in the formula.
If the proportion of water is too low, the dough becomes brittle, not consistent,
and exhibits a marked crust effect due to rapid dehydration at the surface.
Adding water to dough affects flavor, color, physical assets of baked products
(Matz, 1968). Water used in formulation of cookie is removed during baking;
however, the effects of water continue on cookie quality because it provides steam
that leaven the product (Archilla, 1999). Also, the water content of final product
influence eating quality and shelf life.
According to a study conducted by Conforti et al. (1996) on several fat re-
placers in cookies, increase in fat replacement resulted in increases in moisture
content, color lightness and a decrease in tenderness of the product. The other
major effect of an increase in fat replacement in cookies were increases in water
12

activity and hardness (Zoulias et al., 2002). Moreover, preceding study about fat
replacers showed that polydextrose, maltodextrins, and Simplesse are the most
convenient ones among carbohydratebased fat mimetics in terms of properties of
cookies even they results in high hardness cookies (Zoulias et al., 2002). Sudha,
Srivastava, et al. (2007) stated that the effects of maltodextrin and polydextrose
on the biscuit hardness. Also, Gallagher et al. (2003) studied on the develop-
ment of reduced fat biscuits with the utilization of sugar and fat replacers and
on their effects of biscuits on dimensions, color, and texture.
1.1.3.1 Texture of Cookie and Cookie Dough
Food textural properties are measured with the compression testing method
using a mechanical texture analyzer. Compression test is conducted in two
bite tests because of the imitation of mouth’s biting action by texture analyzer.
With this way, hardness, cohesiveness, adhesiveness, springiness, fracturability,
brittleness etc. can be quantified.
Hardness is expressed as peak force in the first compression of product. Co-
hesiveness is defined that how well the product resists a second deformation
relative to how it behaved under the first deformation, (Area 2/Area 1). Adhe-
siveness is explained as the different molecules or surfaces to cling to each other.
Springiness is defined by how well a product goes back after deformed under the
first compression.
There are many cookie procedure and formulation; thus, there is no one exact
cookie type, i.e., there is no one right texture and many different types of textures
are revealed (Bourne, 2002).
1.2 Consumption of Fatty Foods and Health Effects
The consumption of bakery products compels people to increase their daily fat
intake which has been suggested to be less than 30% of total calorie intake
in a day according to the U.S. Public Health Service (Sanchez et al., 1995).
13

Therefore, for a long time, consumption of large amount of fat through foods,
in particular bakery products has become a dietary concern.
In the USA and most European countries, people gain nearly 40% of total calorie
intake from daily fat consumption; while according to views of health profession-
als, daily fat consumption ought not to exceed 30% total calories in diet (Zoulias
et al., 2000). The similar problem that is consumption of bakery products has
been encountered in India. Indian people consume too much bread, cakes, pas-
tries, and biscuits; consequently, most significant part of total calorie intake
coming from bakery products is comprised by daily fat consumption, as well
(O’Brien, 2008). As in many parts of the world, in Turkey, consumption of
foods having high fat content, especially bakery products is quite high, too.
Additionally, excessive daily fat consumption results in various types of health
problems such as the incidence of obesity, high blood cholesterol. According to
Akoh (1998), high fat intake is associated with various health disorders such
as obesity, cancer, high blood cholesterol, and coronary heart diseases, too.
Thus, because of adverse effects of excessive dietary fat intake, many people
have started to be aware about consuming fat. As O’Neil (1993) told before,
the awareness of consumers induces the reduction of fat amount in their diet.
G. D. Miller and Groziak (1996) also are of the same opinion with O’Neil,
which is health conscious individuals altering their dietary habits and eating
less fat. Likewise, the Third National Health and Nutrition Examination Sur-
vey (NHANES III) conducted in 1988-1991 indicates that there are 2%-reduction
in daily fat intake of total calories from 36% to 34% of daily calories among
American people as compared to survey (NHANES II) conducted in the years
of 1976-1980 (Sanchez et al., 1995).
As the consumers become conscious in terms of health and nutrition, their ten-
dency to reduced or low-fat foods has gradually increased and reduced or low-fat
foods have gained gorgeous reputation. As a result, food industry has started to
response to consumers’ demands by putting various types of reduced or low-fat
foods on the shelf of markets. Thereby, even fat has a crucial role in baking
industry, efforts to reduce fat content of food products and to use various fat
14

replacers in the place of fat have existed (Sudha, Srivastava, et al., 2007). The
only way to succeed the goal of obtaining reduced or low-fat foods is that foods
are modified by using fat substitutes (Sanchez et al., 1995); thus manufacturers
have started to search for ideal fat replacers that taste and function like con-
ventional fat without potential health risk (Akoh, 1998). Therefore, for food
industry, fat replacement for many foods having high fat content, particularly
bakery products, has already become irrevocable even the replacement of fat in
the food systems leads to complexities with respect to gaining sensorial, textural,
rheological characteristics provided by fats (Zoulias et al., 2000).
1.3 Functions of Fat in Baked Products
Fat is one of the major ingredients in cookie formulation since it has versatile
functions for the product. In other words, fat component of cookie formulation
has marked impact on the mechanical properties of cookies.
Fat provides flavor, mouth feel, taste and odor; it also makes a contribution
to creaminess, appearance, palatability, texture and lubricity (Zoulias et al.,
2000; O’Brien, 2008). Besides, there is an opinion that the types and amounts
of fat affect flavor, texture and appearance of baked products (Sanchez et al.,
1995). For instance, according to the conducted study, during mixing stage
of dough, fats have the ability of entrapping and retaining air whereas liquid
oils are dispersed into dough as in the fat particules and creamy form is not
obtained well (Hartnett & Thalheimer, 1979). Thus, obtained dough do not
have sufficient aeration property that influence the texture, appearance of cookie.
Moreover, types and levels of fats have an significant effect on the rheological
properties of cookie dough (Manohar & Rao, 1999). Fat also includes lipophilic
flavor compounds that serve as a precursor for the development of flavor and
stabilization of flavor (Tamime et al., 1999; Romeih et al., 2002). Unlike protein
and carbohydrate, fat provides 9 kcal/g energy to diet.
As a consequence, since fat has functional properties that affect processing and
eating quality of foods, these functions must be considered when fat level in the
15

product is lowered (Napier, 1997).
1.4 Reduction of Fat in Cookies/Baked Products
Fat is the crucial component for bakery products, especially cookies because any
changes in the amount of fat give rise to some alters in the sensorial, textural
and rheological properties of the cookie.
There are many investigations and studies about the effect of fat reduction on the
cookie quality. One of them belongs to Sudha, Srivastava, et al. (2007), which
concludes that the spread of cookies reduced significantly and the thickness
of them increased when fat level in the formulation was sufficiently reduced.
Also, decrease in fat level leads to good dispersion of fat into dough which is
not to be an obstacle for the formation of gluten network. Gluten proteins
can make an intensive interaction with each other with lower fat level than
required one in cookie formulation that causes to increase in dough hardness
and elasticity (Maache-Rezzoug et al., 1998a). Since well dispersed fat allows the
generation of more gluten cross linkings during baking the breaking strength of
cookie increases (Pareyt et al., 2010). Similarly, hardness of cookie is correlative
behavior with the increase in the breaking strength of cookie when the reduction
of fat level occurs (Sudha, Srivastava, et al., 2007). Moreover, stiffness of cookie
dough significantly decreased with the reduction of fat (Baltsavias et al., 1997).
Furthermore, cookies resulted in chewy texture and low moisture content when
the fat content of dough is reduced (Sanchez et al., 1995).
1.5 Fat Replacers
There are many ingredients currently developed to replace fat in food products
because of increase in fat consumption in the modern life. Many various compo-
nents have been used as fat replacers in order to utilize the unique properties and
qualities of each bakery products (Sudha, Srivastava, et al., 2007). Therefore,
foods are reformulated with fat replacers as an alternative to high fat foods,
16

providing some fat-like functions (Tarr & Bixby, 1995; Sipahioglu et al., 1999).
Fat replacers are the substances used in the place of fat in food products. They
are classified into two groups as follows; fat substitutes based on lipid and fat
mimetics commonly based on protein or carbohydrate.
Fat substitutes, generally called as lipid-based substitutes, resemble to triglyc-
erides in terms of physical and chemical and theoretically replace fat in foods
on a 1:1 basis (Akoh, 1998). In other words, fat substitutes have a chemical
structure slightly close to fat and show physicochemical properties similar to
fat (Lipp & Anklam, 1998; Peters et al., 1997). Since they include lipophilic
flavors, they can enhance the taste of foods as at least fats. Additionally, many
lipid-based fat substitutes protect their stability during cooking or frying. Also,
they are usually either indigestible or contribute low calorie.
On the other hand, fat mimetics are distinctly different from fat in terms of
chemical structure because they are protein- or carbohydrate- based substitutes.
Fat mimetics can only imitate desirable eating qualities or functional properties
of triglycerides, but cannot replace fat on a gram-for-gram basis (Zoulias et al.,
2000). As parallel to this opinion, Johnson (2000) states that fat mimetics have
various functional properties that make an imitation of some physiochemical
and sensorial properties of fats such as viscosity, mouthfeel, appearance. For fat
mimetics, high temperatures are not convenient that results in denaturation or
caramelization; so they cannot be used for frying but they are suitable for baking
and retorting because they bind excessive water by adsorbing it (Akoh, 1998).
Also, they include water-soluble flavors not lipid-soluble flavor compounds. Fat
mimetics give the caloric value in the range of 0-4 kcal/g to food.
1.5.1 Lipid-Based Fat Substitutes
Lipid-based fat substitutes are macromolecules and either chemically synthe-
sized to obtain structures similar to triglycerides or derived from triglycerides
by enzymatic modifications (Giese, 1996).
There are many fat substitutes; but, some of them are very popular in food
17

industry which are more studied and publicized than the others.
The most known one of them is Olestra. It is obtained by the transesterification
or interesterification of sucrose composed of more than 16 carbons long chain
fatty acids that isolated from fats and oils (Akoh, 1998). It has a large size
and number of fatty acids that prevent its hydrolysis by lipases; thus, it cannot
absorb from gastrointestinal tract.
On the other hand, Salatrim is smaller molecule as compared to Olestra because
salatrim consists of the mixture of long- and short-chain fatty acids that esterified
to a glycerol backbone (Archilla, 1999). It provides 5 kcal/g.
Besides, emulsifiers are commonly used in many food products such as mar-
garines, baked products, frozen desserts, dairy products. According to Sipahioglu
et al. (1999), they also provide and stabilize aeration, provide lubricity, complex
with starch, interact with protein, modify the crystallization of other fats, pro-
mote and stabilize foam, control syneresis and control rheology.
1.5.2 Protein-Based Fat Substitutes
Protein-based fat substitutes are derived from various protein sources containing
milk, egg, whey and wheat gluten proteins etc. Some of them are micropartic-
ulated (sheared under heat) to form microscopic round particles that make an
imitation of mouthfeel and texture of fat (Akoh, 1998). They are generally used
in dairy products. Additionally, they are not sufficiently heat stable, leading to
denaturation of protein thus, they are not preferred for frying but they are used
as an ingredient in foods that are subject to cooking, retorting and ultra-high
processing (Akoh, 1998).
The most well-known of protein-based fat substitutes is Simplesse. Simplesse,
given GRAS status, is obtained from whey protein concentrate through mi-
croparticulation process. It is not suitable for fried products but used in baked
goods, salad dressing, mayonnaises, margarine, soup. Its caloric value on dry
basis is 4 kcal/g while its calorie value is reduced to 1 kcal/g in hydrated gel
form.
18

1.5.3 Carbohydrate-Based Fat Substitutes
For several years, carbohydrate-based substitutes, produced from cereal, grain
and plants, have been used in foods to partially or fully replace fat because of
exhibiting the similarity with the properties of fat due to binding water in terms
of lubricant or flow in some food systems. Many are used as thickener and
gelling agent in foods whereas some provide texture, mouth feel, and opacity
(Giese, 1996). They form gel type structure by binding water and that results
in lubricant and flow properties of similar to those of fat (Chugh et al., 2013).
Additionally, desirable texture is obtained with using this type of fat mimetics
and it do not form an obstacles in terms of toxicological potential (Chugh et al.,
2013).
Some of them are digestible, giving 4 kcal/g energy while some are nondigestible,
giving few calories. Some examples of these mimetics are polydextrose, pectin,
cellulose, gums and starch derivatives (modified starches, dextrins).
Polydextrose, partially digestible carbohydrate, is one of the most preferred fat
mimetics in food industry. Polydextrose is produced as a result of the random
polymerization of glucose, sorbitol, citric acid and phosphoric acid (Archilla,
1999).
Gums, hydrophilic colloids, are negatively charged carbohydrates and have high
molecular weight due to long chain polymers of monosaccharides. They are used
as thickeners, stabilizers and gelling agents in food industry because they can
easily dissolve in water.
Cellulose derivatives, which are powdered cellulose, microcrystalline cellulose,
and sodium carboxymethylcellulose, methylcellulose and hydroxypropyl methyl-
cellulose, are obtained by three types of processing as following: mechanical
grinding, chemical grinding and wet mechanical disintegration and chemical de-
rivitization (Archilla, 1999).
Pectin is a dietary fiber and is obtained from citrus peel and table sugar (Napier,
1997). They are composed of partial methyl esters of galacturonic acid and
19
the percentage of methyl-esterified galacturonic acid units differs that leads to
gaining different properties of pectin such as, gelling, dissolving in a water (Cho,
1999).
1.6 Carbohydrate-Based Fat Mimetics, particularly Maltodextrin,
in Baked Products
Carbohydrate-based fat mimetics are frequently employed in baked products
because of their imitation of fat functions. There are many studies about
application of carbohydrate-based fat replacers in baked products and their ef-
fects on them. For instance, Sudha, Srivastava, et al. (2007) stated that the ef-
fects of maltodextrin and polydextrose on the biscuit hardness. Also, Gallagher
et al. (2003) studied on the development of reduced fat biscuits with the uti-
lization of sugar and fat replacers and on their effects of biscuits on dimensions,
color, and texture.
Several carbohydrate-based fat mimetics have been employed to partially replace
fat in cookies as well as in other bakery products. According to study of Freeman
using polydextrose in cakes, brownies and chocolate cookies resulted in accept-
able products having one third lower calories (Zoulias et al., 2000). However,
some experiments indicated that 35% of fat substituted by polydextrose and
some starch-based fat substitutes has at least adverse effects on physical prop-
erties of cookie as compared to 45% or 55% fat replacement (Sanchez et al.,
1995).
Also, preceding study about fat replacers showed that polydextrose, maltodex-
trins, and Simplesse are the most convenient ones among carbohydrate-based
fat mimetics in terms of properties of cookies even they results in high hardness
cookies (Zoulias et al., 2000).
Additionally, experimental results of Inglett et al. indicated that there is no
significant difference between the case where 50% of fat are replaced with beta-
glucan and amylodextrins derived from oat flour and the case of full-fat ones
and also product quality is decreased at higher addition of beta-glucan and
20

amylodextrins (Chugh et al., 2013).
1.6.1 Maltodextrin
Maltodextrin is one of the most popular carbohydrate-based fat replacers. Mal-
todextrin is a non-sweet hydrolysate and a bulking agent with no side reactions
(Sudha, Srivastava, et al., 2007).
Maltodextrin that is a GRAS ingredient is produced by the acid (usually hy-
drochloric acid) or enzymatic (alfa-amylase) hydrolysis of a starch. Starch
hydrolysates, maltodextrins, include alfa-D-glucose units linked primarily by
(1-4) glycosidic linkages with a DE of less than 20 and a general formula of
C6nH(10n+2)O(5n+1) as shown in the Figure 1.1 (Kennedy et al., 1995). On the
other hand, starch hydrolysates with a DE higher than 20 are known as various
types of syrups.
Figure 1.1: Chemical Sturucture of Maltodextrin (TO: NDA 21-321, 7 , n.d.)
The average molecular weight and the degree of hydrolysis of maltodextrins alter
to dextrose equivalence (DE) of 20; in other words, DE value of maltodextrin
generally changes between 0 and 20. Dextrose equivalence of maltodextrin is de-
scribed as a measure of reducing sugar content as glucose (Archilla, 1999). Con-
sequently, DE value of maltodextrin increases, its molecular weight decreases.
Maltodextrins having different DE values show different physicochemical prop-
erties. More moisture absorption occurs with maltodextrin having higher DE
(lower molecular weight) (Archilla, 1999). Additionally, the result of other
21

study shows that the higher DE value is the higher solubility and sweetness
are (Chugh et al., 2013). Similar to these views, as DE value increases, hy-
groscopicity, solubility, osmolality, and their effectiveness to reduce the freez-
ing point rises whereas viscosity, cohesiveness, and coarse-crystal prevention
increase with decreasing DE value (Dokic-Baucal et al., 2004; Y.-J. Wang &
Wang, 2000). Even maltodextrins have the same DE value, they may show dif-
ferent properties since the production of maltodextrin, source of maltodextrin
and amylose/amylopectin ratio of maltodextrin are different (Dokic-Baucal et
al., 2004). In a brief, different or same molecular weights and DEs of maltodex-
trin give some functional properties to maltodextrin such as viscosity; binding,
controlling water; and contributing smooth mouthfeel; building solid.
Additionally, maltodextrin shows characteristics similar to fat when water is
available at sufficient level, forming gel-like matrix that results in lubricant and
flow properties to product. This gel-like matrix results from the interactions
between amylose fractions characterized by helical regions and branched linear
chains of amylopectin molecules (Chronakis, 1998). Since maltodextrins are
highly hydrophilic, they can form a gel; thus, they are preferable more for using
in food industry as texture modifiers, thickeners, fat replacers.
Moreover, according to Chronakis (1998) since maltodextrins have a very small
diameter (3-5 micrometer), they are similar to fat crystals, that results in fat-
like behavior of maltodextrin. Therefore, maltodextrin can be used in obtaining
emulsions as texture modifiers, bulking agents and especially in food emulsions
to partially replace fat and is mostly preferred into fat-reduced food systems,
especially used for the preparation of spread, margarine, salad dressing, baked
goods, fillings, sauces and processed meat.
1.7 Emulsion
The aqueous phase of emulsion may contain water-soluble ingredients, including
sugars, salt, acids, bases, surfactants, proteins and polysaccharides whereas the
oil phase of one may contain lipids-soluble components, such as triacylglycerol,
22

diacylglycerol, monoacylglycerol, fatty acids and vitamins (Akoh & Min, 2008).
In food emulsions, interactions, resulted from a combination of covalent and
physical interactions, among these ingredients give the final products physico-
chemical properties such as appearance, stability, texture (Akoh & Min, 2008).
Since the interaction between water and oil is unfavorable due to strong hydro-
gen bonding capability of water molecules with other water molecules but not
with oil molecules, energy is required to keep together them in a food system
(Akoh & Min, 2008). In other words, by forcing two different phases to hold
together that increases the surface area between oil and water phases, thermo-
dynamically unstable emulsions are obtained as shown in the Figure1.2 (Akoh
& Min, 2008).
Figure 1.2: Emulsions are thermodynamically unstable systems (Akoh & Min,2008).
1.7.1 Homogenization with High-Speed Blenders and Micro-Fluidization
Process
The process in which emulsion is obtained from two immiscible liquids is called
as homogenization. This process is conducted by mechanical device named as
homogenizer.
In the preparation of emulsion, it is more effective to divide homogenization into
two steps as seen from Figure 1.3. In first homogenization step; preparation of
emulsion from two separate phases is referred to primary homogenization; on the
other hand, second step includes the reduction in size of droplets in the emulsion
obtained in previous step and is called as secondary homogenization (Akoh &
Min, 2008). As a result, to create an emulsion, homogenization is necessary
either in one step or in two steps due to the nature of oil and water.
23

Figure 1.3: Homogenization process can be divided into two steps: primaryhomogenization and secondary homogenization (Akoh & Min, 2008).
1.7.1.1 High-Speed Blenders
High-speed blenders are employed for homogenization of the two immiscible
liquids, oil and aqueous phase. The liquids in a few milliliters or several liters
are put in a suitable container and mixed by stirrer at high speed for a while.
The size of the droplets in emulsion depends on homogenization time and ro-
tational speed. As homogenization time and rotational speed increases, droplet
size can decrease to lower limit of 2 micrometer. Thus, it can be said that with
high-speed blender, droplet size is generally obtained between about 2 and 10
micrometer (McClements, 1998). Moreover, there is an issue requiring attention
during using high-speed blender. While agitating with blender, blender gen-
erally rises temperature of the medium. Thus, controlling temperature of the
medium may be necessary. As consequences, this type of blenders is useful for
obtaining emulsions with low or medium viscosities.
1.7.1.2 Micro-Fluidization Process
Microfluidization process has been one of the novel technologies that help to
preserve food quality and it has become a popular due to being applicable in
wide industrial areas such as pharmaceutical, biotechnology, chemical, energy,
and cosmetic as well as food industries.
This process provides stability and uniformity to products in addition to im-
proving certain physicochemical properties such as texture and color of products
(Çıkrıkçı, 2013). Because of its functional characteristics, it has been frequently
preferred in many areas of food industry. Moreover, microfluidization treatment
24
contributes to preserve and enhance the quality of food products with the help
of high pressure up to 200 MPa. Products with higher consistency and smoother
structure are obtained by reducing size of the particles (Çıkrıkçı, 2013).
Microfluidization process includes the combination of the forces of ultra-high
pressure, high-velocity impact, high-frequency vibration, instantaneous pressure
drop, intense shear, and cavitation in a very short time (Hu et al., 2011). These
forces reduce mean diameter of droplets in dispersed phase of the emulsion result-
ing in more uniform distribution of foods (Pinnamaneni et al., 2003). Moreover,
these forces lead to some changes in food products. Texture, color and sensory
of foods are improved. Also, these changes affect the rheological and sensorial
properties of food product (Ciron et al., 2011). Additionally, according to the
study of T. Wang et al. (2012), the value of water holding capacity, swelling
capacity, oil holding capacity and bulk density may change with such kind of
processes. As the particle size is reduced by microfluidization, water holding
capacity increases due to increase binding surface area of particles. Also, hy-
dration properties of foods are important parameters in terms of their potential
usage in food industry; thus, according to changes in hydration properties of
foods, purpose of usage of foods may vary (Çıkrıkçı, 2013).
1.8 Objective of the Study
Recently, a high increase in the population consuming bakery products, critical
adverse effects against human health resulted from these fatty foods and becom-
ing conscious about the consumption of high caloric foods have prompted food
manufacturers to reduce the fat level in foods and to develop the replacement
of fat with alternative ingredients. Therefore, in this study in the place of fat,
maltodextrin (DE18), which is often used in bakery products and provides the
properties given by fat to product, was preferred.
Maltodextrin has the capability of contributing smooth mouth-feel like fat, con-
trolling water and body building; thus, as long as sufficient water is available in
the medium, MD18 forms gel-like matrix resulting in the structure of product.
25
Consequently, it influences the texture of the product. Thus, in this research,
percentage of fat was reduced by 25% and in the place of fat, both MD18 (0
%, 3.75%, and 7.5%) and water (7.5%, 3.75%, and 0%) with changing percent-
ages were employed for obtaining maltodextrin-water solution that was used in
cookie formulation. Thereby, the purpose of this study was to investigate the
effects of maltodextrin with various percentages on the rheological and textural
properties of cookie and its dough. Because texture and rheology of product are
important parameters in terms of quality, it was aimed to compare textural and
rheological properties of cookie samples in this study.
Another objective of this study was to investigate the effects of microfluidiza-
tion, which was used for obtaining emulsions, on the rheological and textural
properties of cookie and its dough from bakery products.
Lastly, the third objective of this study was to examine the impacts of utilization
of different types of fats in cookie formulation on the properties of both cookie
and cookie dough. Palm olein (PON) and palm stearin (PS) types of fat were
used in the experimental studies conducted throughout the thesis. The same
procedure was followed in the preparation of cookie dough with both types of
fats.
26
CHAPTER 2
METHODS & MATERIALS
2.1 Materials
Wheat flour, sugar, non-fat dry milk (NFDM), baking powder (sodium bicarbon-
ate) and salt were taken from Ulker Biscuit Industry Co. Inc. (Ankara, Turkey).
Two types of shortenings, Palm Olein (PON) and Palm Stearin (PS), which were
used in the cookie production and carbohydrate based fat replacer, Maltodextrin
(DE=18), were received from Sunar Co. Inc. (Adana, Turkey). Polyglycerol
polyricinoleate emulsifier was purchased from Danisco Foreign Trade Co. Ltd.
(Istanbul, Turkey).
2.2 Methods
2.2.1 Preparation of Control Cookie Doughs
All cookies were prepared according to standard AACC Method 10-52 - Micro
Sugar-Snap Cookies. The control cookie recipe based on 100 g wheat flour
consisted of 60% sugar, 3% non-fat milk powder, 2.5% sodium bicarbonate,
30% fat - Palm Olein (PON) - Palm Stearin (PS), 0.47% salt, 21.75% water as
shown in Table 2.1.
For the preparation of control cookies, firstly, sucrose, non-fat milk powder and
sodium bicarbonate were mixed with Kitchen Aid Mixer. After mixing dry
ingredients, PON/PS, which had been stored at room temperature or melted
27

Table 2.1: Control Cookie Dough Recipe-AACC Method 10-52 - Micro Sugar-Snap Cookies
Ingredients Weight percentage (%)Based on 100 g wheat flourSugar 60Non-fat milk powder 3Sodium bicarbonate 2.5Fats-(Melted or not)PON/PS 30Salt 0.47Total water 21.75
and cooled down to 20− 25 ◦C, was added to dry mixture and mixed to obtain
creamy phase. To ensure good interaction between sugar and fat, mixing was
conducted in three steps. Initial mixing was done at low speed- at 2nd level of
Kitchen Aid Mixer - for 1 min, then mixing continued at medium speed- at 4th
level of it - for 1 min and finally at high speed- at 6th level of it - for 20 seconds.
Then, water and salt were added to creamy mixture and mixed again at medium
speed- at 4th level of the mixer- for 3 min to get a smooth cream. Later, flour
was poured into cream, followed by 180 seconds of mixing and mixed at medium
speed- at 4th level of the mixer - for 25 seconds to get the control cookie doughs
which were denoted as PON/PS. Also, doughs were obtained from melted PON
and melted PS, named as Melted PON and Melted PS, respectively. Doughs
were scraped from the bowl and the temperature of doughs was measured as
20±2◦C. After that, doughs were divided into two. The half of the doughs were
used for experimental analysis within the day whereas other half were wrapped
up with aluminum foil and stayed in the refrigerator at +4◦C for 7 days for
the purpose of making a cookie after 7-days storage. Thus, these 7-days stored
doughs would be named as ‘PON day7’ and ‘MeltedPON day7’ while remaining
parts of doughs were named as ‘PON day0’ and ‘MeltedPON day0’ (Table 2.2).
Doughs, which would be used for analyses within the day, were sheeted between
6 mm thick gauge strips and cut into a round shape with the usage of 60 mm
inside diameter cutter. At the end, round dough pieces were obtained and the
rest of the pieces were left for using in experimental analysis. Then, dough
28

Table 2.2: Naming of Doughs According to Types of Fat Used in The Preparationof Control Cookie Dough
The day when experimental Names belonging to control doughs and cookiesanalyses were conducted Palm Olein (PON)* Palm Stearin (PS)**
0th day PON day0 PS day0MeltedPON day0 MeltedPS day0
7th day PON day7 PS day7MeltedPON day7 MeltedPS day7
*Control cookie dough and its cookie contained palm olein fat type.**Control cookie dough and its cookie contained palm stearin fat type.
pieces were weighed in the range of 20-25 g and round shaped doughs were
transferred on baking tray. Round shaped doughs were baked at 180± 2◦C for
5 min. After baking, cookies were removed from tray and placed on the batch to
cool. Then, the cookies were cooled for 1 hour at room temperature and then,
they were again weighed and noted for the study. Finally, the cooled cookies
were packaged with zip lock bags.
To see the impact of different types of fat on the properties of cookie and its
dough, the same procedure of preparation of cookie doughs was replicated with
PS and MeltedPS, instead of PON and MeltedPON. While doughs that would
be used in the cookie preparation within the day were called as PS day0 and
MeltedPS day0, ones that would be stored in refrigerator during 7 days were de-
noted as PS day7 and MeltedPS day7 (Table 2.2). Experiments were conducted
in triplicate for each type of cookie doughs.
2.2.2 Preparation of Cookie Doughs with Emulsified Fats
2.2.2.1 Preparation of Cookie Doughs without Microfluidization
To observe the effect of maltodextrin having dextrose equivalence of 18 (MD18)
on the properties of cookie and its dough, percentage of PON/PS in the control
cookie formulation was reduced by 25% and replaced with MD18 solution added
to the cookie dough formulation using three different maltodextrin percentages
29

(0%, 3.75%, and 7.5%). Therefore, cookie doughs consisted of PON/PS in
constant percentage of 22.5%, while they contained MD18 in 0%, 3.75% and
7.5% and added water in 7.5%, 3.75% and 0% respectively (Table 2.3). Thereby,
dough types obtained by modified formulation were respectively called as PON1,
PON2, PON3; PS1, PS2, PS3 with respect to their MD18 percentages present
in the emulsions (Table 2.4).
Table 2.3: Modified Cookie Dough Recipe
Ingredients based on PON1/PS1 PON2/PS2 PON3/PS3100 g wheat flour % % %
Sugar 60 60 60Non-fat milk powder 3 3 3Sodium bicarbonate 2.5 2.5 2.5
Salt 0.47 0.47 0.47Water* 21.75 21.75 21.75
Fats (PON/PS) 22.5 22.5 22.5MD18 0 3.75 7.5
Added Water** 7.5 3.75 0Polyglycerol polyricinoleate 0.06 0.06 0.06
*Water amount existed in the cookie dough formulation.**Water amount was added to prepare MD-water solution.
Table 2.4: Emulsion Formulation
Ingredients based on PON1/PS1 PON2/PS2 PON3/PS3100 g wheat flour % % %Fats (PON/PS) 22.5 22.5 22.5
MD18 0 3.75 7.5Water 7.5 3.75 0
Polyglycerol polyricinoleate 0.06 0.06 0.06
According to the modified cookie dough formulation, 22.5% of PON/PS and
fixed amount of emulsifier were added to mixture of sugar, milk powder and
sodium bicarbonate. Mixing procedure was applied to obtain creamy form as
in the control cookie preparation and then, water and MD18 with changing
percentages and salt were added to cream. In other words, 0%, 3.75% and 7.5%
of MD18 and respectively 7.5%, 3.75% and 0% water and constant 0.47% salt
were added to obtain six types of doughs. Then, flour was poured into bowl and
30
mixing as in the control dough recipe was continued. Finally, after doughs were
obtained, half of each type of cookie doughs was wrapped up with aluminum
foil to store in refrigerator for 7 days, which are denoted as PON1 day7, PON2
day7, PON3 day7, PS1 day7, PS2 day7, PS3 day7 and remaining doughs were
employed in cookie making within the day, which are called as PON1 day0,
PON2 day0, PON3 day0, PS1 day0, PS2 day0, and PS3 day0 according to their
MD18 percentages (Table 2.5). Experiments were conducted in triplicate for
each type of cookie doughs.
Table 2.5: Naming of doughs according to the percentage of maltodextrin
The day when experimental Names belonging to doughs and cookiesanalyses were conducted PON PS
0th day PON1 day0* PS1 day0PON2 day0** PS2 day0PON3 day0*** PS3 day0
7th day PON1 day7 PS1 day7PON2 day7 PS2 day7PON3 day7 PS3 day7
*Cookie/Cookie dough containing palm olein fat type and 0% MD withoutMF process**Cookie/Cookie dough containing palm olein fat type and 3.75% MD
without MF process***Cookie/Cookie dough containing palm olein fat type and 7.5% MD
without MF process
2.2.2.2 Preparation of Cookie Doughs with Microfluidization
In order to see how microfluidization process affected the properties of cookie and
its dough, firstly, emulsions were obtained ( Table 2.4 ). MD18 at 0%, 3.75% and
7.5% were dissolved in water at 7.5%, 3.75% and 0% respectively, at 40− 45◦C
and gel forms were obtained by stirring (Table 2.4). Then, 22.5% of PON/PS,
which had been melted before, was poured into each gel form of MD18 with
0.06% polyglycerol polyricinoleate. Ingredients were the same as in the Table 2.3,
with only difference of using microfluidizer process (MF) and the order of steps
in cookie making procedure. After that, six types of heterogeneous mixtures
31

were homogenized for 10 min at 4th level of high-speed homogenizer (IKA T 18
digital ULTRA-TURRAX) as shown in the Figure 2.1a to successfully disperse
water droplets containing MD in fat and to obtain homogenized emulsions.
(a) IKA T 18 digital ULTRA-TURRAX(Lab Dispersing Devices, n.d.) (b) Microfluidizer (MF)
Figure 2.1: Homogenizer Instruments
Next, the emulsions were passed through high-pressure homogenizer, MF equip-
ment (M-110Y, Microfluidics, USA) as seen from Figure 2.1b at 1000 bar and
60◦C to obtain well-dispersed water droplets containing MD in emulsions re-
sulted from micro and nano water-MD droplets.
As shown in the Figure 2.1b, microfluidizer had a container where fluid flowed
and two parallel micro streams into which fluid was forced to split and flow
by pressure. Then, these two micro streams were colliding with each other
at extremely high speeds with the help of pressure. Formation of turbulence
and shear were observed in these micro streams because of clash cavitations
(Yuce, 2011). Consequently, not only high shear rate but also extreme impact
forces resulting in the formation of fine particles were applied to micro streams
(McCrae, 1994). Under these conditions, emulsions, which had been already
prepared with high-speed homogenizer, were poured into input reservoir and
pumped into the nozzles at 1000 bar. Microfluidized emulsions at nearly 60◦C
were collected from output reservoir. They were cooled down to 20−25◦C to be
used in the preparation of cookie. After cooling step of microfluidized emulsions,
they were used in the preparation of cookie doughs with the same procedure as
in the control cookie dough formulation. While half of each doughs was stored
at +4◦C for 7 days, which are named as MF PON1 day7, MF PON2 day7,
32

MF PON3 day7; MF PS1 day7, MF PS2 day7, MF PS3day7, remaining parts of
doughs were utilized for making cookies, which are named as MF PON1day0, MF
PON2day0, MF PON3day0; MF PS1day0, MF PS2day0, MF PS3day0 (Table
2.6). Each experiment was performed in triplicate.
Table 2.6: Naming of doughs according to the exposure of microfluidizationprocess and the percentage of maltodextrin
The day when experimental Names belonging to doughs and cookiesanalyses were conducted PON PS
0th day MF PON1 day0* MF PS1 day0MF PON2 day0** MF PS2 day0MF PON3 day0*** MF PS3 day0
7th day MF PON1 day7 MF PS1 day7MF PON2 day7 MF PS2 day7MF PON3 day7 MF PS3 day7
*Cookie/Cookie dough containing palm olein fat type and 0% MD with MFprocess**Cookie/Cookie dough containing palm olein fat type and 3.75% MD with
MF process***Cookie/Cookie dough containing palm olein fat type and 7.5% MD with
MF process
2.2.3 Dough Analysis
2.2.3.1 Dough Rheology Analysis
Oscillatory rheological measurement of cookie dough samples was conducted by
using TA rheometer (AR 200ex, Sussex, UK). After resting of 0-day doughs for
15 min, and after 7-days storage in refrigerator of doughs, both sample types
were cut in a small standard circular form and were placed in 2 mm gap be-
tween the stainless steel plates with 20 mm diameter. All measurements were
conducted at constant temperature of 20◦C by using parallel plate geometry.
Then, frequency sweep test, one of the dynamic (Oscillatory) tests, was con-
ducted between 0.1 and 20 Hz under constant shear strain rate (0.2%) and
constant selected temperature. Finally, the results of elastic (G’) and loss (G”)
33
moduli of dough samples were obtained. Each rheological experiment was done
three times.
2.2.3.2 Dough Texture Analysis
The physical properties of food products were usually tested by compression
test revealing the textural properties of products such as hardness, springiness,
fracturability, resilience, and other parameters. In this study, hardness and co-
hesiveness parameters of cookie dough were measured by the Texture Analyzer
(The TA.XTPlus, England). The hardness, the peak force of the first compres-
sion, was usually seen at the point of the deepest compression of the product for
most products (Bourne, 2002). On the other hand, the comparison of perfor-
mance of the product under the second and the first deformation of the product
gave the cohesiveness. It was measured as the area of work during the second
compression divided by the area of work during the first compression (Refer to
Area 2/Area 1 in Appendix B) (Bourne, 2002).
The textures of 0-day and 7-days cookie doughs were measured by the Texture
Analyzer, using cylindrical probe with 1 cm diameter. With texture analyzer,
hardness and cohesiveness of doughs were measured. Firstly, cookie dough was
flattened in gauge strips having a thickness of 1 cm and cut to 3 cm diam-
eter. Thus, all cookie dough samples had 3 cm diameter and 1 cm height.
Then, round-shaped dough piece was placed on platform of texture analyzer for
measurement. Movement of probe was adjusted 15 mm. After that, the mea-
surement was conducted at 2 mm/s pre-test speed, at 2 mm/s test speed with
75% strain target mode which means that 75% of dough height was compressed
by the probe. The probe continued compressing dough during 75 s, and finally
returned back to its starting position. The measurements were performed in
triplicate for each set. Finally, average of three results was taken and their tex-
ture profile analyses were conducted according to Bourne (1978) and hardness
(1st bite), cohesiveness of doughs were measured.
34

2.2.4 Cookie Analysis
2.2.4.1 Cookie Texture Analysis
Both types of cookies, which were made by 0-day doughs and 7-day doughs,
were measured in terms of hardness by using texture analyzer (The TA.XTPlus,
England) at two times: the day when they were made, and after they were kept
in zip lock bags for 7 days. 0-day and 7-days hardnesses (g) of cookies were
evaluated considering the texture analyzer results. The cookies were placed on
the platform of texture analyzer to be broken with the probe and the distance
from the platform of the probe was adjusted in 10 mm just about return back
to the position. To measure the hardness of cookies, break mode was chosen as
a level; break detect was chosen as a return; and break sensitivity was adjusted
as 10 g. Also, measurement was done at a 1 mm/s pre-test speed; at a 1 mm/s
test speed and finally at a 10 mm/s post-test speed. Analysis was conducted for
two cookies randomly chosen from each cookie set having triplicate.
2.2.4.2 Moisture Content Determination
In order to calculate moisture contents (%) of the cookies, the doughs were
weighed and after baking (0th day) and storing in zip lock bag at room temper-
ature for 7 days, cookies were also weighed. Then, the cookies put in an oven
for 24 h. The temperature of oven was 103◦C. Moisture contents (%) of cookie
and dough samples were calculated based on dry weight basis.
Moisture content (%) of dough ={
[Wdough −Woven cookie] (2.1)
/[Woven cookie]} × 100
Moisture content (%) of cookie ={
[Wcookie −Woven cookie] (2.2)
/[Woven cookie]} × 100
35

2.2.4.3 Scanning of Cookie
In order to show the visual differences and similarities that were resulted from
changing cookie formulation parameters which are shortening type, maltodextrin
percentage and usage of micro-fluidization, cookies were placed on the glass of
a scanner (CanoScan Lide 110, Tokyo, Japan).
2.2.4.4 Size Determination
In order to evaluate the change in size of diameter and height of cookies and to
assess the effects of shortening type, percentage of maltodextrin and usage of
micro-fluidization on the cookie size, Vernier caliper was used for all cookie types
and their replications. For two samples chosen from each cookie set, diameter
and height measurement with vernier caliper was done and three data were taken
from one cookie.
2.2.4.5 Color Determination
For the color of the cookies, colorimeter (Cr-10, Konica Minolta, Japan) was
used. CIE L∗, a∗, and b∗ color scale was used. Total color change (∆E) was
calculated from the following equation;
∆E∗ = [(L∗ − L0)2 + (a∗ − a0)2 + (b∗ − b0)2]1/2 (2.3)
White paper was chosen as the reference point and L0, a0 and b0 which were 90,
2.5 and -7.6, respectively stood for its L∗, a∗ and b∗ values.
2.2.4.6 Statistical Analysis
Analysis of variance, ANOVA, was used (p ≤ 0.05) for the analysis of exper-
imental results through MINITAB (Version 16) software. ANOVA served the
purpose of deciding if there was a significant difference among cookie and its
36

dough sample types or not. If there was a significant difference in samples,
means of samples were compared by the Tukey Single Range test (p ≤ 0.05).
37

38

CHAPTER 3
RESULTS AND DISCUSSION
Emulsified fats were obtained with reduction of fat of dough by 25% and replace-
ment of 25% of fat with maltodextrin in three different levels: 0%, 3.75%, and
7.5%, respectively either with or without microfluidization process to observe
the effect at the first stage of mixing. Following that process, parts of the emul-
sified fats with three different percentages of maltodextrin were employed in the
preparation of cookie dough. Dough (0-day dough) was analyzed at 0, 7 days of
storage. Then, both 0-day and 7-day cookie doughs were examined in terms of
the rheological and textural properties to investigate the effect of microfluidiza-
tion process and maltodextrin effect. In other words, viscoelastic properties of
cookie doughs were interpreted considering microfluidization process and levels
of maltodextrin, at the same time hardness, cohesiveness of cookie doughs were
also examined. The hardness of cookies prepared from 0-day and 7-day doughs
were evaluated by changing the maltodextrin level employed, while the effect of
replacement of fat by maltodextrin and the effect of microfluidization process on
the moisture content of both cookie dough and cookie were evaluated. Finally,
the impact of the microfluidization process and percentages of maltodextrin on
color and the height and diameter of cookies were evaluated and the observations
and experimental results were reflected within this study.
3.1 Dough Texture and Dough Moisture Content
The effect of maltodextrin (MD) and microfluidization process (MF) on both
0-day and 7-day dough hardness with PON was presented in Figure 3.1. 0-day
39

and 7-day doughs made from PON and Melted PON showed the similar results
in terms of hardness; in other words, there was no significant difference observed
between PON and Melted PON doughs in terms of the 0-day and 7-day hardness
by reference to ANOVA results (p ≤ 0.05). Thus, the use of Melted PON during
preparation of cookie dough did not significantly affect dough quality.
Figure 3.1: The Effects of MD and MF Process on the 0-day and 7-day DoughHardness with PON
Dough including PON had nearly 2000 g 0-day hardness as a control group
whereas 7-day dough hardness with PON is nearly 15500 g. There was a sig-
nificant increase (61% max.increase in dough without MF, 68% max.increase
in one with MF) on the hardness of 7-day doughs observed (p ≤ 0.05). This
increase could be explained with the fat crystallization during storage of dough
for 7 days at refrigerator. During storage, the crystallization behavior changed
crystal morphology and network structure of the system; thus, the final product
could be affected in the same way, too (Tan & Man, 2002). Also, fat created a
three-dimensional network, resulting in the increase in fat hardness (Hadnađev,
Dokić, et al., 2011). Harder fat made cookie dough harder. As a result of this,
the texture of product was highly affected by fat hardness.
The study of Sudha, Srivastava, et al. (2007) related low calorie soft dough
biscuits, fat in the biscuit formulation was reduced from 20% (control) to 10%,
40

8%, and 6% levels, showed that the hardness of biscuit dough value increased
when fat content in the biscuit formulation was reduced. In a parallel to this
result, when doughs without MF process were compared, PON3 (including %7.5
MD) was not significantly different from PON2 (including %3.75 MD); but,
higher from PON1 (including %0 MD) for 0-day hardness (p ≤ 0.05). However,
when 7-day hardness was considered, it was possible to observe that PON3 was
significantly different from PON2 and PON1 shown in the Figure 3.1 (p ≤ 0.05).
Therefore, it could be inferred that increasing MD at %0, %3.75, and %7.5
percentages increased dough hardness (Figure3.1). This was an expected result
because adding MD gel made the network more intense, leading to strengthen the
structure of the dough. Moreover, these results were keeping with the findings
by (Hadnađev, Hadnađev, et al., 2011) who showed that 15% fat replacement
level with two types of maltodextrin gels lead to significant increase in firmness
of product. In the study, it was also stated that viscoelastic property of product
is affected by the addition of MD in the same manner, which leads to increase
in elastic and viscous moduli by fat replacement as indicated in Section 3.2.
That is, fat replacement used in dough recipe increased the hardness of the
dough (Hadnađev et al., 2014). The another study in which fat was reduced by
50%, 60%,and 70% and replaced with poydextrose (PD) and maltodextrin (MD)
indicated that the RWAM (research water absorption meter) values showed that
cookie dough containing MD or PD was harder than the doughs without MD
or PD (Sudha, Srivastava, et al., 2007). Moreover,reducing fat by 25% could
contribute to the increase in hardness and elasticity of dough because when less
fat was present in the dough, gluten proteins could intensively interact with
water and formed intensive network leading to strong structure (Pareyt et al.,
2010). Furthermore, in the study related to fat reduced confectionery filling
systems with 15 g/100 g MD gels and 20 g/100 g MD gels, textural measurement
showed that reduced fat systems containing 15 g/100 g MD gels expressed higher
firmness values in comparison to confectionery filling systems with 20 g/100 g
MD gels. The reason might be lower water activity value of concentrated 20
g/100 g MD systems than 15 g/100 g MD gel which resulted in reduced water
migration (Hadnađev et al., 2014). In the study of O’Brien (2008), similar
41

result was found. According to this study, water uptake of flour, in presence of
insufficient quantity of fat, would lead to dough hardness.
In addition to the effect of MD gel on the dough hardness, there was no signif-
icant difference in terms of hardness between cookie doughs with and without
MF at different MD levels (Figure 3.1) when the effect of MF on hardness for
0-day and 7-day doughs was considered (p ≤ 0.05). That is, MF did not have a
significant effect on the dough hardness. However, MF process had more effect
on the dough hardness as the MD% increased. On the other hand, decreasing
effect of MF on the 0-day dough hardness could be seen at 3.75% and 7.5%
of MD. For instance, at 3.75% of MD, MF process reduced dough hardness by
almost 45% compared to dough without MF process and it had also reducing
effect by 25% at 7.5% of MD because MF treatment formed smaller particles
with the effect of high pressure (Higaki et al., 2001) which made dough softer.
The Figure 3.2 indicated the effects of MD and MF processes on the 0-day and
7-day hardness of dough with PS. In Figure 3.2, 0-day hardness of PS1 was
significantly lower (nearly 43%) from the those of PS2 and PS3 (p ≤ 0.05).
Similarly, when the doughs with MF process were considered, MFPS1 was sig-
nificantly lower (nearly 48%) from the other two. However, all PS and MFPS
doughs at each MD percentage were not significantly different from each other
(p ≤ 0.05). That is, there was no significant difference between with and with-
out MF process in terms of 0-day hardness of dough. It could be possible to
see the effect of MF process on dough hardness when higher level MD was used
because MF was active when MD gel concentration was high and the levels of
0%, 3.75%, and 7.5% MD could be insufficient to exhibit the performance of MF
on the hardness. Additionally, the lowest 0-day hardness of dough was nearly
5500 g; however, the highest hardness of dough was around 10500 g.
When the Figure 3.1 was compared with Figure 3.2, how PS and PON influenced
the hardness of dough was observed. PS fat type increased the hardness of dough
more than PON due to high solid fat content of PS. The hardness of a fat strongly
affected the texture of fatty food products (Brunello et al., 2003) and this effect
depended largely on the amount of solid fat present in the network (Foubert et
42
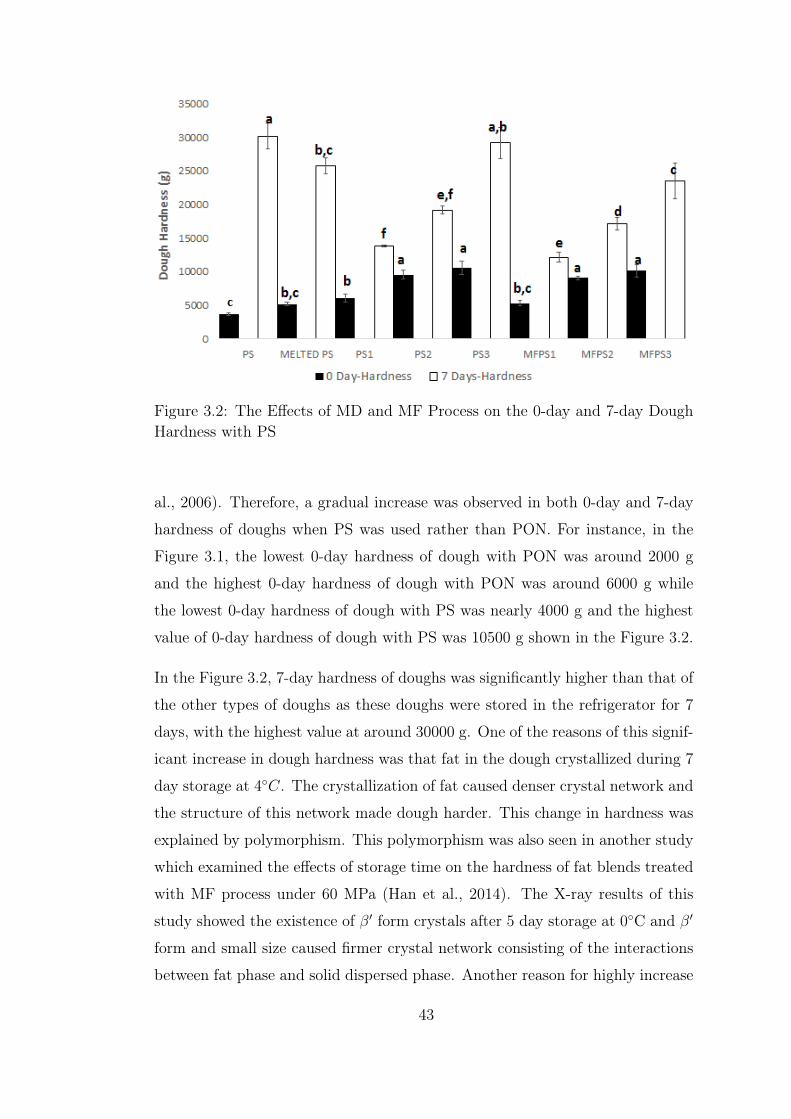
Figure 3.2: The Effects of MD and MF Process on the 0-day and 7-day DoughHardness with PS
al., 2006). Therefore, a gradual increase was observed in both 0-day and 7-day
hardness of doughs when PS was used rather than PON. For instance, in the
Figure 3.1, the lowest 0-day hardness of dough with PON was around 2000 g
and the highest 0-day hardness of dough with PON was around 6000 g while
the lowest 0-day hardness of dough with PS was nearly 4000 g and the highest
value of 0-day hardness of dough with PS was 10500 g shown in the Figure 3.2.
In the Figure 3.2, 7-day hardness of doughs was significantly higher than that of
the other types of doughs as these doughs were stored in the refrigerator for 7
days, with the highest value at around 30000 g. One of the reasons of this signif-
icant increase in dough hardness was that fat in the dough crystallized during 7
day storage at 4◦C. The crystallization of fat caused denser crystal network and
the structure of this network made dough harder. This change in hardness was
explained by polymorphism. This polymorphism was also seen in another study
which examined the effects of storage time on the hardness of fat blends treated
with MF process under 60 MPa (Han et al., 2014). The X-ray results of this
study showed the existence of β′ form crystals after 5 day storage at 0◦C and β′
form and small size caused firmer crystal network consisting of the interactions
between fat phase and solid dispersed phase. Another reason for highly increase
43

in hardness of dough was that MD gel replaced with fat had rigid structure
during storage at 4◦C. When the ingredients of cookie were considered, besides
the effect of MD gel and fat crystallization on harder 7-day dough, sucrose and
flour might be taken into consideration. As the dough was stored at refrigerator,
sucrose could act as hardener for crystallization. Moreover, gluten network con-
sisting of hydrating flour with water might be more rigid during cooling which
led to increase in hardness of 7-day dough. The reason for rigid structure of
gluten network was also explained in the study of (Lagrain et al., 2005) in which
indicated that the decrease in apparent viscosity of gluten suspensions exposed
to cooling was due to protein aggregates resulting in rigid structure.
The Figure 3.1 showed all types of doughs obtained when the formulation of
cookie dough was altered. In order to evaluate the relation between hardness
and moisture content of these doughs, this Figure 3.3 type was used.
Figure 3.3: Hardness and Moisture Content of 0-day Doughs including PONbeing evaluated in terms of the Percentages of Maltodextrin
In the Figure 3.3, no significant difference was observed between 0-day moisture
contents of PON1 and MFPON1 doughs containing 0% MD while moisture
content of PON2 dough containing 3.75% MD was lower than that of MFPON2
dough and the similar reduction was observed when the moisture contents of
PON3 and MFPON3 containing 7.5% MD were compared (p ≤ 0.05). Moreover,
44

while hardness of dough increased with increasing percentage of MD used in the
place of fat (Table 2.3); moisture contents of doughs decreased with increasing
MD level but still moisture contents of doughs were higher than that of control
dough. In other words, increase in the amount of MD led to reduction on 0-day
moisture content of doughs including both with MF and without MF processes
because it was related to how much water added in the formulation (Table 2.3).
Consequently, moisture contents of PON1 and MFPON1 doughs had the highest
values, almost 24.5% when compared to the other doughs, PONs and MFPONs,
at 3.75% and 7.5% of MD.
According to the ANOVA results, there was no significant difference in terms of
moisture content between the doughs with MF and without MF at 0% and 3.75%
MD; however, there was a significant difference in terms of moisture content
between the doughs with MF and without MF at 7.5% MD. According to the
Figure 3.4, as the MD amount increased in dough, amount of additional water,
used for making MD gel, decreased, leading to decrease in moisture content of
doughs containing high MD. Since MD binded water freely present in dough to
form network, if MD present at high amount, high denser network and more rigid
structure were formed. That resulted in decrease in moisture content of doughs
containing MD at high percentage 3.4. The result of the study showed that the
use of MD had an increasing effect on the dough hardness and decreasing effect
on the moisture content of doughs containing MD compared to control dough and
dough containing Melted PON. Also, MF process did not significantly change
the moisture contents of doughs. In parallel to that, the moisture content ranged
from nearly 23% to about 18%.
The same correlation was observed for the cookies made of 0- and 7- day doughs
with PS, too. In Figures 3.5 and 3.6, there was no significant difference between
the doughs with and without MF process in terms of 0-day and 7-day moisture
contents (p ≤ 0.05). However, there was an exception for 7-day moisture content
of dough containing 7.5% MD (p ≤ 0.05). Also, both 0-day and 7-day moisture
contents of dough was inversely correlated with the increment in the percentage
of MD. Moisture content decreased as the use of MD amount increased and it
was related to that how much water added in the formulation. Also, while the
45

Figure 3.4: Hardness and Moisture Contents of 7-day Doughs including PONbeing evaluated in terms of the Percentages of Maltodextrin
dough contained nearly 23% of 0-day moisture content and nearly 22% of 7-day
moisture content as the highest value, it contained about 18% of 0-day moisture
content and 16% of 7-day moisture content as the lowest value.
Some changes were observed in 0-day cohesiveness when the MD amount was
sufficiently high in the dough (Figure 3.7). As the percentage of MD increased, 0-
day cohesiveness of doughs without and with MF process decreased. Similarly, in
the study carried out by (Sudha, Srivastava, et al., 2007), when fat was replaced
with MD, cohesiveness of the dough decreased to some extent. However, 0-day
cohesiveness was not significantly different between PON2 and PON3 and also
MFPON2 and MFPON3 (p ≤ 0.05).
The cohesiveness was high in the control dough, PON1 and MFPON1 since in-
termolecular stickiness of doughs was high that was binding between molecules
of dough was stronger while the cohesiveness of doughs containing MD was
lower. The reason was that MD plays a role as a functionally inert matter that
was an obstacle for strong intermolecular binding. Therefore, in the presence of
MD, binding between molecules of dough was weaker, leading to reduction in
cohesiveness of dough. The result could be explained by water distribution in
the dough because starch and fat affected the water distribution in the cookie
46

Figure 3.5: Hardness and Moisture Contents of 0-day Doughs including PS beingevaluated in terms of the Percentages of Maltodextrin
(Assifaoui et al., 2006). Therefore, these components should have been taken
into consideration since they influenced cohesive property of dough (Sudha, Sri-
vastava, et al., 2007).
Furthermore, PON1 is significantly difference in terms of 7-day cohesiveness
from PON2 and PON3 (p ≤ 0.05). Similarly, MFPON1 is significantly differ-
ence from 7-day cohesiveness of MFPON2 and MFPON3 (p ≤ 0.05). As the
percentage of MD raises cohesiveness of dough reduces in the Figure 3.7. Hav-
ing a low cohesiveness is generally observed when dough includes high amount
of MD. It can be explained that MD has a reducing effect on the cohesiveness
of dough even though cookies are characterized by a highly cohesive structure
(Maache-Rezzoug et al., 1998a). Also, in the Figure 3.7, MF process does not
have any effect on both 0-day and 7-day cohesiveness; thus, there is no signifi-
cant difference between the dough processed with MF and the dough processed
without MF (p ≤ 0.05).
As similar to cohesiveness of doughs prepared with PON, increase in the MD
percentage decreased both 0-day and 7-day cohesiveness of doughs prepared
with PS. In the Figure 3.8, PS1 was significantly different from PS2 and PS3
in terms of 0-day and 7-day cohesiveness (p ≤ 0.05). MFPS1 was significantly
47

Figure 3.6: Hardness and Moisture Contents of 7-day Doughs including PS beingevaluated in terms of the Percentages of Maltodextrin
different from MFPS2 and MFPS3, as well (p ≤ 0.05). This difference between
dough cohesiveness came from changing in the amount of MD. When MD was
available in a sufficient amount in the dough, differences between cohesiveness
were significantly observed and the doughs had lower cohesiveness, accordingly.
As in the example of PS2 and PS3 or MFPS2 and MFPS3 for 0-day cohesiveness,
there was no significant difference between them (p ≤ 0.05). The reason could
be that there was no sufficient increase in the MD.
By contrast with MD, according to ANOVA, there was no significant difference
in terms of cohesiveness between the doughs with MF and without MF at each
MD percentage. Thus, it could be inferred that MF did not have any impact on
the 0-day and 7-day cohesiveness of doughs.
3.2 Dough Rheology
3.2.1 Elastic Property of Doughs
Elastic modulus (G’) of 0-day dough samples containing emulsions prepared
with palm olein with different maltodextrin percentages and by different meth-
48

Figure 3.7: The Effects of MD and MF Process on the 0- day and 7-day Cohe-siveness of Doughs including PON
ods (see Figure 3.9). The increase in the percentage of MD led to increases
in elastic modulus of 0-day doughs (see Figure 3.9). That is, decreasing water
content of dough increased elastic modulus of dough. In parallel to this result,
there was a general consensus that as water content increased both elastic and
viscous moduli decreased (Milašinović Šeremešić et al., 2013). This was associ-
ated with the use of MD in the formulation. When less amount MD was used,
water content was high, which increased elastic modulus values as found in the
study of (Milašinović Šeremešić et al., 2013). Moreover, the replacement of
palm olein with emulsions prepared with maltodextrin at 0%, 3.75%, and 7.5%
resulted in harder cookie dough samples. According to the study conducted by
(Hadnađev et al., 2014), increase in the amounts of MD gel in blends resulted
in increased in the hardness values of regardless of maltodextrin type. As seen
in the Figures 3.21, 3.22 and the other cookie hardness figures, cookie hardness
increased with increasing percentages of MD.
Furthermore, the replacement of PON by microfludized emulsions increased in
elastic modulus of dough. This might be due to the fact that microfludization
process affected water droplets containing MD, and reduced droplet size, leading
to increase the apparent viscosity and this resulted in higher elastic behavior
49

Figure 3.8: The Effects of MD and MF Process on the 0- day and 7-day Cohe-siveness of Doughs including PS
(Vanderghem et al., 2007).
G’ values of control dough were lower as compared to elastic modulus of the
doughs made from maltodextrin (see Figure 3.9). This was because fat prevented
the formation of gluten network and produced a less elastic dough (Faubion &
Hoseney, 1990). Also, G’ values of dough (PON1) containing maximum amount
of water; i.e., containing 0% MD were the lowest. On the other hand, the highest
elastic modulus value was obtained in the dough sample (MFPON3) containing
7.50% MD and treated by microfludization process because MF process de-
creased particle size that increased surface area and this resulted in increase in
viscosity; consequently, increase in elastic modulus. However, according to the
study carried out by Maache-Rezzoug et al. (1998a), a highly elastic dough was
not desirable in cookie making. Therefore, the dough (PON3) containing 7.5%
MD without MF process might be the best solution in terms of elastic modulus.
Elastic modulus of cookie dough with PON stored for 7 days as a function of
MD percentages were shown in Figure 3.10. On the other hand, there was a
progressive increment on the elastic modulus of doughs with increasing mal-
todextrin amount. In a study conducted by Hadnađev et al. (2014), it was at
50

Figure 3.9: The Effects of MD and MF Process on the Elastic Modulus of 0-dayDoughs including PON
each frequency complex modulus which was the combination of the storage and
loss moduli increased with increasing maltodextrin gel concentration meaning
that at higher concentrations, maltodextrin gels exhibited stronger viscoelastic
properties. In addition to that, increasing elastic modulus demonstrated increas-
ing strength of cookie dough samples as Yıldız (2014) indicated in her study as
well. Moreover, sharp increase in G’ values of the samples, especially PON and
Melted PON, was observed after the doughs stored for 7 days and the highest
elastic modulus value was obtained with Melted PON. The reason might be that
fat crystallization highly occurred during melting palm olein as well during the
storage at refrigerator. In addition to these factors that increased in elastic mod-
ulus of dough, sucrose crystallization and MD or starch retrogradation might be
observed and made denser the dough; consequently, increased the viscosity and
also increased the elastic modulus.
Elastic modulus values of 0-day dough samples prepared with the replacement
of PS by emulsions with different MD percentages were given in Figure 3.11.
When compared with Figure 3.9, the samples which contained PS showed higher
storage modulus values than the samples including PON. The reason was that
fat level, fat type, solid fat content and fat polymorphism influence fat crystal
51

Figure 3.10: The Effects of MD and MF Process on the Elastic Modulus of 7-dayDoughs including PON
network (Deman, 2000) which had a significant effect on the rheological charac-
teristics of cookie dough and on the properties of baked cookies as well (Chugh
et al., 2013). Moreover, the other study carried out on behalf of evaluating the
physical and chemical properties of different types of shortenings showed similar
results in terms of higher dominated effect of PS than PON on the storage and
loss moduli (Ariffin et al., 2011). In this study, it was found that the sample
which contained 100% of palm oil did not have high storage modulus (G’); how-
ever, the sample which contained 100% of palm stearin had very high storage
modulus. It was obvious that both studies show similar results. Both could be
explained by the fact that palm stearin in the formulations produced a progres-
sive increase in the viscosity values resulted in increase in elastic behaviour of
dough (Ariffin et al., 2011). The presence of palm stearin had a direct influence
on both the elastic and viscous behaviors of the shortenings (Ariffin et al., 2011)
because PS had higher solid fat content than PON and that led to increase
viscosity; consequently, increased elastic modulus of dough with PS.
Elastic modulus of 0-day doughs also increased with MD concentration (see
Figure 3.11). Further increases in elastic modulus was also observed at higher
MD percentages in another study (Hadnađev, Hadnađev, et al., 2011) because
52

there was an increase in the solid amount (MD) in the dough formulation. In
this study, product containing reduced fat with 15%, 30% and 50% MD gel
showed sticky behavior in comparison to control sample. That is, maltodextrin
gel addition resulted in significant increase in apparent viscosity value that led
to significant increase in elastic modulus. All these studies indicated that rheo-
logical behavior was mainly controlled by the properties of maltodextrin phase
(Hadnađev, Dokić, et al., 2011).
The G’ values of dough samples at the same percentage MD prepared without
microfluidization were higher than those prepared with microfluidization. These
rheological results of doughs were also parallel to dough hardness as shown in
Figure 3.1. The highest elastic modulus value was obtained in the dough sample
(PS3) containing 7.5% MD and emulsion without microfluidization. Moreover,
G’ values of control dough were close to the G’ of PS1.
Figure 3.11: The Effects of MD and MF Process on the Elastic Modulus of 0-dayDoughs including PS
In the Figure 3.12, elastic modulus of 7-day dough samples containing emulsions
prepared with palm stearin with different maltodextrin percentages and by dif-
ferent methods were indicated. The G’ values of the 7-day doughs prepared with
and without microfludization at the same MD percentage approximated to each
53

other. Consequently, it could be inferred that there was no microfluidization
effect on the elastic modulus of 7-day doughs. Also, contrary to the Figure 3.11,
higher G’ values were obtained due to 7-day storage at refrigerator. The highest
elastic modulus values were obtained in the dough samples of Melted PS and
PS3.
Figure 3.12: The Effects of MD and MF Process on the Elastic Modulus of 7-dayDoughs including PS
In a past study concluding similar results compared to current thesis results,
MD gel addition showed increase in apparent viscosity, yielded stress value and
elastic modulus compared to control (Hadnađev, Hadnađev, et al., 2011). Also,
the application of MF process increased G’ of dough in Figures 3.9–3.12. This
could be explained with the results of the other investigation conducted by Ciron
et al. (2010). In this investigation, MF process disrupted fat globules and con-
sequently reduces size of globules. Thus, there was an increase in their surface
area that increased the interaction between fat globules and other ingredients.
This allowed the viscosity of dough to increase because better interaction be-
tween reduced sized fat globules and MD gel took place due to the application
of MF process and use of emulsifier (Ciron et al., 2010). Therefore, increase
in the viscosity of dough led to increase in G’ value. However, according to
ANOVA results (see Appendix C), when the elastic modulus of dough with MF
54

was compared to that of dough without MF, effect of MF on increase in elastic
modulus was less significant compare to use of MD. In other words, the use MD
is more effective on elastic modulus than the application of MF.
3.2.2 Viscous Property of Doughs
The Figure 3.13 showed that viscous modulus of 0-day dough samples containing
emulsions prepared with palm olein with different maltodextrin percentages and
by different methods. Similar to the Figure 3.9, G” values also were to be
increase as the concentration of MD was increased. In other words, decreasing
water content of dough increased elastic and viscous modulus of dough. Water
played an important role in determining the viscoelastic properties of dough.
Both G’ and G” decreased as water content increased (Amjid et al., 2013).
Moreover, when G’ and G” values of doughs were compared, G” values were
lower than those of G’, i.e., the dough samples were more elastic rather than
viscous in character.
Furthermore, the replacement of palm stearin by microfluidized emulsions re-
sulted in higher G” values as expected. The highest viscous modulus value
was obtained in the dough sample (MFPON3) containing 7.5% MD with mi-
crofluidization process. On the contrary, the lowest elastic and viscous moduli
belonged to PON1 due to containing high level water as compared to the others
and control cookie doughs (PON and Melted PON) followed PON1 in terms of
low elastic and viscous moduli (Duman, 2013).
In the Figure 3.14, viscous modulus of 7-day dough samples containing emul-
sions prepared with palm olein with different maltodextrin percentages and by
different methods were indicated. The G” values of 7-day doughs prepared with
and without microfludization at the same MD percentage were approximated to
each other. Also, G” values of the samples, especially PON and Melted sharply
increased after the doughs stored for 7 days. The highest viscous modulus value
was obtained in the dough sample (Melted PON).
Viscous modulus values of 0-day dough samples prepared with the replacement
55

Figure 3.13: The Effects of MD and MF Process on the Viscous Modulus of0-day Doughs including PON
of palm stearin by emulsions with different MD percentages were given in Figure
3.15. Similar to the Figure 3.13, when the percentage of MD in the emulsions
prepared with and without microfluidization increased, viscous modulus of 0-
day doughs also increased. Since viscoelastic properties of dough were strongly
influenced by the amount and the type of fat present (Goldstein & Seetharaman,
2011) there were increments in the values of loss modulus of 0-day doughs when
PS fat type was preferred instead of PON. When the results with PS were
compared to the Figure 3.13, G” values were found to increase as PS was used
in the dough samples instead of PON. The similar trend was also observed in
the Figure 3.11. This could probably due to the higher viscosity resulted in
increase in viscous behavior of dough. These values showed that the presence
of palm stearin had a direct effect on the both elastic and viscous behaviours of
the dough.
The Figure 3.16 showed viscous modulus of 7-day dough samples containing
emulsions prepared with palm stearin with different maltodextrin percentages
and by different methods. After 7-day storage of the dough samples, G” values
for all samples increased sharply. Melted PS and PS3 were close to each other.
This indicated that the storage of doughs led to increase in viscous behavior.
56

Figure 3.14: The Effects of MD and MF Process on the Viscous Modulus of7-day Doughs including PON
3.3 Cookie Hardness
The 0th day and 7th day hardness of cookies made from 0-day doughs containing
PON with different MD percentages were shown in Figure 3.21. When 0-day
hardness of control cookie was compared to those of cookies prepared by the
replacement of fat with different level MD, there was an increase in the cookie
hardness (Figure 3.17). The same result was observed with the study conducted
by Pareyt et al. (2009). As the percentage of MD increased, cookie hardness
increased.
0- day hardness of cookies with MF and without MF are significantly different
for both 0% and 3.75% MD; however, the hardness of cookies at 7.5% MD was
not significantly different from each other (p ≤ 0.05) (Figure 3.17). Also, it
could be seen that there was an obvious reducing effect of MF on the cookie
hardness, especially at 0% and 3.75% MD. With the use of MF process, 0th
cookie hardness reduced at around 43% and 87% respectively. Moreover, the
hardness of cookie without MF at 0% MD was significantly different from those
without MF at 3.75% MD and 7.5% MD (p ≤ 0.05).
Moreover, there was no significant difference between the cookies with MF and
57

Figure 3.15: The Effects of MD and MF Process on the Viscous Modulus of0-day Doughs including PS
without MF at different MD percentages for the effect of MF on the 7th day
hardness (p ≤ 0.05). Also, there was no significant difference between the cookies
without MF at different MD percentages on the 7th day hardness (p ≤ 0.05).
According to rheology result in the Figure 3.10, after 7 day storage the effect
of MF was not significantly observed (p ≤ 0.05). Thus, it was expected that
the effect of MF on the cookie hardness was not observed. However, the cookie
with MF at 0% MD was not significantly different from the cookie with MF at
3.75% MD while it was significantly different from the cookie with MF at 7.5%
MD (p ≤ 0.05).
The 0th day and 7th day hardness of cookies made from 7-day doughs containing
PON with different MD percentages were shown in Figure 3.18. When the Figure
3.18 was compared with the Figure 3.17, there was an increment in the 0-day
hardness of the control cookie by 37.5% because of 7 day storage of the doughs
at refrigerator.
Moreover, there was no significant difference for the 0-day hardness between
the cookies with MF and without MF at different percentages (p ≤ 0.05). In
other words, MF did not have any considerable impact on the 0- day hardness.
In addition, MF did not have any significant effect on the 7-day hardness of
58

Figure 3.16: The Effects of MD and MF Process on the Viscous Modulus of7-day Doughs including PS
the cookies at each MD percentage (p ≤ 0.05). Also, there was no significant
difference between the cookies with MF at different MD percentages for the 7-
day hardness. Likewise, there was no significant difference between the cookies
without MF at each MD percentages for the hardness. Therefore, it could be
inferred that MD did not have any effect on the 7-day hardness of cookie made
from 7-day dough (Figure 3.18).
The 0th day and 7th day hardness of cookies made from 0-day doughs contain-
ing PS with different MD percentages were shown in Figure 3.18. The hardness
values of the cookies depended on the percentage of fat replacement; conse-
quently, hardness of cookies generally increased with fat replacement (Zoulias
et al., 2002). When hardness of control cookie was compared to those of cookies
prepared by the replacement of fat with different level MD, there was an increase
in the cookie hardness as seen from the Figure 3.19. This was in agreement with
earlier result by Sudha, Srivastava, et al. (2007). MF did not have significant
effect on the hardness of the cookies at each MD percentage (p ≤ 0.05).
The 0th day and 7th day hardness of cookies made from 7-day doughs containing
PS with different MD percentages were shown in Figure 3.20. When the hardness
of the cookies made from 7 day doughs was compared with the hardness of the
59

Figure 3.17: The Effects of MD and MF Process on the 0- and 7- day Hardnessof Cookies Prepared from 0-day Doughs with PON
ones made from 0 day doughs, the increase in the hardness of the control cookie
was observed at nearly 35% because of the effect of 7 day storage of doughs at
refrigerator. However, there was no significant effect of MF process for the 0th
day hardness between the cookies with MF and without MF at different MD
percentages (p ≤ 0.05). In other words, MF process did not have any effect on
the hardness. Also, there was no significant difference for the hardness among
the cookies without MF at each MD percentages (p ≤ 0.05). So, increase in the
MD amount did not result in significantly increase in the hardness of the cookies
without MF. However, the significant effect of increment in the percentages of
MD was only observed in the hardness of the cookie with MF at 7.5% MD.
When the 7-day hardness of the control cookie was compared with the 0-day
hardness of control cookie, there was an increment in the hardness of the control
cookie at around 28% due to 7-day storage of the cookies at room temperature.
The increase in the hardness was an expected result throughout the staling
period of the cookies.
The Figure 3.21 indicated the 0th day hardness and the moisture content values
of cookies made from 0-day doughs containing PON with different MD percent-
ages. There was no significant difference between the cookies at 0% MD for
60

Figure 3.18: The Effects of MD and MF Process on the 0- and 7- day Hardnessof Cookies Prepared from 7-day Doughs with PON
the effect of MF on the 0th day moisture content (see Figure 3.21). Similarly,
MF had no significant effect on the moisture content between the cookies at
7.5% MD. However, MF significantly showed its effect on the 0th day moisture
content of cookies containing 3.75% MD. Also, the moisture contents of cook-
ies prepared 0-day doughs with MF were higher than those of cookies prepared
without MF. That was because the hydration properties increased with decreas-
ing particle size. Since the smaller fiber particles increased the surface area for
better water absorption, they had higher swelling capacity (Sowbhagya et al.,
2007). In addition, as the percentage of MD increased, 0th day moisture con-
tent of cookies slightly decreased. However, moisture contents of all the cookies
prepared from emulsions were higher than that of control cookie. It was an ex-
pected result because according to the study conducted by Pimdit et al. (2008)
the addition of fat replacer increased the moisture content of the reduced fat
products. This was because fat replacer generally absorbed more water (Akoh,
1998). Consequently, as MD percentage increased, hardness of cookie increased;
but, moisture content of cookie decreased.
The Figure 3.22 indicated the 7th day hardness and the moisture content values
of cookies made from 0-day doughs containing PON with different MD percent-
ages. When 0-day hardness of cookie was compared with 7-day hardness of
61

Figure 3.19: The Effects of MD and MF Process on the 0- and 7- day Hardnessand Moisture Contents of Cookies Prepared from 0-day Doughs with PS
cookie, after 7-day storage of cookies at room temperature, cookie hardness at
7th day increased as expected because as water loss increased, cookie hardness
increased (Figure 3.22). For instance, there was an increase in the 7-day hardness
of the control cookie at around 67%. On the contrary, there was a reduction in
the moisture content after 7 day storage and 7th day moisture content of cookie
was reduced by 9%. Furthermore, MF did not have a significant effect on 7th
day the moisture content of the cookies with MF and without MF at 0% and
7.5% MD while it significantly affected the moisture content of the cookies at
3.75% MD (p ≤ 0.05). The cookie with MF at 0% MD was significantly different
for moisture content from the cookies with MF and without MF at 3.75% and
7.5% MD.
The Figure 3.23 indicated the 0th day hardness and the moisture content values
of cookies made from 7-day doughs containing PON with different MD percent-
ages. The maximum 0-day moisture content was nearly 14% for the cookies at
0% MD and the lowest one at 7.5% MD was nearly 10%. The effect of the MF
was significantly observed on the moisture content between the cookies with MF
and without MF at 3.75% and 7.50% MD (p ≤ 0.05) (Figure 3.23). MF did not
affect the moisture content of the cookies containing 0% MD. However, when
the MD percentages increased, MF showed its reducing effect on the moisture
62

Figure 3.20: The Effects of MD and MF Process on the 0- and 7- day Hardnessand Moisture Contents of Cookies Prepared from 7-day Doughs with PS
content of the cookies at 3.75% and 7.5% MD and approximately 10% and 17%
decrease in moisture content were observed, respectively. Moreover, the cookie
without MF at 0% MD was not significantly different from the cookie without at
3.75% MD; however, it was significantly different from the cookie without MF
at 7.5% MD (p ≤ 0.05). The considerable effect of the MD was observed for the
moisture content at 7.5% MD. In general, moisture content was slightly reduc-
ing with increasing MD percentages and that resulted in increase in hardness of
cookie.
The Figure 3.24 showed the 7-day hardness and the moisture content values of
cookies made from 7-day doughs containing PON with different MD percentages.
There was a significant effect of MF on the moisture content between the cookies
with MF and without MF at 3.75% and 7.5% MD (p ≤ 0.05). The cookies
with MF were significantly different from each MD percentages and as the MD
percentage raised, moisture content decreased from 13.6% to 8.81%; however,
7-day hardness of cookie made from 7-day dough increased.
The Figure 3.25 showed the 0-day hardness and the moisture content values of
cookies made from 0-day doughs containing PS with different MD percentages.
When compared with Figure 3.21, it was clearly seen that there was an increment
63

Figure 3.21: The 0th day Hardness and Moisture Contents of 0-day Doughsincluding PON being evaluated in terms of the Percentages of Maltodextrin
in the 0-day cookie hardness at around 23% because of the use of PS instead
of PON. However, the use of PS rather than PON in the cookie did not affect
moisture content.
In the Figure 3.25, there was a significant difference for the moisture content
between the cookies with MF and without MF at 0%; however, there was no a
significant difference for the moisture content between the cookies with MF and
without MF at 3.75% and 7.50%. Also, the effect of MD on the 0-day hardness of
the cookie without MF was significantly observed after 3.75% MD. There was no
significant effect of MD on the 0-day hardness on the cookie with MF at each MD
percentages. It could be inferred that the amount of fat replaced by maltodextrin
solution at different percentages might be increased. Furthermore, the effect of
MD on the moisture content was clearly observed on the cookies without MF
process at each MD percentages. As MD percentage raised, moisture content of
the cookies without MF reduced while 0-day hardness of cookie increased.
The Figure 3.26 showed the 7 th day hardness and moisture content values
of the cookies prepared from 0-day doughs containing PS with different MD
percentages. There was an increment in the 7-day hardness of the control cookie
at nearly 56% when compared with the 0-day hardness of control cookie (Figure
64
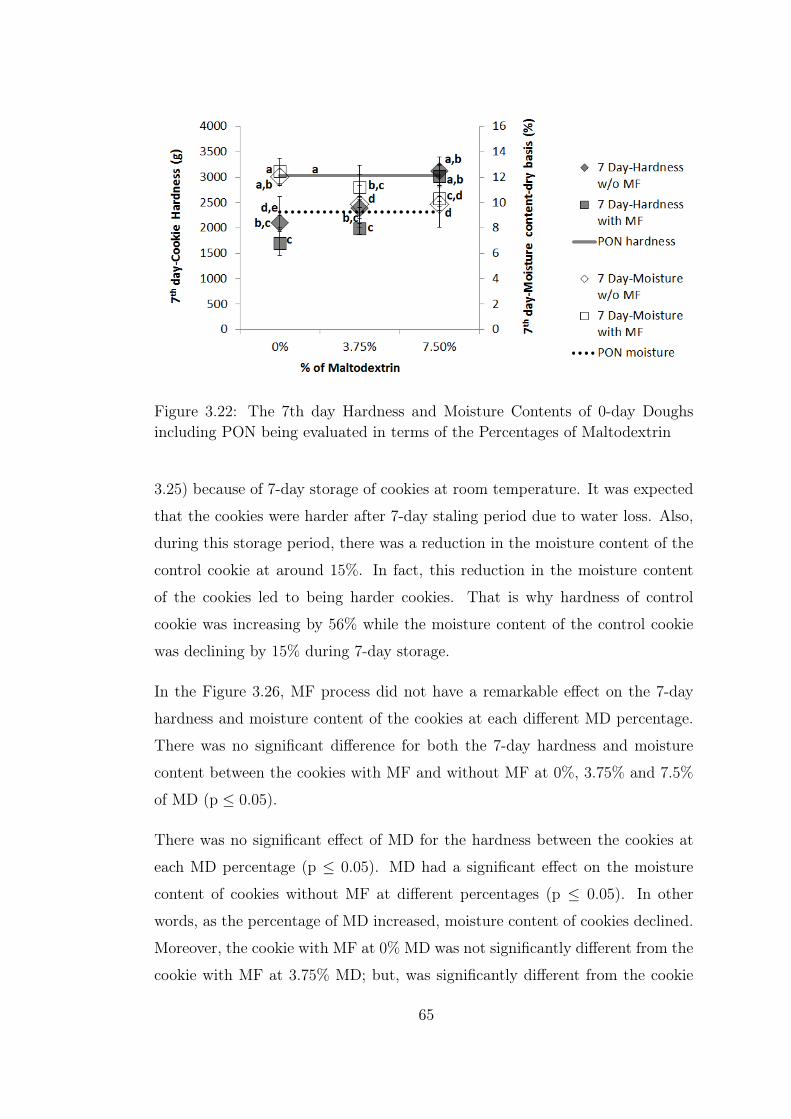
Figure 3.22: The 7th day Hardness and Moisture Contents of 0-day Doughsincluding PON being evaluated in terms of the Percentages of Maltodextrin
3.25) because of 7-day storage of cookies at room temperature. It was expected
that the cookies were harder after 7-day staling period due to water loss. Also,
during this storage period, there was a reduction in the moisture content of the
control cookie at around 15%. In fact, this reduction in the moisture content
of the cookies led to being harder cookies. That is why hardness of control
cookie was increasing by 56% while the moisture content of the control cookie
was declining by 15% during 7-day storage.
In the Figure 3.26, MF process did not have a remarkable effect on the 7-day
hardness and moisture content of the cookies at each different MD percentage.
There was no significant difference for both the 7-day hardness and moisture
content between the cookies with MF and without MF at 0%, 3.75% and 7.5%
of MD (p ≤ 0.05).
There was no significant effect of MD for the hardness between the cookies at
each MD percentage (p ≤ 0.05). MD had a significant effect on the moisture
content of cookies without MF at different percentages (p ≤ 0.05). In other
words, as the percentage of MD increased, moisture content of cookies declined.
Moreover, the cookie with MF at 0% MD was not significantly different from the
cookie with MF at 3.75% MD; but, was significantly different from the cookie
65

Figure 3.23: The 0th day Hardness and Moisture Contents of 7-day Doughsincluding PON being evaluated in terms of the Percentages of Maltodextrin
with MF at 7.5% MD.
The Figure 3.27 indicates the 0 th day hardness and the moisture content values
of the cookies prepared from 7 day doughs with different MD percentages. The
increase in the MD amount did not significantly result in the increase in the
hardness of the cookies. Moreover, the 0th day moisture content of the control
cookie was not affected by these storage period at the refrigerator. The con-
siderable effects of MF process and percentages of MD on the moisture content
were only observed on the cookies containing 7.5% MD.
The Figure 3.28 indicated the 7-day hardness and the moisture content values of
the cookies prepared from 7-day doughs with different MD percentages. There
was an increment in the hardness of the control cookie at around 28% due to 7-
day storage of the cookies at room temperature. However, during staling period,
changing in the moisture content of the control cookie was nearly 1.36% with
reduction. Moreover, MF process did not have a considerable effect on both the
hardness and moisture content of the cookies because there was no significant
difference between the cookies with MF and without MF at each MD percentage.
The increase in the MD percentages did not significantly affect the hardness and
moisture content of the cookies at different MD percentages as well.
66
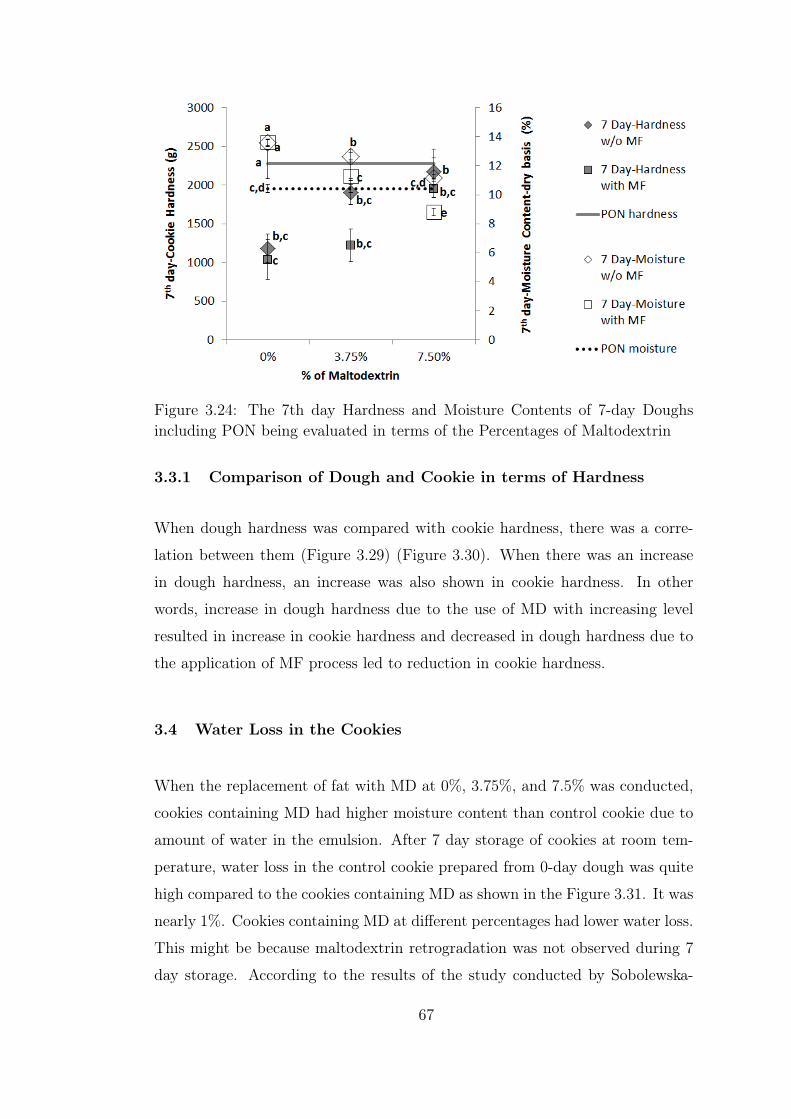
Figure 3.24: The 7th day Hardness and Moisture Contents of 7-day Doughsincluding PON being evaluated in terms of the Percentages of Maltodextrin
3.3.1 Comparison of Dough and Cookie in terms of Hardness
When dough hardness was compared with cookie hardness, there was a corre-
lation between them (Figure 3.29) (Figure 3.30). When there was an increase
in dough hardness, an increase was also shown in cookie hardness. In other
words, increase in dough hardness due to the use of MD with increasing level
resulted in increase in cookie hardness and decreased in dough hardness due to
the application of MF process led to reduction in cookie hardness.
3.4 Water Loss in the Cookies
When the replacement of fat with MD at 0%, 3.75%, and 7.5% was conducted,
cookies containing MD had higher moisture content than control cookie due to
amount of water in the emulsion. After 7 day storage of cookies at room tem-
perature, water loss in the control cookie prepared from 0-day dough was quite
high compared to the cookies containing MD as shown in the Figure 3.31. It was
nearly 1%. Cookies containing MD at different percentages had lower water loss.
This might be because maltodextrin retrogradation was not observed during 7
day storage. According to the results of the study conducted by Sobolewska-
67

Figure 3.25: The 0th day Hardness and Moisture Contents of 0-day Doughsincluding PS being evaluated in terms of the Percentages of Maltodextrin
Zielińska and Fortuna (2010), maltodextrin at low concentrations (6, 9, 26, 29%)
retarded the retrogradation of starch. Also, maltodextrins having high dextrose
equivalence value had much less tendency to retrogradate (Eliasson & Larsson,
1993). Moreover, emulsifier, one of the surfactants, used in the cookie dough
hinder retrogradation (Sobolewska-Zielińska & Fortuna, 2010). Consequently,
the water was not free since water bounded by maltodextrin was still in the
network and was not expelled. Therefore, water loss occured in the cookies
containing MD at small level and was around 0.4%.
On the other hand, the situation was different in the cookies prepared from the
doughs stored for 7 days at refrigerator. The cookies containing MD had still
higher moisture content than control cookie and water loss in these cookies was
higher than that of control cookie. However, at this time, water loss in the
control cookie was quite low than those of cookies containing MD at different
levels and it was lower than 0.2%. It might be because of stored at refrigerator of
dough. During storage at refrigerator, most of the water present in the cookies
including MD was evaporated. Thus, water loss in the cookies including MD
was highly observed after 7 day storage at room temperature.
68

Figure 3.26: The 7th day Hardness and Moisture Contents of 0-day Doughsincluding PS being evaluated in terms of the Percentages of Maltodextrin
3.5 Change in Height and Diameter
In the Figure 3.35, there was no significant difference between 0-day height and
7-day height (p ≤ 0.05). Storage of cookies during 7 days did not result in
any significant changes in terms of the height of the cookies. Moreover, the
doughs with MF and without MF were significantly different from the control
doughs. The control group, PON day0 and Melted PON day0, had the lowest
height value with the range of 0.9-1.0 cm whereas PON1 day0 and MFPON1
day0 had the highest height values with 1.31 cm and 1.48 cm, respectively since
these doughs consisted of more water than the others that led to rise up the
cookie during baking. Furthermore, the use of MD in cookie dough reduced
the height of cookie as compared to the use of water in the place of MD (0%
MD) (Figure 3.35). PON1 was significantly different from PON2 and PON3
or similarly, MFPON1 was significantly different from MFPON2 and MFPON3
(p ≤ 0.05). On the other hand, the use of MD increased the height of the cookie
when compared with the control group. Also, as shown in the Figure 3.35 MF
process did not significantly affect the height of cookies by contrast with the
effect of MD.
69

Figure 3.27: The 0th day Hardness and Moisture Contents of 7-day Doughsincluding PS being evaluated in terms of the Percentages of Maltodextrin
The Figure 3.36 showed the changes in 0-day and 7-day heights of the cookies
made from the dough stored during 7 days at the refrigerator. When it was
compared with the Figure 3.35, the heights of the cookies made from 7-day
doughs were higher than those of cookies made from 0-day doughs. For instance,
PON day0 had 0.9 cm height while PON day7 had 1.08 cm height. Also, there
was no significant difference between 0-day height and 7-day height of cookies
(p ≤ 0.05). In other words, storage at room temperature of the cookies did
not lead to considerable changes in the cookie height. Moreover, there is no
significant difference between the cookies with MF and without MF (p ≤ 0.05).
Therefore, it could be inferred that MF process does not affect changing in
the height for both 0 and 7 days. Moreover, the heights of PON3 day7 and
MFPON3 day7 were not significantly different from each other; however, their
heights were significantly different from the others when they compared to the
remaining cookies (p ≤ 0.05). In other words, when 7.5% MD was used, the
cookies showed the highest height value.
The use of MD gel in the place of fat increased the height of cookies made from
0-day doughs compared to the heights of PS day0 and Melted PS day0 cookies
(Figure 3.37), as well. PS1 day0 was not significantly different from PS2 day0 in
70
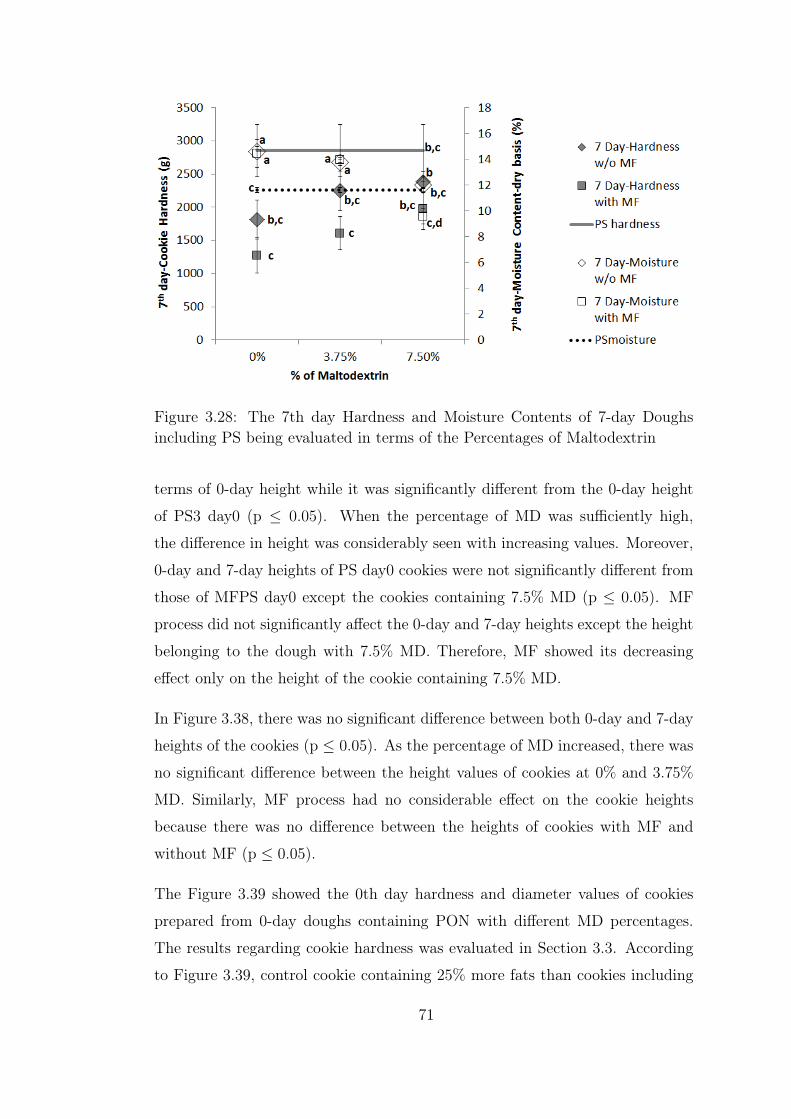
Figure 3.28: The 7th day Hardness and Moisture Contents of 7-day Doughsincluding PS being evaluated in terms of the Percentages of Maltodextrin
terms of 0-day height while it was significantly different from the 0-day height
of PS3 day0 (p ≤ 0.05). When the percentage of MD was sufficiently high,
the difference in height was considerably seen with increasing values. Moreover,
0-day and 7-day heights of PS day0 cookies were not significantly different from
those of MFPS day0 except the cookies containing 7.5% MD (p ≤ 0.05). MF
process did not significantly affect the 0-day and 7-day heights except the height
belonging to the dough with 7.5% MD. Therefore, MF showed its decreasing
effect only on the height of the cookie containing 7.5% MD.
In Figure 3.38, there was no significant difference between both 0-day and 7-day
heights of the cookies (p ≤ 0.05). As the percentage of MD increased, there was
no significant difference between the height values of cookies at 0% and 3.75%
MD. Similarly, MF process had no considerable effect on the cookie heights
because there was no difference between the heights of cookies with MF and
without MF (p ≤ 0.05).
The Figure 3.39 showed the 0th day hardness and diameter values of cookies
prepared from 0-day doughs containing PON with different MD percentages.
The results regarding cookie hardness was evaluated in Section 3.3. According
to Figure 3.39, control cookie containing 25% more fats than cookies including
71

Figure 3.29: Comparison between Hardness of Cookie made from 0-day Doughand Hardness of 0-day Dough with PON
MD had the highest diameter value because of the having less elastic property
of dough (Zoulias et al., 2000) shown in Section 3.2. According to Jacob and
Leelavathi (2007), increase in cookie diameter with higher fat levels might be
probably clarified with the effect of fat on air incorporation during dough mak-
ing. They claimed that the amount of air incorporation lower the dough density
and decreased the dough viscosity, which resulted in larger cookie diameter.
When the 0-day diameter values of cookies including MD at different levels were
evaluated, there was no significant difference between the cookies without MF
including MD at 0%, 3.75% and 7.5% (p ≤ 0.05). In other words, increase in
the percentage of MD from 0% to 7.5% did not result in any observable changes
in 0-day diameters of cookies without MF and this value was around 7 cm.
However, the 0-day diameters of cookies with MF at 0%, 3.75% and 7.5% of
MD were significantly different from each other (p ≤ 0.05). Among the cookies
made from 0-day doughs, the cookie with MF at 3.75% MD had the highest
diameter at around 7.6 cm while the cookie with MF at 0% MD had the lowest
diameter value at around 6.37 cm. Also, MFPON2 had the closest hardness and
diameter values of the control with 1300 g and 7.6 cm.
72

Figure 3.30: Comparison between Hardness of Cookie made from 0-day Doughand Hardness of 0-day Dough with PS
The Figure 3.40 showed the 0th day hardness and diameter values of cookies
prepared from 7-day doughs containing PON with changing MD percentages.
When compared with the Figure 3.39, there was no change in the diameter of
the cookies and it was around 7 cm. There was no significant difference for
the diameter between the cookies without MF at different MD percentages. On
the other hand, there was a significant difference for the diameter between the
cookies with MF at each MD percentage. Also, the cookie with MF containing
0% MD had highest diameter value at around 7.3 cm whereas the cookie with
MF containing 3.75% MD had the lowest diameter value at around 6.8 cm.
The Figure 3.41 showed the 0th day hardness and diameter values of cookies
prepared from 0-day doughs including PS with changing MD percentages. When
compared to the Figure 3.39, there was no remarkable change in the diameter of
the control cookie while using PS instead of PON in the cookie. When control
cookie was compared to the cookies containing MD at different levels, diameter
was influenced in the same manner as in the case of PON used in cookie in
Figure 3.39, which resulted in reduction in cookie diameter with fat replacement.
Consequently, the use of MD in cookie had a decreasing effect on the diameter
compared to the control cookie similar to the findings of Zoulias et al. (2000).
73

Figure 3.31: The Change in Water Loss of Cookies made from 0-day Doughswith PON during 7-day Storage at Room Temperature
Their study showed that there is not significant difference in diameter between
control and other fat reduced cookies.
Also, there was no significant difference for the diameter between the cookies
both with MF and without MF at different MD percentages (p ≤ 0.05). The
highest diameter value was around 6.8 cm belonging to the cookie with MF at
7.5% whereas the lowest one was around 6.2 cm.
The Figure 3.42 showed the 0th day hardness and diameter values of cookies
prepared from 7-day doughs including PS with changing MD percentages. When
compared to the Figure 3.41, there were almost no changes in the diameters of
the cookies made from 7-day doughs. The diameters of cookies made from 7-
day doughs changed from 7.0 cm to 6.8 cm. It could be inferred that 7-day
storage of dough did not have any impact on the diameter. Also, there was
no significant difference for the diameter between the cookies without MF at
different MD percentages. Therefore, it could be inferred that there was no
considerable effect of the MD on the diameter. On the other hand, there was a
significant difference for the diameter between the cookie with MF at 0% MD
and the cookie with MF at 3.75% and 7.5% MD. Also, the cookie with MF
containing 0% MD had highest diameter value at around 7.3 cm whereas the
74

Figure 3.32: The Change in Water Loss of Cookies made from 7-day Doughswith PON during 7-day Storage at Room Temperature
cookie with MF containing 3.75% MD had the lowest diameter value at around
6.8 cm.
3.6 Color Determination
The effect of MD concentration and MF process on color of 0-day cookie surface
with PON were shown in the Figure 3.43. In the samples prepared without MF
process, with the addition of MD, slightly increase of ∆E values was observed;
however, this change remained nearly the same after 3.75% of MD. Thus, it could
be inferred that increase in MD levels did not affect the change in the color of
cookies. On the other hands, in the cookies prepared with MF process while
MD percentages increased from 0% to 7.5%, ∆E values of cookies also slightly
increased. Consequently, there was no significant effect of MD at each level on
the change in cookie color (p ≤ 0.05). Moreover, there is no significant effect of
the use of MF process on the change in cookie color (p ≤ 0.05); however, the
cookies with MF process were a little bite darker than the cookie without MF
process. If the significant difference was not observed for one of the properties
75

Figure 3.33: The Change in Water Loss of Cookies made from 0-day Doughswith PS during 7-day Storage at Room Temperature
determining the cookie quality, the levels of MD used in the place of fat could be
increased. In addition, of all cookies, control cookie had the highest ∆E value,
that is, control cookie had the darkest color.
In the Figure 3.44, there was no significant change in color of cookies (p ≤0.05) when the cookies were prepared from 7-day doughs. Colors of all cookies
resembled to control cookie. According to ANOVA results of the samples without
MF, while there was no significantly difference between 0% MD and 7.5% MD,
there was significantly difference between 0% MD and 3.5% MD (p ≤ 0.05).
In the cookies with MF process, the cookies of 0% MD and 3.5% MD had the
similar ∆E values, however, after 3.5% MD, there was slightly increase in ∆E
value. This meant that the addition of certain amount of MD for the samples
with MF process had slight effect on the color. If the addition of MD increased,
it might be possible to clearly see the color change in cookies.
The effect of MD concentration and MF process on color of cookie prepared
from 0-day dough with PS were shown in the Figure 3.45. The change in color
of cookie was as much as that of control cookie. Thus, it could be inferred that
there was no significant effect of MD on the cookie color. However, the effect of
76

Figure 3.34: The Change in Water Loss of Cookies made from 7-day Doughswith PS during 7-day Storage at Room Temperature
MF process on the color change of cookie was only observed when PS was used
in cookie making (p ≤ 0.05). MF process increased change in delta E value of
cookie; that is, MF maked the color of cookie darker (Çıkrıkçı, 2013).
The effect of MD concentration and MF process on color of cookie surface pre-
pared from 7-day dough with PS were shown in the Figure 3.46. Increase in the
MD level of cookie did not result in any change in the color of cookie. Also, MF
process did not have any effect on the change of cookie color.
Moreover, there were some factors that affected the color of products such as
time, baking temperature, composition, humidity in oven etc. (Deep Narayan
et al., 2012). Furthermore, maillard and caramelization reactions resulting from
the interaction between sugar and proteins in the cookie at high temperature
contributed to develop the color of cookie (Anil, 2007). Also, photos of cookies
were present in Appendix A.
77

Figure 3.35: The Effect of MD and MF Process on the Height of the Cookiesmade from 0-day Doughs with PON
Figure 3.36: The Effect of MD and MF Process on the Height of the Cookiesmade from 7-day Doughs with PON
78

Figure 3.37: The Effect of MD and MF Process on the Height of the Cookiesmade from 0-day Doughs with PS
Figure 3.38: The Effect of MD and MF Process on the Height of the Cookiesmade from 7-day Doughs with PS
79
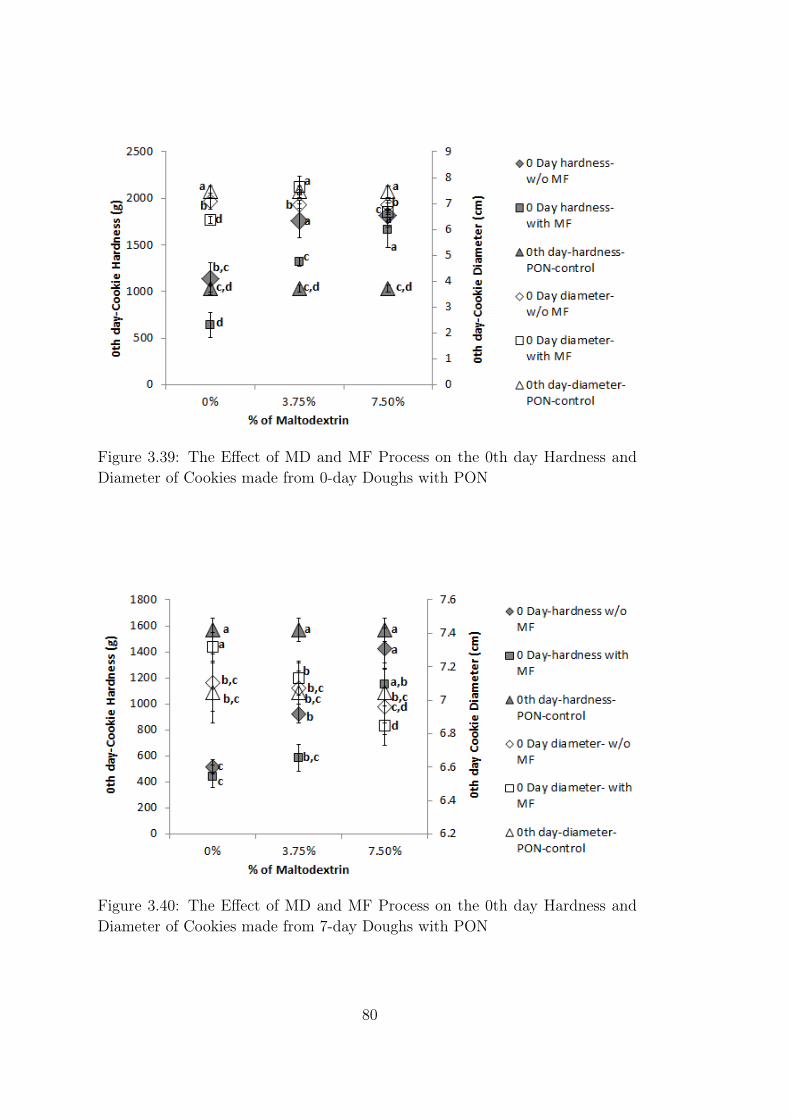
Figure 3.39: The Effect of MD and MF Process on the 0th day Hardness andDiameter of Cookies made from 0-day Doughs with PON
Figure 3.40: The Effect of MD and MF Process on the 0th day Hardness andDiameter of Cookies made from 7-day Doughs with PON
80

Figure 3.41: The Effect of MD and MF Process on the 0th day Hardness andDiameter of Cookies made from 0-day Doughs with PS
Figure 3.42: The Effect of MD and MF Process on the 0th day Hardness andDiameter of Cookies made from 7-day Doughs with PS
81

Figure 3.43: The Effect of MD Concentration and MF Process on Color ofCookie Surface prepared from 0-day dough with PON
Figure 3.44: The Effect of MD Concentration and MF Process on Color ofCookie Surface prepared from 7-day dough with PON
82

Figure 3.45: The Effect of MD Concentration and MF Process on Color ofCookie Surface prepared from 0-day dough with PS
Figure 3.46: The Effect of MD Concentration and MF Process on Color ofCookie Surface prepared from 7-day dough with PS
83

84

CHAPTER 4
CONCLUSION AND RECOMMENDATION
In this thesis, the effects of microfluidization and maltodextrin with various
percentages on the rheological and textural properties of cookie and cookie dough
and the effects of utilization of different types of fats (PON and PS) on the
properties of both cookie and cookie dough were investigated.
When the texture profiles of cookie dough were investigated in terms of hardness
and cohesiveness, it was seen that hardness of both 0-day and 7-day doughs
containing PON increased as the percentage of maltodextrin increased. When
PS was used instead of PON in dough making, similar trend was also observed.
However, increase in the amount of maltodextrin led to reduction in the moisture
content of doughs both with MF and without MF processes. MF did not have a
significant effect on the moisture contents of doughs. Control dough containing
only PON or PS had the highest cohesiveness value. However, replacement of
fat with maltodextrin at different percentages decreased cohesiveness of doughs.
In addition, microfluidization did not have any significant effect on both 0th and
7th day cohesiveness of doughs.
According to the rheology results, elastic modulus (G’) was higher than vis-
cous modulus (G”) which signified the prevalence of elastic features over viscous
characteristics of the samples in all cases. That is, the doughs exhibited pre-
dominating solid-like behavior. Moreover, the elastic and viscous moduli were
low in the control doughs containing PON or PS. It was observed that the use
of maltodextrin at 0%, 3.75%, and 7.5% increased both storage and loss moduli
in all samples. Furthermore, the G’ and G” of doughs containing maltodedex-
85

trin at 0%, 3.75%, and 7.5% were increasingly affected by the application of
microfluidization.
As the texture profiles of cookies were investigated in terms of hardness, it was
observed that there was a significant effect of maltodextrin at 0%, 3.75%, and
7.5% observed on the hardness of cookies including PON whereas the signifi-
cant effect of maltodextrin was not observed on the cookie hardness when PS
was used. However, it was observed that there was an increase in the hardness
of cookies containing PS with the increasing percentages of maltodextrin. The
significant effect of microfluidization was not generally observed on the 0th and
7th day hardness of cookies prepared from both 0-day and 7-day doughs except
the cookie made from 0-day dough with PON. The replacement of fat with mal-
todextrin at different percentages increased the moisture content of the cookies
compared to control cookie.
There were no significant changes in the heights of all types of cookies after 7 day
storage. Moreover, microfluidization process did not have any significant effect
on the height. In diameter measurement, there was no significant difference
between the cookies without MF at 0%, 3.75%, and 7.5% MD. However, there
was a significant difference in diameter between cookies with MF at different MD
percentages. Therefore, it could be inferred that changes in the MD percentages
affected the diameter of the cookies with MF process. On the other hand, MF
process did not have any significant effect on the diameter of cookies.
The increase of MD levels in the cookie and the use of MF process did not have
any significant effect on the change of the cookie color. The significant effect of
MF was only observed with the cookie prepared from 0-day dough including PS.
It could be concluded that 0-day doughs containing PON were preferred in the
cookie making instead of doughs stored at refrigerator for 7 days because when
doughs were stored, textural and rheological properties of doughs were dramati-
cally affected. Moreover, since the use of PS in cookie led to significant increase
in the hardness of both dough and cookie, it was not preferable. Furthermore,
the use of microfluidization at 0%, 3.75%, and 7.5% MD was not required for
the cookie making because no significant effect on hardness and size of cookie
86

was observed. On the contrary, using maltodextrin (MD18) was a good option
for fat replacement in cookie making in terms of textural and rheological prop-
erties. When 3.75% MD was used, the cookie with 20% less calorie (PON2) was
obtained, compared to control cookie.
For further study, it is recommended to examine the utilization of microfluidized
maltodextrin at higher percentages in cookie samples.
87

88

REFERENCES
Ahmed, J. (2014). Effect of particle size and temperature on rheology
and creep behavior of barley β-d-glucan concentrate dough. Carbohydrate
Polymers , 111 (0), 89 - 100.
Akoh, C. C. (1998). Fat replacers. Food technology , 52 (3), 47–53.
Akoh, C. C., & Min, D. B. (2008). Food lipids: Chemistry, nutrition, and
biotechnology, third edition. CRC press.
Amjid, M. R., Shehzad, A., Hussain, S., Shabbir, M. A., Khan, M. R.,
Shoaib, M., et al. (2013). A comprehensive review on wheat flour dough
rheology. Pakistan Journal of Food Sciences , 23 (2), 105–123.
Anil, M. (2007). Using of hazelnut testa as a source of dietary fiber in
breadmaking. Journal of Food Engineering , 80 (1), 61 - 67.
Archilla, L. L. (1999). Evaluation of a maltodextrin gel as a partial replace-
ment for fat in a high-ratio white-layer cake formulation. Master’s thesis,
the Faculty of the Virginia Polytechnic Institute and State University.
Ariffin, A. A., Mohamud, Y., Karim, R., Boo, H. C., Chin, N. L., &
Che Man, Y. (2011). Rheological, chemical and DSC thermal character-
istics of different types of palm oil/palm stearin-based shortenings. Inter-
national Food Research Journal , 18 (1), 189–200.
Assifaoui, A., Champion, D., Chiotelli, E., & Verel, A. (2006). Charac-
terization of water mobility in biscuit dough using a low-field 1H NMR
technique. Carbohydrate Polymers , 64 (2), 197 - 204.
89
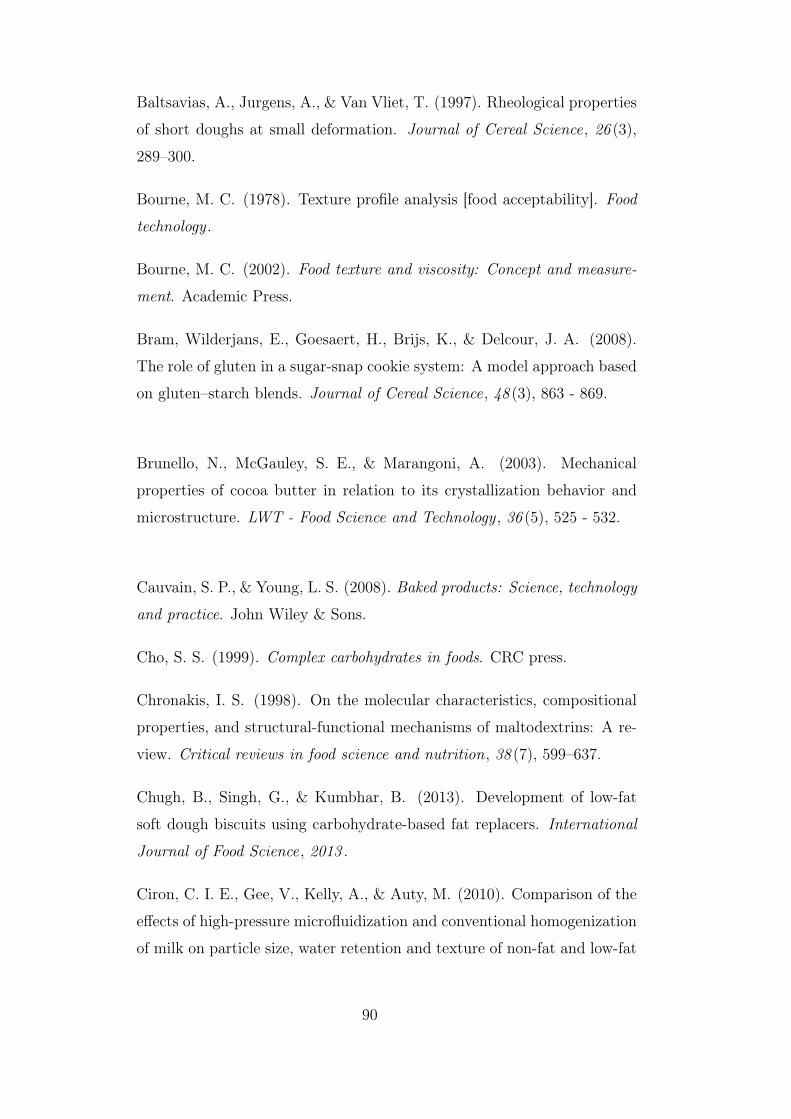
Baltsavias, A., Jurgens, A., & Van Vliet, T. (1997). Rheological properties
of short doughs at small deformation. Journal of Cereal Science, 26 (3),
289–300.
Bourne, M. C. (1978). Texture profile analysis [food acceptability]. Food
technology .
Bourne, M. C. (2002). Food texture and viscosity: Concept and measure-
ment. Academic Press.
Bram, Wilderjans, E., Goesaert, H., Brijs, K., & Delcour, J. A. (2008).
The role of gluten in a sugar-snap cookie system: A model approach based
on gluten–starch blends. Journal of Cereal Science, 48 (3), 863 - 869.
Brunello, N., McGauley, S. E., & Marangoni, A. (2003). Mechanical
properties of cocoa butter in relation to its crystallization behavior and
microstructure. LWT - Food Science and Technology , 36 (5), 525 - 532.
Cauvain, S. P., & Young, L. S. (2008). Baked products: Science, technology
and practice. John Wiley & Sons.
Cho, S. S. (1999). Complex carbohydrates in foods. CRC press.
Chronakis, I. S. (1998). On the molecular characteristics, compositional
properties, and structural-functional mechanisms of maltodextrins: A re-
view. Critical reviews in food science and nutrition, 38 (7), 599–637.
Chugh, B., Singh, G., & Kumbhar, B. (2013). Development of low-fat
soft dough biscuits using carbohydrate-based fat replacers. International
Journal of Food Science, 2013 .
Ciron, C. I. E., Gee, V., Kelly, A., & Auty, M. (2010). Comparison of the
effects of high-pressure microfluidization and conventional homogenization
of milk on particle size, water retention and texture of non-fat and low-fat
90

yoghurts. International Dairy Journal , 20 (5), 314–320.
Ciron, C. I. E., Gee, V. L., Kelly, A. L., & Auty, M. A. (2011). Effect of
microfluidization of heat-treated milk on rheology and sensory properties
of reduced fat yoghurt. Food Hydrocolloids , 25 (6), 1470 - 1476.
Conforti, F. D., Charles, S. A., & Duncan, S. E. (1996). Sensory evaluation
and consumer acceptance of carbohydrate-based fat replacers in biscuits.
Journal of Consumer Studies & Home Economics , 20 (3), 285–296.
Deep Narayan, Y., Neharika, T., & Kappat Valiyapeediyekkal, S. (2012).
Effect of partially de-oiled peanut meal flour (DPMF) on the nutritional,
textural, organoleptic and physico chemical properties of biscuits. Food
and Nutrition Sciences , 2012 .
Deman, J. M. (2000). Relationship among chemical, physical, and textural
properties of fats. Physical properties of fats, oils, and emulsifiers , 79–95.
Dokic-Baucal, L., Dokic, P., & Jakovljevic, J. (2004). Influence of different
maltodextrins on properties of O/W emulsions. Food Hydrocolloids , 18 (2),
233–239.
Duman, B. (2013). Production of cacao micro and nano fibers and utiliza-
tion in cakes. PhD thesis, Middle East Technical University.
Edwards, W. P. (2007). The science of bakery products. Royal Society of
Chemistry, Cambridge, UK.
Eliasson, A.-C., & Larsson, K. (1993). Cereals in breadmaking: a molecular
colloidal approach. Marcel Dekker, New York, NY, USA.
Faubion, J., & Hoseney, R. C. (1990). The viscoelastic properties of wheat
flour doughs. In Dough rheology and baked product texture (pp. 29–66).
Springer.
Foubert, I., Vereecken, J., Smith, K. W., & Dewettinck, K. (2006). Re-
lationship between crystallization behavior, microstructure, and macro-
91

scopic properties in trans containing and trans free coating fats and coat-
ings. Journal of agricultural and food chemistry , 54 (19), 7256–7262.
Gallagher, E., O’Brien, C., Scannell, A., & Arendt, E. (2003). Use of
response surface methodology to produce functional short dough biscuits.
Journal of food Engineering , 56 (2), 269–271.
Giese, J. (1996). Fats, oils, and fat replacers. Food Technology , 50 (4),
77–84.
Goldstein, A., & Seetharaman, K. (2011). Effect of a novel monoglyceride
stabilized oil in water emulsion shortening on cookie properties. Food
research international , 44 (5), 1476–1481.
Hadnađev, M., Dokić, L., Hadnađev, T. D., Pajin, B., & Krstonošić, V.
(2011). The impact of maltodextrin-based fat mimetics on rheological and
textural characteristics of edible vegetable fat. Journal of Texture Studies ,
42 (5), 404–411.
Hadnađev, M., Hadnađev, T. D., Dokić, L., Pajin, B., Torbica, A., Šarić,
L., & Ikonić, P. (2014). Physical and sensory aspects of maltodextrin gel
addition used as fat replacers in confectionery filling systems. LWT-Food
Science and Technology , 59 (1), 495–503.
Hadnađev, M., Hadnađev, T. D., Torbica, A., Dokić, L., Pajin, B., &
Krstonošić, V. (2011). Rheological properties of maltodextrin based fat-
reduced confectionery spread systems. Procedia Food Science, 1 , 62–67.
Han, L., Li, L., Li, B., Zhao, L., Liu, G., Liu, X., & Wang, X. (2014).
Effect of high pressure microfluidization on the crystallization behavior of
palm stearin—palm olein blends. Molecules , 19 (4), 5348–5359.
Hardt, N., Boom, R., & van der Goot, A. (2014). Wheat dough rheol-
ogy at low water contents and the influence of xylanases. Food Research
International , 66 (0), 478 - 484.
92

Hartnett, D., & Thalheimer, W. (1979). Use of oil in baked products—part
I: Background and bread. Journal of the American Oil Chemists’ Society ,
56 (12), 944-947.
Hibberd, G. (1970). Dynamic viscoelastic behaviour of wheat flour doughs.
Rheologica Acta, 9 (4), 501–505.
Higaki, K., Ueno, S., Koyano, T., & Sato, K. (2001). Effects of ultrasonic
irradiation on crystallization behavior of tripalmitoylglycerol and cocoa
butter. Journal of the American Oil Chemists’ Society , 78 (5), 513–518.
Hoseney, R. C., et al. (1994). Principles of cereal science and technology
(No. Ed. 2). American Association of Cereal Chemists (AACC).
Hu, X., Zhao, M., Sun, W., Zhao, G., & Ren, J. (2011). Effects of microflu-
idization treatment and transglutaminase cross-linking on physicochemi-
cal, functional, and conformational properties of peanut protein isolate.
Journal of agricultural and food chemistry , 59 (16), 8886–8894.
Jacob, J., & Leelavathi, K. (2007). Effect of fat-type on cookie dough and
cookie quality. Journal of food Engineering , 79 (1), 299–305.
Johnson, B. R. (2000). Whey protein concentrates in low-fat applications.
US Dairy Export Council , 2 , 1–6.
Kennedy, J., Knill, C., & Taylor, D. (1995). Maltodextrins. In M. Kearsley
& S. Dziedzic (Eds.), Handbook of starch hydrolysis products and their
derivatives (p. 65-82). Springer US.
Çıkrıkçı, S. (2013). Production of micro and nano fibers from hazelnut
skin and utilization in cakes. Master’s thesis, METU, Ankara.
Kweon, M., Donelson, T., Slade, L., & Levine, H. (2010). Micro-sugar-
snap and micro-wire-cut cookie baking with trans-fat and zero-trans-fat
shortenings. Cereal Chemistry , 87 (5), 415–419.
Lab dispersing devices. (n.d.). http://www.unitedscientific.co.za/index.php
93
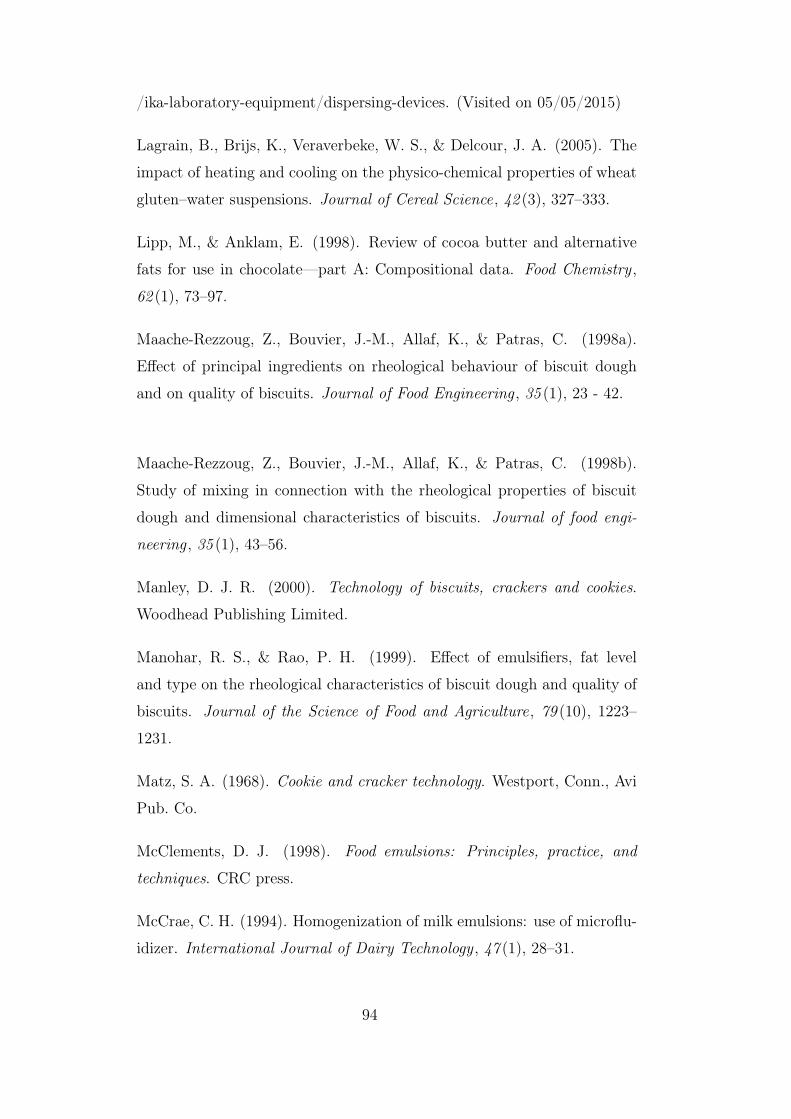
/ika-laboratory-equipment/dispersing-devices. (Visited on 05/05/2015)
Lagrain, B., Brijs, K., Veraverbeke, W. S., & Delcour, J. A. (2005). The
impact of heating and cooling on the physico-chemical properties of wheat
gluten–water suspensions. Journal of Cereal Science, 42 (3), 327–333.
Lipp, M., & Anklam, E. (1998). Review of cocoa butter and alternative
fats for use in chocolate—part A: Compositional data. Food Chemistry ,
62 (1), 73–97.
Maache-Rezzoug, Z., Bouvier, J.-M., Allaf, K., & Patras, C. (1998a).
Effect of principal ingredients on rheological behaviour of biscuit dough
and on quality of biscuits. Journal of Food Engineering , 35 (1), 23 - 42.
Maache-Rezzoug, Z., Bouvier, J.-M., Allaf, K., & Patras, C. (1998b).
Study of mixing in connection with the rheological properties of biscuit
dough and dimensional characteristics of biscuits. Journal of food engi-
neering , 35 (1), 43–56.
Manley, D. J. R. (2000). Technology of biscuits, crackers and cookies.
Woodhead Publishing Limited.
Manohar, R. S., & Rao, P. H. (1999). Effect of emulsifiers, fat level
and type on the rheological characteristics of biscuit dough and quality of
biscuits. Journal of the Science of Food and Agriculture, 79 (10), 1223–
1231.
Matz, S. A. (1968). Cookie and cracker technology. Westport, Conn., Avi
Pub. Co.
McClements, D. J. (1998). Food emulsions: Principles, practice, and
techniques. CRC press.
McCrae, C. H. (1994). Homogenization of milk emulsions: use of microflu-
idizer. International Journal of Dairy Technology , 47 (1), 28–31.
94

Milašinović Šeremešić, M., Dokić, L., Nikolić, I., Radosavljević, M., &
Šoronja Simović, D. (2013). Rheological and textural properties of short
(cookie) dough made with two types of resistant starch. Journal of Texture
Studies , 44 (2), 115–123.
Miller, G. D., & Groziak, S. M. (1996). Impact of fat substitutes on fat
intake. Lipids , 31 (1), S293–S296.
Miller, R. A., & Hoseney, R. (1997). Factors in hard wheat flour responsible
for reduced cookie spread 1. Cereal chemistry , 74 (3), 330–336.
Napier, K. (1997, October). Fat replacers - the cutting edge of cutting
calories (Tech. Rep.). American Council on Science and Health.
O’Brien, R. D. (2008). Fats and oils: formulating and processing for
applications. CRC press.
Olewnik, M., & Kulp, K. (1984). The effect of mixing time and ingredient
variation on farinograms of cookie doughs. Cereal chemistry (USA).
O’Neil, E. (1993). Low-fat products. Meat Focus International , 2 , 70.
Pareyt, B., Brijs, K., & Delcour, J. A. (2010). Impact of fat on dough and
cookie properties of sugar-snap cookies. Cereal chemistry , 87 (3), 226–230.
Pareyt, B., Talhaoui, F., Kerckhofs, G., Brijs, K., Goesaert, H., Wevers,
M., & Delcour, J. A. (2009). The role of sugar and fat in sugar-snap
cookies: Structural and textural properties. Journal of Food Engineering ,
90 (3), 400–408.
Peters, J. C., Lawson, K. D., Middleton, S. J., & Triebwasser, K. C. (1997).
Assessment of the nutritional effects of olestra, a nonabsorbed fat replace-
ment: summary. The Journal of nutrition, 127 (8), 1719S–1728S.
Petrofsky, K., & Hoseney, R. (1995). Rheological properties of dough
made with starch and gluten from several cereal sources. Cereal Chemistry ,
72 (1), 53–57.
95

Pimdit, K., Therdthai, N., & Jangchud, K. (2008). Effects of fat replac-
ers on the physical, chemical and sensory characteristics of puff pastry.
Kasetsart Journal - Natural Science, 42 (4), 739-746.
Pinnamaneni, S., Das, N., & Das, S. (2003). Comparison of oil-in-water
emulsions manufactured by microfluidization and homogenization. Phar-
mazie, 58 (8), 554-558.
Romeih, E. A., Michaelidou, A., Biliaderis, C. G., & Zerfiridis, G. K.
(2002). Low-fat white-brined cheese made from bovine milk and two com-
mercial fat mimetics: chemical, physical and sensory attributes. Interna-
tional Dairy Journal , 12 (6), 525 - 540.
Sanchez, C., Klopfenstein, C., & Walker, C. (1995). Use of carbohydrate-
based fat substitutes and emulsifying agents in reduced-fat shortbread
cookies. Cereal Chemistry , 72 (1), 25–29.
Sipahioglu, O., Alvarez, V., & Solano-Lopez, C. (1999). Structure, physico-
chemical and sensory properties of feta cheese made with tapioca starch
and lecithin as fat mimetics. International dairy journal , 9 (11), 783–789.
Sobolewska-Zielińska, J., & Fortuna, T. (2010). Retrogradation of starches
and maltodextrins of origin various. Acta Sci. Pol., Technol. Aliment , 9 ,
71–81.
Sowbhagya, H., Suma, P. F., Mahadevamma, S., & Tharanathan, R.
(2007). Spent residue from cumin – a potential source of dietary fiber.
Food Chemistry , 104 (3), 1220 - 1225.
Sudha, M., Srivastava, A., Vetrimani, R., & Leelavathi, K. (2007). Fat
replacement in soft dough biscuits: Its implications on dough rheology and
biscuit quality. Journal of Food Engineering , 80 (3), 922–930.
Sudha, M., Vetrimani, R., & Leelavathi, K. (2007). Influence of fibre from
different cereals on the rheological characteristics of wheat flour dough and
96
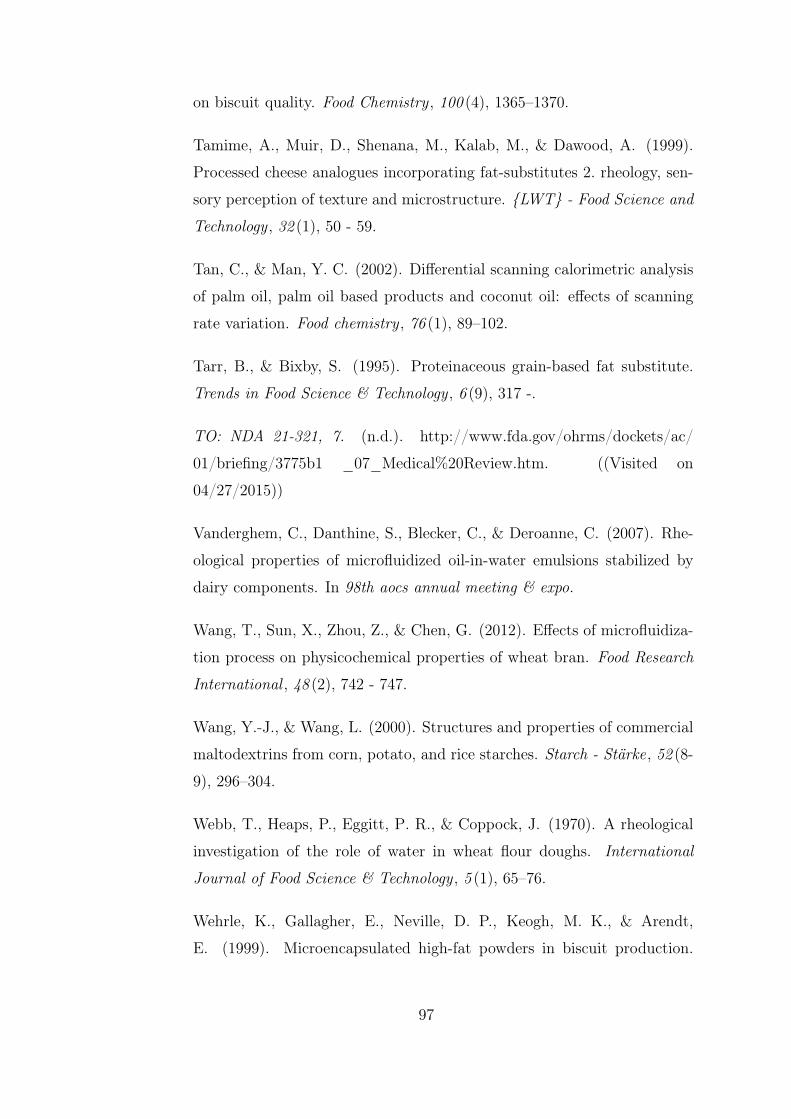
on biscuit quality. Food Chemistry , 100 (4), 1365–1370.
Tamime, A., Muir, D., Shenana, M., Kalab, M., & Dawood, A. (1999).
Processed cheese analogues incorporating fat-substitutes 2. rheology, sen-
sory perception of texture and microstructure. {LWT} - Food Science and
Technology , 32 (1), 50 - 59.
Tan, C., & Man, Y. C. (2002). Differential scanning calorimetric analysis
of palm oil, palm oil based products and coconut oil: effects of scanning
rate variation. Food chemistry , 76 (1), 89–102.
Tarr, B., & Bixby, S. (1995). Proteinaceous grain-based fat substitute.
Trends in Food Science & Technology , 6 (9), 317 -.
TO: NDA 21-321, 7. (n.d.). http://www.fda.gov/ohrms/dockets/ac/
01/briefing/3775b1 _07_Medical%20Review.htm. ((Visited on
04/27/2015))
Vanderghem, C., Danthine, S., Blecker, C., & Deroanne, C. (2007). Rhe-
ological properties of microfluidized oil-in-water emulsions stabilized by
dairy components. In 98th aocs annual meeting & expo.
Wang, T., Sun, X., Zhou, Z., & Chen, G. (2012). Effects of microfluidiza-
tion process on physicochemical properties of wheat bran. Food Research
International , 48 (2), 742 - 747.
Wang, Y.-J., & Wang, L. (2000). Structures and properties of commercial
maltodextrins from corn, potato, and rice starches. Starch - Stärke, 52 (8-
9), 296–304.
Webb, T., Heaps, P., Eggitt, P. R., & Coppock, J. (1970). A rheological
investigation of the role of water in wheat flour doughs. International
Journal of Food Science & Technology , 5 (1), 65–76.
Wehrle, K., Gallagher, E., Neville, D. P., Keogh, M. K., & Arendt,
E. (1999). Microencapsulated high-fat powders in biscuit production.
97

Zeitschrift für Lebensmitteluntersuchung und-Forschung A, 208 (5-6), 388–
393.
Witczak, M., Korus, J., Ziobro, R., & Juszczak, L. (2010). The effects of
maltodextrins on gluten-free dough and quality of bread. Journal of food
engineering , 96 (2), 258–265.
Yıldız, E. (2014). Production of hazelnut skin micro and nano fibers and
utilization in biscuits. Unpublished doctoral dissertation, Middle East
Technical University.
Yuce, O. (2011). Application of high dynamic microfluidization to im-
prove some quality parameters and stability of orange juice. Unpublished
master’s thesis, METU, Ankara.
Zoulias, E., Oreopoulou, V., & Tzia, C. (2000). Effect of fat mimetics on
physical, textural and sensory properties of cookies. International Journal
of Food Properties , 3 (3), 385–397.
Zoulias, E., Oreopoulou, V., & Tzia, C. (2002). Textural properties of low-
fat cookies containing carbohydrate-or protein-based fat replacers. Journal
of Food Engineering , 55 (4), 337–342.
98

APPENDIX A
PHOTOGRAPHS OF COOKIE SAMPLES
Control 0% 3.75% 7.5%
Figure A.1: The photo on the left top corner shows the control cookie, PONday0, made from 0-day dough. The other photos on the top indicate how dif-ferent percentages of maltodextrin (DE18) affect the cookies when they are notexposed to MF, PON1 day0, PON2 day0, PON3 day0, respectively and the bot-tom three photos represent how the same percentages of maltodextrin (DE18)affect the cookies with MF, MFPON1 day0, MFPON2 day0 and MDPON3 day0,respectively.
99
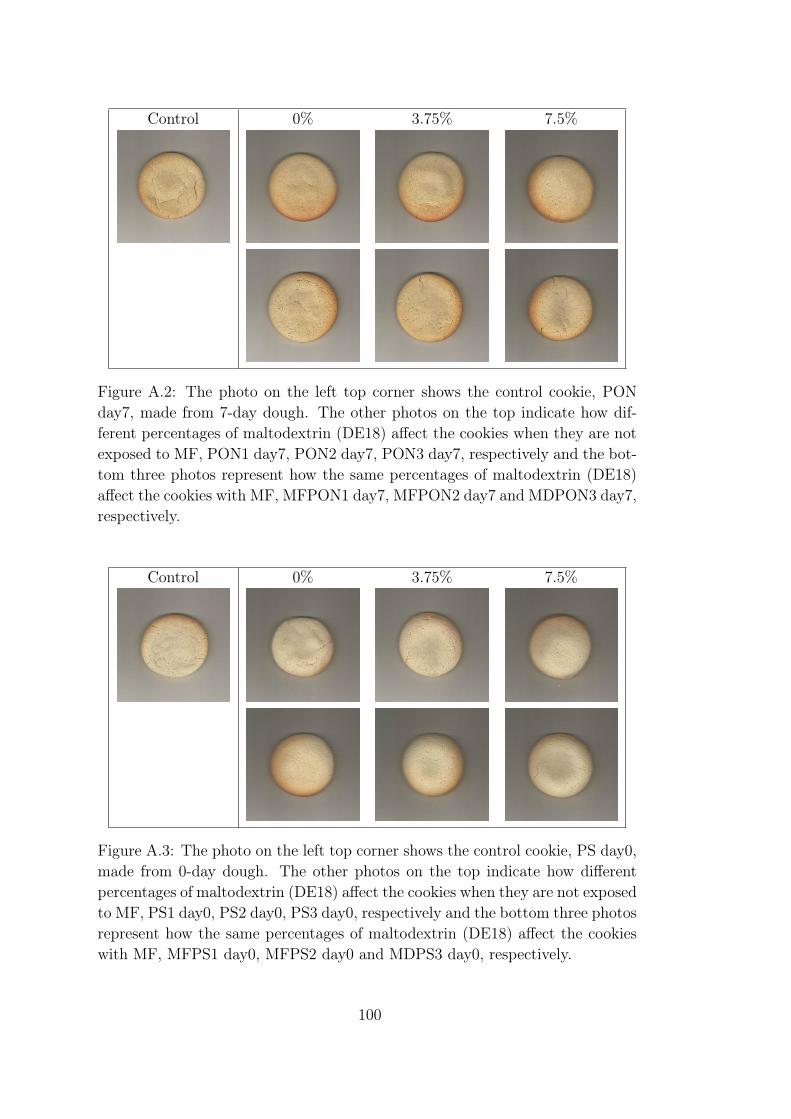
Control 0% 3.75% 7.5%
Figure A.2: The photo on the left top corner shows the control cookie, PONday7, made from 7-day dough. The other photos on the top indicate how dif-ferent percentages of maltodextrin (DE18) affect the cookies when they are notexposed to MF, PON1 day7, PON2 day7, PON3 day7, respectively and the bot-tom three photos represent how the same percentages of maltodextrin (DE18)affect the cookies with MF, MFPON1 day7, MFPON2 day7 and MDPON3 day7,respectively.
Control 0% 3.75% 7.5%
Figure A.3: The photo on the left top corner shows the control cookie, PS day0,made from 0-day dough. The other photos on the top indicate how differentpercentages of maltodextrin (DE18) affect the cookies when they are not exposedto MF, PS1 day0, PS2 day0, PS3 day0, respectively and the bottom three photosrepresent how the same percentages of maltodextrin (DE18) affect the cookieswith MF, MFPS1 day0, MFPS2 day0 and MDPS3 day0, respectively.
100

Control 0% 3.75% 7.5%
Figure A.4: The photo on the left top corner shows the control cookie, PS day7,made from 7-day dough. The other photos on the top indicate how differentpercentages of maltodextrin (DE18) affect the cookies when they are not exposedto MF, PS1 day7, PS2 day7, PS3 day7, respectively and the bottom three photosrepresent how the same percentages of maltodextrin (DE18) affect the cookieswith MF, MFPS1 day7, MFPS2 day7 and MDPS3 day7, respectively.
101

102

APPENDIX B
A FIGURE RELATED TO CALCULATIONS OF
TEXTURE ANALYSIS
Figure B.1: Texture Profile Analysis (Bourne, 2002)
103

104

APPENDIX C
RESULTS OF ELASTIC AND VISCOUS MODULI OF
DOUGH
One-way ANOVA: G’ versus Sample name
Source DF SS MS F P
Sample name 7 5.39350E+11 77050028702 150.05 0.000
Error 192 98589074285 513484762
Total 199 6.37939E+11
S = 22660 R-Sq = 84.55% R-Sq(adj) = 83.98%
Grouping Information Using Tukey Method
Sample
name N Mean Grouping
7 25 174865 A
6 25 125561 B
5 25 63109 C
4 25 53935 C
0 25 33941 D
1 25 33656 D
3 25 27287 D
2 25 16519 D
Means that do not share a letter are significantly different.
Tukey 95% Simultaneous Confidence Intervals
All Pairwise Comparisons among Levels of Sample name
One-way ANOVA: G p versus Sample name Source DF SS MS F P
Sample name 2 18550670350 9275335175 36.31 0.000
Error 72 18392191818 255447109
Total 74 36942862168
S = 15983 R-Sq = 50.21% R-Sq(adj) = 48.83%
Grouping Information Using Tukey Method
Sample
name N Mean Grouping
4 25 53935 A
3 25 27287 B
2 25 16519 B
105

Means that do not share a letter are significantly different.
Tukey 95% Simultaneous Confidence Intervals
All Pairwise Comparisons among Levels of Sample name
Source DF SS MS F P
Sample name 2 1.56838E+11 78419111298 79.07 0.000
Error 72 71405241977 991739472
Total 74 2.28243E+11
S = 31492 R-Sq = 68.72% R-Sq(adj) = 67.85%
Grouping Information Using Tukey Method
Sample
name N Mean Grouping
7 25 174865 A
6 25 125561 B
5 25 63109 C
Means that do not share a letter are significantly different.
Tukey 95% Simultaneous Confidence Intervals
All Pairwise Comparisons among Levels of Sample name
Source DF SS MS F P
Sample name 1 1010900 1010900 0.01 0.941
Error 48 8791640490 183159177
Total 49 8792651390
S = 13534 R-Sq = 0.01% R-Sq(adj) = 0.00%
Grouping Information Using Tukey Method
Sample
name N Mean Grouping
0 25 33941 A
1 25 33656 A
Means that do not share a letter are significantly different.
Tukey 95% Simultaneous Confidence Intervals
All Pairwise Comparisons among Levels of Sample name
Source DF SS MS F P
Sample name 7 92223020013 13174717145 20.71 0.000
Error 192 1.22138E+11 636136601
Total 199 2.14361E+11
S = 25222 R-Sq = 43.02% R-Sq(adj) = 40.94%
Grouping Information Using Tukey Method
106

Sample
name N Mean Grouping
7 25 80737 A
6 25 69208 A B
5 25 49065 B C
4 25 48327 B C
3 25 45430 C D
1 25 24584 D E
0 25 24114 D E
2 25 14222 E
Means that do not share a letter are significantly different.
Tukey 95% Simultaneous Confidence Intervals
One-way ANOVA: G dp versus Sample name Source DF SS MS F P
Sample name 1 2761297 2761297 0.01 0.906
Error 48 9320864184 194184670
Total 49 9323625481
S = 13935 R-Sq = 0.03% R-Sq(adj) = 0.00%
Grouping Information Using Tukey Method
Sample
name N Mean Grouping
1 25 24584 A
0 25 24114 A
Means that do not share a letter are significantly different.
Tukey 95% Simultaneous Confidence Intervals
One-way ANOVA: G dp versus Sample name Source DF SS MS F P
Sample name 2 17878484299 8939242150 18.21 0.000
Error 72 35336439354 490783880
Total 74 53214923653
S = 22154 R-Sq = 33.60% R-Sq(adj) = 31.75%
Grouping Information Using Tukey Method
Sample
name N Mean Grouping
4 25 48327 A
3 25 45430 A
2 25 14222 B
Means that do not share a letter are significantly different.
Tukey 95% Simultaneous Confidence Intervals
One-way ANOVA: G dp versus Sample name Source DF SS MS F P
Sample name 2 12848330651 6424165326 5.97 0.004
107

Error 72 77480923849 1076123942
Total 74 90329254501
S = 32804 R-Sq = 14.22% R-Sq(adj) = 11.84%
Grouping Information Using Tukey Method
Sample
name N Mean Grouping
7 25 80737 A
6 25 69208 A B
5 25 49065 B
Means that do not share a letter are significantly different.
Tukey 95% Simultaneous Confidence Intervals
One-way ANOVA: G p versus Sample name Source DF SS MS F P
Sample name 2 6.96523E+11 3.48262E+11 164.05 0.000
Error 72 1.52851E+11 2122933746
Total 74 8.49374E+11
S = 46075 R-Sq = 82.00% R-Sq(adj) = 81.50%
Grouping Information Using Tukey Method
Sample
name N Mean Grouping
7 25 276898 A
6 25 118590 B
5 25 46102 C
Means that do not share a letter are significantly different.
Tukey 95% Simultaneous Confidence Intervals
One-way ANOVA: G p versus Sample name Source DF SS MS F P
Sample name 2 3.97782E+11 1.98891E+11 87.60 0.000
Error 72 1.63468E+11 2270390975
Total 74 5.61250E+11
S = 47649 R-Sq = 70.87% R-Sq(adj) = 70.07%
Grouping Information Using Tukey Method
Sample
name N Mean Grouping
4 25 223018 A
3 25 100362 B
2 25 49514 C
Means that do not share a letter are significantly different.
108

Tukey 95% Simultaneous Confidence Intervals
One-way ANOVA: G p versus Sample name Source DF SS MS F P
Sample name 1 20961963756 20961963756 1.48 0.229
Error 48 6.77873E+11 14122358181
Total 49 6.98835E+11
S = 118838 R-Sq = 3.00% R-Sq(adj) = 0.98%
Grouping Information Using Tukey Method
Sample
name N Mean Grouping
1 25 323105 A
0 25 282154 A
Means that do not share a letter are significantly different.
Tukey 95% Simultaneous Confidence Intervals
One-way ANOVA: G p versus Sample name Source DF SS MS F P
Sample name 7 2.17929E+12 3.11327E+11 60.12 0.000
Error 192 9.94193E+11 5178086315
Total 199 3.17348E+12
S = 71959 R-Sq = 68.67% R-Sq(adj) = 67.53%
Grouping Information Using Tukey Method
Sample
name N Mean Grouping
1 25 323105 A
0 25 282154 A B
7 25 276898 A B
4 25 223018 B
6 25 118590 C
3 25 100362 C D
2 25 49514 D
5 25 46102 D
Means that do not share a letter are significantly different.
Tukey 95% Simultaneous Confidence Intervals
One-way ANOVA: G dp versus Sample name Source DF SS MS F P
Sample name 7 8.60255E+11 1.22894E+11 30.82 0.000
Error 192 7.65671E+11 3987869200
Total 199 1.62593E+12
109

S = 63150 R-Sq = 52.91% R-Sq(adj) = 51.19%
Grouping Information Using Tukey Method
Sample
name N Mean Grouping
1 25 209305 A
0 25 185416 A B
7 25 184403 A B
4 25 140439 B
6 25 84133 C
3 25 71905 C
2 25 37810 C
5 25 34838 C
Means that do not share a letter are significantly different.
Tukey 95% Simultaneous Confidence Intervals
One-way ANOVA: G dp versus Sample name Source DF SS MS F P
Sample name 1 7133474383 7133474383 0.77 0.383
Error 48 4.41825E+11 9204692646
Total 49 4.48959E+11
S = 95941 R-Sq = 1.59% R-Sq(adj) = 0.00%
Grouping Information Using Tukey Method
Sample
name N Mean Grouping
1 25 209305 A
0 25 185416 A
Means that do not share a letter are significantly different.
Tukey 95% Simultaneous Confidence Intervals
One-way ANOVA: G dp versus Sample name Source DF SS MS F P
Sample name 2 1.36602E+11 68301067017 31.28 0.000
Error 72 1.57229E+11 2183739666
Total 74 2.93831E+11
S = 46731 R-Sq = 46.49% R-Sq(adj) = 45.00%
Grouping Information Using Tukey Method
Sample
name N Mean Grouping
4 25 140439 A
3 25 71905 B
2 25 37810 C
Means that do not share a letter are significantly different.
110

Tukey 95% Simultaneous Confidence Intervals
One-way ANOVA: G dp versus Sample name Source DF SS MS F P
Sample name 2 2.90450E+11 1.45225E+11 62.76 0.000
Error 72 1.66616E+11 2314116436
Total 74 4.57066E+11
S = 48105 R-Sq = 63.55% R-Sq(adj) = 62.53%
Grouping Information Using Tukey Method
Sample
name N Mean Grouping
7 25 184403 A
6 25 84133 B
5 25 34838 C
Means that do not share a letter are significantly different.
Tukey 95% Simultaneous Confidence Intervals
One-way ANOVA: G p versus Sample name Source DF SS MS F P
Sample name 2 2.20070E+11 1.10035E+11 12.61 0.000
Error 72 6.28143E+11 8724205865
Total 74 8.48213E+11
S = 93403 R-Sq = 25.95% R-Sq(adj) = 23.89%
Grouping Information Using Tukey Method
Sample
name N Mean Grouping
7 25 364264 A
6 25 296025 B
5 25 231596 C
Means that do not share a letter are significantly different.
Tukey 95% Simultaneous Confidence Intervals
One-way ANOVA: G p versus Sample name Source DF SS MS F P
Sample name 2 9.03850E+11 4.51925E+11 57.24 0.000
Error 72 5.68435E+11 7894933893
Total 74 1.47228E+12
S = 88853 R-Sq = 61.39% R-Sq(adj) = 60.32%
Grouping Information Using Tukey Method
111

Sample
name N Mean Grouping
4 25 411126 A
3 25 233283 B
2 25 147534 C
Means that do not share a letter are significantly different.
Tukey 95% Simultaneous Confidence Intervals
One-way ANOVA: G p versus Sample name Source DF SS MS F P
Sample name 1 29701425265 29701425265 8.63 0.005
Error 48 1.65293E+11 3443598610
Total 49 1.94994E+11
S = 58682 R-Sq = 15.23% R-Sq(adj) = 13.47%
Grouping Information Using Tukey Method
Sample
name N Mean Grouping
1 25 222837 A
0 25 174092 B
Means that do not share a letter are significantly different.
Tukey 95% Simultaneous Confidence Intervals
One-way ANOVA: G p versus Sample name Source DF SS MS F P
Sample name 7 1.44846E+12 2.06922E+11 29.17 0.000
Error 192 1.36187E+12 7093077062
Total 199 2.81033E+12
S = 84220 R-Sq = 51.54% R-Sq(adj) = 49.77%
112

Grouping Information Using Tukey Method
Sample
name N Mean Grouping
4 25 411126 A
7 25 364264 A B
6 25 296025 B C
3 25 233283 C D
5 25 231596 C D
1 25 222837 D
0 25 174092 D E
2 25 147534 E
Means that do not share a letter are significantly different.
Tukey 95% Simultaneous Confidence Intervals
All Pairwise Comparisons among Levels of Sample name
One-way ANOVA: G dp versus Sample name Source DF SS MS F P
Sample name 7 5.96375E+11 85196453777 18.08 0.000
Error 192 9.04665E+11 4711794473
Total 199 1.50104E+12
S = 68643 R-Sq = 39.73% R-Sq(adj) = 37.53%
Grouping Information Using Tukey Method
Sample
name N Mean Grouping
4 25 261728 A
7 25 223873 A B
6 25 168098 B C
3 25 153916 C D
5 25 145337 C D E
1 25 131010 C D E
0 25 102580 D E
2 25 89476 E
Means that do not share a letter are significantly different.
Tukey 95% Simultaneous Confidence Intervals
One-way ANOVA: G dp versus Sample name Source DF SS MS F P
Sample name 1 10102790040 10102790040 5.56 0.023
Error 48 87237798868 1817454143
Total 49 97340588908
S = 42632 R-Sq = 10.38% R-Sq(adj) = 8.51%
Grouping Information Using Tukey Method
Sample
113

name N Mean Grouping
1 25 131010 A
0 25 102580 B
Means that do not share a letter are significantly different.
Tukey 95% Simultaneous Confidence Intervals
One-way ANOVA: G dp versus Sample name Source DF SS MS F P
Sample name 2 3.78721E+11 1.89361E+11 32.83 0.000
Error 72 4.15347E+11 5768710088
Total 74 7.94068E+11
S = 75952 R-Sq = 47.69% R-Sq(adj) = 46.24%
Grouping Information Using Tukey Method
Sample
name N Mean Grouping
4 25 261728 A
3 25 153916 B
2 25 89476 C
Means that do not share a letter are significantly different.
Tukey 95% Simultaneous Confidence Intervals
One-way ANOVA: G dp versus Sample name Source DF SS MS F P
Sample name 2 81639650797 40819825399 7.31 0.001
Error 72 4.02080E+11 5584439077
Total 74 4.83719E+11
S = 74729 R-Sq = 16.88% R-Sq(adj) = 14.57%
Grouping Information Using Tukey Method
Sample
name N Mean Grouping
7 25 223873 A
6 25 168098 B
5 25 145337 B
Means that do not share a letter are significantly different.
Tukey 95% Simultaneous Confidence Intervals
One-way ANOVA: G p versus Sample name Source DF SS MS F P
Sample name 2 7.33636E+12 3.66818E+12 75.00 0.000
Error 72 3.52128E+12 48906701079
Total 74 1.08576E+13
114

S = 221149 R-Sq = 67.57% R-Sq(adj) = 66.67%
Grouping Information Using Tukey Method
Sample
name N Mean Grouping
7 25 1085807 A
6 25 473334 B
5 25 381024 B
Means that do not share a letter are significantly different.
Tukey 95% Simultaneous Confidence Intervals
One-way ANOVA: G p versus Sample name Source DF SS MS F P
Sample name 2 2.56806E+13 1.28403E+13 135.76 0.000
Error 72 6.80994E+12 94582491400
Total 74 3.24906E+13
S = 307543 R-Sq = 79.04% R-Sq(adj) = 78.46%
Grouping Information Using Tukey Method
Sample
name N Mean Grouping
4 25 1682710 A
3 25 555505 B
2 25 352365 B
Means that do not share a letter are significantly different.
Tukey 95% Simultaneous Confidence Intervals
One-way ANOVA: G p versus Sample name Source DF SS MS F P
Sample name 1 1.42034E+12 1.42034E+12 6.07 0.017
Error 48 1.12360E+13 2.34083E+11
Total 49 1.26563E+13
S = 483821 R-Sq = 11.22% R-Sq(adj) = 9.37%
Grouping Information Using Tukey Method
Sample
name N Mean Grouping
1 25 1559018 A
0 25 1221932 B
Means that do not share a letter are significantly different.
Tukey 95% Simultaneous Confidence Intervals
One-way ANOVA: G p versus Sample name
115

Source DF SS MS F P
Sample name 7 5.13377E+13 7.33395E+12 65.29 0.000
Error 192 2.15672E+13 1.12329E+11
Total 199 7.29049E+13
S = 335155 R-Sq = 70.42% R-Sq(adj) = 69.34%
Grouping Information Using Tukey Method
Sample
name N Mean Grouping
4 25 1682710 A
1 25 1559018 A
0 25 1221932 B
7 25 1085807 B
3 25 555505 C
6 25 473334 C
5 25 381024 C
2 25 352365 C
Means that do not share a letter are significantly different.
Tukey 95% Simultaneous Confidence Intervals
One-way ANOVA: G dp versus Sample name Source DF SS MS F P
Sample name 7 1.70108E+13 2.43012E+12 54.00 0.000
Error 192 8.64104E+12 45005435225
Total 199 2.56519E+13
S = 212145 R-Sq = 66.31% R-Sq(adj) = 65.09%
Grouping Information Using Tukey Method
Sample
name N Mean Grouping
4 25 965764 A
1 25 894508 A B
0 25 755196 B C
7 25 635693 C
3 25 325478 D
6 25 298839 D
5 25 218647 D
2 25 207417 D
Means that do not share a letter are significantly different.
Tukey 95% Simultaneous Confidence Intervals
One-way ANOVA: G dp versus Sample name Source DF SS MS F P
Sample name 1 2.42598E+11 2.42598E+11 2.74 0.104
Error 48 4.24630E+12 88464684391
Total 49 4.48890E+12
S = 297430 R-Sq = 5.40% R-Sq(adj) = 3.43%
116

Grouping Information Using Tukey Method
Sample
name N Mean Grouping
1 25 894508 A
0 25 755196 A
Means that do not share a letter are significantly different.
Tukey 95% Simultaneous Confidence Intervals
One-way ANOVA: G dp versus Sample name Source DF SS MS F P
Sample name 2 8.32495E+12 4.16248E+12 108.11 0.000
Error 72 2.77204E+12 38500507787
Total 74 1.10970E+13
S = 196215 R-Sq = 75.02% R-Sq(adj) = 74.33%
Grouping Information Using Tukey Method
Sample
name N Mean Grouping
4 25 965764 A
3 25 325478 B
2 25 207417 B
Means that do not share a letter are significantly different.
Tukey 95% Simultaneous Confidence Intervals
One-way ANOVA: G dp versus Sample name Source DF SS MS F P
Sample name 2 2.44858E+12 1.22429E+12 54.32 0.000
Error 72 1.62270E+12 22537529886
Total 74 4.07128E+12
S = 150125 R-Sq = 60.14% R-Sq(adj) = 59.04%
Grouping Information Using Tukey Method
Sample
name N Mean Grouping
7 25 635693 A
6 25 298839 B
5 25 218647 B
Means that do not share a letter are significantly different.
Tukey 95% Simultaneous Confidence Intervals
117


