
12
Evaluation of Non-condensable Gas Recirculation Flow in Steam Generator U-tubes
during Reflux Condensation
Michio Murase1, Takashi Nagae2 and Noritoshi Minami2 1Institute of Nuclear Safety System, Incorporated,
2The Kansai Electric Power Company, Inc. Japan
1. Introduction
Under mid-loop operation during a PWR (pressurized water reactor) plant outage, reflux condensation in the SG (steam generator) U-tubes can be one of the major heat removal mechanisms in a hypothetical loss-of-RHR (residual heat removal systems) event. In mid-loop operation, the reactor coolant level is kept around the hot leg nozzle center and non-condensable gas (air or nitrogen) is present in the reactor coolant system (RCS). Such non-condensable gases are well known to accumulate on the condensation heat transfer surface and consequently inhibit steam from condensing. Therefore, in order to evaluate the effectiveness of reflux condensation in the SG U-tubes, the condensation heat transfer characteristics in the presence of a non-condensable gas must be clarified. In the riser section of the SG U-tubes, the steam and non-condensable gas mixture and liquid condensate form countercurrent flow. A model for the influence of non-condensable gas on condensation was developed by Nithianandan et al. (1986) for the RELAP5/MOD2 code, based on an analogy between mass and heat transfers. However, the model was not well validated for countercurrent flow conditions while the condensation heat transfer coefficients in the presence of a non-condensable gas have been measured in many experiments, they have been measured very few times in countercurrent flow. Moon et al. (2000) measured the condensation heat transfer coefficients of steam-air mixtures in countercurrent flow, and proposed an empirical correlation as a degradation factor to the heat transfer coefficient of pure steam. Meanwhile Chun et al. (2001) placed a condenser tube bundle in a water pool and improved the empirical correlation by Moon et al. (2000). However, the correlations are limited to turbulent conditions of gas flow and when applied to laminar flow conditions, they overestimate the heat transfer coefficient. Therefore, in our study, we carried out condensation heat transfer experiments in the presence of a non-condensable gas in a collaborative study at Purdue University (Vierow et al., 2003) and derived an empirical correlation mainly for laminar flow (Nagae et al., 2005). Moreover we conducted additional condensation heat transfer experiments, especially at high flow rates of a non-condensable gas, and improved the empirical correlation for turbulent flow conditions (Nagae et al., 2007a). In this article, we summarize the major results.
www.intechopen.com

Steam Generator Systems: Operational Reliability and Efficiency
228
Using the BETHSY facility, which was a scale-model of a three-loop PWR, Noel & Deruaz
(1994) and Noel & Dumont (1997) conducted reflux condensation tests. Different flow
patterns were observed in the 34 U-tubes in the tests 7.2c with nitrogen injection (Noel &
Deruaz, 1994), but were not observed in the tests 10.2 with helium injection (Noel &
Dumont, 1997). In the test 7.2c-1.3 for example, an active condensation zone developed in
the up-flow side of 21 U-tubes (active U-tubes), but nitrogen reverse flow from the outlet
plenum to the inlet plenum occurred in some U-tubes (passive U-tubes).
In our study, we calculated steady-state flow patterns in U-tubes for the BETHSY tests 7.2c
by one-dimensional analyses (Murase & Nagae, 2005) using a parallel channel model and
the old correlation for condensation heat transfer coefficients by Nagae et al. (2005). In the
steam-nitrogen mixture, density head is higher in the cold-side of active U-tubes than in the
hot-side. In the region of low steam flow rates with small friction loss, the pressure becomes
higher in the outlet plenum than in the inlet plenum, and nitrogen flows from the outlet
plenum to the inlet plenum in passive U-tubes. About 10 solutions with different numbers
of active U-tubes were obtained in our calculations. Using the assumption that the flow
might be most stable in the case with the maximum nitrogen recirculation flow rate, we
could obtain a unique solution for the number of active U-tubes, and the estimated number
of active U-tubes agreed well with the BETHSY test results.
We also calculated different flow patterns in U-tubes (Nagae et al., 2007b) observed in the
reflux condensation tests 7.2c by the BETHSY facility using the RELAP5/MOD3.2 code
(The RELAP5 Development Team, 1995), where the improved correlation by Nagae et al.
(2007a) for condensation heat transfer coefficients were applied. With modification of the
equation for the interfacial and wall friction coefficients, nitrogen reverse flow was
successfully calculated by RELAP5/MOD3.2, where SG U-tubes were modeled with two
parallel flow channels. There were many solutions with different numbers of active U-
tubes with condensation and the predicted number of active U-tubes agreed rather well
with the measured values based on the assumption that the flow might be most stable in
the case with the maximum nitrogen recirculation flow rate. In the calculations, however,
the validity of the assumption has not been confirmed. Therefore, using
RELAP5/MOD3.2 we calculated using three flow channels in order to change the flow
area of active and passive U-tubes rather smoothly, and we evaluated the number of
active U-tubes without the assumption (Minami et al., 2008). The ratio of active U-tubes
calculated with three flow channels gave a good prediction of the ratio of active U-tubes.
The results indicate the validity of the assumption that flow with the maximum nitrogen
recirculation flow rate may be most stable and appear most probably among different
numbers of active U-tubes. In this article, we also summarize the methods to predict the
ratio of active U-tubes.
2. Heat transfer in the presence of non-condensable gas
In order to evaluate reflux condensation heat transfer characteristics in SG U-tubes in the
presence of a non-condensable gas, experiments were conducted for condensation heat
transfer of steam-air mixture under countercurrent flow in a vertical tube having an inside
diameter of 19.3 mm and with pressure range from 0.1 to 0.4 MPa (Nagae et al., 2005 &
2007a).
www.intechopen.com

Evaluation of Non-condensable Gas Recirculation Flow in Steam Generator U-tubes during Reflux Condensation
229
2.1 Measurement methods
The design and manufacture of the experimental facility, experimental measurements, and data processing were done at Purdue University (Vierow et al., 2003). Figure 1 shows the experimental setup. Its main component was a vertical, double-pipe heat exchanger made of Type 304 stainless steel (SUS 304). The inner tube was the heat transfer tube with an inside diameter of 19.3 mm, wall thickness of 3.04 mm and a heat transfer length of 1.8 m. The mixture of steam and air flowed into the tube from the lower plenum. The coolant water flowed along the outer surface of the heat transfer tube.
Steam/Air in
Coolant water in
Upper plenum
Lower plenum
Condensate collection tank
Coolant water out
Steam/Air out
Drain
Condensate water
1.8m
Condenser tube
(SUS304)
Annulus outer tube
(SUS304)
19.3mm
T1(z=0.076m)T2(z=0.18m)T3(z=0.31m)
T4(z=0.46m)
T5(z=0.66m)
T6(z=0.86m)
T7(z=1.12m)
T8(z=1.42m)
T9(z=1.78m)
(z=0.0m)
Fig. 1. Experimental setup (Vierow et al., 2003)
To obtain the condensation heat transfer coefficient under steady state conditions, the steam-air mixture temperature, outer wall temperature of the heat transfer tube, and coolant water bulk temperature were measured at nine elevations along the experimental section. The experimental conditions are listed in Table 1. The pressure, inlet steam mass flow rate, and air mass flow rate at the inlet of the test section were varied to examine their influence on the condensation heat transfer coefficient. The pressure and steam flow rate were selected based on the values presumed in the loss-of-RHR event during mid-loop operation. One objective of the experiment was to obtain a database under laminar and turbulent flow conditions.
www.intechopen.com

Steam Generator Systems: Operational Reliability and Efficiency
230
Pressure (MPa) 0.1 0.2 0.4
Inlet conditions Steam mass flow rate (g/s) Air mass flow rate (g/s) Reynolds number of mixture
0.49-1.9 0.03-0.18 2900-10000
1.1-1.9 0.06-0.5 6500-10000
0.48-1.9 0.06-0.8 3100-9500
Measured regions Steam mass flow rate (g/s) Partial pressure ratio, Psteam/Pair Reynolds number of mixture
0.00031-1.9 0.027-120 73-10000
0.00039-1.9 0.012-47 210-10000
0.00020-1.9 0.0054-49 210-9500
Table 1. Experimental conditions
In the experiment, the temperature of the steam-air mixture, Tg, and the outer wall
temperature of the heat transfer tube, Tw,o, were measured, and the heat flux at the inner
surface of the heat transfer tube, "q , and the overall heat transfer coefficient, K, were defined
by the following equations:
( )g w,oq" K T T= − (1)
( )1 1w,i w ,o w,i
w c
r ln r r
K hλ= + (2)
where rw,i is the inner radius of the heat transfer tube, rw,o is the radius of the thermocouple
location to measure outer wall temperature of the heat transfer tube, wλ is the thermal
conductivity of the heat transfer tube, and hc is the condensation heat transfer coefficient.
The first term on the right hand side of Eq. (2) can be calculated from the dimensions and
physical properties of the heat transfer tube. Accordingly, the condensation heat transfer
coefficient, hc, can be calculated once the heat flux is known.
From the coolant temperature variation, the mean heat flux "q between the measured
sections in Eq. (1) can be calculated. Since the coolant temperature variation is small in the
downstream region of the heat transfer tube, where both the condensation rate and
measurement accuracy are low, the mean heat flux between the measured sections is
calculated from the temperature variation of the steam-air mixture. Temperature
measurements provide the local saturation pressure, and the steam mass flow rate can be
calculated from the partial pressure of steam, Psteam (Tg), assuming a Gibbs-Dalton mixture of
steam and an ideal non-condensable gas. Then the local heat flux can be obtained (for
details, see Nagae et al., 2005 & 2007a). In Eq. (2), the condensation heat transfer coefficient consists of the heat transfer coefficient of the liquid film, hf, and the heat transfer coefficient at the gas-liquid interface, hi, which are separately evaluated in this study, because they are different heat transfer mechanisms. When the effects of the liquid film subcooling and the liquid film thickness on the gas-liquid interface area can be neglected, the condensation heat transfer coefficient is expressed by:
1 1 1
c f ih h h= + (3)
www.intechopen.com
Evaluation of Non-condensable Gas Recirculation Flow in Steam Generator U-tubes during Reflux Condensation
231
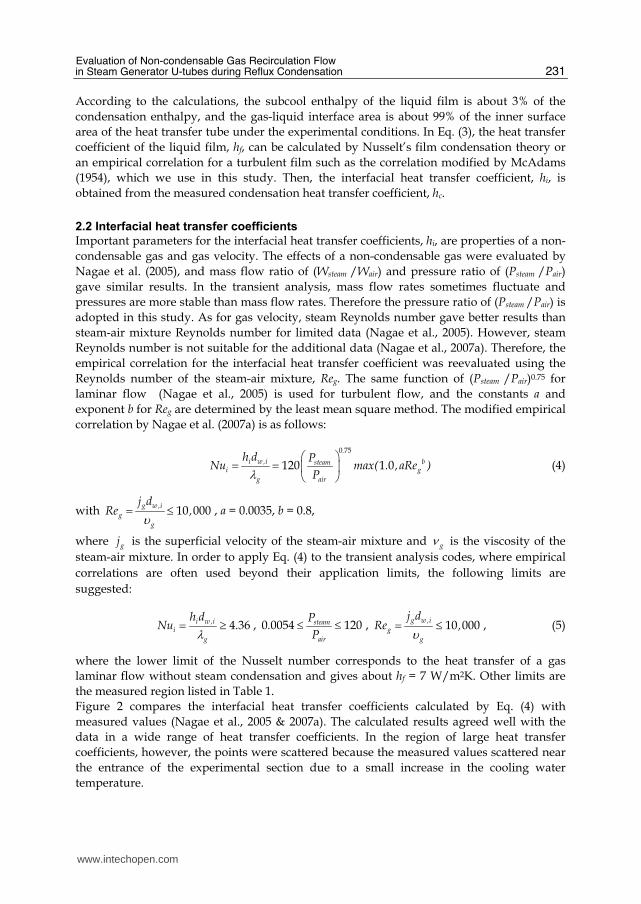
According to the calculations, the subcool enthalpy of the liquid film is about 3% of the
condensation enthalpy, and the gas-liquid interface area is about 99% of the inner surface
area of the heat transfer tube under the experimental conditions. In Eq. (3), the heat transfer
coefficient of the liquid film, hf, can be calculated by Nusselt’s film condensation theory or
an empirical correlation for a turbulent film such as the correlation modified by McAdams
(1954), which we use in this study. Then, the interfacial heat transfer coefficient, hi, is
obtained from the measured condensation heat transfer coefficient, hc.
2.2 Interfacial heat transfer coefficients
Important parameters for the interfacial heat transfer coefficients, hi, are properties of a non-
condensable gas and gas velocity. The effects of a non-condensable gas were evaluated by
Nagae et al. (2005), and mass flow ratio of (Wsteam /Wair) and pressure ratio of (Psteam /Pair)
gave similar results. In the transient analysis, mass flow rates sometimes fluctuate and
pressures are more stable than mass flow rates. Therefore the pressure ratio of (Psteam /Pair) is
adopted in this study. As for gas velocity, steam Reynolds number gave better results than
steam-air mixture Reynolds number for limited data (Nagae et al., 2005). However, steam
Reynolds number is not suitable for the additional data (Nagae et al., 2007a). Therefore, the
empirical correlation for the interfacial heat transfer coefficient was reevaluated using the
Reynolds number of the steam-air mixture, Reg. The same function of (Psteam /Pair)0.75 for
laminar flow (Nagae et al., 2005) is used for turbulent flow, and the constants a and
exponent b for Reg are determined by the least mean square method. The modified empirical
correlation by Nagae et al. (2007a) is as follows:
0 75
120 1 0
.
i w ,i bsteami g
g air
h d PNu max( . ,aRe )
Pλ⎛ ⎞= = ⎜ ⎟⎝ ⎠ (4)
with 10 000g w ,i
g
g
j dRe ,υ= ≤ , a = 0.0035, b = 0.8,
where gj is the superficial velocity of the steam-air mixture and gν is the viscosity of the
steam-air mixture. In order to apply Eq. (4) to the transient analysis codes, where empirical
correlations are often used beyond their application limits, the following limits are
suggested:
4 36i w ,ii
g
h dNu .λ= ≥ , 0 0054 120steam
air
P.
P≤ ≤ , 10 000
g w ,i
g
g
j dRe ,υ= ≤ , (5)
where the lower limit of the Nusselt number corresponds to the heat transfer of a gas
laminar flow without steam condensation and gives about hf = 7 W/m2K. Other limits are
the measured region listed in Table 1.
Figure 2 compares the interfacial heat transfer coefficients calculated by Eq. (4) with
measured values (Nagae et al., 2005 & 2007a). The calculated results agreed well with the
data in a wide range of heat transfer coefficients. In the region of large heat transfer
coefficients, however, the points were scattered because the measured values scattered near
the entrance of the experimental section due to a small increase in the cooling water
temperature.
www.intechopen.com

Steam Generator Systems: Operational Reliability and Efficiency
232
緫綌緫緫緱
緫綌緫緱
緫綌緱
緱
緱緫
緫綌緫緫緱 緫綌緫緱 緫綌緱 緱 緱緫
舴艆綆舃莘苆
絓艏肦緌芮
緹
K絙
舴艆綆臏膄芎 絓艏肦
緌芮
緹
K絙
Fig. 2. Comparison of interfacial heat transfer coefficients, hi,cal, calculated by Eq. (4) with data, hi,exp
2.3 Experimental analyses by RELAP5/MOD3.2 with modified correlation
Figure 3 shows the nodalization scheme of RELAP5/MOD3.2 for calculations of the condensation heat transfer experiments shown in Fig. 1. The nodalization scheme contains 125 control volumes, 7 junctions, and a valve and heat structure. Both the steam-air mixture and coolant were injected at constant flow rates upward into the heat transfer tube and along the outer surface of the tube, respectively. In the calculation, this behavior is simulated using a volume and a junction to specify flow, pressure and temperature conditions. Volumes act as infinite sources or sinks and represent boundary conditions. Volume 100 is connected to Pipe 110, which represents the lower plenum with a junction. Junction 115 connects Pipe 110 with the inlet of Pipe 140, which represents the inlet pipe and measurement section. Junction 141 connects the outlet of Pipe 140 with Pipe 142, which represents the upper plenum. Valve 175 is used to regulate the venting of the residual steam-air mixture to the atmosphere. Junction 159 connects Pipes 156 and 160 that simulate a condensate water line and a collection tank. Volumes 200 and 280 are connected to Pipe 240, which represents the coolant water line, with Junctions 210 and 270, respectively. Heat structure 140 with 55 sub-volumes is used to represent the heat transferred from the steam-air mixture to the coolant through the heat transfer tube. Figure 4 shows the axial temperature profiles (Nagae et al., 2007a). Using the default model correlation by Nithianandan et al. (1986) gave much higher mixture temperatures especially for a high pressure condition. It seemed that the default vapor-diffusion model through the non-condensable gas layer underestimated heat transfer coefficients especially for high pressures. On the other hand, the temperature distribution of the steam-air mixture calculated by RELAP5/MOD3.2 with the modified correlation agreed well with the data. The calculations overestimated the outer surface temperatures of the tube near the inlet in all cases. The reason might be the high heat transfer coefficient outside the heat transfer tube near the inlet due to the entrance effect in the experiments.
www.intechopen.com

Evaluation of Non-condensable Gas Recirculation Flow in Steam Generator U-tubes during Reflux Condensation
233
TDV180
TDV280 PIPE142
PIPE240 HS140 PIPE140
TDV200
PIPE110 TDV100
PIPE156
PIPE160
Test Section
Inlet Pipe
Exit Pipe
Lower
Plenum
TDV210
SJ270
Upper Plenum
VV175
SJ141
SJ115
Condensate Water
Collection Tank
TDJ105
SJ155 Steam/Air
InletCondensate Water Line
SJ159
54 nodes
1.8m
Coolant Water
Inlet
TDJ210
SJ270
Fig. 3. Nodalization for calculations using RELAP5/MOD3.2
Fig. 4. Comparison of axial temperatures (exp: measured data; calx: RELAP5-default model correlation; cal*: RELAP5-modified correlation)
3. Steady-state calculations of BETHSY tests 7.2c
In order to evaluate the mechanism of different flow patterns observed in the BETHSY tests 7.2c (Noel & Deruaz, 1994), steady-state calculations were conducted using a parallel channel model (Murase & Nagae, 2005; Nagae et al., 2007b).
3.1 Reflux tests in BETHSY facility
The BETHSY facility is a scale-model of a three-loop 900 MWe PWR with the full height and 1/100 of the volume, flow rate and power level. Each SG has 34 U-tubes with the inner diameter of 19.68 mm and the average length of 19.45 m.
0
20
40
60
80
100
120
0 0.5 1 1.5 2Axial Location, z (m)
Tem
pera
ture
(℃
)
Tc,exp Tw,o,exp Tg,expTc,cal Tw,o,cal Tg,calTg,cal
絝
×
絝絝
P total =0.106MPa, W steam,in =1.25g/s, W air,in =0.12g/s
0
20
40
60
80
100
120
140
160
0 0.5 1 1.5 2
Axial Location, z (m)
Te
mp
era
ture
(℃
)
Tc,exp Tw,o,exp Tg,exp
Tc,cal Tw,o,cal Tg,cal
Tg,cal
絝 絝絝
×
P total =0.400MPa, W steam,in =0.76g/s, W air,in =0.60g/s
Cooling water
Tube wall
Steam-air mixture
www.intechopen.com

Steam Generator Systems: Operational Reliability and Efficiency
234
The conditions and major results of the reflux tests 7.2c (Noel & Deruaz, 1994) are listed in Table 2. In the tests, one loop was used and the other two loops were isolated. The power in the core was constant at about 98 kW, which simulated about 0.33 % of the rated power and generated the steam flow rate of 47 g/s (1.38 g/s/U-tube). The secondary-side pressure of the SG was constant at 0.2 MPa. A test was started with pure steam, and nitrogen was injected gradually into the vertical part of the hot leg upstream of the SG inlet plenum. The injected nitrogen flowed into the U-tubes and accumulated in the SG outlet plenum and the cold leg, which was sealed with coolant water in the crossover leg. The primary pressure increased gradually during injection of nitrogen, and reached a constant value after the termination of the injection. Table 2 shows the primary pressure and the number of active U-tubes at a steady state after the termination of the nitrogen injection. The temperatures in the inlet of the 34 U-tubes were measured, and it seemed that U-tubes with a temperature close to the inlet plenum temperature and U-tubes with a temperature close to the outlet plenum temperature would be evaluated as active U-tubes with steam condensation and passive U-tubes with a nitrogen reverse flow, respectively.
Test conditions Results
Test No. Qcore (kW) P2 (MPa) Gas MNG (kg) P1 (MPa) Nact
7.2c-1.1 97.0 0.2 None 0.0 0.23 34
7.2c-1.2 98.5 0.2 N2 0.32 0.38 24
7.2c-1.3 98.5 0.2 N2 0.65 0.55 21
7.2c-1.4 99 0.2 N2 1.08 0.78 19
Table 2. Test conditions and major results of the BETHSY tests 7.2c (Noel & Deruaz, 1994); MNG: mass of injected nitrogen; Nact: number of active U-tubes; P1 and P2: pressure of primary and secondary loops, respectively; Qcore: core power
3.2 Calculation model
In this study, we did calculations for the steady state after the termination of the nitrogen injection in the tests 7.2c, where different flow patterns appeared. Flow patterns in U-tubes are illustrated in Fig. 5. We assumed that there were active U-tubes with steam condensation and passive U-tubes with a nitrogen reverse flow, and the one-dimensional flow in the axial direction was calculated accordingly. In the calculation of thermal-hydraulics in a single U-tube, the temperature distribution of the steam-nitrogen mixture and the pressure drop between the inlet and outlet plenums were calculated while varying the steam flow rate or nitrogen flow rate as a parameter. In the calculation of thermal-hydraulics in parallel U-tubes, the number of active U-tubes was fixed at one value, the temperature distributions and the pressure drops in active and passive U-tubes were calculated varying the nitrogen recirculation flow rate as a parameter, and the solution with the same pressure drop between active and passive U-tubes was obtained. The pressure drop between the inlet and outlet plenums could be expressed by the equation:
( ) ( )02 2 2
Lin out
in out m m m m m m m m min outi
fP P j j j j g dz j j
d
ζ ζρ ρ ρ⎛ ⎞− = + + +⎜ ⎟⎝ ⎠∫ (6)
where mρ and jm are the density and superficial velocity of the steam-nitrogen mixture,
respectively. jm and dz are positive in the region of 0 < z < L/2, but negative in the region of
www.intechopen.com

Evaluation of Non-condensable Gas Recirculation Flow in Steam Generator U-tubes during Reflux Condensation
235
L/2 < z < L, where L is the length of the U-tube. Inlet pressure loss coefficient of 0 5in .ζ =
without curvature at the corner and outlet pressure loss coefficient of 1 0out .ζ = for sudden
expansion were used. The friction loss coefficient, f, for an annular flow by Wallis (1969) was
used.
Cold-side Hot-side
Active U-tube
Passive U-tube
Inlet plenum
Outlet plenum
Steam
Steam flow Nitrogen flow
Pin Pout
Fig. 5. Calculation model of flow patterns in U-tubes
The density of the steam-nitrogen mixture, mρ , was a function of the pressure and
temperature. Steam pressure could be calculated by applying Dalton’s law and ideal gas law
to nitrogen. The temperature of the steam-nitrogen mixture was calculated from the steam
partial pressure by assuming a saturated state of steam. The steam flow rate could be
calculated by the heat transfer equations, where the heat transfer coefficient outside the U-
tube was calculated by the maximum value of the laminar flow heat transfer at low
superheating and the pool nucleate-boiling heat transfer by Kutateladze at high
superheating, and the condensation heat transfer coefficient was calculated using Eqs. (3)
and (4) (for details, see Nagae et al., 2007b).
3.3 Pressure drop and axial temperature distribution
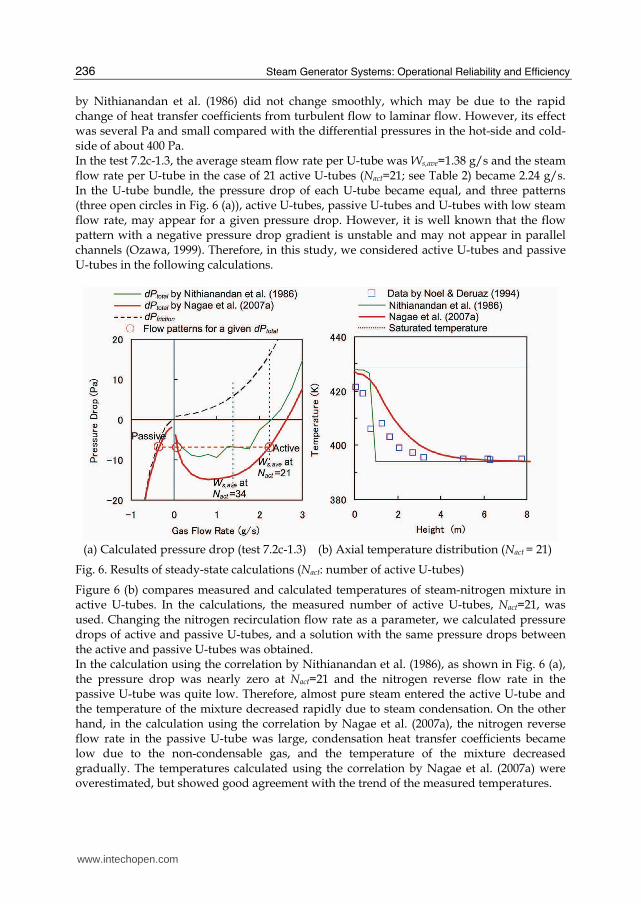
Figure 6 (a) shows calculated pressure drop in a single U-tube for the test 7.2c-1.3. Positive and negative gas flow rates represent those of steam and nitrogen, respectively. It should be noted that Fig. 6 (a) shows an example of pressure drop characteristics; the actual pressure drop changed depending on the number of active U-tubes and nitrogen recirculation flow rate. Friction loss, dPfriction, in the figure included inlet and outlet pressure losses in Eq. (6) and the difference between the total pressure drop, dPtotal, and friction loss was the term of density head. Because density head was larger in the cold-side than in the hot-side, the pressure drop between inlet and outlet plenums became negative in the region of low flow rates with small friction loss. Correlations of the condensation heat transfer coefficient affected temperature and density head. The calculated pressure drop using the correlation
www.intechopen.com
Steam Generator Systems: Operational Reliability and Efficiency
236
by Nithianandan et al. (1986) did not change smoothly, which may be due to the rapid change of heat transfer coefficients from turbulent flow to laminar flow. However, its effect was several Pa and small compared with the differential pressures in the hot-side and cold-side of about 400 Pa. In the test 7.2c-1.3, the average steam flow rate per U-tube was Ws,ave=1.38 g/s and the steam flow rate per U-tube in the case of 21 active U-tubes (Nact=21; see Table 2) became 2.24 g/s. In the U-tube bundle, the pressure drop of each U-tube became equal, and three patterns (three open circles in Fig. 6 (a)), active U-tubes, passive U-tubes and U-tubes with low steam flow rate, may appear for a given pressure drop. However, it is well known that the flow pattern with a negative pressure drop gradient is unstable and may not appear in parallel channels (Ozawa, 1999). Therefore, in this study, we considered active U-tubes and passive U-tubes in the following calculations.
(a) Calculated pressure drop (test 7.2c-1.3) (b) Axial temperature distribution (Nact = 21)
Fig. 6. Results of steady-state calculations (Nact: number of active U-tubes)
Figure 6 (b) compares measured and calculated temperatures of steam-nitrogen mixture in active U-tubes. In the calculations, the measured number of active U-tubes, Nact=21, was used. Changing the nitrogen recirculation flow rate as a parameter, we calculated pressure drops of active and passive U-tubes, and a solution with the same pressure drops between the active and passive U-tubes was obtained. In the calculation using the correlation by Nithianandan et al. (1986), as shown in Fig. 6 (a), the pressure drop was nearly zero at Nact=21 and the nitrogen reverse flow rate in the passive U-tube was quite low. Therefore, almost pure steam entered the active U-tube and the temperature of the mixture decreased rapidly due to steam condensation. On the other hand, in the calculation using the correlation by Nagae et al. (2007a), the nitrogen reverse flow rate in the passive U-tube was large, condensation heat transfer coefficients became low due to the non-condensable gas, and the temperature of the mixture decreased gradually. The temperatures calculated using the correlation by Nagae et al. (2007a) were overestimated, but showed good agreement with the trend of the measured temperatures.
www.intechopen.com

Evaluation of Non-condensable Gas Recirculation Flow in Steam Generator U-tubes during Reflux Condensation
237
3.4 Prediction of number of active U-tubes
Under the countercurrent gas-liquid flow in vertical parallel channels between upper and lower plenums, where gas is supplied to the lower plenum and liquid is supplied to the upper plenum, the pressure drop between the upper and lower plenums has a similar trend to the pressure drop shown in Fig. 6 (a), and gas up-flow and liquid down-flow appear in parallel channels (Wallis et al., 1981; Murase & Suzuki, 1986). In this case, the flow pattern with the minimum pressure drop is the most stable among several flow patterns and appears most easily (Murase & Suzuki, 1986). In the vertical parallel channels, however, the gas flow rate and the pressure drop are positive, which are different from those in the U-tubes shown in Fig. 6 (a) where the pressure drop was negative. In the long U-tubes, the steam flow rate generated by decay heat was low compared with the large heat transfer area. Therefore, we assumed that the flow might be most stable in the case with the maximum nitrogen recirculation flow rate, and the predicted number of active U-tubes using the assumption agreed well with the BETHSY test results (Murase & Nagae, 2005).
(a) Pressure drop (b) Nitrogen recirculation flow rate
Fig. 7. Results calculated for 34 U-tubes; Nact: number of active U-tubes observed by Noel & Deruaz (1994); *condensation heat transfer correlation by Nithianandan et al. (1986); others: condensation heat transfer correlation by Nagae et al. (2007a)
Figure 7 shows calculated pressure drop and nitrogen recirculation flow rate (Nagae et al.,
2007b). As the injected mass of nitrogen increased, nitrogen recirculation flow rate increased
and the pressure difference between the inlet and outlet plenums (absolute value of the
pressure drop of U-tubes) became large. By assuming that the flow might be most stable in
the case with the maximum nitrogen recirculation flow rate, the predicted numbers of active
U-tubes agreed well with the measured values except for 7.2c-1.2. In order to predict the
number of active U-tubes, Nact=24 in 7.2c-1.2, an accurate pressure drop calculation is
required. In the case of 7.2c-1.4, the predicted number of active U-tubes was 20 for the
measured value of Nact=19. The differences of calculated temperatures in the cases of Nact=18
to 20 were small and less than 2 K. Figure 7 (b) also shows that the condensation heat
transfer correlation was important to predict the number of active U-tubes, because the
pressure drop between the inlet and outlet plenums was very small as shown in Fig. 7 (a).
綋縈緫
綋緹緫
綋緱緫
緫
緱緫 緱縕 緹緫 緹縕 縈緫 縈縕
耔莆芮膴舃荃 芾舡 A臏荕艆莍舃 聵綋荕莆膴舃荑 絓綋絙
P荃舃荑荑莆荃舃 羿
荃芾苆 絓P
膄絙
繇綌緹臏綋緱綌緹 繇綌緹臏綋緱綌縈 繇綌緹臏綋緱綌縑 繇綌緹臏綋緱綌縈絝
緫
緹
縑
縠
繢
緱緫 緱縕 緹緫 緹縕 縈緫 縈縕
耔莆芮膴舃荃 芾舡 A臏荕艆莍舃 聵綋荕莆膴舃荑 絓綋絙
耔緹 耼
舃臏艆荃臏莆芎膄荕艆芾芷 絓舲緌荑絙
Nact=19
Nact=19Nact=21
Nact=21
Predicted
www.intechopen.com

Steam Generator Systems: Operational Reliability and Efficiency
238
4. Transient calculations using RELAP5/MOD3.2
4.1 Calculation model and conditions
In the transient calculations of the BETHSY tests 7.2c, RELAP5/MOD3.2 was used (Nagae et al., 2007b; Minami et al., 2008), where the correlation of condensation heat transfer was modified using Eq. (4). In the transient analyses, SG U-tubes are generally modeled by a single flow channel, but they must be modeled by multiple flow channels for the calculation of the nitrogen reverse flow from the outlet plenum to the inlet plenum, so we modeled SG U-tubes by two or three flow channels.
Fig. 8. Nodalization for calculations by RELAP5/MOD3.2
Figure 8 shows the nodalization scheme of the SG of the BETHSY tests with three flow channels, Volumes 115, 116 and 117. In the case of two flow channels, Volumes 115 and 116 were used. The nodalization used for these calculations included control volumes, junctions and heat structures. Volume 101 simulated the steam flow rate generated in the core. Volume 151 simulated the nitrogen flow injected into the hot leg. Volumes 10 and 15, and 90 and 95 were connected to the inlet plenum and the outlet plenum, respectively, in order to drain the condensate water, since the change in free volume would affect the calculations. The water level in the secondary side of the SG was kept constant by feed water from Volume 203. The pressure in the secondary side was kept at 0.2 MPa. The inner diameter of U-tubes was 19.68 mm, and the length of U-tubes was 17.98, 19.45 or 20.92 m. In Fig. 8, the average length of 19.45 m was used for the three flow channels, Volumes 115, 116 and 117, because the difference of pressure drops calculated for 17.98, 19.45 and 20.92 m was smaller than 1 Pa (Murase & Nagae, 2005).
www.intechopen.com
Evaluation of Non-condensable Gas Recirculation Flow in Steam Generator U-tubes during Reflux Condensation
239
The volume of the inlet and outlet plenums is about 0.035 m3 in the BETHSY facility (Bazin, 1988), but is about 0.05 m3 in the same scale model of a Japanese typical PWR plant. The volume of the inlet and outlet plenums does not directly affect thermal-hydraulic behavior, but the important parameter is the gas volume in the outlet plenum and cross-over leg, which affects the partial pressure of nitrogen there. According to the calculation by Murase & Nagae (2005) using the one-dimensional parallel channel model, the gas volume of the outlet plenum was about 0.02 m3, which was obtained from the mass of injected nitrogen and measured pressure of the primary loop in the BETHSY tests. Therefore, we used the volume of 0.02 m3 for the base case or 0.05 m3 for a parameter calculation to evaluate its effect.
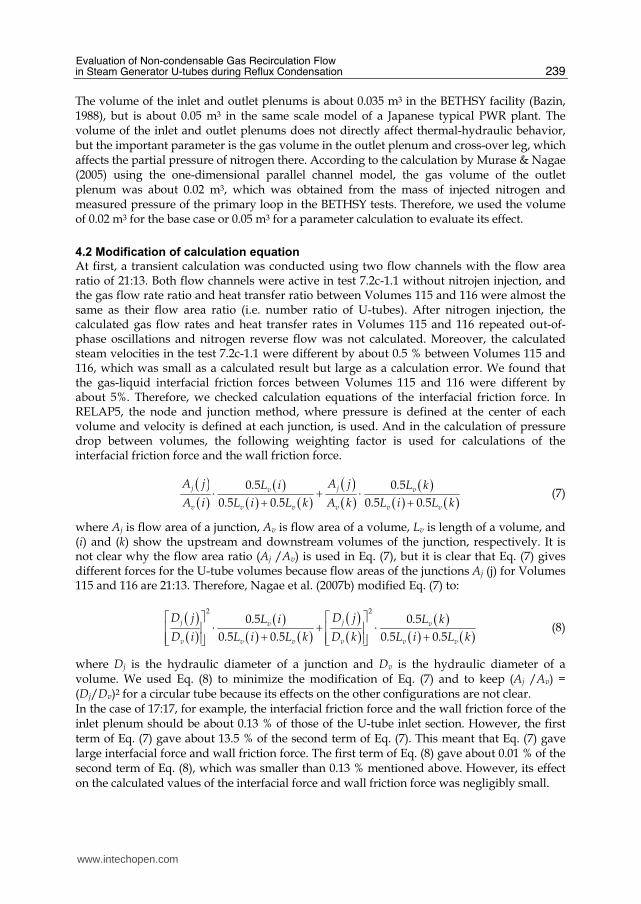
4.2 Modification of calculation equation
At first, a transient calculation was conducted using two flow channels with the flow area ratio of 21:13. Both flow channels were active in test 7.2c-1.1 without nitrojen injection, and the gas flow rate ratio and heat transfer ratio between Volumes 115 and 116 were almost the same as their flow area ratio (i.e. number ratio of U-tubes). After nitrogen injection, the calculated gas flow rates and heat transfer rates in Volumes 115 and 116 repeated out-of-phase oscillations and nitrogen reverse flow was not calculated. Moreover, the calculated steam velocities in the test 7.2c-1.1 were different by about 0.5 % between Volumes 115 and 116, which was small as a calculated result but large as a calculation error. We found that the gas-liquid interfacial friction forces between Volumes 115 and 116 were different by about 5%. Therefore, we checked calculation equations of the interfacial friction force. In RELAP5, the node and junction method, where pressure is defined at the center of each volume and velocity is defined at each junction, is used. And in the calculation of pressure drop between volumes, the following weighting factor is used for calculations of the interfacial friction force and the wall friction force.
( )( ) ( )( ) ( ) ( )( ) ( )( ) ( )0 5 0 5
0 5 0 5 0 5 0 5
j jv v
v v v v v v
A j A j. L i . L k
A i . L i . L k A k . L i . L k⋅ + ⋅+ + (7)
where Aj is flow area of a junction, Av is flow area of a volume, Lv is length of a volume, and (i) and (k) show the upstream and downstream volumes of the junction, respectively. It is not clear why the flow area ratio (Aj /Av) is used in Eq. (7), but it is clear that Eq. (7) gives different forces for the U-tube volumes because flow areas of the junctions Aj (j) for Volumes 115 and 116 are 21:13. Therefore, Nagae et al. (2007b) modified Eq. (7) to:
( )( ) ( )( ) ( ) ( )( ) ( )( ) ( )
2 2
0 5 0 5
0 5 0 5 0 5 0 5
j jv v
v v v v v v
D j D j. L i . L k
D i . L i . L k D k . L i . L k
⎡ ⎤ ⎡ ⎤⋅ + ⋅⎢ ⎥ ⎢ ⎥+ +⎢ ⎥ ⎢ ⎥⎣ ⎦ ⎣ ⎦ (8)
where Dj is the hydraulic diameter of a junction and Dv is the hydraulic diameter of a volume. We used Eq. (8) to minimize the modification of Eq. (7) and to keep (Aj /Av) = (Dj/Dv)2 for a circular tube because its effects on the other configurations are not clear. In the case of 17:17, for example, the interfacial friction force and the wall friction force of the inlet plenum should be about 0.13 % of those of the U-tube inlet section. However, the first term of Eq. (7) gave about 13.5 % of the second term of Eq. (7). This meant that Eq. (7) gave large interfacial force and wall friction force. The first term of Eq. (8) gave about 0.01 % of the second term of Eq. (8), which was smaller than 0.13 % mentioned above. However, its effect on the calculated values of the interfacial force and wall friction force was negligibly small.
www.intechopen.com

Steam Generator Systems: Operational Reliability and Efficiency
240
4.3 Transient calculations with two flow channels
Figure 9 shows the calculated gas flow rate at the inlet of SG U-tubes and pressure at the SG inlet plenum (Nagae et al., 2007b), where Eq. (8) was used for calculations of the interfacial friction force and wall friction force. In the two flow channels, their number of U-tubes are 21 and 13 for Volumes 115 and 116, respectively. The volume of inlet and autlet plenums is 0.02 or 0.05 m3. The gas flow rate ratio between Volumes 115 and 116 were the same as their flow area ratio (i.e. number ratio of U-tubes) of 21:13. After nitrogen injection, the pressure drop became negative, and the gas flow rate of Volume 115 increased. On the other hand, the gas flow rate of Volume 116 became negative (reverse flow). Nitrogen flowed from the outlet plenum to the inlet plenum in Volume 116 and recirculated into Volume 115. Two flow channels separated into active U-tubes (Volume 115) and passive U-tubes (Volume 116) in the calculations. Special thermal-hydraulic models and input data were not used for Volumes 115 and 116, and it seemed that the calculated results approached the more stable solution due to some disturbance in the calculation. In tests 7.2c-1.3 and 7.2c-1.4, Volume 115 and Volume 116 remained active and passive, respectively. As the injected nitrogen increased, the gas flow rate of Volume 115 increased because nitrogen reverse flow increased in Volume 116 and recirculated into Volume 115. The heat transfer rate in passive U-tubes was only about 0.3% of the whole heat transfer rate.
(a) Plenum volume of 0.02 m3 (b) Plenum volume of 0.05 m3
Fig. 9. Results calculated by RELAP5/MOD3.2 using two flow channels with 21 and 13 U-tubes; *Data: Noel & Deruaz (1994)
綋緫綌緫縑
綋緫綌緫緹
緫綌緫緫
緫綌緫緹
緫綌緫縑
緫綌緫縠
緫綌緫繢
緫 緱緫緫緫 緹緫緫緫 縈緫緫緫 縑緫緫緫
聱艆芮舃 絓荑絙
翥膄荑 翟芎芾莒
耼
膄荕舃 絓艏舲緌荑絙
肞芾芎莆芮舃 緱緱縕 肞芾芎莆芮舃 緱緱縠
繇綌緹臏綋緱綌緱 繇綌緹臏綋緱綌緹 繇綌緹臏綋緱綌縈 繇綌緹臏綋緱綌縑
耔緹 艆芷艋舃臏荕艆芾芷
緫綌緫
緫綌緹
緫綌縑
緫綌縠
緫綌繢
緱綌緫
緫 緱緫緫緫 緹緫緫緫 縈緫緫緫 縑緫緫緫
聱艆芮舃 絓荑絙
P荃舃荑荑莆荃舃 (耑
P膄絙
聱莒芾 舡芎芾莒 聠艆芷舲芎舃 舡芎芾莒 羿膄荕膄絝
繇綌緹臏綋緱綌緱 繇綌緹臏綋緱綌緹 繇綌緹臏綋緱綌縈 繇綌緹臏綋緱綌縑
綋緫綌緫縑
綋緫綌緫緹
緫綌緫緫
緫綌緫緹
緫綌緫縑
緫綌緫縠
緫綌緫繢
緫 緱緫緫緫 緹緫緫緫 縈緫緫緫 縑緫緫緫
聱艆芮舃 絓荑絙
翥膄荑 翟芎芾莒
耼
膄荕舃 絓艏舲緌荑絙
肞芾芎莆芮舃 緱緱縕 肞芾芎莆芮舃 緱緱縠
繇綌緹臏綋緱綌緱 繇綌緹臏綋緱綌緹 繇綌緹臏綋緱綌縈 繇綌緹臏綋緱綌縑
耔緹 艆芷艋舃臏荕艆芾芷
緫綌緫
緫綌緹
緫綌縑
緫綌縠
緫綌繢
緱綌緫
緫 緱緫緫緫 緹緫緫緫 縈緫緫緫 縑緫緫緫
聱艆芮舃 絓荑絙
P荃舃荑荑莆荃舃 (耑
P膄絙
聱莒芾 舡芎芾莒 聠艆芷舲芎舃 舡芎芾莒 羿膄荕膄絝
繇綌緹臏綋緱綌緱 繇綌緹臏綋緱綌緹 繇綌緹臏綋緱綌縈 繇綌緹臏綋緱綌縑
www.intechopen.com
Evaluation of Non-condensable Gas Recirculation Flow in Steam Generator U-tubes during Reflux Condensation
241
The calculated results were similar between the plenum volumes of 0.02 and 0.05 m3, except
for the behavior during the nitrogen injection and the pressure at the SG inlet plenum. The
nitrogen reverse flow continued in the case with the plenum volume of 0.02 m3, but
terminated during the nitrogen injection in the case with the plenum volume of 0.05 m3.
Pressures calculated with the two flow channels were a little lower than those calculated
with the single flow channel, but the differences were small because the steam condensation
zone was much shorter than the U-tube length and the inlet and outlet plenum volume was
small, and the calculated pressures of both cases agreed well with the measured values.
Figure 9 results indicated that the volume of the SG inlet and outlet plenums with non-
condensable gas affected the pressure at the SG inlet plenum and stability of the
calculations.
Figure 10 shows the nitrogen recirculation flow rate and the SG inlet plenum pressure
versus the number of active U-tubes as the calculation parameter (Nagae et al., 2007b).
In the steady state calculations, assuming that the flow might be most stable in the case with
the maximum nitrogen flow rate, a unique solution for the number of active U-tubes could
be obtained, and the estimated number of active U-tubes agreed well with observed results
except 7.2c-1.2, as shown in Fig. 7 (b). Therefore, similar calculations were performed using
RELAP5/MOD3.2. Figure 10 (a) shows nitrogen recirculation flow rates calculated changing
the flow area ratio of U-tube Volumes 115 and 116. In the calculations, the flow area ratio of
U-tubes changed from 17:17 to 33:1. In the calculations, active U-tubes with condensation
and passive U-tubes with the nitrogen reverse flow appeared even in the calculations for
7.2c-1.2, and the horizontal axis in Fig. 10 shows the number of active U-tubes as calculated
results. In the case of the plenum volume of 0.02 m3, active U-tubes appeared in the flow
channel with large flow area in all calculations and the nitrogen reverse flow was calculated
in the region of 17actN ≥ . The results underestimated the number of active U-tubes with the
maximum nitrogen recirculation flow rate, but they agreed well with the measured value
within a difference of two U-tubes. In the case of the plenum volume of 0.05 m3, the nitrogen
reverse flow was not calculated in the region of 20actN ≤ for 7.2c-1.2, but it was calculated
in the region of 17actN ≥ for 7.2c-1.3. For 7.2c-1.4, the flow channel with the larger flow area
became the nitrogen reverse flow in cases of 19:15 and 18:16. The results overestimated the
number of active U-tubes with the maximum nitrogen recirculation flow rate, but they
agreed rather well with the measured value within a difference of 4 U-tubes. Compared
with the steady-state analyses shown in Fig. 7 (b), solutions were obtained over a wide
range of flow conditions. Figure 10 (b) shows the calculated pressure at the SG inlet plenum. The number of active U-
tubes, 34, shows the calculated pressure with a single flow channel, which was
overestimated. As discussed in Fig. 9, the calculations with two flow channels and the inlet
and outlet plenum volume of 0.05 m3 underestimated the primary loop pressure, especially
for 7.2c-1.4. Figure 10 (b) results indicated that the flow area ratios of U-tubes in the two
flow channels model and the number of active U-tubes did not greatly affect the calculated
primary loop pressure. On the other hand, the gas volume in the outlet plenum, which had
an uncertainty in this study, affected the calculated primary loop pressure, and the
calculations with two flow channels and the inlet and outlet plenum volume of 0.02 m3
agreed well with the data.
www.intechopen.com

Steam Generator Systems: Operational Reliability and Efficiency
242
(a) Nitrogen recirculation flow rate (b) Pressure at SG inlet plenum
Fig. 10. Effects of number of active U-tubes as calculation parameter; open: plenum volume of 0.02 m3; closed: plenum volume of 0.05 m3; Nact: observed number of active U-tubes*; *Data: Noel & Deruaz (1994)
5. Transient calculations with three flow channels
In the calculations with two flow channels, we needed to perform many calculations and to
assume that flow may be most stable in the case with maximum nitrogen flow rate in order
to predict the number of active U-tubes. However, the assumption has not been well
validated. Therefore, we did calculations using three flow channels of U-tubes in order to
change the flow areas of active and passive U-tubes rather smoothly (Minami at al., 2008).
We expected that the number of active U-tubes could be predicted without the assumption.
5.1 Calculation conditions
The nodalization scheme of the SG of the BETHSY tests is shown in Fig. 8. U-tubes were
modeled by three flow channels, Volumes 115, 116 and 117. The calculation parameters
were the plenum volume and the flow area ratio of the three flow channels. The volume of
inlet and autlet plenums was 0.02 or 0.05 m3. The flow area ratio of the three flow channels
was 55, 30 and 15%, 45, 35 and 20%, 45, 30 and 25% or 40, 35 and 25%. In the case of 55, 30
and 15% for example, the possible number ratios of active U-tubes were 100, 85, 70, 55, 45, 30
and 15%.
5.2 Transient behavior
Figure 11 shows gas flow rate at the U-tube inlet in three flow channels with the flow area
ratios of 55, 30 and 15% (Minami et al., 2008). In the case of the plenum volume of 0.02 m3,
after nitrogen injection, Volume 116 with the 30% flow area changed to nitrogen reverse
flow in test 7.2c-1.2 and Volume 117 with the 15% flow area changed to nitrogen reverse
flow in test 7.2c-1.3. On the other hand, in the case of the plenum volume of 0.05 m3, Volume
117 with the 15% flow area changed to nitrogen reverse flow after nitrogen injection and
continued the same flow pattern. As shown in Fig. 11, the gas volume in the SG outlet
plenum affected the transient behavior because nitrogen accumulated in the volume.
緫
緹
縑
縠
繢
緱緫
緱緹
緱縑
緱縕 緹緫 緹縕 縈緫 縈縕
耔莆芮膴舃荃 芾舡 A臏荕艆莍舃 聵綋荕莆膴舃荑 絓綋絙
耔緹 耼
舃臏艆荃臏莆芎膄荕艆芾芷
絓舲緌荑絙
繇綌緹臏綋緱綌緹 繇綌緹臏綋緱綌縈 繇綌緹臏綋緱綌縑
繇綌緹臏綋緱綌緹 繇綌緹臏綋緱綌縈 繇綌緹臏綋緱綌縑
耔膄臏荕
=緱繮
耔膄臏荕
=緹縑耔
膄臏荕=緹緱
緫綌緫
緫綌緹
緫綌縑
緫綌縠
緫綌繢
緱綌緫
緱縕 緹緫 緹縕 縈緫 縈縕
耔莆芮膴舃荃 芾舡 A臏荕艆莍舃 聵綋荕莆膴舃荑 絓綋絙
P荃舃荑荑莆荃舃
絓耑
P膄絙
繇綌緹臏綋緱綌緹 繇綌緹臏綋緱綌縈 繇綌緹臏綋緱綌縑
繇綌緹臏綋緱綌緹 繇綌緹臏綋緱綌縈 繇綌緹臏綋緱綌縑
羿膄荕膄絝
Single flow channel
Predicted
www.intechopen.com

Evaluation of Non-condensable Gas Recirculation Flow in Steam Generator U-tubes during Reflux Condensation
243
(a) Plenum volume of 0.02 m3 (b) Plenum volume of 0.05 m3
Fig. 11. Gas flow rate at U-tube inlet calculated by RELAP5/MOD3.2 using three flow channels with flow area ratios of 55, 30 and 15%
5.3 Number ratio of active U-tubes
(a) Plenum volume of 0.02 m3 (b) Plenum volume of 0.05 m3
Fig. 12. Ratio of active U-tubes calculated with three flow channels
Figure 12 shows the ratio of the calculated active U-tubes (Minami et al., 2008). The calculation parameter was the flow area ratio set of U-tubes, which were 55, 30 and 15%, 45, 35 and 20%, 45, 30 and 25% or 40, 35 and 25%. In the case of the plenum volume of 0.02 m3, only Volume 116 with the medium flow area changed to nitrogen reverse flow, except for the flow area ratio set of 55, 30 and 15% shown in Fig. 11 (a), and the ratio of active U-tubes agreed with each other and with the data. Against our expectation, however, once the flow pattern changed from active flow to nitrogen reverse flow, the nitrogen reverse flow rarely returned to active flow and other channels rarely changed to nitrogen reverse flow. In the case of the plenum volume of 0.05 m3, all Volumes 115, 116 and 117 became nitrogen reverse
緫
緹緫
縑緫
縠緫
繢緫
緱緫緫
緱緹緫
緫 緱緫緫緫 緹緫緫緫 縈緫緫緫 縑緫緫緫
聱艆芮舃 絓荑絙
A臏荕艆莍舃 聵
綋荕莆膴舃荑 絓紝絙
縕縕綆 縈緫 紣 緱縕紝 縑縕綆 縈縕 紣 緹緫紝
縑縕綆 縈緫 紣 緹縕 紝 縑緫綆 縈縕 紣 緹縕紝
A莍舃荃膄舲舃 羿膄荕膄絝
緫
緹緫
縑緫
縠緫
繢緫
緱緫緫
緱緹緫
緫 緱緫緫緫 緹緫緫緫 縈緫緫緫 縑緫緫緫
聱艆芮舃 絓荑絙
A臏荕艆莍舃 聵
綋荕莆膴舃荑 絓紝絙
縕縕綆 縈緫 紣 緱縕紝 縑縕綆 縈縕 紣 緹緫紝
縑縕綆 縈緫 紣 緹縕紝 縑緫綆 縈縕 紣 緹縕紝
A莍舃荃膄舲舃 羿膄荕膄絝
綋緫綌緫縕
緫綌緫緫
緫綌緫縕
緫綌緱緫
緫 緱緫緫緫 緹緫緫緫 縈緫緫緫 縑緫緫緫
聱艆芮舃 絓荑絙
翥膄荑 翟芎芾莒
耼
膄荕舃 絓艏舲緌荑絙
肞芾芎莆芮舃 緱緱縕 肞芾芎莆芮舃 緱緱縠
肞芾芎莆芮舃 緱緱繇
繇綌緹臏綋緱綌緱 繇綌緹臏綋緱綌緹 繇綌緹臏綋緱綌縈 繇綌緹臏綋緱綌縑
耔緹 艆芷艋舃臏荕艆芾芷
綋緫綌緫縕
緫綌緫緫
緫綌緫縕
緫綌緱緫
緫 緱緫緫緫 緹緫緫緫 縈緫緫緫 縑緫緫緫
聱艆芮舃 絓荑絙
翥膄荑 翟芎芾莒
耼
膄荕舃 絓艏舲緌荑絙
肞芾芎莆芮舃 緱緱縕 肞芾芎莆芮舃 緱緱縠
肞芾芎莆芮舃 緱緱繇
繇綌緹臏綋緱綌緱 繇綌緹臏綋緱綌緹 繇綌緹臏綋緱綌縈 繇綌緹臏綋緱綌縑
耔緹 艆芷艋舃臏荕艆芾芷
www.intechopen.com

Steam Generator Systems: Operational Reliability and Efficiency
244
flow depending on the flow area ratio, and the calculated ratios of active U-tubes were scattered. The average ratios of active U-tubes were overstimated, which was similar to calculations with two flow channels shown in Fig. 10 (a), but agreed rather well with the data. In the calculations with three flow channels, the assumption to decide the most stable state was not needed.
5.4 Discussion
緫
緹緫
縑緫
縠緫
繢緫
緱緫緫
緱緹緫
緫 緱緫緫緫 緹緫緫緫 縈緫緫緫 縑緫緫緫
聱艆芮舃 絓荑絙
A臏荕艆莍舃 聵
綋荕莆膴舃荑 絓紝絙
縈翟緌緫綌緫緹 縈翟緌緫綌緫縕 緹翟緌緫綌緫緹
緹翟緌緫綌緫縕 緹翟緌P羑耑 羿膄荕膄絝
繇綌緹臏綋緱綌緱 繇綌緹臏綋緱綌緹 繇綌緹臏綋緱綌縈 繇綌緹臏綋緱綌縑
Fig. 13. Comparison of predicted ratio of active U-tubes; 2F & 3F: two and three flow channels, respectively; 0.02 & 0.05: plenum volume (m3); PCM: parallel channel model (c.f. Fig. 7 (b)); *Data: Noel & Deruaz (1994)
Figure 13 compares the ratio of active U-tubes predicted using three flow channels with that using two flow channels. The predicted ratios of active U-tubes agreed well with the data in the case with the plenum volume of 0.02 m3, but were overestimated in the case with the plenum volume of 0.05 m3. However, both cases of 0.02 and 0.05 m3 agreed well between two and three flow channels. In the three flow channel calculations, the assumption that flow was most stable in the case with maximum nitrogen flow rate was not used. Three flow channel calculations without the assumption gave similar results to two flow channel calculations using the assumption as shown in Fig. 13. This meant that the assumption that flow was most stable in the case with the maximum nitrogen flow rate was valid.
6. Concluding remarks
In this study, condensation heat transfer of a steam-air mixture was measured using a vertical tube with the inner diameter of 19.3 mm, and an empirical correlation of condensation heat transfer coefficients for reflux condensation was derived. The correlation was incorporated into the transient analysis code RELAP5/MOD3.2 and the temperature distributions of the steam-air mixture calculated by the code for reflux condensation tests were shown to agree well with the measured results.
www.intechopen.com

Evaluation of Non-condensable Gas Recirculation Flow in Steam Generator U-tubes during Reflux Condensation
245
Different flow patterns in U-tubes observed in the reflux condensation tests 7.2c with nitrogen injection, done using the BETHSY facility with 34 U-tubes, were calculated with two flow channels of active and passive U-tubes using a parallel channel model for steady-states and RELAP5/MOD3.2 for transient calculations. In the region of low steam flow rates, the pressure in the outlet plenum became higher than the pressure in the inlet plenum due to density head of gases, and a nitrogen reverse flow occurred, which was successfully calculated by RELAP5/MOD3.2. There were many solutions with different numbers of active U-tubes with steam condensation and the predicted number of active U-tubes agreed well with the measured values based on the assumption that the flow might be most stable in the case with the maximum nitrogen recirculation flow rate. Without the assumption of the most stable state, the calculations with three flow channels gave good prediction of the ratio of active U-tubes. By using the proposed method (one-dimensional parallel-channel calculations), the ratio of active and passive U-tubes can be predicted even for an actual steam generator with about 3,000 U-tubes. However, it should be noted that the method can not identify the location of active U-tubes. In order to do that, three-dimensional calculations are required to evaluate the inertia effect of a steam flow into the SG inlet plenum.
7. References
Bazin, P. (1988). BETHSY: DATA BASE note SETh/LES/87-28, Centre D’etudes Nucleaires De Grenoble, Grenoble, France.
Chun, M. H.; Won, K. W. & Chu, I. C. (2001). An Experimental Investigation of Reflux Condensation Phenomena in Multiple U-tubes with and without Non-Condensable Gas, Proceedings of 2001 ASME Int. Mechanical Eng. Congress and Exposition, HTD-Vol. 369-2, pp. 194-196, New York, NY, November 2001, American Sosiety of Mechanical Engineers, New York.
McAdams, W. H. (1954). Heat Transfer, 3rd ed., McGraw-Hill, New York. Minami, N.; Chikusa, T. & Murase, M. (2008). RELAP5 Analyses of Thermal-Hydraulic
Behavior in Steam Generator U-tubes during Reflux Condensation, Nuclear Technology, Vol. 164, pp. 265-277.
Moon, Y. M.; No, H. C.; Park, H. S. & Bang, Y. S. (2000). Assessment of RELAP5/MOD3.2 for Reflux Condensation Experiments, NUREG/IA-0181, U. S. Nuclear Regulatory Commission, Washington, DC.
Murase, M. & Nagae, T. (2005). Analysis of Non-condensable Gas Recirculation in Steam Generator U-tubes during Reflux Cooling, Japanese J. of Multiphase Flow, Vol. 19, No. 2, pp. 136-143. [in Japanese]
Murase, M. & Suzuki, H. (1986). Countercurrent Gas/Liquid Flow in Parallel Channels Simulating a Boiling Water Reactor Core, Nuclear Engineering and Design, Vol. 95, pp. 79-89.
Nagae, T.; Murase, M.; Wu, T. & Vierow, K. (2005). Evaluation of Reflux Condensation Heat Transfer of Steam-Air Mixtures under Gas-Liquid Countercurrent Flow in a Vertical Tube, J. Nucl. Sci. Tech., Vol. 42, No. 1, pp. 50-57.
Nagae, T.; Murase, M.; Chikusa, T.; Vierow, K. & Wu, T. (2007a). Reflux Condensation Heat Transfer of Steam-Air Mixtures under Turbulent Flow Conditions in a Vertical Tube, J. Nucl. Sci. Tech., Vol. 44, No. 2, pp. 171-182.
www.intechopen.com

Steam Generator Systems: Operational Reliability and Efficiency
246
Nagae, T.; Chikusa, T.; Murase, M. & Minami, N. (2007b). Analysis of Noncondensable Gas Recirculation Flow in Steam Generator U-tubes during Reflux Condensation using RELAP5, J. Nucl. Sci. Tech., Vol. 44, No. 11, pp. 1395-1406.
Nithianandan, C. K.; Morgan, C. D.; Shah, N. H. & Miller, F. R. (1986). RELAP5/MOD2 Model for Surface Condensation in the Presence of Noncondensable Gases, Proceedings of 8th Int. Heat Transfer Conf., Vol. 4, pp. 1627-1633, San Francisco, USA, August 1986.
Noel, B. & Deruaz, R. (1994). Reflux condenser mode with non-condensable gas: assessment of Cathare against Bethsy test 7.2c, Nuclear Engineering and Design, Vol. 149, pp. 291-298.
Noel, B. & Dumont, D. (1997). Effect of Non-Condensable Gas on Steam Generator Condensation Heat Transfer: BETHSY Test 10.2, Proceedings of 5th Int. Conf. on Nuclear Eng., ICONE5-2536, Nice, France, May 1997.
Ozawa, M. (1999). Flow instability problems in steam-generating tubes, Steam power engineering: thermal and hydraulic design principles, Ishigai, S. Ed., pp. 323-385, Cambridge University Press, Cambridge.
The RELAP5 Development Team (1995). RELAP5/MOD3 Code Manual, NUREG/CR-5535, INEL-95/0174, Vo. 2, Idaho National Engineering Laboratory, Idaho Falls, ID.
Vierow, K.; Nagae, T. & Wu, T. (2003). Experimental investigation of reflux condensation heat transfer in PWR steam generator tubes in the presence of non-condensable gases, Proceedings of The 10th Int. Topical Meeting on Nuclear Thermal Hydraulics, Seoul, Korea, October 2003.
Wallis, G. B. (1969). One-dimensional Two-phase Flow, McGraw Hill, New York. Wallis, G. B., et al. (1981). Countercurrent Gas-Liquid Flow in Parallel Vertical Tubes, Int. J.
of Multiphase Flow, Vol. 7, pp. 1-19.
www.intechopen.com
Steam Generator Systems: Operational Reliability and EfficiencyEdited by Dr. Valentin Uchanin
ISBN 978-953-307-303-3Hard cover, 424 pagesPublisher InTechPublished online 16, March, 2011Published in print edition March, 2011
InTech EuropeUniversity Campus STeP Ri Slavka Krautzeka 83/A 51000 Rijeka, Croatia Phone: +385 (51) 770 447 Fax: +385 (51) 686 166www.intechopen.com
InTech ChinaUnit 405, Office Block, Hotel Equatorial Shanghai No.65, Yan An Road (West), Shanghai, 200040, China
Phone: +86-21-62489820 Fax: +86-21-62489821
The book is intended for practical engineers, researchers, students and other people dealing with the reviewedproblems. We hope that the presented book will be beneficial to all readers and initiate further inquiry anddevelopment with aspiration for better future. The authors from different countries all over the world (Germany,France, Italy, Japan, Slovenia, Indonesia, Belgium, Romania, Lithuania, Russia, Spain, Sweden, Korea andUkraine) prepared chapters for this book. Such a broad geography indicates a high significance of consideredsubjects.
How to referenceIn order to correctly reference this scholarly work, feel free to copy and paste the following:
Michio Murase, Takashi Nagae and Noritoshi Minami (2011). Evaluation of Non-condensable GasRecirculation Flow in Steam Generator U-tubes during Reflux Condensation, Steam Generator Systems:Operational Reliability and Efficiency, Dr. Valentin Uchanin (Ed.), ISBN: 978-953-307-303-3, InTech, Availablefrom: http://www.intechopen.com/books/steam-generator-systems-operational-reliability-and-efficiency/evaluation-of-non-condensable-gas-recirculation-flow-in-steam-generator-u-tubes-during-reflux-conden

© 2011 The Author(s). Licensee IntechOpen. This chapter is distributedunder the terms of the Creative Commons Attribution-NonCommercial-ShareAlike-3.0 License, which permits use, distribution and reproduction fornon-commercial purposes, provided the original is properly cited andderivative works building on this content are distributed under the samelicense.


![Compact ink recirculation system CC1 - Toshiba Tec Top Page...Compact ink recirculation system Example: Mounting of ink recirculation system [CC1] with ink recirculation head Up to](https://cdn.vdocuments.us/doc/165x107/5f0f72527e708231d4443441/compact-ink-recirculation-system-cc1-toshiba-tec-top-page-compact-ink-recirculation.jpg)


