INTERNATIONAL JOURNAL OF CIVIL AND STRUCTURAL ENGINEERING
Volume 3, No 1, 2012
© Copyright by the authors - Licensee IPA- Under Creative Commons license 3.0
Research article ISSN 0976 – 4399
Received on June, 2012 Published on August 2012 205
Evaluation of Geopolymer properties with temperature imposed on
activator prior mixing with fly ash Debabrata Dutta
1, Suman Chakrabarty
2, Chandan Bose
2, Somnath Ghosh
3
1- Research Scholar, Department of Civil Engineering, Jadavpur University, Kolkata-
700032, W.B, India
2- Student, Department of Civil Engineering, Jadavpur University, Kolkata- 700032,
W.B, India,
3- Professor, Department of Civil Engineering, Jadavpur University, Kolkata- 700032, W.B,
India.
doi:10.6088/ijcser.201203013020
ABSTRACT
The present experiment has been performed to assess the impact of temperatures on activator
before mixing. In this program, a set of activators having 8% of Na2O by weight of fly ash
were subjected to different temperatures ranging from 15OC to 90
OC, for a period of 24 hours
and 48 hours. The performances of geopolymer were investigated on the basis of workability
and strength. Scanning Electron Microscope (SEM) along with EDAX was also conducted to
predict microstructural and mineralogical changes. Geopolymer paste prepared with the
activator, which was subjected to a temperature 45OC for duration of 48 hours, showed
mechanical property.
Keywords: Geopolymer, Sodium Silicate, temperature, SEM-EDAX, workability.
1. Introduction
Geopolimerisation is a geo-synthesis (reaction that chemically integrates minerals) that
involves naturally occurring silico-aluminates (Hermann E. et. al. 1999). Geopolymers are
cross-linked aluminium silicate networks with charge balancing alkaline cations with water
retained in the internal pores (J. Temuujin. et. al. 2009) The geopolymerisation process also
depends on many parameters including the chemical and mineralogical composition of the
starting materials, curing temperature, water content, concentration of the alkaline compound,
etc. (J. Temuujin. et. al. 2009). Geopolymers have been receiving increased attention over the
last years because of their superior mechanical, chemical and thermal properties when
compared to Portlamd based cements , and that also with significant lower CO2 production.
Geopolymers are generally synthesized by activation of an alumino-silicate source like fly
ash, blast furnace slag, silica fume with an alkaline hydroxide and silicate solution. The
geopolymer gel binder consists of a predominantly X-ray amorphous alumino-silicate
network, where the tetrahedral Al sites are charge-balanced by alkali metal cations (Catherine
A et al. 2008). As a conventional practice, activating solutions of high soluble silicate
concentrations are often used to produce geopolymers so that favorable setting and
mechanical properties can be achieved (W.K.W. Lee et al. 2002). From the basic laws of
chemistry, according to Le’Chatelier’s principle (wikipedia.org, 2012), “If a chemical system
at equilibrium experiences a change in concentration, temperature, volume, or partial pressure,
then the equilibrium shifts to counteract the imposed change and a new equilibrium is
established” .It is a well-known fact that the dissolution of NaOH in water is an exothermic
Evaluation of Geopolymer properties with temperature imposed on activator prior mixing with fly ash
Debabrata Dutta
International Journal of Civil and Structural Engineering 206
Volume 3 Issue 1 2012
process, NaOH(aq) = Na+ (aq) + OH-(aq) + (heat). If the temperature increases then
according to Le’Chatelier’s principle, the backward reaction will be favoured. As a result of
which, the dissolution rate of sodium hydroxide will be decelerated. Hence there must be an
optimum temperature when the dissolution is higher.
In this experimental study, we subject the activators to different temperatures and try to
assess its impact on the mechanical properties of the geopolymer. The activator was subjected
to different temperatures ranging from 15OC to 90
OC, for a period of 24 hours. The
performance of activator was evaluated through mechanical and microstructural properties
geopolymer.
2 Materials and method
2.1 Materials Properties
Low calcium Class F fly ash, used in the present research work was collected from Kolaghat
Thermal Power Plant near Kolkata, India. The chemical composition of the fly ash is given in
Table-1. About 75% of particles were finer than 45 micron and Blaine’s specific surface was
380m2/kg. Laboratory grade sodium hydroxide in pellet form (98 percent purity) was used.
Sodium silicate solution (Na2O= 8%, SiO2 =26.5% and 65.5% water) with silicate
modulus ~ 3.3 and a bulk density of 1410 kg/m3 was supplied by Loba Chemie Ltd,
India. The alkaline activating solution was prepared by dissolving required quantity of
sodium hydroxide pellets directly into water .The activator solution (Sodium hydroxide and
water) was left at 15OC to 90
OC temperature for 24 hours after that predetermined quantity of
sodium silicate solution was added 3 hours before being used to manufacture geopolymer
specimens. This activator solution had Na2O content equal to 8.0% of fly ash and SiO2/Na2O
ratio equal to 1. Water to Fly ash ratio was of 0.33.
Table 1: Chemical analysis report of Fly ash
2.2 Sample preparation
2.2.1 General
In a Hobart mixer, Fly ash was mixed with predetermined quantity of activator solution for 5
minutes. The mix was then transferred into 50mm x 50mm x 50 mm cubes. Table vibration
was provided for 2 minutes to expel any entrapped air. After 60 minutes, the cubes were
cured in an oven for a period of 48 hours at 85OC and then allowed to cool inside the oven
Chemical composition Fly ash
SiO2 56.01
Al2O3 29.8
Fe2O3 3.58
TiO2 1.75
CaO 2.36
MgO 0.30
K2O 0.73
Na2O 0.61
SO3 Nil
P2O5 0.44
Loss on ignition 0.40
Evaluation of Geopolymer properties with temperature imposed on activator prior mixing with fly ash
Debabrata Dutta
International Journal of Civil and Structural Engineering 207
Volume 3 Issue 1 2012
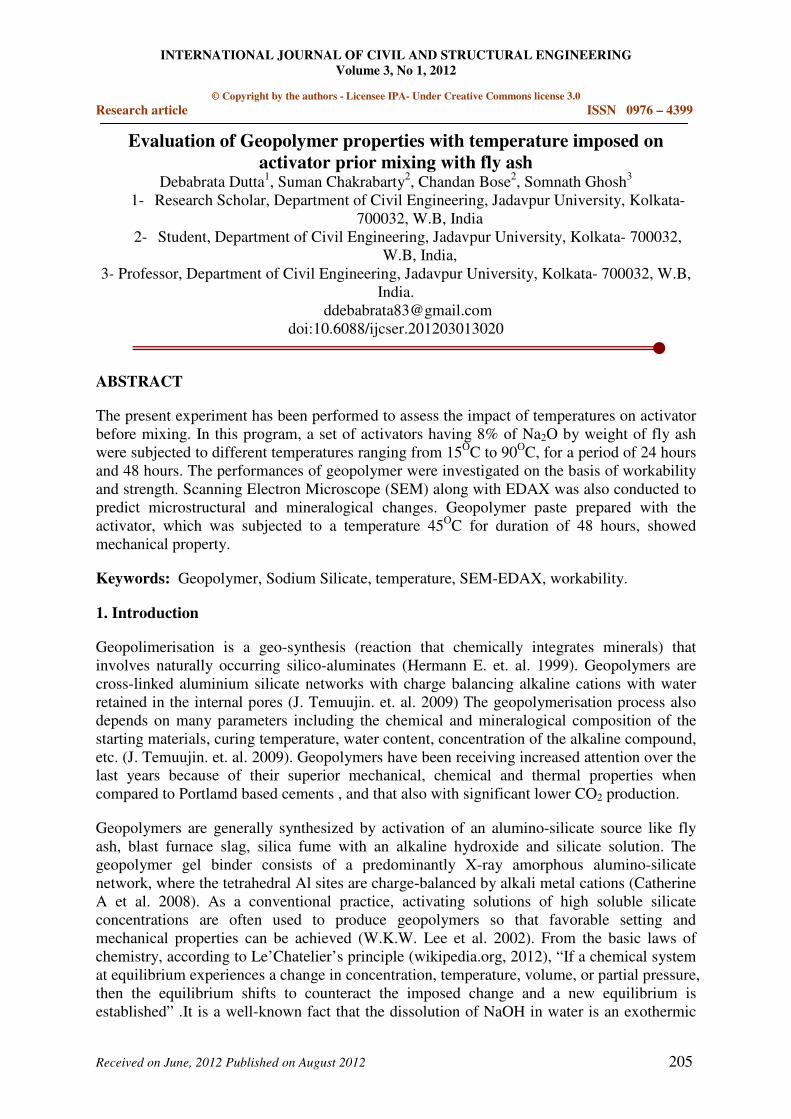
(Thakur R. et. al., 2007). Specimens were removed and stored at room temperature at a dry
place before testing. Some data of the present study are given in the Table 2. After 3 days
from casting, the geopolymer specimens were tested for its compressive strength and micro
structural properties including Scanning electron microscopy, electron diffraction spectrum
were done.
Figure 1: SEM- EDAX of Fly ash particle
Table 2: Mixture composition of geopolymer activator
Sample
ID
Na2O
content in
activator
(%) of fly
ash
SiO2
content
in activator
(%) of fly
ash
Temperature
imposed on
Sodium
Hydroxide
and water
solution for
24 Hrs.
Water / fly
ash ratio
Curing temp.
and duration
PS15 8 8 150C 0.33 85
0C and 48 hrs
PS30 8 8 300C 0.33 85
0C and 48 hrs
PS45 8 8 450C 0.33 85
0C and 48 hrs
PS60 8 8 600C 0.33 85
0C and 48 hrs
PS75 8 8 750C 0.33 85
0C and 48 hrs
PS90 8 8 900C 0.33 85
0C and 48 hrs
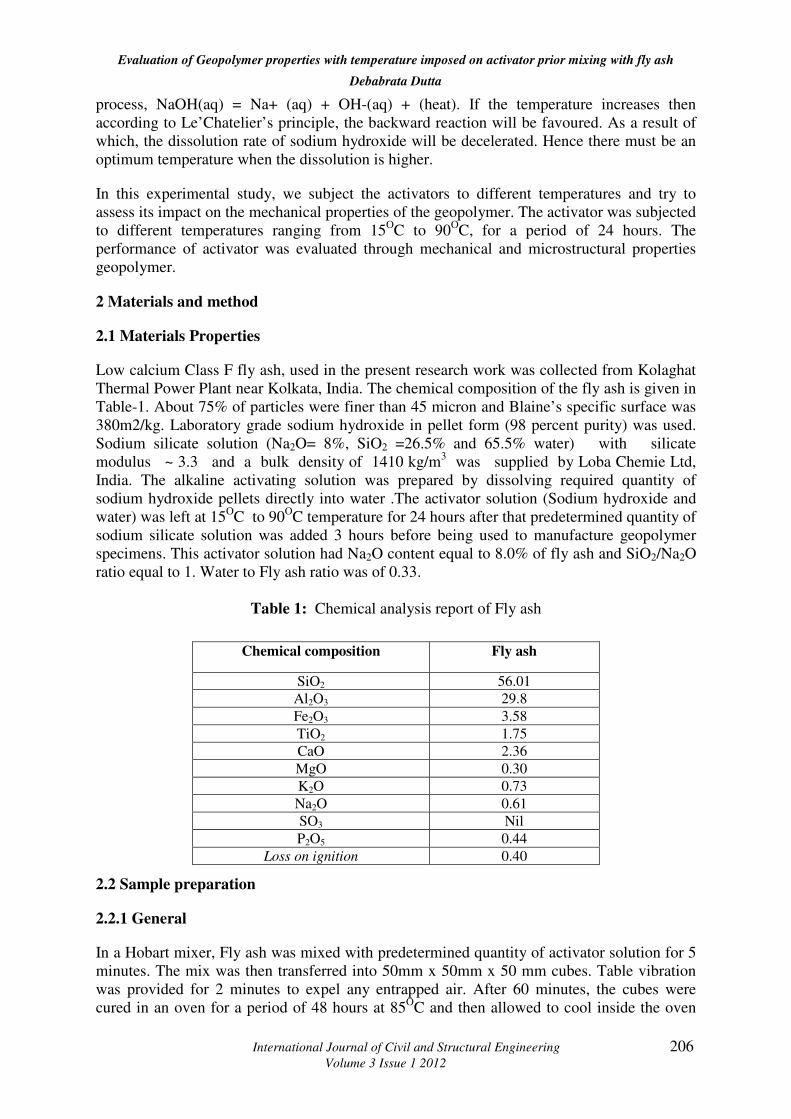
2.2.2 Workability
To investigate the flow characteristics of the geopolymer paste, the workability has been
predicted by the tests conducted on the geopolymer pastes, by a typical experimental set-up.
To measure the workability a polar graph has been used in which there are 50 concentric
circles and 40 spokes dividing the area into smaller parts to measure the areal change of the
slump of the geopolymer paste .A cylindrical container and a circular glass slab (as shown in
the figure 2- figure 5) has been used. The flow behavior of the geopolymer paste is quite
different from the flow behavior of cement concrete. The increase or decrease in the
workability indicates the change in polycondensation which effect on strength directly.
2.3 Typical procedure
In this experiment, the workability of a particular geopolymer sample paste has been
determined by careful observation and study of the extent of spread of that particular
Evaluation of Geopolymer properties with temperature imposed on activator prior mixing with fly ash
Debabrata Dutta
International Journal of Civil and Structural Engineering 208
Volume 3 Issue 1 2012
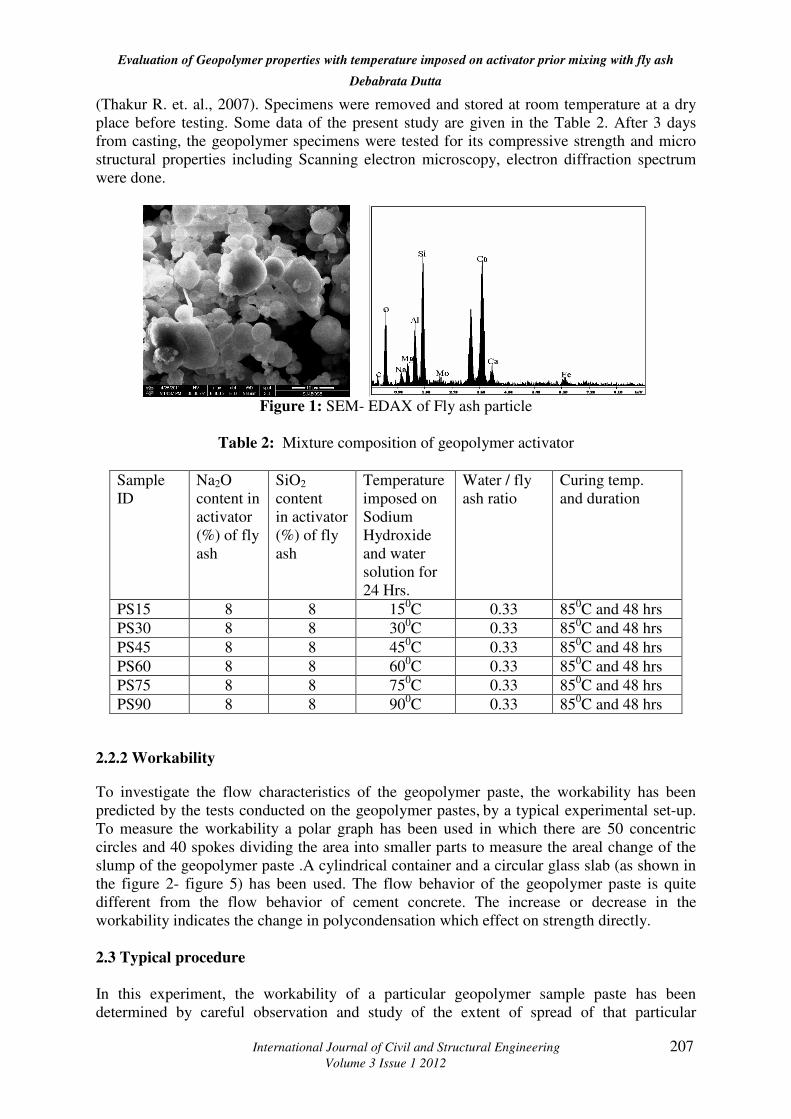
geopolymer paste. In the experimental set-up we used a 7mm thick circular glass slab of
50cm diameter. A polar graph was used to study the extent of the spread. The polar graph
consists of 50 concentric circles, equally spaced; with the outermost circle having a diameter
of 50cm.Each circle was again divided into a number of sectors by 40 numbers of spokes (i.e,
radial lines).This polar graph was placed below the glass slab. A bronze cylinder, 6cm in
diameter and 8cm in height, was used as a mould to hold the geopolymer paste. The mould
was placed exactly at the center of the setup, ensuring that its center coincides with the center
of the glass slab and that of the polar graph. After filling the mould with geopolymer paste it
was raised slowly, ensuring that it was raised vertically, and thus allowing the paste to flow.
After the flow had stopped, the readings corresponding to the outermost periphery of the flow
was taken. It was very simple as nth
circle has n cm diameter .With the knowledge of the radii
of all the concentric circles; the area of spread was calculated. Similar procedure was carried
out for all the samples and the calculations were made to get an idea of the workability of the
different geopolymer sample pastes.
2.4 Area factor
We have assessed the changes of workability corresponding to activators by a factor denoted
as AREA FACTOR which is defined by the ratio of the final area of the slump to the area of
the cylinder. The more the area factor increases indicates that the workability increases.
Figure 2: The experimental setup Figure 3: Flow pattern of geopolymer paste
1. Cylindrical brass container.
2. Polar graph.
3. Circular glass slab.
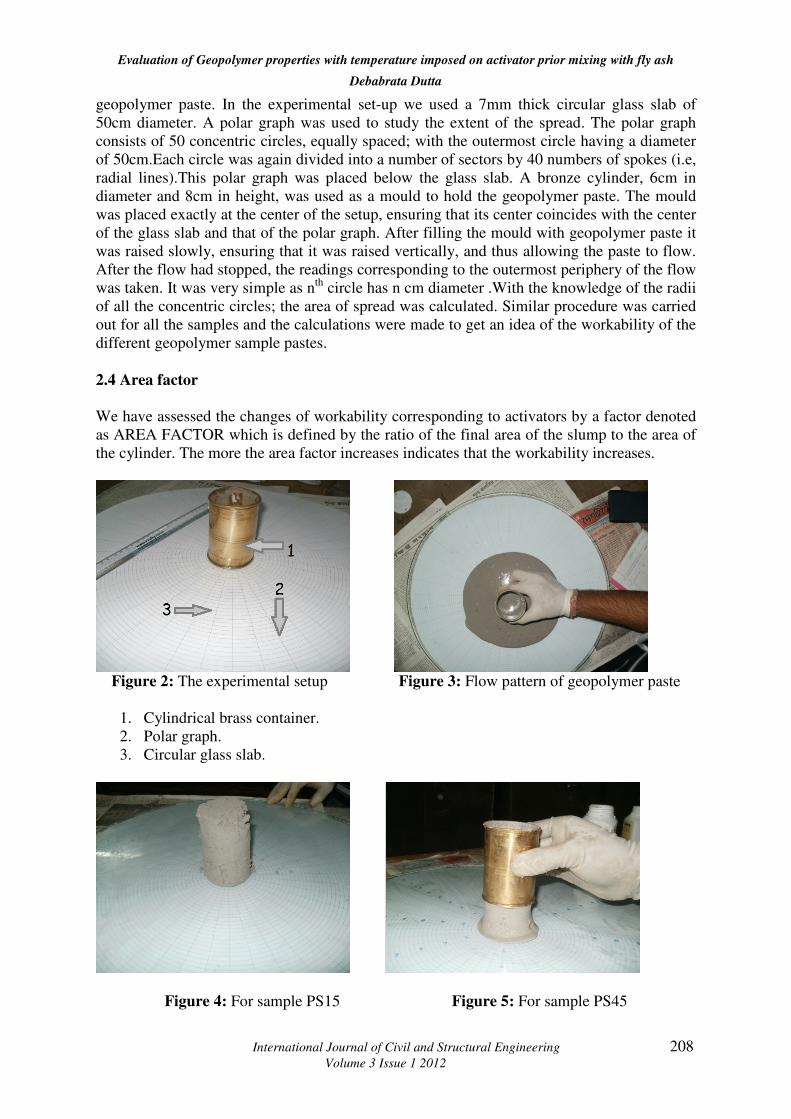
Figure 4: For sample PS15 Figure 5: For sample PS45

Evaluation of Geopolymer properties with temperature imposed on activator prior mixing with fly ash
Debabrata Dutta
International Journal of Civil and Structural Engineering 209
Volume 3 Issue 1 2012
3. Results and discussion
3.1 Workability
Dissolution of fly ash is accelerated, with OH-concentration (Zuhua Z. et. al., 2009).
Formation of Si–O–Al–O skeleton is proceeded with the compensation of charge loading on
Al atoms. These loadings are compensated by Na+ ions (františek škvára et. al. 2006) Hence
it is obvious that optimum polymerization is not possible without presence of sufficient Na+
and OH- in solving medium. The presence of Na
+ and OH
- in activator depends on dissolution
of Sodium Hydroxide which is affected by temperature imposed on it. Maximum area factor
is obtained for sample PS45 which implies maximum dissolution and polymerization .In
both the cases of PS15 and PS90 while activator were subjected to 150C and 90
0C
respectively, very low area factor were obtained.
Table 3: Results of workability test of the geopolymer paste
3.2 Microstructural investigations
SEM analysis was performed in order to view the reacted and unreacted regions of the
samples. SEM analysis covers a much smaller area in compare to MIP. Because at least 25
mm2 of sampling area is needed to obtain a reliable result (J. Van Brakel, 1981). Figures 6
represents the ESEM micrographs for geopolymer paste specimens PS15, PS45, PS60, PS75
and PS90 along with their EDAX traces. It depicts a microstructure having more unreacted
particles embedded in the geopolymer gel in case of PS15 and PS90.
The micrographs reveal mostly an amorphous phase in case of PS45 and PS60 with pores of
various sizes. In PS15 and PS90 unreacted crystalline component is clearly visible this may
be Sodium Hydroxide.
EDAX spectra of specimens show major elements such as oxygen (O), aluminum (Al),
silicone (Si), and sodium (Na). The weight percentages of some important elements
according to EDAX quantification of PS15 and PS 90 subjected to a specified position were
O (40.18%), Na (11.39%) and O (31.12%), Na (18.16%) respectively. However, the weight
percentage of important elements in case of PS45 shows O (41.53%), Si (15.25%), Al
(14.22%), Na (9.10%) and Ca (.35). For PS60 specimen EDAX analysis yielded the
following O (39.12%), Si (16.81%), Al (9.23%) , and Ca (4.49).
SAMPLE ID
INITIAL
DIAMETER(D1)
(cm)
FINAL
EQUIVALENT
DIAMETER(D2
)
(cm)
INTIAL
AREA
(A1)
(cm2)
FINAL
AREA
AFTER
FLOW(A2
)
(cm2)
AREA
FACTOR=A2/A
1
PS15 6 6 28.26 28.26 1.0
PS30 6 20 28.26 314 11.11111
PS45 6 26 28.26 530.66 18.77778
PS60 6 18 28.26 254.34 9
PS75 6 9 28.26 63.585 2.25
PS90 6 6 28.26 28.26 1.0

Evaluation of Geopolymer properties with temperature imposed on activator prior mixing with fly ash
Debabrata Dutta
International Journal of Civil and Structural Engineering 210
Volume 3 Issue 1 2012
SEM Image of Sample PS15 EDAX of Sample PS15
SEM Image of Sample PS45 EDAX of Sample PS45
SEM Image of Sample PS60 EDAX of Sample PS60

Evaluation of Geopolymer properties with temperature imposed on activator prior mixing with fly ash
Debabrata Dutta
International Journal of Civil and Structural Engineering 211
Volume 3 Issue 1 2012
SEM Image of Sample PS75 EDAX of Sample PS75
SEM Image of Sample PS90 EDAX of Sample PS90
Figure 6: SEM –EDAX analysis of different geopolymer specimens
3.3 Compressive strength
As fracture behavior of the samples was often unpredictable as few areas were chip of prior
to ultimate facture, successful samples were defined only when there was a single break of
the materials (Kriven, W. M. et. al. 2008). The compressive strength of the geopolymer paste
was determined after 28 days respectively from manufacture. Ten specimens for each series
were crushed in a digital compression testing machine and the average is reported.
Compressive strength obtained for the specimens are presented in Figure 7.
Sample PS45 gave maximum compressive strength of 47 Mpa .Further increment and
decrement of temperature in which activator was subjected prior mixing influence
compressive strength largely. Lowest compressive strength was achieved for sample PS15 as
14 MPa. For sample PS90 the compressive strength was measured as 18 Mpa.

Evaluation of Geopolymer properties with temperature imposed on activator prior mixing with fly ash
Debabrata Dutta
International Journal of Civil and Structural Engineering 212
Volume 3 Issue 1 2012
Figure 7: Compressive strength of different Geopolymer sample
4. Conclusion
Based on the present investigation, it may be concluded as;
� The compressive strength is higher for specimens PS45 while activator had been
subjected to a temperature of 450C before mixing.
� Temperature in which activator was subjected prior mixing effects compressive
strength significantly.
� The compressive strength was very low for specimens PS15 and PS90 while activator
had been subjected to a temperature of 150C and 90
0Crespectively before mixing.
� Surface texture shows better reaction for PS45and PS60 under ESEM micrographs.
� EDAX spectrum supports the presence of unreacted sodium hydroxide in sample
PS15 and PS90.
� Workability of paste in green state is lowest for sample PS15 and PS90 implies less
dissolution of fly ash as well as poor polymerization.
5. References
1. Hermann E, Kunze C, Gatzweiler R, Kiebig G, Davitovits J, (1999), Solidification of
various radioactive residues by geopolymere with special emphasis on long term
stability, In Proceedings of Geopolymers, pp 211.
2. J. Temuujin, R.P.Williams, A. van Riessen, (2009), Effect of mechanical activation of
fly ash on the properties of geopolymer cured at ambient temperature. Journal of
Materials Processing Technology. 209, pp 5276�5280.
3. Catherine A. Rees, John L Provis , Grant C. Lukey , Jannie S.J. van Devente, (2008),
The mechanism of geopolymer gel formation investigated through seeded nucleation,
Colloids and Surfaces A: Physicochemical and Engineering Aspects. 318, pp 97–105

Evaluation of Geopolymer properties with temperature imposed on activator prior mixing with fly ash
Debabrata Dutta
International Journal of Civil and Structural Engineering 213
Volume 3 Issue 1 2012
4. W.K.W. Lee, J.S.J. van Deventer, (2002), Structural reorganisation of class F fly ash
in alkaline silicate solutions. Colloids and Surfaces A: Physicochemical engineering
Aspects, 211(1), pp 49-66.
5. Le Chatelier's principle, Wikipedia-the free encyclopedia, available at
http://en.wikipedia.org/ wiki/Le_Chatelier%27s_principle, accessed on January 2012.
6. Thakur, R., Ghosh, S., (2007), Fly ash based geopolymer composites, Proceedings of
10th NCB International seminar on cement and building materials, New Delhi, India 3,
pp 442-451.
7. Zuhua Z, Xiao Y, Huajun Z, Yue C., )2009_, Role of water in the synthesis of
calcined kaolin-based geopolymer, Applied Clay Science, 43 (2), pp. 218–223.
8. františek škvára, lubomír kopecký, jiøí nìmeèek, zdenìk bittnar’, (2006),
Microstructure of geopolymer materials based on fly ash, Ceramics-Silikáty, 50(4), pp
208-215.
9. J. Van Brakel, (1981), A special Issue Devoted to Mercury Porosimetry, Powder Tech,
29(1), pp 1-209.
10. Kriven, W. M. and Bell, J. L. (2008), Effect of Alkali Choice on Geopolymer
Properties, in 28th International Conference on Advanced Ceramics and Composites
B: Ceramic Engineering and Science Proceedings, 25 (4), (EDITED by- E. Lara-
Curzio and M. J. Readey), John Wiley & Sons, Inc., Hoboken, NJ, USA


