
EVALUATION OF DRUG-INDUCED LIVER INJURY USING
AN IN VITRO OXIDATIVE STRESS INFLAMMATION SYSTEM
by
Abdullah Al Maruf
A thesis submitted in conformity with the requirements for the Degree of Doctor of Philosophy
Graduate Department of Pharmacology and Toxicology University of Toronto
© Copyright by Abdullah Al Maruf 2014
ii
ABSTRACT
EVALUATION OF DRUG-INDUCED LIVER INJURY USING AN IN VITRO
OXIDATIVE STRESS INFLAMMATION SYSTEM
Abdullah Al Maruf
Doctor of Philosophy, 2014
Department of Pharmacology and Toxicology
University of Toronto
Drug-induced liver injury (DILI) is a major concern in clinical studies as well as in post-
marketing surveillance of drugs. Previous evidence suggests that drug exposure during periods of
inflammation can increase an individual’s susceptibility to toxicity. Inflammation caused by
infections or endotoxins markedly activates NADPH (nicotinamide adenine dinucleotide
phosphate) oxidase that generates superoxide radicals by transferring electrons from NADPH. In
the phagosome, superoxide radicals spontaneously form hydrogen peroxide (H2O2) and other
reactive oxygen species (ROS). Neutrophils or Kupffer cells also release myeloperoxidase on
activation. The aim of this study was to develop and validate an in vitro oxidative stress
inflammation model to identify compounds that may increase hepatotoxicity during
inflammation. Toxic pathways were also investigated using the “Accelerated Cytotoxicity
Mechanism Screening” techniques. When a non-toxic H2O2 generating system (glucose/glucose
oxidase) with peroxidase or Iron(II) [Fe(II)] (to simulate in vivo inflammation) was added to
freshly isolated rat hepatocytes prior to the addition of the investigated drug, drug-induced
cytotoxicity and ROS formation were increased. This was reversed by 6-N-propyl-2-thiouracil (a
peroxidase inhibitor) or desferoxamine (an Fe(II) chelator), respectively. Flutamide, nilutamide,

iii
nimesulide, methotrexate, and 6-mercaptopurine were found to form pro-oxidant radicals leading
to oxidative stress and mitochondrial injury whereas azathioprine did not form any radicals with
this inflammation system. Electron spin resonance (ESR) spectrometry spin trapping studies of
6-mercaptopurine metabolism by HRP (horseradish peroxidase)/H2O2 was also investigated.
Two radicals were trapped using DMPO (5,5-dimethyl-1-pyrroline-N-oxide) which were
previously reported as purine-6-thiyl and superoxide radicals. This oxidative stress inflammation
system mimics the respiratory burst (release of H2O2) and release of myeloperoxidase by
neutrophils or other immune cells (using horseradish peroxidase) or mimics the Fenton reaction,
which could occur in vivo as immune cells also release Fe(II) during inflammation. TEMPOL (4-
hydroxy-2,2,6,6-tetramethylpiperidin-1-oxyl), a known ROS scavenger and a superoxide
dismutase mimetic, and several antioxidants, including DPPD (N,N'-diphenyl-p-
phenylenediamine), mesna (2-mercaptoethanesulfonate), Trolox (6-hydroxy-2,5,7,8-
tetramethylchroman-2-carboxylic acid), and resveratrol (3,5,4'-trihydroxy-trans-stilbene) were
also tested to determine their effect on drug-induced oxidative stress with or without the
inflammation system. This system may provide a more robust in vitro pre-clinical tool for
screening of drugs for potential hepatotoxicity associated with inflammation.
iv
ACKNOWLEDGEMENTS
All praise and glory are due to Allah for all bounties granted to me and with Allah’s guidance
and help this achievement became possible.
I would like to dedicate this work to my parents for their love and encouragement.
Although living thousands of miles away in Bangladesh, they kept me going in times of stress
and frustration. I hope that I can continue to make them proud.
During my Ph.D. studies, I was fortunate to work with Dr. Peter O’Brien for his
supervision, advice, patience, and friendship, which made these past years an incredible learning
experience both in science and in life. Dr. O’Brien is a passionate researcher and his enthusiasm
for science is infectious. I appreciate his positivity towards everything and his friendly smile.
Without his continuous support, I would not have been able to complete this research project in
time, nor would I have become the scientist I am today. I am also thankful to Cindy O’Brien for
helping me editing the thesis.
I am grateful to my supervisory committee members, Dr. Denis Grant and Dr. Peter
McPherson. I thank Dr. Grant for correcting my thesis patiently and giving me valuable
suggestions about the research project during my PhD program. I consider Dr. McPherson as my
first point of contact in Canada. I will just say whatever I have achieved in the last three years in
Canada, his guidance and suggestions made it possible.
I am thankful to Dr. Michael Rauth and Dr. Jason Matthews for their participation in my
thesis defense committee and their helpful suggestions about the thesis. I would also like to
acknowledge my external appraiser Dr. Neelam Khaper for being a part of my thesis
examination committee.

v
My academic experience would not be the same without Diana Clark; her professional
assistance and friendship. She also deserves my thanks. I am grateful to Dr. Arno Siraki
(Assistant Professor, Faculty of Pharmacy and Pharmaceutical Sciences, University of Alberta)
and his lab members for helping us out with ESR experiments. I am also grateful to Jalal
Pourahmad (Professor, Faculty of Pharmacy, Shaheed Beheshti University of Medical Sciences)
and his lab members for additional experiments on methotrexate.
My experiences in the O’Brien lab were enjoyable due to the presence of friendly
colleagues. I would like to thank Dr. Stephanie MacAllister, Luke Wan, HoYin Lip, and Kai
Yang for their friendship over the years. Each of them contributed to my research project in
some way and I thank you all.

vi
TABLE OF CONTENTS
Topics Page No.
Abstract ii
Acknowledgements iv
List of tables xi
List of figures xii
List of abbreviations xv
CHAPTER 1: INTRODUCTION
1.1 Drug induced liver injury 1
1.2 DILI and oxidative stress 4
1.2.1 Biochemistry of ROS 5
1.2.2 Sources of ROS 7
1.2.2.1 Exogenous sources 8
1.2.2.2 Endogenous sources 8
1.2.3 ROS detoxification 14
1.2.4 Detrimental effects of ROS 17
1.3 Drug-induced hepatotoxicity and inflammation: research rationale 19
1.4 Intrinsic versus idiosyncratic drug-induced hepatotoxicity-two villains or one? 24
1.5 Models to study DILI 25
1.6 In vitro cytotoxicity assessment 27
1.7 Isolated hepatocytes in studying DILI 27

vii
1.8 Accelerated cytotoxicity mechanism screening techniques 28
1.9 In vitro hepatocyte oxidative stress inflammation model 30
1.10 Literature review of the drugs investigated 33
1.10.1 Nitroaromatics [nimesulide (NIM), nilutamide (NIL), flutamide
(FLU)]
33
1.10.2 Methotrexate (MTX) 41
1.10.3 Thiopurines [azathioprine (AZA), 6-mercaptopurine (6-MP)] 44
1.11 Aims of the study and hypothesis 48
1.12 Summary of introduction
50
CHAPTER 2: MATERIALS AND METHODS
2.1 Chemicals 51
2.2 Animal treatment 52
2.3 Hepatocytes preparation and treatment 52
2.4 Oxidative stress inflammation model 57
2.5 Cell viability 58
2.6 ROS formation assay 58
2.7 Lipid peroxidation measurement 60
2.8 Endogenous H2O2 measurement 61
2.9 GSH (glutathione) and GSSG (glutathione disulfide) determination 61
2.10 Mitochondrial membrane potential (MMP) assay 62
2.11 Cellular ATP determination 63
2.12 Electron resonance spectroscopy (ESR) spin trapping study 63
viii
2.13 Statistical analysis 64
CHAPTER 3: RESULTS
3.1 Nitroaromatics (flutamide, nilutamide, nimesulide) 65
3.1.1 ACMS LC50 determination 65
3.1.2 Effects of non-toxic H2O2 and peroxidase on nitroaromatic drugs 65
3.1.3 Effects of non-toxic H2O2 and peroxidase or Fe(II) on FLU-induced
cytotoxicity
67
3.1.4 Protection against FLU-induced cytotoxicity in rat hepatocytes 69
3.2 Methotrexate 72
3.2.1 MTX-induced cytotoxicity 72
3.2.2 Involvement of GSH in MTX-induced cytotoxicity 73
3.2.3 Involvement of catalase in MTX-induced cytotoxicity 77
3.2.4 Cytochrome P450 and xanthine oxidase inhibition 78
3.2.5 Involvement of aldehyde oxidase in MTX-induced cytotoxicity 79
3.2.6 MTX-induced lipid peroxidation and mitochondrial toxicity 79
3.2.7 Effects of non-toxic H2O2 and peroxidase or Fe(II) on MTX-induced
cytotoxicity
80
3.2.8 Protection against MTX-induced cytotoxicity using ROS scavengers
and antioxidants
82
3.3 Thiopurines (azathiopurine, 6-mercaptopurine) 84
3.3.1 Azathioprine 84
3.3.1.1 AZA-induced cytotoxicity 84
ix
3.3.1.2 Functions of GSH and xanthine oxidase in AZA-induced
hepatotoxicity
85
3.3.1.3 Effects of aldehyde oxidase and cytochrome P450 inhibition
on AZA-induced cytotoxicity
85
3.3.1.4 Protection against AZA-induced cytotoxicity using ROS
scavengers and antioxidants
89
3.3.2 6-Mercaptopurine 91
3.3.2.1 6-MP-induced cytotoxicity 91
3.3.2.2 Effects of non-toxic H2O2 and peroxidase on 6-MP-induced
cytotoxicity
91
3.3.2.3 Protection against 6-MP-induced cytotoxicity in rat
hepatocytes
92
3.3.3.4 Electron spin resonance spectrometry spin trapping 94
CHAPTER 4: DISCUSSION
4.1 Nitroaromatics (flutamide, nilutamide, nimesulide) 98
4.2 Methotrexate 105
4.3 Thiopurines (azathioprine, 6-mercaptopurine) 112
4.4 Significance and rationale of the research 120
4.5 Limitations 121

x
CHAPTER 5: CONCLUSIONS AND FUTURE DIRECTIONS
5.1 Conclusions 123
5.1.1 Nitroaromatics (nimesulide, nilutamide, flutamide) 123
5.1.2 Methotrexate 124
5.1.3 Thiopurines (azathioprine, 6-mercaptopurine) 125
5.1.4 Hypothesis revisited 126
5.2 Future directions 127
REFERENCES 129
LIST OF PUBLICATIONS AND ABSTRACTS 149
COPYRIGHT ACKNOWLEDGEMENTS 151

xi
LIST OF TABLES
Titles Page No.
CHAPTER 1: INTRODUCTION
1.1 List of drugs that were withdrawn from the market or carry a black box
warning due to idiosyncratic DILI (IDILI)
3
1.2 Potential exogenous and endogenous sources of ROS 7
1.3 List of drugs previously investigated in this lab with positive and negative
results with the inflammation system
32
CHAPTER 3: RESULTS
3.1 Nitroaromatic-induced cytotoxicity and oxidative stress in a hepatocyte
oxidative inflammation model
66
3.2 Protection against FLU-induced cytotoxicity using an oxidative stress
inflammation system in isolated rat hepatocytes
71
3.3 MTX-induced ROS formation and % MMP in isolated rat hepatocytes with
various enzyme modulators
75
3.4 Protection against MTX-induced cytotoxicity and oxidative stress in isolated
rat hepatocytes with various antioxidants, radical scavengers and an ATP
generator
83
3.5 AZA-induced oxidative stress with GSH depletion and protection with a GSH
precursor, a xanthine oxidase inhibitor, various antioxidants, and a radical
87

xii
scavenger
3.6 Effects of a ROS scavenger and various antioxidants on AZA-induced
cytotoxicity in isolated rat hepatocytes
90
3.7 Protection against 6-MP-induced cytotoxicity in rat hepatocytes 92
LIST OF FIGURES
Titles Page No.
CHAPTER 1: INTRODUCTION
1.1 ROS production during mitochondrial electron transport chain 10
1.2 Respiratory burst initiated by NADPH oxidase 12
1.3 Detoxification reactions of ROS 16
1.4 Augmentation of toxic responses by bacterial endotoxin lipopolysaccharide
(LPS)
21
1.5 The inflammagen hypothesis 23
1.6 Proposed amine activation of reduced NIM by neutrophils and
myeloperoxidase
35
1.7 Structure of NIL and its proposed metabolites 37
1.8 Structure of FLU and its metabolites 40
1.9 A proposed metabolic pathway of MTX 43
1.10 Chemical structures of azathioprine, 6-mercaptopurine, and 6-thioguanine 45
1.11 The pathways of AZA metabolism 46

xiii
1.12 Simplified schematic representation of the hypotheses and aims the study. 49
CHAPTER 2: MATERIALS AND METHODS
2.1 Isolation of hepatocytes and assays used 55
2.2 Depletion of GSH with 1-bromoheptane 56
2.3 Measurement of ROS generation using 2',7'-dichlorofluorescein diacetate 59
2.4 Formations of MDA-TBA adduct 60
2.5 GSH recycling mechanism 62
CHAPTER 3: RESULTS
3.1 Effects of non-toxic H2O2 and peroxidase or the Fe(II)-mediated Fenton
model on FLU-induced cytotoxicity
68
3.2 Effects of FLU on GSH and GSSH levels 70
3.3 Concentration-response curve of MTX towards isolated rat hepatocytes 72
3.4 Involvement of GSH, catalase and aldehyde oxidase on MTX-induced
cytotoxicity in isolated rat hepatocytes
74
3.4 MTX-induced GSH depletion (measured at 30 min) 72
3.6 MTX-induced H2O2 generation (measured at 30 min.) 78
3.7 MTX-induced ATP depletion (measured at 30 min) 80
3.8 Effects of non-toxic H2O2 and peroxidase or Fe(II)-mediated Fenton model on
MTX-induced cytotoxicity
81
3.9 Concentration-response curve of AZA towards isolated rat hepatocytes 84
3.10 GSH and xanthine oxidase dependence of AZA towards rat hepatocytes 86

xiv
3.11 Effects of AZA on GSH and GSSH levels (measured at 30 min) 88
3.12 Effects of 6-MP on GSH and GSSH levels (measured at 30 min) 93
3.13 ESR spectrometry spin trapping studies of 6-MP metabolism by HRP/H2O2 95
CHAPTER 4: DISCUSSION
4.1 Proposed pathways of MTX-induced cytotoxicity in isolated rat hepatocytes 111
4.2 Proposed routes of AZA-induced cytotoxicity in isolated rat hepatocytes 116
4.3 Possible routes of 6-MP-induced cytotoxicity in isolated rat hepatocytes 119

xv
LIST OF ABBREVIATIONS
ABT 1-Aminobenzotriazole
ACMS Accelerated cytotoxic mechanism screening
ADP Adenosine diphosphate
ADR Adverse drug reaction
AGE Advanced glycation end products
ALE Advanced lipoxidation end products
ALT Alanine aminotransferase
ANOVA Analysis of variance
APC Antigen-presenting cells
AST Aspartate aminotransferase
3-AT 3-Amino-1,2,4-triazole
ATP Adenosine triphosphate
AZA Azathioprine
Bax Bcl2-associated X protein
Bcl2 B-cell lymphoma 2 protein
t-BHP tert-Butyl hydroperoxide
BMPO 5-tert-butoxycarbonyl 5-methyl-1-pyrroline N-oxide
BNPP bis-p-Nitrophenyl phosphate
BSA Bovine serum albumin
CCAC Canadian Council on Animal Care
xvi
CNS Central nervous system
COMT Catechol-O-methyl transferase
COX-2 Cycloxygenase-2
Cu-ZnSOD Copper/zinc superoxide dismutase
CYP Cytochrome P450 enzyme
Cys Cysteine
Cyss Cysteine disulfide
DAMPA 2,4-diamino-N-methylpteroic acid
DCF 2’,7’-Dichlorofluorescein
DCFD 2’,7’-Dichlorofluorescein diacetate
DFHR Dihydrofolate reductase
DILI Drug-induced liver injury
DMARD Disease-modifying anti-rheumatic drugs
DME Drug metabolizing enzyme
DMPO 5,5-dimethyl-1-pyrroline-N-oxide
DMSO Dimethylsulfoxide
DNA Deoxyribonucleic acid
DNFB 2′,4′-Dinitrofluorobenzene
DPPD N,N'-Diphenyl-p-phenylenediamine
DTNB 5,5′-Dithiobis-(2-nitrobenzoic acid) (Ellman’s reagent)
DTPA Diethylenetriaminopentaacetic acid
EC-SOD Extracellular superoxide dismutase
ELISA Enzyme-linked immunosorbent assay

xvii
EPR Electron paramagnetic resonance
ESR Electron spin resonance
ER Endoplasmic reticulum
ETC Electron transport chain
FAD Flavin adenine dinucleotide
FADH2 Reduced flavin adenine dinucleotide
FDA U.S. Food and Drug Administration
Fe Iron
Fe(II) Ferrous iron
Fe(III) Ferric iron
FI Fluorescence intensity
FLU Flutamide
FLU-1 4-Nitro-3(trifluoromethyl)phenylamine
FMN Flavin mononucleotide
fmlp f-Methionyl-leucyl-phenylalanine
FOX1 Ferrous oxidation in xylenol orange
G Glucose
GGT Gamma-glutamyl transpeptidase
GI Gastrointestinal tract
GO Glucose oxidase
Gp91PHOX Glycosylated NADPH oxidase subunit
GPx Glutathione peroxidase
GR Glutathione reductase

xviii
GSH Reduced glutathione
GSSG Glutathione disulfide
GST Glutathione S-transferase
GSTNB The mixed disulfide between GSH and TNB
H2O2 Hydrogen peroxide
HEPES 4-(2-Hydroxyethyl)-1-piperazineethanesulfonic acid
HGPRT Hypoxanthine-guanine-phosphoribosyltransferase
HIV Human immunodeficiency virus
HLM Human liver microsome
HO2• Hydroperoxyl radical
HOCl Hypochlorous acid
HPC Hepatic parenchymal cells
HPLC High pressure liquid chromatography
HRP Horseradish peroxidase
HQ 8-Hydroxyquinoline
IBD Inflammatory bowel disease
IDILI Idiosyncratic drug-induced liver injury
IDRs Idiosyncratic drug reactions
IL Interleukin
LC50 Lethal concentration 50%
LDH Lactate dehydrogenase
LPS Lipopolysaccharide
MDA Malondialdehyde
xix
Mesna 2-Mercaptoethanesulfonate
MMP Mitochondrial membrane potential
6-MMP 6-Methyl mercaptopurine
6-MP 6-Mercaptopurine
Mn-SOD Manganese superoxide dismutase
MPO Myeloperoxidase
MPT Mitochondrial permeability transition
MPTP 1-Methyl-4-phenyl-1,2,3,6-tetrahydropyridine
MTX Methotrexate
MTX-PGns Methotrexate polyglutamates
n Number of observations
NAC N-Acetylcysteine
NAD Oxidized nicotinamide adenine dinucleotide
NADH Reduced nicotinamide adenine dinucleotide
NAD(P)H or NADPH Reduced nicotinamide adenine dinucleotide phosphate
NIL Nilutamide
NIM Nimesulide
NO Nitric oxide
NO• Nitric oxide radical
NO2 Nitrogen dioxide
N2O3 Dinitrogen trioxide
NOS Nitric oxide synthase
Nox2 NADPH oxidase

xx
NSAIDs Nonsteroidal anti-inflammatory drugs
O2•− Superoxide anion
•OH Hydroxyl radical
ONOO− Peroxynitrite
ONOOCO2− Nitrosoperoxycarbonate
p Probability, represents statistical significance
PMNs Polymorphonuclear leukocytes
PS• purine-6-thiyl radical
PTU 6-N-propyl-thiouracil
PUFA Polyunsaturated fatty acids
PUFA• Lipid radical
PUFAOO• Lipid peroxy radical
QH2 Ubiquinol
R• Reactive free radical
RCS Reactive carbonyl species
RNS Reactive Nitrogen Species
ROS Reactive oxygen species
RNA Ribonucleic acid
Se Selenium
S.E.M. Standard error of the mean
SOD Superoxide dismutase
TBA Thiobarbituric acid
TBARS Thiobarbituric acid reactive substances

xxi
TCA Trichloroacetic acid
TEMPOL 4-Hydroxy-2,2,6,6-tetramethylpiperidene-1-oxyl
TNB 5-Thio-2-nitrobenzoic acid
6-TG 6-Thioguanine
TPMT Thiopurine S-methyltransferase
TNB 2-Nitro-5-thiobenzoic acid
TNF-α Tumor necrosis factor – alpha
Trolox (±)-6-hydroxy-2,5,7,8-tetramethylchromamane-2-carboxylic acid
Trx-(SH)2 Thioredoxin
Trx-SS Thioredoxin disulfide
UQ•– Ubisemiquinone anion radical
UV Ultraviolet
XDH Xanthine dehydrogenase
XO Xanthine oxidase
XOR Xanthine oxidoreductase
ΔΨ Membrane potential
1
CHAPTER 1: INTRODUCTION
1.1 Drug induced liver injury
Drug-induced liver injury (DILI) is a major concern in pharmaceutical drug development, in
clinical studies, as well as in post-marketing surveillance of drugs (Ballet, 1997; Fung et al.,
2001). DILI has become a leading cause of severe liver disease in Western countries and
therefore poses a major clinical and regulatory challenge (Lee, 2003a,b; Ostapowicz et al.,
2002). Thirty to 50% of acute liver failures and 15% of liver transplantations were reported to be
due to chemical-induced hepatotoxicity (Andrade et al., 2004; Kaplowitz, 2001; Russo et al.,
2004; Tuschl et al., 2008). More than 1000 drugs have been implicated in causing liver disease.
It is the most common reason for a drug to be withdrawn from the market and frequently results
in a requirement for additional labeling (Temple and Himmel, 2002; Zimmerman, 1999).
Hepatotoxicity may lead to a wide variety of liver pathophysiologies e.g. steatosis,
cholestasis, fibrosis, hepatitis, necrosis or the formation of liver tumors (Ballet, 1997). The liver
is considered as the most important organ in drug toxicity as it is interposed between the sites of
absorption and the systemic circulation and it is also a major site of drug metabolism and
elimination; thereby rendering it as a preferred target for drug- or xenobiotic-induced toxicity.
Proposed pathophysiological mechanisms of most drug-induced hepatotoxicity are: inhibition of
mitochondrial function, disruption of intracellular calcium homeostasis, activation of apoptosis
and oxidative stress, inhibition of specific enzymes or transporters, and formation of reactive
metabolites that cause direct toxicity or immunogenic response, potentially leading to
idiosyncratic effects (Boelsterli, 2003a; 2003b; Tuschl et al., 2008).

2
DILI is broadly classified into intrinsic (Type-1) and idiosyncratic (Type-2) types;
intrinsic DILI generally is dose-dependent, has a predictable latent period after exposure, affects
all individuals at the same dose, and is predictable using routine animal testing (e.g.
acetaminophen toxicity), whereas idiosyncratic DILI (IDILI) does not depend directly on dose,
affects only susceptible individuals, has a variable onset (mostly delayed), and is not predictable
using routine animal tests relative to exposure (e.g. isoniazid) (Chalasani and Björnsson, 2010;
Roth and Ganey, 2010). IDILI occurs at therapeutic doses in 1 in 1000 to 1 in 100,000 patients,
with a pattern that is consistent for each drug and for each drug class (Lee, 2003a,b). IDILI is
responsible for about 13% of all cases of acute liver failure in North America (Temple and
Himmel, 2002). A list of drugs that were withdrawn from the market or were restricted in use
(carrying black box warnings) due to IDILI are presented in Table 1.1.

3
Table 1.1. List of drugs that were withdrawn from the market or carry a black box warning due
to IDILI [Reprinted from Idiosyncratic drug-induced liver injury: Mechanisms and susceptibility
factors, Volume 9.17, Boelsterli and Kashimshetty, In: Comprehensive Toxicology (Second
Edition), edited by C.A. McQueen, pp. 383–402 © 2010, with permission from Elsevier].
Drugs withdrawn from the market Drugs labeled with black box warnings
(hepatotoxicity) and therefore
restricted in use
Lumiracoxib (2007), NSAID
Ximelagatran (2006), anticoagulant
Nefazodone (2004), antidepressant
Troglitazone (2000), insulin sensitizer
Bromfenac (1998), NSAID
Iproniazid (1997), antidepressant
Benoxaprofen (1982), NSAID
Tienilic acid (1979), antihypertensive
Tolcapone, anti-Parkinson
Trovafloxacin, antibiotic
Leflunomide, DMARD
Nevirapine, anti-HIV
Nimesulide, NSAID
Felbamate, anticonvulsant
Pemoline, CNS disease
Valproic acid, antiepileptic
Penicillamine, antirheumatic
Stavudine, anti-HIV
Zileuton, antiasthmatic
Acitretin, skin diseases
Bosentan, pulmonary hypertension
Dacarbazine, anticancer
Dantrolene, muscle relaxant
Flutamide, antiandrogen
Gemtuzumab, myeloid leukemia
Isoniazid, antituberculosis
Ketoconazole, antifungal
Naltrexone, opioid antagonist
NSAID, non-steroidal anti-inflammatory drugs; DMARD, disease-modifying antirheumatic
drugs; CNS, Central nervous system; HIV, Human immunodeficiency virus
4
1.2 DILI and oxidative stress
Oxidative stress has been proposed as one of the main and common mechanisms of drug-induced
hepatotoxicity, cardiovascular toxicity, nephrotoxicity, retinopathy, neurotoxicity, ototoxicity,
and reproductive toxicity (reviewed in Deavall et al., 2012; Pereira et al., 2012). Drugs from
several classes of pharmaceutical agents have been reported to have adverse effects related to
oxidative stress e.g. anticancer drugs, antibiotics, antiretroviral drugs, anti-tubercular drugs,
analgesics including NSAIDs, and antipsychotics (Deavall et al., 2012). Oxidative stress is
defined as an increased generation of reactive oxygen species (ROS) and reactive nitrogen
species (RNS) that exceed cellular adaptive and repair capacities and cause damage to
biomolecules such as nucleic acids, proteins, and membrane phospholipids leading to cell death
(Chen et al., 2007). Thiol/disulfide couples such as glutathione (GSH/GSSG), cysteine
(Cys/CySS) and thioredoxin ((Trx-(SH)2/Trx-SS)) are functionally organized in redox circuits
controlled by glutathione pools, thioredoxins and other control nodes that vary little among
healthy individuals and are maintained in disequilibrium relative to each other. Although
classically oxidative stress is defined as an imbalance of pro-oxidants and antioxidants, under
this new concept of “Redox Hypothesis”, oxidative stress is defined as the disruption of these
redox circuits (Blokhina and Fagerstedt, 2010; Jones et al., 2010; Mannery et al., 2010; Pereira
et al., 2012).

5
1.2.1 Biochemistry of ROS
Oxygen is the most powerful oxidizing agent in aerobic organisms and readily reacts to form
partially reduced species, which are generally short lived and highly reactive. Oxygen free
radicals are products of many biological redox reactions. A free radical is a chemical species that
has one or more unpaired electrons. The reactivity of free radicals is a consequence of the
presence of unpaired electrons which renders them unstable. The reduction of oxygen by one
electron at a time produces relatively stable intermediates. Superoxide anion (O2•−) is the product
of one-electron reduction of oxygen (Equation I). It is the precursor of most ROS and a mediator
in oxidative chain reactions (Paravicini and Touyz, 2008). It cannot cross cell membranes due to
its charge and is very short lived (half-life is 10˗6 sec) (Giorgio et al., 2007; Yu, 1994).
O2 + e−→ O2•− (I)
Dismutation of O2•− catalyzed by superoxide dismutases (SOD) produces hydrogen
peroxide (H2O2). H2O2 is the non-radical ROS formed by several metabolic reactions. This
dismutation reaction can also produce an intermediate hydroperoxyl radical (HO2•) (Equation II,
III). H2O2 is less reactive, more stable and has a longer half-life (10˗5 sec) than other free radicals.
H2O2 can easily diffuse within and between cells in biological systems (Giorgio et al., 2007;
Paravicini and Touyz, 2008).
O2•− + H+ → HO2
• (II)
2HO2•→ H2O2 + O2 (III)

6
The hydroxyl radical (•OH) can be formed either from O2•− (Equation IV) (Haber-Weiss
reaction) or from H2O2:
O2•− + H2O2 → O2 + OH− + •OH (IV) (Haber-Weiss reaction)
Fe(II) + H2O2 → Fe(III) + OH− + •OH (V) (Fenton reaction)
The •OH is considered as one of the most potent oxidants in biological systems (Yu,
1994). Because of its high reactivity and short half-life (10˗9 sec), it reacts very close to its site of
formation and may cause oxidative damage by reacting with adjacent lipids, proteins or nucleic
acids. The majority of •OH produced in vivo comes from the transition metal e.g., iron (Fe)- or
copper (Cu)-catalyzed breakdown of H2O2. During oxidative stress or inflammation conditions,
as excess presence of O2•− may trigger the release of unbound Fe(II) from Fe-containing
molecules. The “free” Fe(II) may then catalyze the formation of •OH from H2O2 (Equation V)
(Fenton reaction). In biological systems, the Fe(II)-catalyzed Haber-Weiss reaction which makes
use of Fenton chemistry is considered to be the main mechanism by which •OH is generated
(Kehrer, 2000). Although other transition metal ions are capable of catalyzing this reaction, the
Fe-catalyzed Fenton reaction is now considered to be the major mechanism by which the •OH is
generated in biological systems (Liochev, 1999).
Dietary iron is essential to build the body’s oxygen carriers (blood haemoglobin and
muscle myoglobin) and important enzymes such as those within the electron transport chain e.g.
catalase, xanthine oxidase, and carriers such as cytochrome c. However, excess iron accumulates
in tissues and organs and disrupts their normal function through the process of oxidative stress
mediated-toxicity. The pro-oxidant effects of iron may be attributed to its ability to produce

7
ROS and thereby damaging proteins, lipids, sugars, and nucleic acids (Corpet et al., 2010;
Mehta, 2011).
Typical additional radicals formed in the biological systems from oxygen include the
peroxyl radicals (ROO•) and alkoxyl radicals (RO•). In addition to H2O2, some non-radical
species are also formed e.g. hypochlorous acid (HOCl), fatty acid hydroperoxides and reactive
aldehydes (Halliwell and Gutteridge, 1985). Moreover, O2•− is highly reactive with nitric oxide
(NO) that generates RNS such as peroxynitrite (ONOO˗) and further downstream nitrogen
species, including NO•, nitrosoperoxycarbonate (ONOOCO2−), nitrogen dioxide (NO2), and
dinitrogen trioxide (N2O3) via the activity of enzymes such as inducible nitric oxide synthase 2
and NADPH oxidase (Deavall et al., 2012; Turrens, 2003).
1.2.2 Sources of ROS
ROS are produced from both exogenous and endogenous sources. Potential sources are presented
in Table 1.2.
Table 1.2. Potential exogenous and endogenous sources of ROS.
Exogenous sources Endogenous sources
Environmental toxins
Drugs
Dietary toxins
Microbes
Metals
Ultraviolet (UV) light
Ionizing radiation
Inflammation
Mitochondria
Peroxisomes
Cytochrome P450
NADPH oxidase
Xanthine Oxidase
Aldehyde Oxidase

8
1.2.2.1 Exogenous sources
Exogenous sources include microbes, environmental carcinogens, dietary factors, various
xenobiotics, metal ions, UV light, and ionizing radiation (reviewed in Klaunig et al., 2011;
Valko et al., 2006). Drugs from several classes of pharmaceutical agents were reported to
generate ROS leading to oxidative stress. Quinone containing molecules can also undergo redox
cycling, generating large amounts of ROS without themselves being degraded (O'Brien, 1991).
A controlled inflammatory response is generally regarded as being safe, as it provides
protection against infection. However, an imbalance in response can be damaging. The
inflammatory response in general consists of four components: 1) The inflammatory inducers
(e.g. microbes, toxic compounds or their degradation products/metabolites); 2) The sensors that
detect and kill inducers by releasing ROS (e.g. macrophages); 3) The inflammatory mediators
induced by the sensors (e.g. cytokines-tumor necrosis factor-α (TNF-α), interleukin-1 (IL1) or
IL-6), and 4) The target tissues (e.g. liver) that are affected by the inflammatory mediators
(Medzhitov, 2008; 2010; Mehta, 2011). How inflammation is related to oxidative stress is
discussed later in section 1.3.
1.2.2.2 Endogenous sources
Endogenous sources of ROS include mitochondria, cytochrome P450 metabolism, peroxisomes,
NADPH oxidases, xanthine oxidases, and aldehyde oxidase (reviewed in Pérez-Matute et al.,
2009).
9
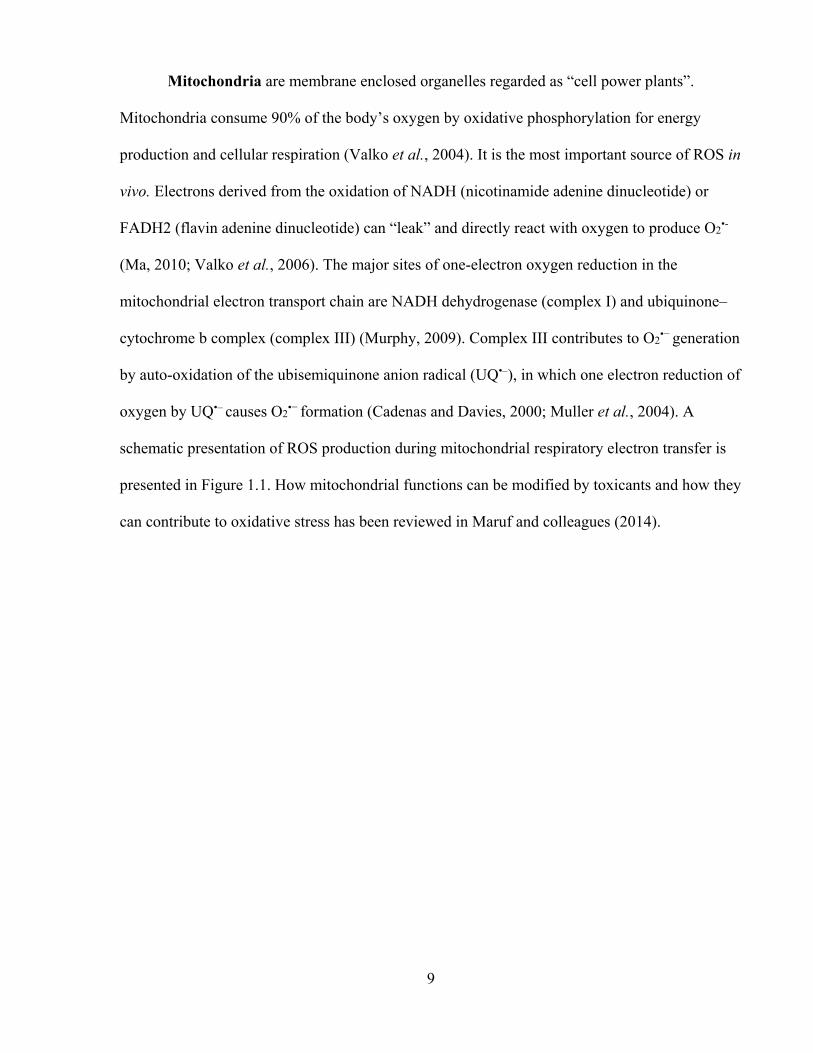
Mitochondria are membrane enclosed organelles regarded as “cell power plants”.
Mitochondria consume 90% of the body’s oxygen by oxidative phosphorylation for energy
production and cellular respiration (Valko et al., 2004). It is the most important source of ROS in
vivo. Electrons derived from the oxidation of NADH (nicotinamide adenine dinucleotide) or
FADH2 (flavin adenine dinucleotide) can “leak” and directly react with oxygen to produce O2•-
(Ma, 2010; Valko et al., 2006). The major sites of one-electron oxygen reduction in the
mitochondrial electron transport chain are NADH dehydrogenase (complex I) and ubiquinone–
cytochrome b complex (complex III) (Murphy, 2009). Complex III contributes to O2•− generation
by auto-oxidation of the ubisemiquinone anion radical (UQ•–), in which one electron reduction of
oxygen by UQ•– causes O2•− formation (Cadenas and Davies, 2000; Muller et al., 2004). A
schematic presentation of ROS production during mitochondrial respiratory electron transfer is
presented in Figure 1.1. How mitochondrial functions can be modified by toxicants and how they
can contribute to oxidative stress has been reviewed in Maruf and colleagues (2014).
10
Figure 1.1. ROS production during mitochondrial electron transport chain.
O2•−, superoxide anion; QH2, ubiquinol [Reprinted from Transcriptional responses to oxidative
stress: Pathological and toxicological implications, Ma, Pharmacol. Ther., 125(3):376–93 ©
2010, with permission from Elsevier].
Peroxisomes are membrane-bound respiratory organelles that are present in virtually all
eukaryotic cells and carry out a wide range of essential functions, including β-oxidation of fatty
acids (long-chain, branched-chain and polyunsaturated fatty acids, dicarboxylic acids),
biosynthesis of cholesterol, bile acids, and metabolism of ROS (Antonenkov et al., 2010; van
den Bosch et al., 1992). They contain more than 100 enzymes and play a key role in the
production and utilization of ROS (Antonenkov et al., 2010). Most of the H2O2 generated by
peroxisomal oxidases is generally detoxified within peroxisomes. However, H2O2 can diffuse out
of this cell organelle under conditions of peroxisome proliferation and peroxisomes can then
become a significant endogenous source of ROS (Fritz et al., 2007). Peroxisomes are also home

11
to many antioxidant enzymes, including catalase (described later), which provide protection
against ROS through detoxification at the site of ROS formation (Singh, 1996).
Cytochrome P450 (CYP) enzymes are another major source of ROS, especially in the
liver. These are present mainly in the endoplasmic reticulum (ER) of most mammalian cells as
components of a multi-enzyme monooxygenase system. Their main function is to detoxify
foreign compounds as well as endogenous substrates into polar, less toxic products by utilizing
oxygen to oxidize exogenous compounds. CYPs may produce ROS (O2•– and H2O2) by two
possible ways. The first possibility is the formation of ROS as intermediates in the CYP-
mediated catalytic cycle, where O2 is reduced instead of being added to the substrate. The second
possibility is that an electron can leak into oxygen molecules from flavins in the NADPH: P450
reductase enzyme (Jezek and Hlavata, 2005).
NADPH oxidases are membrane-bound enzyme complexes found in the membranes of
phagosomes and are used by neutrophils and white blood cells to engulf microorganisms.
Normally the complex, Gp91PHOX (contains heme) (encoded by gene Nox2), is latent in
neutrophils and is activated during the respiratory burst. They have been implicated as a major
source of ROS generation (Pérez-Matute et al., 2009). When a phagocytic cell is exposed to
invading foreign compounds, their degradation products or metabolites, the defense enzyme
undergoes a series of reactions called the “respiratory burst” that enables the cell to provide
oxidizing agents (ROS) to destroy such compounds (Ma, 2010; Valko et al., 2004; 2006). When
NADPH oxidase becomes activated, it retrieves cytoplasmic NADPH to reduce cytochrome
b558 which catalyzes the NADPH-dependent reduction of oxygen to O2•- within the plasma
membrane or on its outer surface (Figure 1.2). Another strong oxidant and antimicrobial agent,

12
HOCl can be formed from H2O2 catalyzed by myeloperoxidase (MPO) (Equation VI) (Hampton
et al., 1998).
2O2 + NADPH → 2O2•- + NADP+ + H+ (VI)
During the phagocytosis process intracellular ROS rapidly increase. The protein
p47PHOX is activated and integrates with the additional components p67PHOX and p40PHOX
into the phagosome membrane, where it combines with flavocytochorme b in the active NADPH
oxidase enzyme complex. This enzyme complex catalyzes the generation of ROS and protons,
which shift through proton-channels into the interior of the phagosome, where they destroy the
internalized particle (Figure 1.2) (Riechelmann et al., 2004).
Figure 1.2. Respiratory burst initiated by NADPH oxidase [Adapted from Riechelmann and
colleagues (2004), an open access article distributed under the Creative Commons Attribution
License].

13
Xanthine oxidase (XO) is a highly versatile enzyme that is widely distributed among
mammalian tissues and is well known to produce ROS (Kelley et al., 2010; Tapner et al., 2004;
Valko et al., 2006). The molybdoflavin enzyme xanthine oxidoreductase (XOR) catalyzes the
terminal two steps of purine degradation (from hypoxanthine to xanthine and from xanthine to
uric acid) in humans. XOR is transcribed as a single gene product, xanthine dehydrogenase
(XDH). Under inflammatory conditions, posttranslational modification by oxidation of critical
cysteine residues or limited proteolysis converts XDH to XO (Amaya et al., 1990; Kelley et al.,
2010). Substrate-derived electrons at the molybdenum (Mb) cofactor of xanthine oxidase reduce
O2 at the FAD (flavin adenine dinucleotide) cofactor both univalently, generating superoxide
(O2•−), and divalently, forming H2O2. However, conversion to xanthine oxidase is not required
for ROS production, as XDH displays partial oxidase activity under some conditions such as the
ischemic/hypoxic microenvironment encountered in vascular inflammation (Harris et al., 1997).
This same inflammatory milieu leads to enhanced xanthine oxidase levels and thus increased
xanthine oxidase-derived ROS formation resulting in activation of redox dependent cell
signaling reactions and alterations in vascular function (Kelley et al., 2010). Xanthine oxidase is
exemplified by numerous studies in which inhibition of xanthine oxidase attenuated symptoms of
several vascular diseases including congestive heart failure, sickle cell anemia, and diabetes
(Aslan et al., 2001; Butler et al., 2000; Desco et al., 2002; Farquharson et al., 2002).
Aldehyde oxidase has been reported to cause oxidation of NADH in the presence of O2
that produced large amounts of O2•−. Aldehyde oxidase has a broader specificity toward drugs
and xenobiotics, and although it catalyzes the oxidation of physiological substrates, the
significance of this is not yet clear (reviewed in Beedham, 2010). Aldehyde oxidase also
mobilizes iron from ferritin (Shaw and Jayatilleke, 1990) which can catalyze O2•− reduction to

14
form the highly reactive and more toxic hydroxyl radical (•OH) or the O2•− radical can directly
react with NO to produce the powerful oxidant, ONOO−. Thus aldehyde oxidase functions as an
important cellular source of ROS under normal physiological conditions. Under various
pathological conditions such as ischemia, alcohol-induced liver diseases and diabetes, this ROS
production would increase due to the increase in tissue NADH level thus contributing to
oxidative stress and free-radical-mediated tissue injury (Kundu et al., 2012).
1.2.3 ROS detoxification
Antioxidants, being exogenous or endogenous, are chemical agents that donate an electron to
free radical molecules which converts them to a harmless configuration that decreases damaging
radical chain reactions (Iannitti and Palmieri, 2009). Many natural and synthetic compounds are
currently being used with different claims and are prescribed by physicians or sold over the
counter. However, not all of them have clinical effectiveness (reviewed in Mannery et al., 2010).
The defense mechanisms are different in the intracellular and extracellular compartments and
comprise both enzymatic and nonenzymatic types. The major enzymatic antioxidants are
superoxide dismutase (SOD), catalase and glutathione peroxidase (GPx).
SOD is the first line of antioxidant defense against ROS generated by respiration and free
radical damage. SOD catalyzes the dismutation of O2•− to form H2O2. The H2O2 is then further
detoxified by catalase (Equation VII). There are three forms of SOD, (i) the manganese
containing SOD (Mn-SOD) which is located in the mitochondrial matrix, (ii) the copper and zinc
(Cu-ZnSOD) containing SOD located in the cytosol, the extracellular space and the
mitochondrial inner membrane, (iii) the extracellular SOD (EC-SOD) containing Cu-Zn

15
prosthetic group located on the surface of the cells (Fridovich, 1995). In rat hepatocytes,
approximately 70% of SOD is found in the cytoplasm (Yu, 1994).
2O2•− + 2H+ --------------> O2 + H2O2 (VII)
Catalase is a heme containing enzyme located primarily in the peroxisomes and catalyzes
the conversion of H2O2 to water (H2O) (Equation VIII). Catalase has one of the highest turnover
rates amongst the enzymes: one molecule of catalase can complete the reaction below up to 6
million times in one minute (Valko et al., 2006).
2H2O2 --------------> O2 + H2O (VIII)
Glutathione Peroxidase (GPx) catalyzes the reduction of H2O2 and organic
hydroperoxides while simultaneously oxidizing GSH with the generation of glutathione disulfide
(GSSG) (Equation IX-X). It has two forms, selenium (Se)-dependent or selenium independent
glutathione S-transferase (GST). The Se-independent transferases can be functionally
distinguished from GPx as they are inactive with H2O2 and only exhibit activity with organic
hydroperoxides (Arthur, 2001). GSH is an endogenous tripeptide (glutamyl-cysteinyl-glycine)
that serves as a cofactor for GST (glutathione S-transferase), which catalyzes the enzymatic
detoxification of xenobiotics.
2GSH + H2O2 --------------> GSSG + 2H2O (IX)
2GSH + ROOH --------------> GSSG + H2O + ROH (X)
SOD
Catalase
GPx
GPx

16
Figure 1.3. Detoxification reactions of ROS. ROS is generated by one-electron reductions of
molecular oxygen (3O2). The spontaneous reaction of superoxide (O2•−) with nitric oxide (•NO)
yields peroxynitrite (ONOO−) and peroxynitrous acid (ONOOH). NADPH oxidases (NOX) and
mitochondria are potential sources of superoxide; NO is generated by nitric oxide synthases
(NOS), and H2O2 can be directly formed by various oxidases. The neutrophil-derived enzyme
MPO can catalyze the formation of hypochlorite (OCl−). Singlet oxygen (1O2) can be formed
during the spontaneous dismutation of superoxide [Reprinted from Antioxidant defense
mechanisms, Volume 9.14, Jaeschke, In: Comprehensive Toxicology (Second Edition), edited by
C.A. McQueen, pp. 319–337 © 2010, with permission from Elsevier].
Extracellular antioxidants include albumin, transferrin, lactoferrin, ceruloplasmin,
haptoglobin, urate, GSH, vitamin E (α-tocopherol), β-carotene, bilirubin, ascorbate (vitamin C),
extracellular SOD (EC-SOD), and GPx (reviewed in Jaeschke, 2010).

17
1.2.4 Detrimental effects of ROS
An imbalance of ROS production and antioxidant defense systems can lead to oxidative stress.
Whilst small fluctuations in the steady-state concentration of these oxidants may actually play a
role in intracellular signaling (Dröge, 2002), uncontrolled increases in the concentration of these
oxidants lead to free radical-mediated reactions which may damage cellular macromolecules e.g.
lipid (Rubbo et al., 1994), proteins (Stadtman and Levine, 2000), and DNA (Richter et al.,
1988). Oxidative stress has been found to be associated with the pathogenesis of different
diseases e.g. cancer, Parkinson’s, Huntington’s, Alzheimer’s, prions, Down’s syndrome, Ataxia,
Multiple sclerosis, Creutzfeldt-Jacob disease, Amyotrophic lateral sclerosis, schizophrenia,
Tardive dyskinesia, asthma, chronic obstructive pulmonary disease, cataracts, cardiovascular
diseases (reviewed in Iannitti and Palmieri, 2009; Kovacic and Somanathan, 2013).
Lipids are critical to the structural and functional integrity of cell membranes. The free
radical oxidation of polyunsaturated fatty acids (PUFAs) is known as lipid peroxidation and it is
one of the most common mechanisms by which xenobiotics cause cytotoxicity. The biochemical
consequences of lipid peroxidation include cell membrane damage (and decreased membrane
potential), enzyme inhibition, release of lysosomal enzymes, and protein-protein cross-linking
(Smith et al., 1982). Highly reactive free radicals (R•) derived from some xenobiotics are capable
of abstracting hydrogen atoms from PUFA on phospholipid membranes, resulting in the
formation of a lipid radical (PUFA•). Reaction with oxygen yields the corresponding peroxy
radical (PUFAOO•) which initiates a chain propagation step leading ultimately to the degradation
of the lipid to a range of products including aldehydes or gases such as ethane and pentane
(Tafazoli, 2008). Several hepatotoxicants were reported to cause toxicity that involved lipid

18
peroxidation, such as carbon tetrachloride (CCl4) (Comporti et al., 1965),
trichlorobromomethane (Slater, 1988), chloroform (Ekström and Högberg, 1980), and halothane
(Tomasi et al., 1983).
Under oxidative stress conditions, proteins may be modified either indirectly by RCS
formed by the autoxidation of lipids or carbohydrates or directly by ROS leading to oxidized
amino acids. Reaction of proteins with lipid peroxidation-derived RCS results in the formation of
adducts known as advanced lipoxidation end products (ALEs) whereas reaction with
carbohydrates forms advanced glycation end products (AGEs) (Mehta, 2011; Negre-Salvayre et
al., 2008). Protein carbonylation can lead to alterations of protein (enzyme) functions, protein
fate and proteolysis, and protein misfolding. Protein carbonylation has been associated with a
large number of age-related disorders as protein aggregates can accumulate with age in such
diseases as, Parkinson’s disease, Alzheimer’s disease and cancer (Marin-Kuan et al., 2011;
Nyström, 2005).
Lipid peroxidation products and RCS can damage DNA by directly oxidizing DNA bases
or by forming exocyclic-adducts with DNA bases that induce base-pair substitution mutations
(Nair et al., 2007; Valko et al., 2006). •OH can result in single- or double-strand DNA breaks,
base modifications, and DNA-DNA or DNA-protein cross-links (Toyokuni, 1998). DNA repair
mechanisms may not work properly when DNA damage occurs at critical sites or when repair
processes are interrupted by •OH (Kehrer, 2000). Mitochondrial DNA is more prone to DNA
damage due to its close proximity to the major source of cellular ROS formation and limited
DNA repair capacity (Ma, 2010).

19
1.3 Drug-induced hepatotoxicity and inflammation: research rationale
Individual susceptibility plays an important role in determining whether or not a person develops
an untoward drug reaction. There are numerous factors that can contribute to the inter-individual
variations in xenobiotic response (pharmacological or toxic effects). These include variations in
age, gender, xenobiotic metabolism, immunologic responses, reserve and repair capacity of
tissues, xenobiotic absorption, coexisting disease, coexposure to additional xenobiotic agents and
nutritional status, as well as underlying inflammation. The majority of these determinants acting
at the same time can complicate the mechanism of variation due to xenobiotic agents. Moreover,
both genetic and environmental factors have the potential to exert important influences on most
of these determinants (Ganey and Roth, 2001).
It has been suggested that drug properties, genetic variation, and environmental factors
may contribute to IDILI (Boelsterli, 2003a; Kaplowitz, 2001). Two hypotheses to explain IDILI
have been proposed (Deng et al., 2009). The first is based on drug metabolizing enzyme (DME)
polymorphisms among patients that result in different levels of toxic drug metabolites. The
second one proposes the involvement of an adaptive immune response to proteins bound to the
drug or its metabolites (Ju and Uetrecht, 2002; Park et al., 2001). Drug metabolism
polymorphisms might also contribute to reactive metabolite formation and consequently to the
production of haptens needed for a harmful adaptive immune response. An extension of the latter
is the “danger hypothesis” (Pirmohamed et al., 2002; Séguin and Uetrecht, 2003), which
suggests that, in addition to immunization and challenge, a second “danger signal” is needed to
precipitate an adaptive immune response that becomes hepatotoxic. This signal might be any of a
number of factors including some form of cellular stress, underlying disease conditions, or

20
environmental factors (reviewed in Deng et al., 2009). Direct activation of antigen-presenting
cells (APC) is also proposed to be involved (Uetrecht, 2013).
Several experimental models suggested that an episode of inflammation during drug
treatment predisposes the animals to tissue injury and may be an important determinant of
individual susceptibility (Buchweitz et al., 2002; Luyendyk et al., 2000). This raises the
possibility that the presence or absence of inflammation is another susceptibility factor for drug
toxicity in humans (reviewed in Ganey and Roth, 2001).
Inflammatory episodes are common in humans and animals and are precipitated by
numerous stimuli such as bacteria, viruses and exposure to toxins produced by microorganisms.
Moreover, episodes of inflammation can be precipitated by the mammalian gastrointestinal (GI)
tract. In particular, endotoxin i.e. lipopolysaccharide (LPS) (a potent inducer of inflammation)
components released from the cell walls of gram-negative bacteria can translocate across the
intestinal mucosa into portal venous circulation. When these gram-negative bacteria divide or are
injured, large amounts of LPS are released in the intestinal lumen. LPS can translocate from the
GI lumen into the blood, and thereby the liver and other organs become exposed. The rate of
LPS translocation and magnitude of consequent liver exposure can be increased by diseases of
GI tract/liver, alterations in diet, alcohol consumption, surgical trauma, xenobiotic agents, and
other conditions (reviewed in Roth et al., 1997). However, this type of exposure is only
accompanied by a mild inflammatory response.
Individuals experiencing concurrent exposure to a xenobiotic and/or its metabolites and
endotoxin may be at greater risk of intoxication than those exposed to either of these alone. LPS
in the circulation leads to activation of inflammatory cells and the consequent release of
numerous endogenous mediators. However, homeostatic alterations in parenchymal cells

21
initiated by nontoxic doses of a xenobiotic agent may progress to overt injury through the
simultaneous action of these mediators (Figure 1.4) (Roth et al., 1997).
Figure 1.4. Augmentation of toxic responses by a bacterial endotoxin LPS. KCs (Kupffer cells);
PMNs (polymorphonuclear neutrophils); AA (arachidonic acid) [Reprinted from Is exposure to
bacterial endotoxin a determinant of susceptibility to intoxication from xenobiotic agents? Roth
and colleagues, Toxicol. Appl. Pharmacol., 147(2):300–11 © 1997 with permission from
Elsevier].

22
Inflammation is a necessary response to pathogen invasion. However, inappropriate or
unregulated inflammatory reactions may cause tissue injury. Before drug-induced liver injury
occurs in vivo, an inflammatory response usually occurs and cells other than hepatocytes (e.g.
Kupffer cells, macrophages) become activated. Inflammagens such as LPS can also activate
Kupffer cells (macrophages) and other inflammatory cells. Immune cells (e.g. neutrophils and
macrophages) also infiltrate the liver. At large doses of inflammagens, this response can lead to
overt injury. At smaller doses, cells become more sensitive to the toxic effects of xenobiotics
which otherwise may not occur. Numerous studies with animals have shown that a modest
inflammatory response enhanced tissue susceptibility to xenobiotics. Therefore, it was
hypothesized that inflammatory episodes during drug therapy decreased the threshold for drug
toxicity and, thereby, markedly increased the individual’s susceptibility to some drugs (Roth et
al., 1997). The inflammagen hypothesis has been presented in Figure 1.5.
Kupffer cells and resident liver macrophages normally play a role in protecting
hepatocytes from xenobiotics by phagocytosing incoming particles and releasing cytoprotective
cytokines (Roberts et al., 2007). Kupffer cell inhibitors, e.g. gadolinium chloride, were reported
to prevent hepatotoxicity induced by some hepatotoxic drugs, whereas Kupffer cell activators,
e.g. retinol or LPS, markedly enhanced hepatotoxicity induced by acetaminophen, allyl alcohol,
diethyldithiocarbamate, halobenzenes, and CCl4 (Buchweitz et al., 2002; Roth et al., 2003).

23
Figure 1.5. The inflammagen hypothesis [Reprinted from Concurrent inflammation as a
determinant of susceptibility to toxicity from xenobiotic agents, Ganey and Roth, Toxicol. Appl.
Pharmacol., 147(2):300–11 © 2001, with permission from Elsevier].
It is generally thought that most hepatotoxins are activated by oxidation catalyzed by the
endoplasmic reticular mixed function oxidase system (MFO) in the liver. The MFO system
consists of hepatocyte cytochrome P450, NADPH, cytochrome P450 reductase and oxygen.
However, peroxidase and H2O2 can also oxidatively activate some drugs or detoxify some other
drugs at higher peroxidase doses (Tafazoli, 2008). Whilst there is little peroxidase activity in
hepatocytes, MPO is located in Kupffer cells that are resident macrophages of the human and

24
rodent liver (Brown et al., 2001). Furthermore, neutrophil infiltration of the liver in response to
inflammation can result in a 50 to 100-fold increase in hepatic MPO activity (Kato et al., 2000).
Therefore peroxidase activity is a useful marker for measuring neutrophil/macrophage
infiltration as well as the hepatic inflammatory response. Eosinophil infiltration (e.g., following a
parasite infection) can also cause a marked increase in liver eosinophil peroxidase activity
(Gharib et al., 1999). During the inflammatory response, H2O2 can also be formed by activation
of the NADPH oxidase in the infiltrated cells. It is therefore reasonable to suggest that the large
increase in drug liver susceptibility could also be attributed to peroxidase catalyzed drug
oxidation to form reactive pro-oxidant radicals that are toxic to hepatocytes (Tafazoli, 2008).
Drug-induced tissue toxicity is often preceded by infiltration of the tissues by neutrophils, e.g.
indomethacin-induced kidney toxicity. This resulted in a marked increase in hepatic ROS
generated by neutrophils and a sevenfold increase in hepatic MPO activity (Basivireddy et al.,
2004).
1.4 Intrinsic versus idiosyncratic drug-induced hepatotoxicity-two villains or one?
In the paper “Intrinsic versus idiosyncratic drug-induced hepatotoxicity-two villains or one?”,
Roth and Ganey (2010) suggested that an acute inflammatory episode could shift the dose-
response curve for hepatotoxicity to the left, thereby bringing hepatotoxic doses into the
therapeutic range. This hypothesis can account for the bizarre characteristics of IDILI and is
supported by recent results showing that several drugs associated with human idiosyncratic
reactions can be rendered hepatotoxic to rodents upon interaction with an inflammatory stimulus
(a complete list of drugs investigated to date is available in Ganey and Roth, 2001). Given this

25
hypothesis and observations from recent results, it can be suggested that intrinsic and
idiosyncratic reactions may not be that different after all (Ganey and Roth, 2001).
1.5 Models to study DILI
Pharmaceutical industries face challenges in selecting new drug candidates with high efficacy
and low toxicity. In a retrospective analysis, regulatory animal toxicity testing was able to
identify more than 70% of human toxicities whereas hepatotoxicity in humans had the poorest
correlation with animal toxicity tests. Only half of the new pharmaceuticals that produced
hepatotoxicity in humans had any signals in animal toxicity studies (Olson et al., 2000). It is
difficult to develop and validate an animal model due to the overlap and unknown mechanisms
involved between the intrinsic DILI and IDILI. Of course, there is no “perfect” animal model
that will accurately predict all of the drug–human interactions for any new candidate drug. Both
in vitro and in vivo studies are necessary for safety/metabolism/toxicity studies, since neither
alone can fully estimate the potential safety or risk of the new candidate drug.
Significant efforts have been made by the pharmaceutical companies to screen drug
candidates for their potential to cause DILI, but were mostly unsuccessful. Therefore, often
signals, from both animal testing and clinical trials, turned out to be false negative. This
increases the cost and time for drug development. Again if a drug gets withdrawn from the
market after its approval due to unpredictable IDILI or some other forms of DILI, the loss of
revenue, the cost of litigation, and the time and effort spent dealing with the problem may
paralyze a company (Uetrecht, 2013). Indeed, developing better animal models to predict human
hepatotoxicity is a critical need for the pharmaceutical industry.

26
Although the mechanistic basis for IDILI remains poorly understood, attempts at animal
model development have been made based on several hypothesis for the IDILI mechanism.
These hypotheses have centered on drug disposition polymorphisms, adaptive immunity,
mitochondrial dysfunction, failure to adapt to modest injury, inflammatory stress, and multiple
other determinants (reviewed in Roth and Ganey, 2011).
In vitro cellular models of drug toxicity have unique and important roles to play in order
to screen out drugs that have potential for hepatotoxicity and to facilitate understanding of the
hepatotoxic mechanisms involved. In the current study, focus has been given to in vitro models
that could be used to predict drug induced hepatotoxicity. It is difficult to distinguish the primary
effects of a compound from those induced secondarily because liver functions are under the
influence of various endogenous and exogenous factors that result in complex interactions with
other organs in in vivo animal studies. Moreover, in vivo studies are limited by animal
welfare/ethical concerns and the fact that data obtained in animals cannot exactly be extrapolated
with certainty to humans due to the frequent idiosyncratic nature of liver toxicity and the
inherent differences between the metabolic activity in human and non-human species. Therefore
in vitro liver systems represent a better experimental approach to screen potential hepatotoxic
compounds and investigate mechanism(s) of DILI (Davila et al., 2008; Guillouzo, 1998; Tuschl
et al., 2008).

27
1.6 In vitro cytotoxicity assessment
In vitro cytotoxicity testing is becoming increasingly recognized as an effective and robust tool
for assessing human toxicity potential of pharmaceuticals early in drug discovery in order to
maximize the probability of successful progression of compounds into development (Dambach et
al., 2005; O’Brien and Haskins, 2006; Perlman et al., 2004; Xu et al., 2004). Conventional in
vitro cytotoxicity assays have low predictive value for the detection of human hepatotoxicity.
However, if these assays identified a compound as a liver-toxicant, there is more than an 80%
chance of corresponding findings in humans (Xu et al., 2000). In vitro systems are simple and
provide the ability to specifically manipulate and analyze a small number of parameters to
understand toxicity mechanisms. The most commonly used test systems of the past few decades
include, for example, the isolated perfused liver, liver slices, primary hepatocytes in suspension
or culture, cell lines, transgenic cells and sub-cellular fractions like S9-mix, microsomes,
supersomes or cytosol. However, the isolated hepatocyte is the most widely used model and
considered to be the gold standard for in vitro DILI study (Guillouzo, 1998; Tuschl et al., 2008).
1.7 Isolated hepatocytes in studying DILI
An ideal in vitro test system should adequately represent the in vivo situation of drug metabolism
and biotransformation in the liver. The isolated perfused liver represents the closest in vitro
model to simulate in vivo situation and has long been used for investigating DILI. It is able to
retain phase I and II drug metabolizing enzyme activities, as well as inducibility by xenobiotics
(Davila and Morris, 1999). Major advantages of the isolated perfused liver are (a) the three-

28
dimensional architecture is preserved with cell–cell, cell–matrix interactions and functional bile
canaliculi are maintained, leading to in vivo-like metabolism, (b) the bile flow can be collected
and analyzed separately, (c) allows consideration of issues related to hemodynamics. Despite all
of these advantages, the isolated perfused liver model is difficult to handle and its functional
integrity only maintained for a few hours. Therefore it can only be used for toxicants that are
expected to have toxic effects at very early ‘time-points’ (acute toxicity). Moreover, its
reproducibility is low and relative to other in vitro models, it does not necessarily reduce the
number of animals used. Whole organ perfusion of human liver is technically difficult and
human liver is rarely available for perfusion (Guillouzo, 1998; Tuschl et al., 2008).
1.8 Accelerated cytotoxicity mechanism screening techniques
The “accelerated cytotoxicity mechanism screening” (ACMS) methods determine the molecular
cytotoxic mechanisms of drugs/xenobiotics when incubated at 37°C for 3 hrs using freshly
isolated rat hepatocytes. ACMS is a useful tool for identifying the hepatocyte metabolizing
enzymes by comparing the effects of specific inhibitors of metabolizing enzymes in modulating
the loss of cell viability caused by the drug/xenobiotic being investigated. This functionomic
approach is useful for understanding the molecular cytotoxic mechanisms of xenobiotics under
investigation. A major assumption with ACMS is that high dose/short time (in vitro) exposure
simulates low dose/long time (in vivo) exposure (Chan et al., 2007; O’Brien and Siraki, 2005).
With 24 halobenzenes, it was found that the relative lethal concentrations required to cause 50%
cytotoxicity in 2 hrs at 37°C (defined as ACMS LC50), as determined in vitro using hepatocytes
isolated from phenobarbital-induced Sprague-Dawley rats, correlated with hepatotoxicity in vivo

29
at 24 – 54 hrs (Chan et al., 2007). Moreover, using these techniques, the molecular
hepatocytotoxic mechanisms found in vitro for six classes of xenobiotics/drugs were found to be
similar to the rat hepatotoxic mechanisms reported in vivo (O’Brien et al., 2004). The following
procedures have been used (O’Brien and Siraki, 2005):
“1) Determination of the concentration of drug/xenobiotic required to induce a 50% loss
of membrane integrity (LC50) of freshly isolated rat hepatocytes in 2 hrs using the trypan blue
exclusion assay.
2) Drug- or xenobiotic-induced cytotoxicity by inhibiting or inducing different
metabolizing enzymes which activate or detoxify the drug/xenobiotic was then determined. In
this way, the major metabolic pathways and metabolizing enzymes of xenobiotics can be rapidly
identified. ACMS techniques were used to show that the drug metabolic pathways at cytotoxic
drug concentrations in vitro in 2 hrs were similar to those that occur in vivo in 24 – 36 hrs.
3) The hepatocyte molecular cytotoxic mechanism of xenobiotics was determined by
following the changes in bioenergetics (ATP, mitochondrial membrane potential, respiration,
glycogen depletion), oxidative stress (GSH/GSSG levels, lactate/pyruvate ratio, and ROS
formation), and electrophile stress e.g. GSH conjugates and protein/DNA adducts. If oxidative
stress caused the cytotoxicity, then it should precede cytotoxicity and antioxidants, ROS
scavengers or redox therapy should prevent or delay the cytotoxicity. If not, then the oxidative
stress likely occurred as a secondary result of the cytotoxicity. If mitochondrial toxicity caused
the cytotoxicity, then glycolysis partly compensates and restores the membrane potential
(O'Brien et al., 2004; O’Brien and Siraki, 2005)”.
The enzyme inhibitors/activators are chosen on the basis of their selectivity, modulator
effectiveness, and their lack of toxicity in the hepatocyte model. Therefore, the ACMS
30
techniques are a methodological application that may be adaptable for high throughput screening
and may be useful for supplementing existing in vitro screening techniques as a means to explore
hepatotoxicity mechanisms. Using an in vitro model to help predict in vivo animal hepatotoxicity
may clarify mechanisms that can be used to minimize drug-induced toxicity and help determine
if alternative drug candidates are likely to be safer. In this way, the ACMS techniques can help
accelerate the pre-clinical drug screening process and filter out compounds with DILI potential,
thus guiding the development of safer pharmaceutical drugs (MacAllister, 2013).
1.9 In vitro hepatocyte oxidative stress inflammation model
It is important to define the role of inflammation in drug toxicity and to develop models or
methods to predict which drugs or drug candidates have the potential to cause toxicity through
interaction with inflammation. This knowledge could enable identification of individuals who are
susceptible to DILI due to inflammation.
In order to simulate the marked increase of drug-induced hepatotoxicity caused by acute
episode inflammation in vivo (as discussed previously), and assess the potential for the in vivo
hepatotoxicity risk of various drugs, our laboratory generally uses an in vitro hepatocyte
screening system. This “In Vitro Oxidative Stress Inflammation system” includes subjecting
freshly isolated rat hepatocytes to a low non-toxic continuous flow of a H2O2-generating system
using glucose (G) and glucose oxidase (GO) and supplementing it with either horseradish
peroxidase (HRP) or Fe(II) (MacAllister et al., 2013a) to simulate in vivo inflammation.
HRP/H2O2 was used for in situ activation of drugs and to simulate MPO. The H2O2 acts by
increasing the oxidation state of the ferric ion which then oxidizes the peroxidase substrates

31
(reviewed in Tafazoli and O’Brien, 2005). 6-N-propyl-2-thiouracil (PTU) was used as a
peroxidase inhibitor in this study as evidence for the involvement of HRP/H2O2 catalyzed
formation of drug pro-oxidant radicals. PTU inhibits HRP in a noncompetitive fashion (Zatón
and Ochoa de Aspuru, 1995). Phagocytes generate O2•− and H2O2 and their interaction results in
an Fe(II)-catalyzed reaction that forms •OH. Desferoxamine chelates Fe(II) in a catalytically
inactive form, and thus inhibition by desferoxamine has been employed as evidence for the
involvement of •OH generated by the Fenton reaction (Klebanoff and Waltersdorph, 1988).
Using this model, the laboratory was able to mimic the products formed by the inflammatory
immune cells and study the mechanism of inflammation-enhanced drug-induced cytotoxicity. A
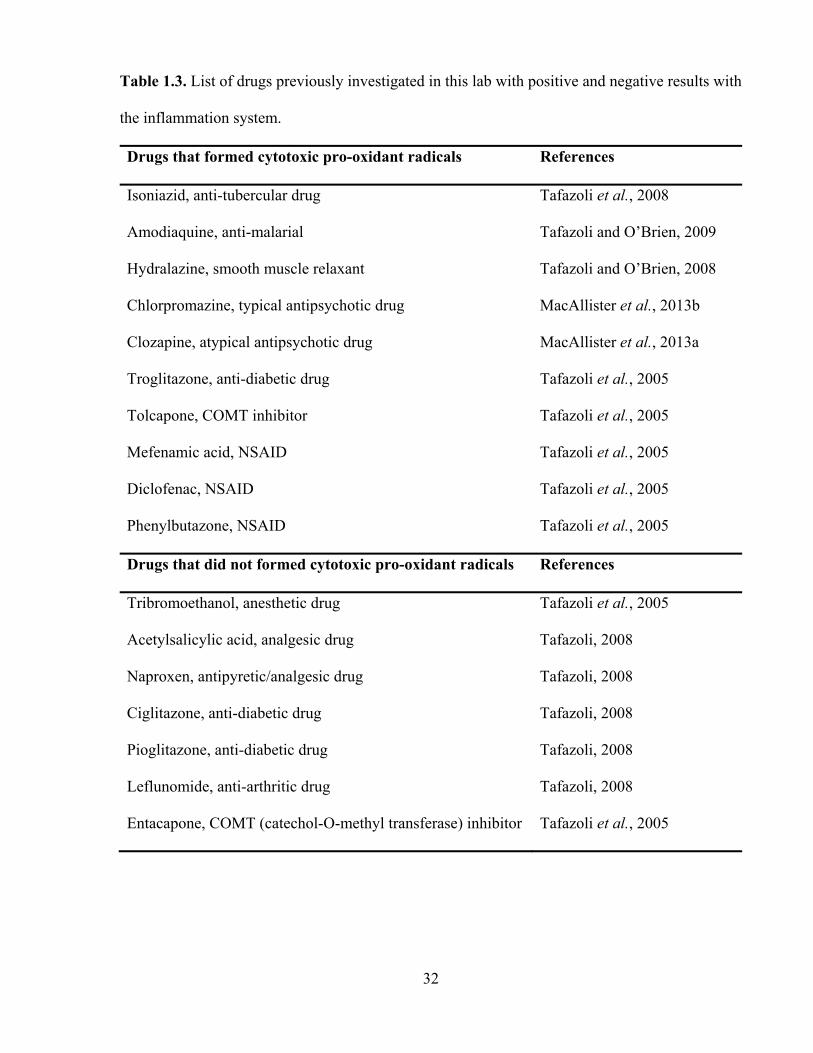
list of drugs/xenobiotics investigated in our lab previously with positive and negative results with
the in vitro inflammation system are presented in Table 1.3.
32
Table 1.3. List of drugs previously investigated in this lab with positive and negative results with
the inflammation system.
Drugs that formed cytotoxic pro-oxidant radicals References
Isoniazid, anti-tubercular drug Tafazoli et al., 2008
Amodiaquine, anti-malarial Tafazoli and O’Brien, 2009
Hydralazine, smooth muscle relaxant Tafazoli and O’Brien, 2008
Chlorpromazine, typical antipsychotic drug MacAllister et al., 2013b
Clozapine, atypical antipsychotic drug MacAllister et al., 2013a
Troglitazone, anti-diabetic drug Tafazoli et al., 2005
Tolcapone, COMT inhibitor Tafazoli et al., 2005
Mefenamic acid, NSAID Tafazoli et al., 2005
Diclofenac, NSAID Tafazoli et al., 2005
Phenylbutazone, NSAID Tafazoli et al., 2005
Drugs that did not formed cytotoxic pro-oxidant radicals References
Tribromoethanol, anesthetic drug Tafazoli et al., 2005
Acetylsalicylic acid, analgesic drug Tafazoli, 2008
Naproxen, antipyretic/analgesic drug Tafazoli, 2008
Ciglitazone, anti-diabetic drug Tafazoli, 2008
Pioglitazone, anti-diabetic drug Tafazoli, 2008
Leflunomide, anti-arthritic drug Tafazoli, 2008
Entacapone, COMT (catechol-O-methyl transferase) inhibitor Tafazoli et al., 2005

33
1.10 Literature review of the drugs investigated
1.10.1 Nitroaromatics (nimesulide, nilutamide, flutamide)
Nimesulide (NIM) (N-(4-nitro-2-phenoxyphenyl)methanesulfonamide) is the unique molecule of
the sulphonanilide class of NSAIDs having analgesic, anti-pyretic, and potent anti-inflammatory
activities and very good gastro-intestinal tolerability (Bessone et al., 2010). Mechanisms include
cyclooxygenase-2 (COX-2) inhibition, scavenging of free radicals, and inhibition of various
pathways of inflammation. NIM was licensed by Helsinn Healthcare SA (Switzerland) in 1980
and first launched in Italy as a therapeutic agent in 1985. Since 1985, it has been marketed in
more than 50 countries with the exception of the United States and a few other countries due to
safety concerns. After widespread clinical use of NIM (Boelsterli, 2002), hepatic toxicities,
including both acute hepatitis and the more severe fulminant hepatic failure, were reported
(Boelsterli, 2002, Dastis et al., 2007; Stadlmam et al., 2002; Tan et al., 2007). The relatively
high occurrence of these adverse events (9.4 cases per million patients treated) in Finland and
Spain caused NIM to be withdrawn from the market in those countries (Marcia et al., 2002;
Traversa et al., 2003). However, NIM remains on the market in a number of countries where the
rate of NIM-induced injury is reported to be relatively low (about 1 per million patients treated).
The hepatotoxicity of NIM is rare, relatively insensitive to accumulated dose, and specific to a
patient and is thus considered to induce an idiosyncratic toxicity (Boelsterli, 2002; Boelsterli et
al., 2006; Traversa et al., 2003). NIM exhibited liver injury features possibly consistent with an
immunoallergic mechanism in a few patients. However, hypersensitivity manifestations were
34
absent in most patients, suggesting metabolic idiosyncrasy rather than immunoallergy (Van
Steenbergen et al., 1998).
The molecular mechanisms involved in hepatotoxicity due to NIM have not been fully
elucidated. However, the involvement of ROS formation and mitochondria mediated pathways in
NIM-induced apoptotic cell death and resultant hepatotoxicity have been implicated (Boelsterli
et al., 2006). NIM is oxidatively metabolized via liver cytochromes P450 (principally by
CYP2C9, CYP2C19, and possibly CYP1A2), mainly to the 4‑hydroxy nimesulide (4‑OH‑NIM)
which has similar pharmacological properties to the parent drug but with lower potency
(Bernareggi and Rainsford, 2005). It has been suggested that NIM is bioactivated by CYP2C to a
protein-reactive electrophilic intermediate that activates the nuclear factor-like 2 pathway even at
non-toxic exposure levels (Kale et al., 2010).
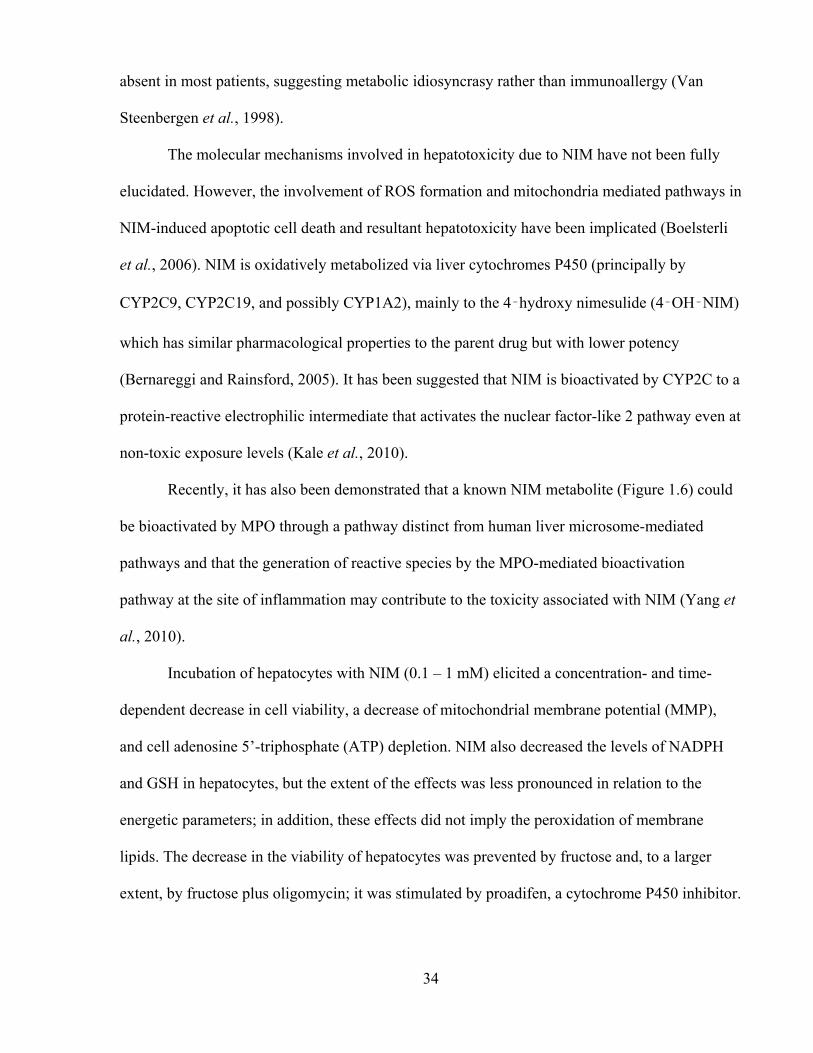
Recently, it has also been demonstrated that a known NIM metabolite (Figure 1.6) could
be bioactivated by MPO through a pathway distinct from human liver microsome-mediated
pathways and that the generation of reactive species by the MPO-mediated bioactivation
pathway at the site of inflammation may contribute to the toxicity associated with NIM (Yang et
al., 2010).
Incubation of hepatocytes with NIM (0.1 – 1 mM) elicited a concentration- and time-
dependent decrease in cell viability, a decrease of mitochondrial membrane potential (MMP),
and cell adenosine 5’-triphosphate (ATP) depletion. NIM also decreased the levels of NADPH
and GSH in hepatocytes, but the extent of the effects was less pronounced in relation to the
energetic parameters; in addition, these effects did not imply the peroxidation of membrane
lipids. The decrease in the viability of hepatocytes was prevented by fructose and, to a larger
extent, by fructose plus oligomycin; it was stimulated by proadifen, a cytochrome P450 inhibitor.
35
In contrast, the reduced metabolite of NIM did not present any of the effects observed for the
parent drug (Mingatto et al., 2000).
Figure 1.6. Proposed amine activation of reduced NIM by neutrophils and myeloperoxidase.
HLM, human liver microsome; M1, amino desnitro nimesulide; M2, reactive nimesulide
diiminoquinone intermediate; MPO, myeloperoxidase [Reprinted with permission from {Yang,
M., Chordia, M.D., Li, F., Huang, T., Linden, J., Macdonald, T.L. Neutrophil- and
myeloperoxidase-mediated metabolism of reduced nimesulide: Evidence for bioactivation.
Chem. Res. Toxicol., 23(11):1691–1700}. Copyright {2010} American Chemical Society].
NIM (100 µM) treatment resulted in a rapid depletion of GSH (60%) and enhanced
generation of ROS in isolated rat liver mitochondria. A significant change in Ca2+ dependent
mitochondrial permeability transition (MPT) was also observed (Singh et al., 2010). Albumin
(Berson et al., 2006) and a combination of natural terpenes (camphene and geraniol) (Singh et
al., 2012) were found to prevent NIM-induced hepatotoxicity.

36
Nilutamide (NIL) (5,5-dimethyl-3-[4-nitro-3-(trifluoromethyl)phenyl]imidazolidine-2,4-
dione) is a nonsteroidal antiandrogen derivative that acts as a competitive antagonist of the
androgen receptor (Raynaud et al., 1984). This nitroaromatic compound is proposed in the
treatment of metastatic prostatic carcinoma in association with castration (Beland et al., 1988;
Brisset et al., 1987). Its therapeutic effects are overshadowed by the occurrence of some adverse
reactions e.g. loss of visual dark adaptation and the rare development of lung and/or liver lesions.
Reversible episodes of interstitial pneumonitis occur in 1 to 2 % of patients whereas
hepatotoxicity occurs in approximately 0.5 to 1 % of patients. The hepatitis is hepatocellular in
type. Signs of hypersensitivity and autoimmunity are not common, suggesting that hepatitis may
be mediated by a toxic rather than an immunoallergic mechanism (Fau et al., 1992). In large
clinical trials, ALT (alanine aminotransferase) elevations occurred in 2 to 33 % of patients
during NIL therapy. The elevations were usually mild, asymptomatic and transient, rarely
requiring drug discontinuation. NIL-induced acute liver injury rarely occurs (McLeod, 1997).
The mechanism of NIL-induced hepatotoxicity is still unknown, but NIL-induced toxic
metabolite formation that leads to oxidative stress or interferes with mitochondrial functions has
been proposed. NIL is extensively metabolized in the liver, undergoing mainly reduction of the
nitro group to the non-toxic primary amine product. Electron spin resonance studies have shown
that NIL is first reduced by the NADPH-cytochrome P-450 reductase of rat liver microsomes
into a nitro anion-free radical (Berson et al., 1991). NIL itself, or the amine derivative, may also
undergo oxidation at several sites (Ojasoo, 1987). The structure and different metabolites of NIL
are presented in Figure 1.7.

37
Figure 1.7. Structure of NIL and its proposed metabolites [Reprinted with permission from
{Ask, K., Dijols, S., Giroud, C., et al. Reduction of nilutamide by no synthases: implications for
the adverse effects of this nitroaromatic antiandrogen drug. Chem. Res. Toxicol., 16(12):1547–
1554}. Copyright {2003} American Chemical Society].
The initial one-electron reduction of the nitro group forms a reactive nitro anion free
radical. Under anaerobic conditions, a further one-electron reduction occurs probably mediated
by disproportionation of the nitro anion radical forming a highly reactive nitroso derivative. The
nitroso can then be further reduced by two electrons to the hydroxylamine, and again reduced by
two electrons, to form a relatively inactive amine. The nitroso and the hydroxylamine are
reactive species which can covalently bind to glutathione and cellular macromolecules. Under
aerobic conditions, molecular oxygen oxidizes the nitro anion free radical, resulting in a redox
cycle with regeneration of the nitro compound and production of superoxide anion, whose
dismutation by superoxide dismutase yields H2O2. Therefore the reduction of some nitroaromatic
compounds e.g. NIL can lead to the formation of alkylating intermediates and/or potentially
38
toxic oxygen metabolites (Ask et al., 2004; Berson et al., 1991). In human recipients, it has been
suggested that ROS can be formed during the reductive metabolism of this nitro aromatic drug in
aerobic conditions (Berson et al., 1991).
In isolated mitochondria, NIL (100 µM) inhibited respiration, supported by substrates
feeding electrons into complex I of the respiratory chain. In sub-mitochondrial particles, NIL
(100 µM) decreased both oxygen consumption mediated by NADH and the oxidation of NADH;
addition of SOD and catalase had no effect. NIL (100 µM) also decreased the MMP and ATP
formation in mitochondria energized by malate plus glutamate (Berson et al., 1994).
Flutamide (FLU) (2-methyl-N-[4-nitro-3-(trifluoromethyl)phenyl]-propanamide) is a
competitive antagonist of the androgen receptor, which is used, like NIL, in association with
castration in the treatment of metastatic prostatic carcinoma (Steinsapir et al., 1991). The
efficacy of this antiandrogen is somewhat overshadowed by the occurrence of hepatitis in a few
subjects. The incidence of hepatotoxicity (defined as >4-fold increase in serum transaminase
activity) was found to be 0.36 % of 1091 consecutively treated patients with prostate cancer
(Gomez et al., 1992). Moreover, the incidence of liver disorder (defined as >1.5-fold increase in
alanine aminotransferase levels) was reported to be 26 % of 123 men with prostate cancer treated
with FLU. The rate was higher in those with previous histories of liver disease and preexisting
elevations in GGT (gamma-glutamyl transpeptidase) or ALT (alanine aminotransferase) (Wada
et al., 1999). FLU-induced hepatitis was cholestatic and/or cytolytic and fulminant (Alperine et
al., 1991; Corkery et al., 1991; Dankoff, 1992; Hart and Stricker, 1989).
Although the mechanisms of FLU-induced hepatotoxicity have not been precisely
elucidated, the formation of a reactive toxic metabolite might be responsible for such drug-

39
induced hepatotoxicity (Matsuzaki et al., 2006; Pessayre and Larrey, 1991). Unlike the related
anti-androgen NIL, FLU was not noticeably reduced into a nitroanion free radical by NADPH-
cytochrome P450 reductase. Instead, rat and human microsomal cytochrome P450 oxidatively
metabolized FLU into electrophilic metabolite(s), which bound covalently to microsomal
proteins (Berson et al., 1993). FLU is metabolized into 2-hydroxy FLU (OH-FLU) in liver by the
CYP1A2. FLU is also known to be metabolized into FLU-1 (4-nitro-
3(trifluoromethyl)phenylamine) (Figure 1.8) (Asakawa, 1995; Radwanski et al., 1989). The
plasma concentration of FLU-1 was reported to be usually much lower than that of OH-FLU
during clinical pharmacological examination, and it can be metabolized further by hydroxylation
and acetylation (Matsuzaki et al., 2006). FLU and OH-FLU were cytotoxic to primary cultured
rat hepatocytes at concentrations of approximately 40 µM and 170 µM, respectively (Wang et
al., 2002). CYP3A has also been reported to be involved in the metabolism of FLU into toxic
electrophilic metabolites (Berson et al., 1993).
Some FLU-induced liver cases were found to be associated with blood eosinophilia and
neutropenia, suggesting an involvement of the immune system (Hart and Stricker, 1989;
McDonnell and Livingston, 1994). It was suggested that in some individuals FLU
simultaneously renders hepatocytes more susceptible to oxidant-mediated injury that can initiate
infiltration of PMNs in to the liver and increases PMNs responsiveness to endogenous activators
(Srinivasan et al., 1997).

40
Figure 1.8. Structure of FLU and its metabolites. OH-flutamide (OH-FLU), 2-hydroxy
flutamide; FLU-1, 4-nitro-3 (trifluoromethyl)phenylamine) [Reprinted with permission from
Matsuzaki and colleagues, Metabolism and hepatic toxicity of flutamide in cytochrome P4501A2
knockout SV129 mice. J. Gastroenterol., 41(3):231–9. Copyright © 2006 Springer].
FLU (1 mM) led to the covalent binding of reactive electrophilic metabolites to male rat
hepatocyte proteins. It decreased the GSH/GSSG ratio and total protein thiols. This was
associated with an early increase in phosphorylase a activity (a Ca2+-dependent enzyme) and a
decrease in cytoskeleton-associated protein thiols, the formation of plasma membrane blebs, the
release of lactate dehydrogenase (LDH) and a loss of cell viability. The addition of cystine (a
GSH precursor) increased GSH and decreased LDH release in male rat hepatocytes (Fau et al.,
1994). A novel GSH conjugate of FLU was reported in human liver microsomes, suggesting that
the P450-mediated oxidation of FLU via a nitrogen-centered free radical could be one of several
bioactivation pathways of FLU (Kang et al., 2007). FLU also significantly increased lipid
41
peroxidation in an in vivo rabbit model that was prevented by GSH (Ray et al., 2008). FLU (50
µM) markedly inhibited complex I respiration in isolated male rat liver mitochondria and FLU (1
mM) decreased ATP levels in isolated male rat hepatocytes (Fau et al., 1994).
1.10.2 Methotrexate
Methotrexate (MTX) ((2S)-2-[(4-{[(2,4-diaminopteridin-6-
yl)methyl](methyl)amino}benzoyl)amino]pentanedioic acid) is one of the folic acid antagonists
(Al-Motabagani et al., 2006) that is widely used in the treatment of psoriasis (Thomas & Aithal,
2005), psoriatic arthritis (Wollina et al., 2001), rheumatoid arthritis in elderly and younger
patients (Padeh et al., 1997), acute lymphoblastic leukemia (Aytac et al., 2006), ectopic
pregnancy (Chen et al., 2003), inflammatory bowel diseases such as Crohn's disease and
ulcerative colitis (Siegel and Sands, 2005), and chronic inflammatory demyelinating
polyradiculoneuropathy (Fialho et al., 2006). One of the most serious side effects of MTX
therapy is hepatic toxicity. Mild hepatitis, cholestasis, fatty changes, fibrosis, and cirrhosis have
been reported in patients receiving MTX for malignant disorders (Hersh et al., 1966) whereas
Penalva Polo and colleagues (2002) reported an acute liver failure in a patient with MTX
therapy. MTX-induced cytotoxicity was reported to be associated with ROS formation and
depletion of cellular and mitochondrial GSH and ATP (Babiak et al., 1998; Chang et al., 2013;
Chen et al., 1998; Neuman et al., 1999; Phillips et al., 2003). MTX increased H2O2 levels in
stimulated PMNs in a dose-dependent manner with a maximum increase of 43.7% for 500 µM
MTX (Gressier et al., 1994). Addition of MTX (100 nM – 10 µM) to U937 monocytes induced a
time and dose dependent increase in cytosolic H2O2 from 6 – 16 hr. MTX also caused
corresponding monocyte growth arrest, which was inhibited by pre-treatment with N-

42
acetylcysteine (10 mM) or GSH (10 mM) (Phillips et al., 2003). MTX alone or in combination
with Cu(II) also generated ROS in lymphocytes that was inhibited by ROS scavengers (Chibber
et al., 2011).
It was found that MTX caused a significant increase in TBARS (thiobarbituric acid
reactive substance) levels (an important marker of lipid peroxidation) in the group in which
MTX was administered in vivo compared to the control group. The activities of SOD, catalase,
and glutathione reductase were significantly decreased in the MTX groups when compared with
the control group. The results therefore indicate that MTX caused oxidative stress by decreasing
the activities and effectiveness of the antioxidant enzyme defense system (Coleshowers et al.,
2010).
MTX, like naturally occurring folates is converted by folypolyglutamyl transferase into
polyglutamates (PGns) (Sczesny et al., 1998). MTX undergoes metabolic degradation to 7-
hydroxy methotrexate (7-OH-MTX) by the action of unspecific aldehyde oxidases in the rat liver
(Bremnes et al., 1991a; Wolfrom et al., 1990). A proposed metabolic pathway for MTX is shown
in Figure1.9. In human liver, both aldehyde oxidase and xanthine oxidase have been proposed to
be involved in MTX-oxidation (Chládek et al., 1997). Enterohepatic circulation by the action of
bacteria from the intestinal flora produces another MTX metabolite, 2,4-diamino-N-
methylpteroic acid (DAMPA) at a rate of 4%. However, since this metabolite has only 1/200 of
MTX activity, it is of minor importance clinically (Donehower et al., 1979). DAMPA was not
cytotoxic and did not significantly alter MTX-induced cytotoxicity in human leukemic cell line
(Widemann et al., 2000). Although 7-OH-MTX is an active metabolite of MTX, it exhibited only
1/100 – 1/200 of the original MTX activity in the inhibition of dihydrofolate reductase (DHFR)
(Farquhar et al., 1972). Although 7-OH-MTX cytotoxicity was increased several-fold by

43
polyglutamylation (Sholar et al., 1988), the inhibition of DHFR, the main target enzyme, was
minute as compared with that of equivalent intracellular levels of MTX polyglutamates (MTX-
PGns) (Seither et al., 1989).
Figure 1.9. A proposed metabolic pathway of MTX. (1) Hydroxylation: 7-hydroxy methotrexate
(7-OH-MTX), (2) Cleavage: 2,4-diamino-N-methylpteroic acid (DAMPA), (3) Polyglutamation:
MTX-PGn and 7-OH-MTX-PGn [Reprinted from Capillary electrophoretic drug monitoring of
methotrexate and leucovorin and their metabolites, Sczesny and colleagues, J. Chromatogr. B
Biomed. Sci. Appl., 718(1), 177–185 © 1998 with permission from Elsevier].
7-OH-MTX has been proposed as a mediator of MTX associated clinical toxicity. Renal
failure due to the precipitation of the metabolite in renal tissues of mammals and precipitation of
7-OH-MTX at high concentrations in rat bile in vivo and in vitro were also reported (Bremnes et
al., 1989; Bremnes et al., 1991b). It has also been suggested that this metabolite may play a role
in clinically acute renal and hepatic toxicity frequently encountered after a high-dose MTX
therapy (Bremnes et al., 1991c; Smeland et al., 1994; 1996).
MTX also decreased the ionic conductivity of the mitochondrial inner membrane and
membrane potential (ΔΨ), and inhibited state III respiration in rat liver mitochondria. The effect

44
on the steady-state of cytochrome b, as well as the inhibitory effect on state III of respiration
with NAD+-linked substrates, offers a reasonable explanation that the inhibition site of MTX
could be in a place anterior to the cytochrome b region, not linked to respiratory chain.
(Yamamoto et al., 1888; 1989).
Several in vitro and in vivo animal studies were carried out to find molecules which could
be hepatoprotective with MTX therapy e.g. misoprostol (Asci et al., 2011); resveratrol
(Dalaklioglu et al., 2013; Tunali-Akbay et al., 2010); propolis (Badr et al., 2011); curcumin
(Banji et al., 2011; Hemeida et al., 2008); taurine (Issabeagloo et al., 2011); omega-3 and
selenium (Mohammad et al., 2011); dexamethasone (Fuksa et al., 2010); melatonin (Jahovic et
al., 2003); β-carotene (Vardi et al., 2010); lipoic acid (Tabassum et al., 2010); caffeic acid
phenolic ester (CAPE) (Cakir et al., 2011); milk thistle (Ghaffari et al., 2011); and β-glucan
(Sener et al., 2006).
1.10.3 Thiopurines
Three thiopurine drugs (Figure 1.10) have been commonly used in the last forty years (Petit et
al., 2008). 6-mercaptopurine (3,7-dihydro-6H-purine-6-thione) (6-MP) and 6-thioguanine (2-
amino-6-mercaptopurine) (6-TG) are used in the treatment of acute leukaemia whereas
azathioprine (6-[(1-methyl-4-nitro-1H-imidazol-5-yl)sulfanyl]-7H-purineglucose) (AZA) is
widely used as an immunosuppressant for the treatment of diseases such as inflammatory bowel
diseases (IBD), autoimmune conditions and following transplantation to avoid organ rejection
(El-Azhary, 2003; Dubinsky, 2004; Lennard et al., 1997). In most of the cases, hepatotoxicity is
an unpredictable side effect of AZA and 6-MP, whose pathogenic mechanism remains unknown.
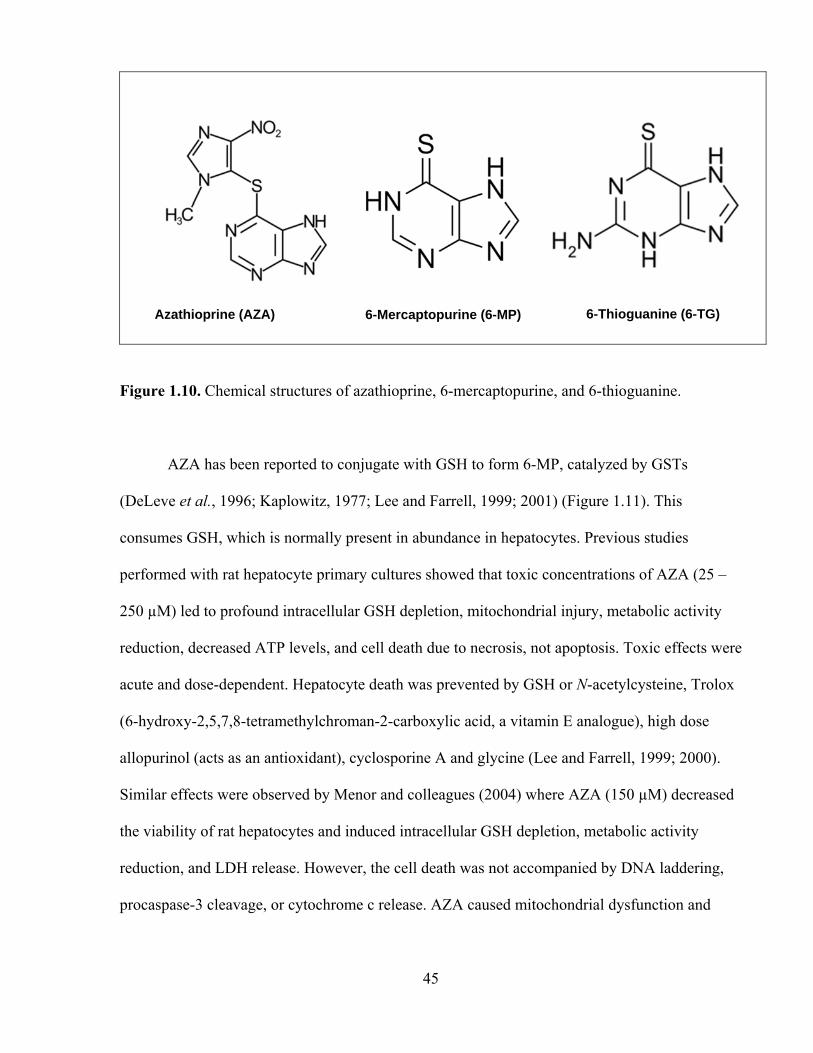
45
Figure 1.10. Chemical structures of azathioprine, 6-mercaptopurine, and 6-thioguanine.
AZA has been reported to conjugate with GSH to form 6-MP, catalyzed by GSTs
(DeLeve et al., 1996; Kaplowitz, 1977; Lee and Farrell, 1999; 2001) (Figure 1.11). This
consumes GSH, which is normally present in abundance in hepatocytes. Previous studies
performed with rat hepatocyte primary cultures showed that toxic concentrations of AZA (25 –
250 µM) led to profound intracellular GSH depletion, mitochondrial injury, metabolic activity
reduction, decreased ATP levels, and cell death due to necrosis, not apoptosis. Toxic effects were
acute and dose-dependent. Hepatocyte death was prevented by GSH or N-acetylcysteine, Trolox
(6-hydroxy-2,5,7,8-tetramethylchroman-2-carboxylic acid, a vitamin E analogue), high dose
allopurinol (acts as an antioxidant), cyclosporine A and glycine (Lee and Farrell, 1999; 2000).
Similar effects were observed by Menor and colleagues (2004) where AZA (150 µM) decreased
the viability of rat hepatocytes and induced intracellular GSH depletion, metabolic activity
reduction, and LDH release. However, the cell death was not accompanied by DNA laddering,
procaspase-3 cleavage, or cytochrome c release. AZA caused mitochondrial dysfunction and
Azathioprine (AZA) 6-Mercaptopurine (6-MP) 6-Thioguanine (6-TG)

46
activation of stress-activated protein kinase pathways leading to necrotic cell death in intact
isolated rat mitochondria (Menor et al., 2004).
Figure 1.11. The pathways of AZA metabolism. HGPRT, hypoxanthine-guanine-
phosphoribosyltransferase [Reprinted from Mechanism of azathioprine-induced injury to
hepatocytes: Roles of glutathione depletion and mitochondrial injury, Lee and Farrell, J.
Hepatol., 35(6), 756–764 © 2001, with permission from Elsevier].
Clinically relevant concentrations of AZA (0.5 – 5 µM) were also found to be toxic to rat
hepatocyte cultures and involved oxidative stress, mitochondrial injury and ATP depletion that
led to cell death by necrosis (Tapner et al., 2004). Allopurinol (a xanthine oxidase inhibitor) and
Trolox together provided near complete hepatocyte protection from AZA (Tapner et al., 2004).

47
Xanthine oxidase is proposed to be involved in several steps of AZA metabolism such as in the
direct metabolism of AZA to form an inactive metabolite, 1-methyl-4-nitrothioimidazole, in the
convertion of AZA to 6-MP, and formation of 6-thiouric acid from 6-MP (Lee and Farrell, 1999;
2001; Tapner et al., 2004) (Figure 1.11). The possibility that xanthine oxidase may play a role in
AZA-induced tissue injury has been raised by the observation that patients taking allopurinol, a
xanthine oxidase inhibitor, experienced less nephrotoxicity during rejection episodes after renal
transplantation (Chocair et al., 1994).
Thiopurine S-methyltransferase (TPMT) converts 6-MP to 6-methyl mercaptopurine (6-
MMP) and elevated 6-MMP levels were reported to be associated with dose dependent
elevations of liver enzymes such as ALT, AST (alanine aminotransferase), GGT (reviewed in
Bradford and Shih, 2011; Katsanos and Tsianos, 2007). However, several studies reported AZA-
induced hepatotoxicity had no relationship with 6-MMP levels (Andrejic et al., 2010; Gupta et
al., 2001; McGovern, 2002). AZA-induced myelosuppression and skin reactions were related to
TPMT polymorphisms (Lennard et al., 1997; Snow and Gibson, 1995). However, TPMT
polymorphisms did not appear to be involved in AZA-induced hepatotoxicity (King and Perry,
1995).
Several in vitro and in vivo animal studies were carried out to find molecules which could
be hepatoprotective for AZA or 6-MP therapy e.g. green tea polyphenols (El-Beshbishy et al.,
2011); L-arginine (Moustafa and Badria, 2010); lycopene (Issabeagloo et al., 2011);
aminoguanidine (Raza et al., 2003); quercetin (Shanmugarajan et al., 2008); and Vit-E (Tabrizi
et al., 2009).

48
1.11 Aims of the study and hypothesis
The aims of this thesis are:
1. To develop an in vitro system using isolated rat hepatocytes to investigate the effects of
inflammation and oxidative stress on the development of DILI. We use either a low non-
toxic continuous flow of a H2O2-generating system using G and GO, supplemented with
either (a) HRP or (b) Fe(II) to simulate in vivo inflammation.
2. To investigate molecular mechanisms of drug-induced hepatotoxicity using the ACMS
techniques and the in vitro oxidative stress inflammation system.
3. To investigate what compounds or antioxidants may act as antidotes to prevent or delay
drug-induced cytotoxicity.
General hypothesis:
Exposure of drugs such as flutamide, nilutamide, nimesulide, methotrexate, azathioprine, 6-
mercaptopurine to an in vitro oxidative stress inflammation system will increase hepatotoxicity
through the formation of pro-oxidant radicals and other reactive oxygen species leading to
oxidative stress.
A simplified schematic representation of the aims of the study is presented in Figure 1.12.

49
Figure 1.12. Simplified schematic representation of the hypotheses and aims the study.

50
1.12. Summary of introduction
Drug-induced liver injury is a major concern in clinical studies as well as in post-marketing
surveillance of drugs. Previous evidence suggests that drug exposure during periods of
inflammation can increase an individual’s susceptibility to toxicity. Inflammation caused by
infections or endotoxin markedly activates NADPH oxidase that generates superoxide radicals
by transferring electrons from NADPH. In the phagosome, superoxide radicals spontaneously
form H2O2 and other ROS. Neutrophils or Kupffer cells also release MPO on activation. The aim
of this study was to develop and validate an in vitro oxidative stress inflammation model to
identify compounds that may increase hepatotoxicity during inflammation. Toxic pathways of
tested drugs were also investigated using the “Accelerated Cytotoxicity Mechanism Screening”
techniques routinely used in our laboratory. Early in drug discovery, in vitro cytotoxicity is
becoming increasingly recognized as an effective indicator of human toxicity potential that must
be addressed in order to maximize probability of successful progression of compounds into
development. The ACMS technique may be useful for supplementing existing in vitro screening
techniques as a means to accelerate the pre-clinical screening process.
51
CHAPTER 2: MATERIALS AND METHODS
2.1 Chemicals
Nimesulide (N-(4-nitro-2-phenoxyphenyl)methanesulfonamide); nilutamide (5,5-dimethyl-3-[4-
nitro-3-(trifluoromethyl)phenyl]imidazolidine-2,4-dione); flutamide (2-methyl-N-[4-nitro-3-
(trifluoromethyl)phenyl]-propanamide); methotrexate ((2S)-2-[(4-{[(2,4-diaminopteridin-6-
yl)methyl](methyl)amino}benzoyl)amino]pentanedioic acid); azathioprine (6-[(1-methyl-4-nitro-
1H-imidazol-5-yl)sulfanyl]-7H-purineglucose); 6-mercaptopurine (3,7-dihydro-6H-purine-6-
thione); isoniazid (isonicotinic hydrazide); entacapone ((2E)-2-cyano-3-(3,4-dihydroxy-5-
nitrophenyl)-N,N-diethylprop-2-enamide); glucose oxidase from Aspergillus niger (type II,
15,000–50,000 units/g solid); catalase from bovine liver (2,000–5,000 units/mg protein);
peroxidase from horseradish (type II, 150–250 units/mg solid); bovine superoxide dismutase
(≥2500 units/mg protein); hydrogen peroxide; diethylenetriaminopentaacetic
acid (DTPA); 1-bromoheptane; trichloroacetic acid; thiobarbituric acid; 2',7'-dichlorofluorescin
diacetate; 3-amino-1,2,4-triazole; 6-N-propyl-2-thiouracil; N-acetyl-L-cysteine; allopurinol (1H-
pyrazolo[3,4-d]pyrimidin-4(2H)-one); menadione (2-methylnaphthalene-1,4-dione), amsacrine
(N-(4-(acridin-9-ylamino)-3-methoxyphenyl)methanesulfonamide); 1-aminobenzotriazole;
fructose; Trolox ((±)-6-hydroxy-2,5,7,8-tetramethylchromane-2-carboxylic acid); TEMPOL (4-
hydroxy-2,2,6,6-tetramethylpiperidin-1-oxyl), DPPD (N,N'-diphenyl-p-phenylenediamine);
mesna (2-mercaptoethanesulfonate); resveratrol (3,5,4'-trihydroxy-trans-stilbene); DMPO (5,5-
dimethyl-1-pyrroline-N-oxide), and all other chemicals were purchased from Sigma-Aldrich
Corp. (Oakville, ON, Canada). Type II collagenase (from Clostridium histoloticum) was
52
purchased from Worthington Biochemical Corp. (Lakewood, NJ, USA). 4-(2-Hydroxyethyl)
piperazine-1-ethanesulfonic acid (HEPES) was purchased from Boehringer-Mannheim Ltd.
(Montreal, Quebec, Canada). Stock solutions of chemicals were made up in either H2O or
DMSO (dimethyl sulfoxide).
2.2 Animal treatment
Male Sprague–Dawley rats (Charles River Laboratories International Inc., Wilmington,
Massachusetts, USA) weighing 275 – 300 g were used for experimental purposes. Experiments
were carried out in compliance with the Guide to the Care and Use of Experimental Animals by
Canadian Council on Animal Care (Olfert, Cross and McWilliam, 1993) and the University of
Toronto Animal Use Protocol, which was reviewed and approved by the Faculty of Medicine
and Pharmacy Animal Care Committee. Rats were housed in ventilated plastic cages with 12 air
changes per hr, 12 hr light photoperiod (lights on at 0800 hr) and an environmental temperature
of 21 – 23°C with a 50 – 60% relative humidity. The animals were fed a normal standard chow
diet and water ad libitum.
2.3 Hepatocyte preparation and treatment
Rat liver was perfused with collagenase and hepatocytes were isolated by a method previously
developed by Moldeus and colleagues (1978) with slight modifications in our lab.

53
Isolation of hepatocytes:
Rat liver was preperfused with a chelator to remove Ca2+ and then perfused with collagenase.
With this approach good quality and quantity of hepatocytes were obtained characterized by
single hepatocytes with a smooth, spherical appearance, and essentially free of nonparenchymal
cells.
Gas Mixtures and solutions:
All solutions were heated to 37°C and conditioned with 95% O2 and 5% CO2 gas that was used
during liver perfusion as well as hepatocyte incubation. Several buffers were used for the
purpose. The composition of the buffers are given below:
Krebs-Henseleit Buffer (volume to 1 L ddH2O, pH 7.4)
3.0 g, HEPES; 2.1 g, NaHCO3; 6.95 g, NaCl, 0.355 g, KCl, 0.16 g, KH2PO4, 0.295 g,
MgSO4•7H2O, 0.287 g, CaCl2.
Buffer A (Perfusion buffer, volume to 100 mL ddH2O, pH 7.4)
8.0 g, NaCl; 0.4 g KCl, 0.2 g, MgSO4•7H2O; 0.06 g, Na2HPO4•2H2O; 0.06 g, KH2PO4; 2.19 g,
NaHCO3 containing 0.5 mM ethanedioxybis(ethylamine)tetraacetate (EGTA) and 2% albumin.
Buffer B (Collagenase buffer, volume to 100 mL ddH2O, pH 7.4)
8.0 g, NaCl; 0.4 g KCl, 0.2 g, MgSO4•7H2O; 0.06 g, Na2HPO4•2H2O; 0.06 g, KH2PO4; 2.19 g,
NaHCO3; 0.8 g, collagenase (type II); and 4 mM, Ca2+.
Buffer C (Washing buffer, volume to 100 mL ddH2O, pH 7.4)
NaCI, 6.9 g; KCl, 0.36 g; KH2PO4, 0.13 g; MgSO4•7H2O, 0.295 g; CaCl2•7H2O, 0.374 g;
NaHCO3; albumin (2%).

54
Surgical procedure
Male rats of the Sprague-Dawley strain (275 – 300 g) were anesthetized with xyalzine: ketamine
(1:1) mixture. Heparin (500 units in 0.1 ml) was injected in the inferior venacava. Portal vein
was tied with a loose ligature; the mesenteric part of the vein was incised (vena mesenterica
superior), cannula was inserted and secured with the ligature. To resume normal shape of the
liver the perfusate flow rate was then adjusted. The liver was excised by first removing the
ventricle and intestine in one piece followed by removal of the liver from the diaphragm and
finally by cutting the dorsal ligaments with the rat in a tilted position. The duration of total
procedure was less than 2 min.
Perfusion and washing procedure
The buffer A was allowed to drip out of the cannula before cannulation of the vein to avoid
perfusing bubbles into the liver. In case of a good perfusion, liver cleared immediately and
completely. After liver removal from the body, it was suspended in the buffer in the reservoir
and the cannula was fixed to the horizontal bar. After 4 min of perfusion with buffer A, the
plastic rack (with the liver) was removed from the reservoir beaker. By compressing the shunt,
the gas chamber was almost emptied of perfusate. The rack was then placed in another beaker
containing buffer B. Keeping the constant pressure (10-15 cm H2O) buffer B was recirculated
for approximately 8 min. At the end of perfusion, the liver appeared swollen and pale, but no
blebs were seen on the surface. The liver was then kept in buffer C (in a wide, low beaker), the
capsula was cut open, and the cells were scattered with a pair of scissors and gentle stirring
movements, followed by filtration through cotton gauze to remove remaining connective tissue
and clumps of cells. The filtrate was collected in a beaker and allowed to settle down the cells to
form a loose pellet and the supernatant was removed by aspiration. The volume of the pellet was
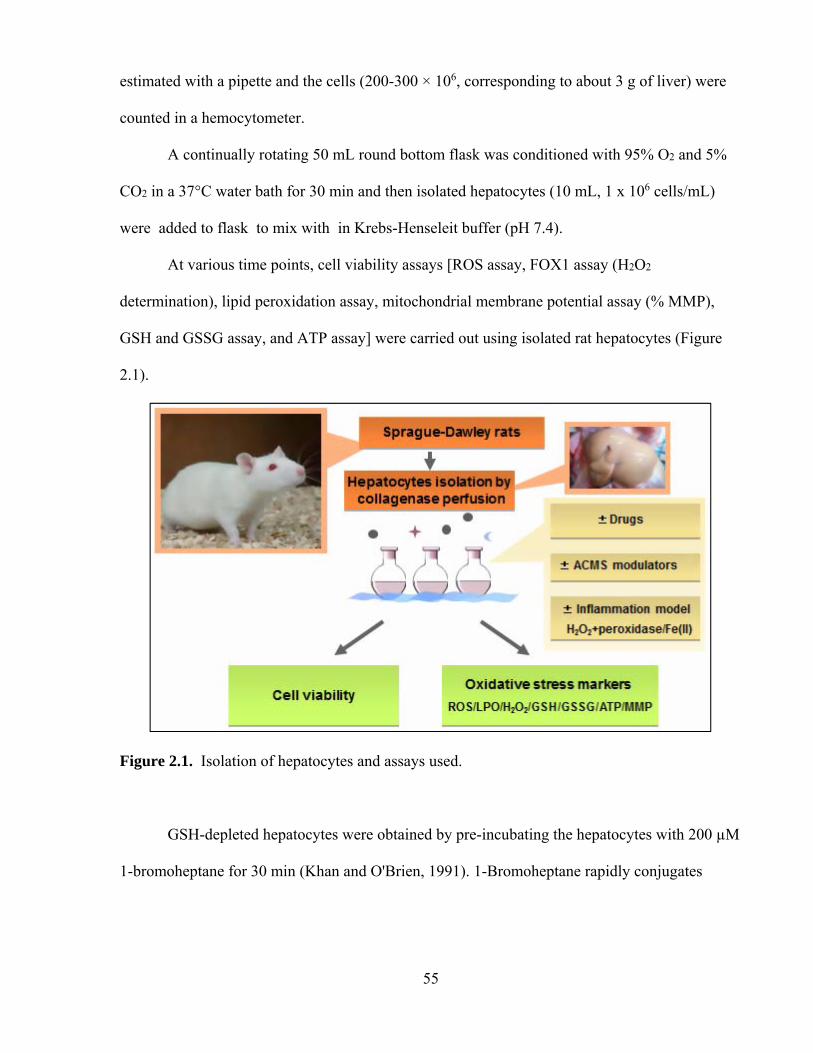
55
estimated with a pipette and the cells (200-300 × 106, corresponding to about 3 g of liver) were
counted in a hemocytometer.
A continually rotating 50 mL round bottom flask was conditioned with 95% O2 and 5%
CO2 in a 37°C water bath for 30 min and then isolated hepatocytes (10 mL, 1 x 10⁶ cells/mL)
were added to flask to mix with in Krebs-Henseleit buffer (pH 7.4).
At various time points, cell viability assays [ROS assay, FOX1 assay (H2O2
determination), lipid peroxidation assay, mitochondrial membrane potential assay (% MMP),
GSH and GSSG assay, and ATP assay] were carried out using isolated rat hepatocytes (Figure
2.1).
Figure 2.1. Isolation of hepatocytes and assays used.
GSH-depleted hepatocytes were obtained by pre-incubating the hepatocytes with 200 µM
1-bromoheptane for 30 min (Khan and O'Brien, 1991). 1-Bromoheptane rapidly conjugates
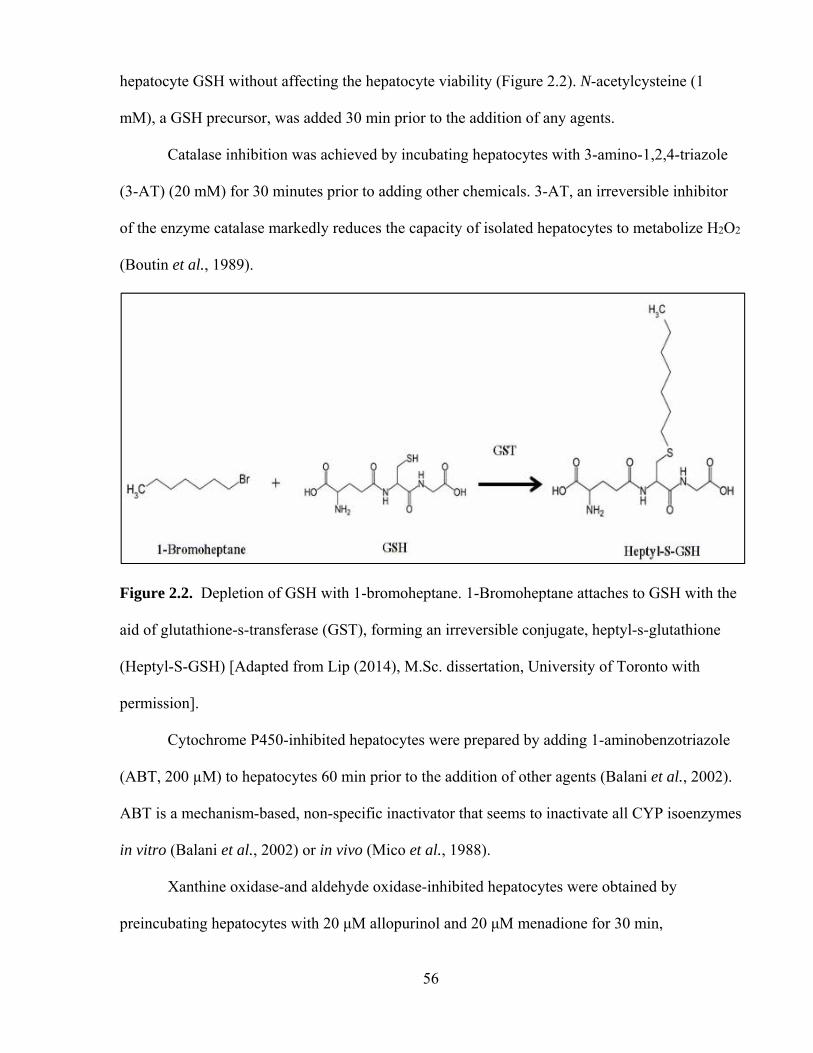
56
hepatocyte GSH without affecting the hepatocyte viability (Figure 2.2). N-acetylcysteine (1
mM), a GSH precursor, was added 30 min prior to the addition of any agents.
Catalase inhibition was achieved by incubating hepatocytes with 3-amino-1,2,4-triazole
(3-AT) (20 mM) for 30 minutes prior to adding other chemicals. 3-AT, an irreversible inhibitor
of the enzyme catalase markedly reduces the capacity of isolated hepatocytes to metabolize H2O2
(Boutin et al., 1989).
Figure 2.2. Depletion of GSH with 1-bromoheptane. 1-Bromoheptane attaches to GSH with the
aid of glutathione-s-transferase (GST), forming an irreversible conjugate, heptyl-s-glutathione
(Heptyl-S-GSH) [Adapted from Lip (2014), M.Sc. dissertation, University of Toronto with
permission].
Cytochrome P450-inhibited hepatocytes were prepared by adding 1-aminobenzotriazole
(ABT, 200 µM) to hepatocytes 60 min prior to the addition of other agents (Balani et al., 2002).
ABT is a mechanism-based, non-specific inactivator that seems to inactivate all CYP isoenzymes
in vitro (Balani et al., 2002) or in vivo (Mico et al., 1988).
Xanthine oxidase-and aldehyde oxidase-inhibited hepatocytes were obtained by
preincubating hepatocytes with 20 μM allopurinol and 20 μM menadione for 30 min,

57
respectively (Shaw and Jayatilleke, 1990). Aldehyde oxidase was also inhibited using amsacrine
(10 μM) (preincubated for 30 min) (Bremnes et al., 1991a).
Fructose (10 mM) (an ATP generator) was added to hepatocytes 30 min prior to the
addition of other agents (Wu et al., 1990).
2.4 Oxidative stress inflammation model
A H2O2 generating system (Antunes and Cadenas, 2001) was employed by adding 10 mM
glucose (G) to the hepatocyte suspension followed by glucose oxidase (GO, 0.5 Unit/mL). This
G/GO system continuously supplied H2O2 during the 3 hr experimental period, without affecting
GSH levels or cell viability (Antunes and Cadenas, 2001; Tafazoli and O’Brien, 2008). MTX
was co-incubated with the H2O2-generating system and HRP (0.5 μM) in vitro to simulate
inflammation in vivo. HRP was preincubated with hepatocytes for 15 min prior to the addition of
other agents. Peroxidase activity was inhibited by PTU (6-N-propyl-2-thiouracil, 5 μM) (Lee et
al., 1990) by preincubating it with hepatocytes for 15 min prior to the start of the experiment.
MTX was also incubated with the hydroxyl-radical generating Fe(II)-mediated Fenton model,
which consisted of non-toxic Fe(II) [2 μM Fe(II) and 4 μM 8-hydroxyquinoline (HQ)] with the
H2O2 generating system (MacAllister et al., 2013a). Desferoxamine (200 μM) was added to
chelate Fe (II) and was preincubated with hepatocytes for 30 min prior to the addition of other
agents.
The concentrations of enzyme-modulators/antioxidants/H2O2 generating system/ROS-
scavengers/ATP-generator/Fenton system/Fe (II)-chelator used in the experiments had no
significant effect on hepatocyte viability.

58
2.5 Cell viability
Hepatocyte viability was tested by the trypan blue exclusion test (Moldeus et al., 1978).
Hepatocyte viability was assessed at every 60 min during a 3 hr incubation period. Inclusion
criteria of cell viability for the experiment were 80 – 90%. The cell suspension was diluted to
100-fold in Krebs-Henseleit buffer containing 0.1 % (w/v) trypan blue for cell counting in a
hemocytometer. Within 5 min, 1-2 % of the cells were stained. This test measures the integrity of
the plasma membrane since damage to the plasma membrane is the critical step in the sequence
of events leading to cell death. Trypan blue is a negatively charged dye and does not interact
with the cell unless the membrane is damaged. Living cells do not take up the dye while dead
cells do (Moldeus et al., 1978).
2.6 ROS formation assay
Hepatocyte ROS generation was determined using of 2', 7'-dichlorofluorescein diacetate (DCFD)
which can permeate hepatocytes and be deacetylated by intracellular esterases to form non-
fluorescent dichlorofluorescin (DCF). Dichlorofluorescin is oxidized by intracellular ROS to
form the highly fluorescent dichlorofluorescein (Figure 2.3). ROS formation was assayed by
withdrawing 1 mL hepatocyte samples at 30 and 90 mins, which were then centrifuged for 1 min
at 5000 x g. The cells were resuspended in Krebs–Heinseleit buffer and 1.6 μM DCFD was
added. The cells were incubated at 37°C for 10 min, and the fluorescent intensity of
dichlorofluorescein was measured using a SPECTRAmax Gemini XS spectrofluorometer
(Molecular Devices, Sunnyvale, CA, USA) set at 490 nm excitation and 520 nm emission
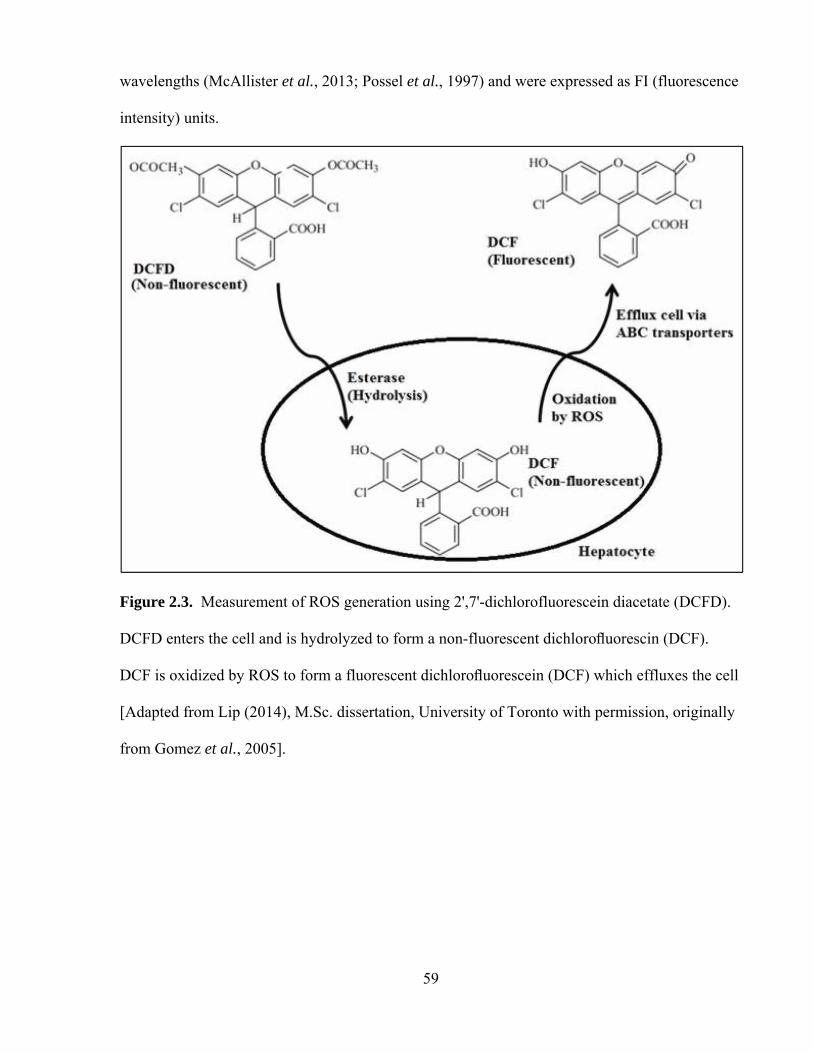
59
wavelengths (McAllister et al., 2013; Possel et al., 1997) and were expressed as FI (fluorescence
intensity) units.
Figure 2.3. Measurement of ROS generation using 2',7'-dichlorofluorescein diacetate (DCFD).
DCFD enters the cell and is hydrolyzed to form a non-fluorescent dichlorofluorescin (DCF).
DCF is oxidized by ROS to form a fluorescent dichlorofluorescein (DCF) which effluxes the cell
[Adapted from Lip (2014), M.Sc. dissertation, University of Toronto with permission, originally
from Gomez et al., 2005].
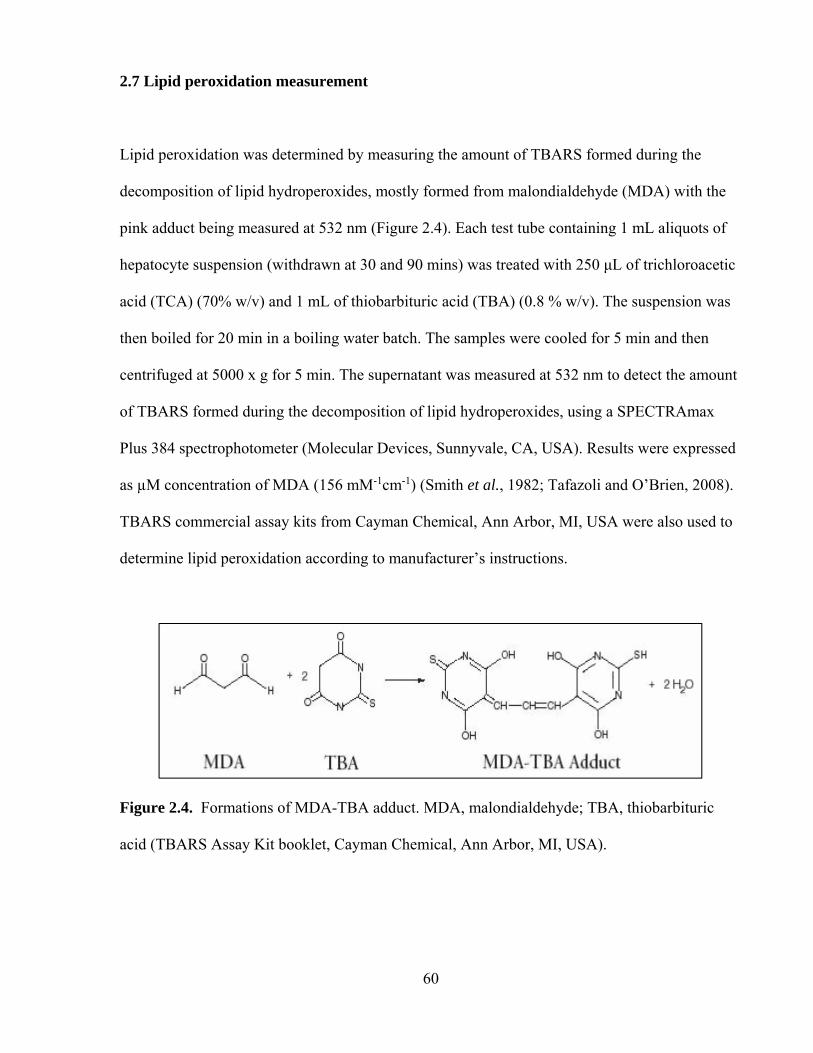
60
2.7 Lipid peroxidation measurement
Lipid peroxidation was determined by measuring the amount of TBARS formed during the
decomposition of lipid hydroperoxides, mostly formed from malondialdehyde (MDA) with the
pink adduct being measured at 532 nm (Figure 2.4). Each test tube containing 1 mL aliquots of
hepatocyte suspension (withdrawn at 30 and 90 mins) was treated with 250 μL of trichloroacetic
acid (TCA) (70% w/v) and 1 mL of thiobarbituric acid (TBA) (0.8 % w/v). The suspension was
then boiled for 20 min in a boiling water batch. The samples were cooled for 5 min and then
centrifuged at 5000 x g for 5 min. The supernatant was measured at 532 nm to detect the amount
of TBARS formed during the decomposition of lipid hydroperoxides, using a SPECTRAmax
Plus 384 spectrophotometer (Molecular Devices, Sunnyvale, CA, USA). Results were expressed
as µM concentration of MDA (156 mM-1cm-1) (Smith et al., 1982; Tafazoli and O’Brien, 2008).
TBARS commercial assay kits from Cayman Chemical, Ann Arbor, MI, USA were also used to
determine lipid peroxidation according to manufacturer’s instructions.
Figure 2.4. Formations of MDA-TBA adduct. MDA, malondialdehyde; TBA, thiobarbituric
acid (TBARS Assay Kit booklet, Cayman Chemical, Ann Arbor, MI, USA).
61
2.8 Endogenous H2O2 measurement
H2O2 was measured in hepatocytes by adding FOX1 reagent. The FOX1 reagent consisted of 25
mM sulfuric acid, 250 μM ferrous ammonium sulfate, 100 μM xylenol orange, and 100 mM
sorbitol. 50 μL of hepatocyte suspension (withdrawn at 30 and 90 mins) were added to 950 μL of
the FOX1 reagent and incubated for 30 min at room temperature. Samples were then
spectrophotometrically analyzed at 560 nm using a SPECTRAmax Plus 384 spectrophotometer
(Molecular Devices, Sunnyvale, CA, USA). An extinction coefficient 2.35×10⁵ M−1 cm−1 was
used to measure the concentration of H2O2 (Ou and Wolff, 1996; Tafazoli and O’Brien, 2008),
which was expressed as nmoles/106 cells.
2.9 GSH and GSSG determination
GSH and GSSG in hepatocytes were determined colorimetrically at 30 and 90 mins by
commercial kits from Cayman Chemical, Ann Arbor, MI, USA according to the manufacturer’s
instructions at 412 nm which utilizes an optimized enzymatic recycling method (Eyer and
Podhradský, 1986). The sulfhydryl group of GSH reacts with 5,5'-dithio-bis-2-nitrobenzoic acid
(DTNB, also known as Ellman’s reagent) and produces a yellow colored 5-thio-2-nitrobenzoic
acid (TNB). The mixed disulfide, GSTNB (between GSH and TNB) is reduced by glutathione
reductase (GR) to recycle the GSH and produce more TNB (Figure 2.5). The rate of TNB
production is directly proportional to this recycling reaction which in turn is directly proportional
to the concentration of GSH in the sample. GSSG was determined by first derivatizing the
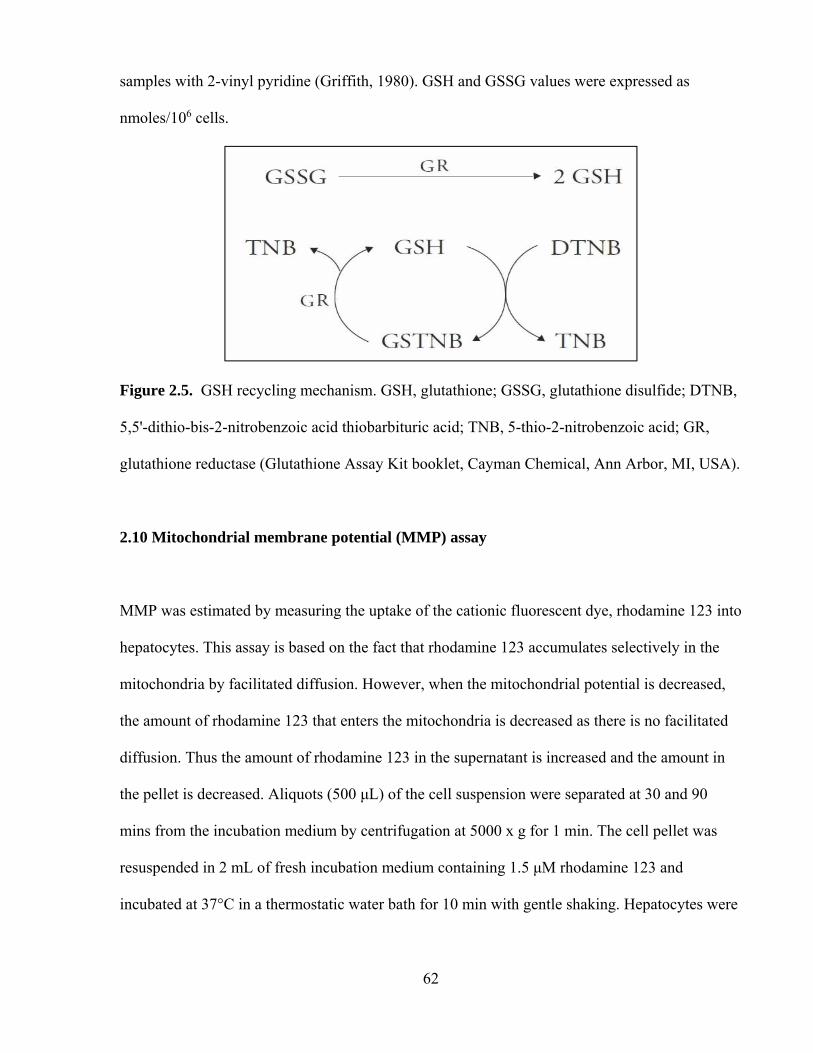
62
samples with 2-vinyl pyridine (Griffith, 1980). GSH and GSSG values were expressed as
nmoles/106 cells.
Figure 2.5. GSH recycling mechanism. GSH, glutathione; GSSG, glutathione disulfide; DTNB,
5,5'-dithio-bis-2-nitrobenzoic acid thiobarbituric acid; TNB, 5-thio-2-nitrobenzoic acid; GR,
glutathione reductase (Glutathione Assay Kit booklet, Cayman Chemical, Ann Arbor, MI, USA).
2.10 Mitochondrial membrane potential (MMP) assay
MMP was estimated by measuring the uptake of the cationic fluorescent dye, rhodamine 123 into
hepatocytes. This assay is based on the fact that rhodamine 123 accumulates selectively in the
mitochondria by facilitated diffusion. However, when the mitochondrial potential is decreased,
the amount of rhodamine 123 that enters the mitochondria is decreased as there is no facilitated
diffusion. Thus the amount of rhodamine 123 in the supernatant is increased and the amount in
the pellet is decreased. Aliquots (500 μL) of the cell suspension were separated at 30 and 90
mins from the incubation medium by centrifugation at 5000 x g for 1 min. The cell pellet was
resuspended in 2 mL of fresh incubation medium containing 1.5 μM rhodamine 123 and
incubated at 37°C in a thermostatic water bath for 10 min with gentle shaking. Hepatocytes were
63
then separated by centrifugation and the amount of rhodamine 123 remaining in the incubation
medium was measured at 490 nm excitation and 520 nm emission wavelengths using a
SPECTRAmax Gemini XS spectrofluorometer (Molecular Devices, Sunnyvale, CA, USA). The
capacity of mitochondria to take up the rhodamine 123 was calculated as the difference in
fluorescence intensity between control and treated cells and was expressed as % MMP compared
to control hepatocytes (Andersson et al., 1987).
2.11 Cellular ATP determination
ATP in hepatocytes was determined colorimetrically by commercial ATP Assay kits from
Abcam Inc., Boston, MA, USA according to manufacturer’s instructions at 570 nm using a
SPECTRAmax Plus 384 spectrophotometer (Molecular Devices, Sunnyvale, CA, USA). The
method utilizes the phosphorylation of glycerol to generate a product that is easily quantified by
absorbance at 570 nm. ATP concentration was expressed as nmoles/106 cells.
2.12 Electron resonance spectroscopy (ESR) spin trapping study
ESR spin trapping studies of AZA and 6-MP metabolism by HRP/H2O2 were investigated
according to Arvadia and colleagues (2011) in the laboratory of Dr. Arno Siraki (Assistant
Professor, Faculty of Pharmacy and Pharmaceutical Sciences, University of Alberta). ESR
spectra were obtained using Elexsys E500 series spectrometer (Bruker Corporation, Billerica,
Massachusetts, USA). Instrument parameters were set to the following: frequency: 9.81 GHz,
center field = 3497 gauss, microwave power = 20 mW, modulation amplitude = 1 gauss,

64
modulation frequency = 100 kHz, sweep time = 60 s, number of scans = 6 (6 min total recording
time). All reactions were carried out at room temperature in 0.1 M phosphate buffer pH 7.4
containing 10 μM DTPA. Where indicated, reactions contained 5 mM AZA or 5 mM 6-MP, 100
mM DMPO, 5 μM HRP, 500 μM H2O2, and 40 μg/mL SOD. The samples were vortexed and
transferred from microtubes to a quartz flat cell and the resulting spectrum was recorded.
2.13 Statistical analysis
The SPSS software package (version 14.0, SPSS Inc., Chicago, IL, USA) was used to analyze
the data. Values were rounded and were expressed as mean ± standard error of the mean
(S.E.M.) from 3 independent experiments. Statistical analysis was performed using a one-way
analysis of variance (ANOVA) and Tukey's post-hoc test to assess significance between control
and treatment groups in these experiments. p < 0.05 was considered significant.

65
CHAPTER 3: RESULTS
3.1 Nitroaromatics (flutamide, nilutamide, nimesulide)
3.1.1 ACMS LC50 determination
A concentration and time dependent increase in cytotoxicity, ROS formation, and a decrease in
% MMP were observed for FLU (50 – 100 µM), NIL (100 – 500 µM), and NIM (100 – 500 µM)
(data not shown) compared to control hepatocytes over a 3 hr incubation period. Incubation of
freshly isolated rat hepatocytes for 2 hrs at 37°C with 75 µM FLU, 300 µM NIL, and 300 µM
NIM induced an approximate 50% loss in hepatocyte viability as measured by the trypan blue
exclusion assay (LC50, according to the ACMS technique). FLU was found to be more cytotoxic
than NIL and NIM.
3.1.2 Effects of non-toxic H2O2 and peroxidase on nitroaromatic drugs
In the presence of a non-toxic G/GO + HRP with NIM (300 µM), NIL (300 µM), and FLU (75
µM), a 2.1-, 1.5-, and 1.5-fold increase in toxicity at 2 hrs were observed, respectively. In the
absence of drugs, none of the inflammatory modulators at the doses used, affected hepatocyte
viability significantly (Table 3.1). ROS formation was also increased with all of the
nitroaromatic drugs when G/GO + HRP was added.

66
Table 3.1. Nitroaromatics-induced cytotoxicity and oxidative stress in a hepatocyte oxidative
stress inflammation model (MacAllister et al., 2013a).
Treatment
Cytotoxicity
(% Trypan blue uptake)
Mitochondrial
Membrane
Potential
(% MMP)
Reactive
Oxygen
Species
Formation
(FI units)
60 min 120 min 180 min 30 min 30 min
Control hepatocytes 18 ± 1 22 ± 1 24 ± 1 100 100 ± 2
H2O2-generating system 25 ± 1 26 ± 2 30 ± 1 97 ± 2 108 ± 3
HRP+H2O2-generating system 22 ± 2 23 ± 2 24 ± 1 96 ± 3 Interference*
300 µM Nimesulide 39 ± 2a 51 ± 2a 62 ± 4a 89 ± 4a 137 ± 4a
+ H2O2-generating system 63 ± 3abd 78 ± 3abd 84 ± 2abd 84 ± 2abc 184 ± 3abd
+ 0.5 μM HRP 68 ± 6 acd 84 ± 1acd 91 ± 3acd 79 ± 4abcd Interference*
300 µM Nilutamide 39 ± 3a 57 ± 3a 62 ± 3a 88 ± 2a 128 ± 3a
+ H2O2-generating system 46 ± 1ab 66 ± 1abe 71 ± 5ab 86 ± 2abc 177 ± 6abe
+ 0.5μM HRP 55 ± 1ace 74 ± 2 ace 77 ± 6ace 82 ± 1abc Interference*
75 µM Flutamide 37 ± 3a 50 ± 1a 67 ± 4a 89 ± 2a 135 ± 6a
+ H2O2-generating system 43 ± 3ab 60 ± 4abf 71 ± 6ab 87 ± 1abc 167 ± 5abf
+ 0.5 μM HRP 49 ± 3 acf 64 ± 5acf 73 ± 6ac 82 ± 2abc Interference*
Means ± S.E.M. for three separate experiments are given (n = 3). Refer to the materials and methods section for a description of the experiments performed and experimental conditions. HRP, horseradish peroxidase. *Due to oxidation of 2'-7'-dichlorofluorescin by peroxidase (Rota et al. 1991) asignificant as compared to control hepatocytes (p<0.05). bsignificant as compared to H2O2-generating system (p<0.05). csignificant as compared to HRP + H2O2-generating system (p<0.05). dsignificant as compared to 300 µM nimesulide (p<0.05). esignificant as compared to 300 µM nilutamide (p<0.05). fsignificant as compared to 75 µM flutamide (p<0.05).

67
A significant decrease in % MMP was observed (p<0.05) with a ranking of NIL > FLU>
NIM compared to control hepatocytes. A significant decrease of % MMP was also observed for
NIM, NIL and FLU when incubated with G/GO + HRP (p<0.05) compared to respective drug
controls (Table 3.1).
3.1.3 Effects of non-toxic H2O2 and peroxidase or Fe(II) on FLU-induced cytotoxicity
Addition of a non-toxic H2O2 generating system (to simulate inflammation in vitro as described
in the introduction section) with HRP (0.5 µM) caused a significant increase in FLU-induced
cytotoxicity that was significantly decreased by the addition of PTU (5 µM) (a peroxidase
inhibitor) (Figure 3.1). Furthermore, with the addition of a H2O2 generating system and
peroxidase caused a significant increase in lipid peroxidation (MDA equivalents, µM) and a
decrease in % MMP (Table 3.2) and GSH levels (Figure 3.2) compared to control hepatocytes
(Table 3.2). Similar results were obtained when we used the Fenton model (a non-toxic H2O2
generating system and Fe(II) that generates hydroxyl radicals). An iron chelator, desferoxamine
(200 µM, pre-incubated for 30 min) delayed FLU-induced cytotoxicity likely by inhibiting the
Fenton reaction (Figure 3.1). All modulating agents were non-cytotoxic compared to control
hepatocytes at the concentrations used (data not shown).

68
Figure 3.1. Effects of non-toxic H2O2 and peroxidase or Fe(II)-mediated Fenton model on FLU-
induced cytotoxicity. Data are presented as Mean ± S.E.M. (n = 3). Refer to the materials and
methods section for a description of the experiments performed and experimental conditions.
FLU, Flutamide; HRP, horseradish peroxidase; G, glucose; GO, glucose oxidase; PTU, 6-N-
propyl thiouracil.
All data points were significant compared to control hepatocytes (p<0.05).
*Significant compared to 75 µM FLU (p<0.05);
#Significant compared to 75 µM FLU + HRP (0.5 μM) (p<0.05);
¶Significant compared to 75 µM FLU + Fe(II)-mediated Fenton model (p<0.05).
0
30
60
90
120
60 min 120 min 180 min
% Cytotoxicity (trypan
blue uptake)
Incubation time (min)
Control
FLU (75 µM)
FLU + G + GO + HRP
FLU + G + GO + HRP + PTU
FLU + G + GO + Fe(II)‐mediatedFenton model
FLU + G + GO + Fe(II)‐mediatedFenton model + Desferoxamine
*
*#
*
*
*
*
*
*
*#
*#
*
*

69
3.1.4. Protection against FLU-induced cytotoxicity in rat hepatocytes
A significant decrease in GSH levels was observed when FLU was administered with the H2O2
generating system and peroxidase to rat hepatocytes. This was prevented by 1 mM N-
acetylcysteine (a GSH precursor). Potent antioxidants, Trolox ((±)-6-hydroxy-2,5,7,8-
tetramethylchromane-2-carboxylic acid) (1 mM) and resveratrol (3,5,4'-trihydroxy-trans-
stilbene) (50 µM), and DPPD (N,N'-diphenyl-p-phenylenediamine) (2 µM) significantly
decreased FLU-induced cytotoxicity, ROS and LPO formation, and increased % MMP (Table
3.2) and GSH levels (Figure 3.2) compared to control hepatocytes. Significant protection against
FLU-induced cytotoxicity with the H2O2 generating system and peroxidase was also achieved by
a ROS scavenger, TEMPOL (4-hydroxy-2,2,6,6-tetramethylpiperidene-1-oxyl) (200 µM) (Table
3.2). All modulating agents were non-cytotoxic compared to control hepatocytes at the
concentrations used.
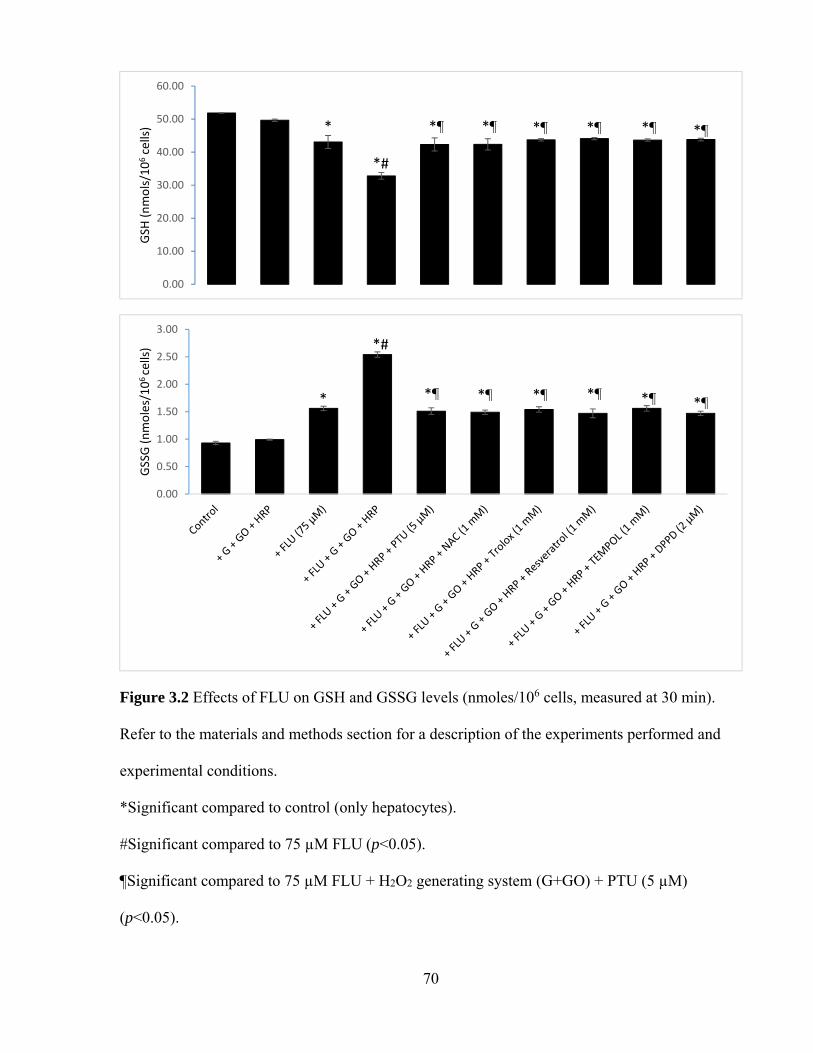
70
Figure 3.2 Effects of FLU on GSH and GSSG levels (nmoles/106 cells, measured at 30 min).
Refer to the materials and methods section for a description of the experiments performed and
experimental conditions.
*Significant compared to control (only hepatocytes).
#Significant compared to 75 µM FLU (p<0.05).
¶Significant compared to 75 µM FLU + H2O2 generating system (G+GO) + PTU (5 µM)
(p<0.05).
0.00
10.00
20.00
30.00
40.00
50.00
60.00
GSH
(nmols/106cells)
0.00
0.50
1.00
1.50
2.00
2.50
3.00
GSSG (nmoles/106 cells)
*
*#
*¶ *¶ *¶ *¶ *¶ *
*#
*¶ *¶ *¶ *¶ *¶ *¶*

71
Table 3.2. Protection against FLU-induced cytotoxicity using an oxidative stress inflammation system in isolated rat hepatocytes.
Data are presented as Mean ± S.E.M. (n = 3). Refer to the materials and methods section for a description of the experiments performed and experimental conditions. PTU, 6-N-propyl-2-thiouracil; NAC, N-acetylcysteine; Trolox, (±)-6-hydroxy-2,5,7,8-tetramethylchromane-2-carboxylic acid; resveratrol (3,5,4'-trihydroxy-trans-stilbene); TEMPOL, 4-hydroxy-2,2,6,6-tetramethylpiperidin-1-oxyl; DPPD (N,N'-diphenyl-p-phenylenediamine). aSignificant compared to control (only hepatocytes) (p<0.05). bSignificant compared to 75 µM FLU (p<0.05). cSignificant compared to 75 µM FLU + H2O2 generating system and peroxidase (p<0.05).
Addition Cytotoxicity (Trypan blue uptake, %)
Lipid Peroxidation (µM, MDA)
Mitochondrial Membrane Potential (% Control)
Incubation time 60 min 120 min 180 min 30 min 30 min Control 19 ± 1 21 ± 1 24 ± 1 0.30 ± 0.01 100
+ H2O2 generating system + peroxidase 21 ± 1 23 ± 1 26 ± 1 0.33 ± 0.01 97 ± 1
+ 75 µM FLU 30 ± 2a 53 ± 1a 66 ± 1a 0.48 ± 0.02a 86 ± 1a,b
+ 75 µM FLU + H2O2 generating system + peroxidase
53 ± 2a,b 72 ± 2a,b 88 ± 2a,b 0.60 ± 0.01a,b 72 ± 1a,b
+ 5 µM PTU 41 ± 2a,b,c 56 ± 1a,c 72 ± 1a,b,c 0.53 ± 0.01a,b 85 ± 1a,c
+ 1 mM NAC 33 ± 2a,c 53 ± 1a,c 62 ± 1a,c 0.53 ± 0.02a,b 90 ± 1a,b,c
+ 1 mM Trolox 30 ± 1a,c 47 ± 1a,c 53 ± 1a,b,c 0.43 ± 0.02a,c 93 ± 1a,b,c
+ 50 μM Resveratrol 31 ± 1a,c 50 ± 1a,c 62 ± 1a,c 0.40 ± 0.02a,c 90 ± 1a,b,c
+ 200 μM TEMPOL 31 ± 1a,c 52 ± 2a,c 57 ± 2a,b,c 0.40 ± 0.01a,c 88 ± 1a,b,c
+ 2 µM DPPD 29 ± 2a,c 53 ± 1a,c 61 ± 1a,b,c 0.35 ± 0.01c 89 ± 1a,c

72
3.2 Methotrexate
3.2.1 MTX-induced cytotoxicity
A concentration and time dependent increase in cytotoxicity (Figure 3.3), ROS formation, and a
decrease in % MMP were observed for MTX (50 – 500 µM) compared to control hepatocytes
over a 3 hr of incubation period. Incubation of freshly isolated rat hepatocytes for 2 hrs at 37°C
with 300 µM MTX induced an approximate 50% loss in hepatocyte viability as measured by the
trypan blue exclusion assay (LC50, according to the ACMS technique).
Figure 3.3. Concentration-response curve of MTX towards isolated rat hepatocytes.
*significant compared to control hepatocytes (p<0.05).

73
3.2.2. Involvement of GSH in MTX-induced cytotoxicity
A significant increase in MTX-induced cytotoxicity, ROS formation, and a significant decrease
in % MMP were observed when GSH was depleted by using 1-bromoheptane (200 µM) in
hepatocytes whereas addition of 1 mM N-acetylcysteine significantly delayed (cytoprotective at
60 min and 120 min, not at 180 min) MTX-induced cytotoxicity (Figure 3.4), ROS formation
and increased % MMP (measured at 30 min) (p<0.05) (Table 3.3). N-acetylcysteine was added
30 min prior to the addition of MTX or other agents.
MTX treatment (300 µM) significantly depleted GSH and increased GSSG formation
(Figure 3.5) is rat hepatocytes whereas N-acetylcysteine significantly increased GSH. However,
N-acetylcysteine (1 mM) did not restore GSH values to control levels when compared to MTX-
treated hepatocytes (Figure 3.4). All modulating agents were non-cytotoxic compared to control
hepatocytes at the concentrations used (data not shown).

74
Figure 3.4. Involvement of GSH, catalase and aldehyde oxidase in MTX-induced cytotoxicity in
isolated rat hepatocytes. Refer to the materials and methods section for a description of the
experiments performed and experimental conditions. GSH-depleted hepatocytes were obtained
by pre-incubating the hepatocytes with 1-bromoheptane (200 µM) for 30 min. N-acetylcysteine
was added 30 min prior to the addition of MTX or other agents. Catalase inhibition was achieved
by incubating hepatocytes with 3-amino-1,2,4-triazole (20 mM) for 30 minutes and aldehyde
oxidase-inhibited hepatocytes were obtained by preincubating hepatocytes with 20 μM
menadione for 30 min prior to adding other chemicals. All modulating agents were non-cytotoxic
compared to control hepatocytes at the concentrations used (data not shown).
All data points were significant compared to control hepatocytes (p<0.05).
*Significant compared to 300 µM MTX (p<0.05).
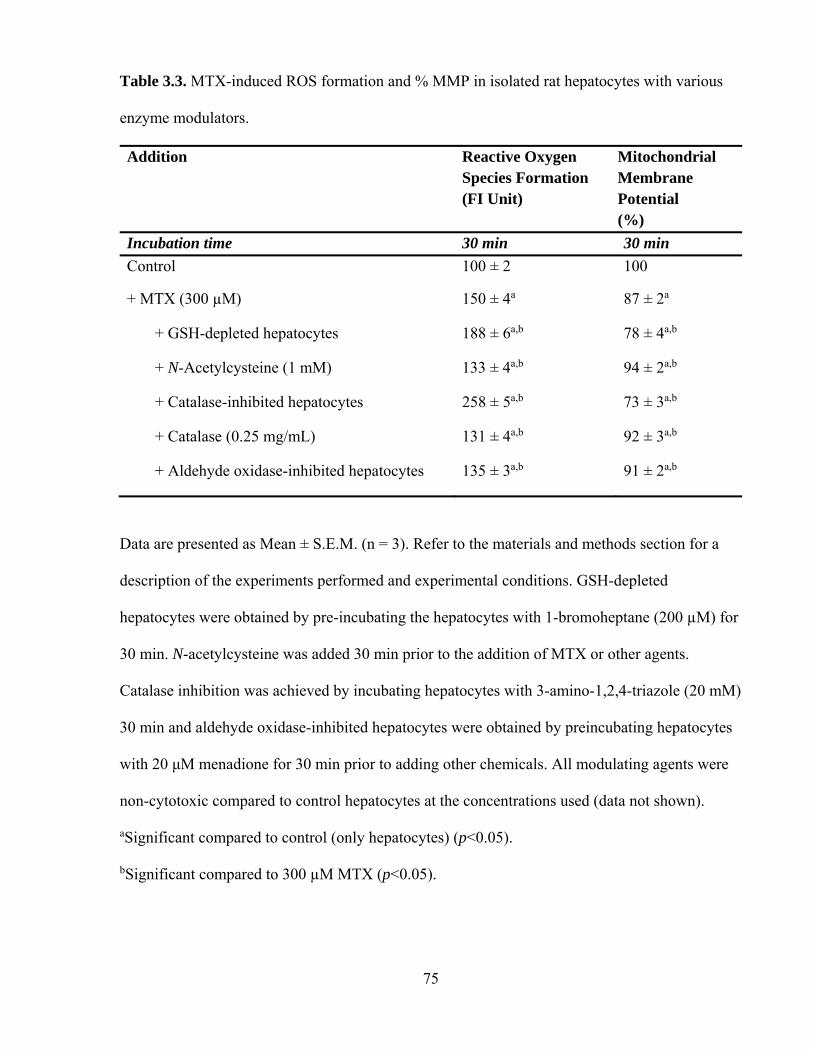
75
Table 3.3. MTX-induced ROS formation and % MMP in isolated rat hepatocytes with various
enzyme modulators.
Addition Reactive Oxygen Species Formation (FI Unit)
Mitochondrial Membrane Potential (%)
Incubation time 30 min 30 min
Control 100 ± 2 100
+ MTX (300 µM) 150 ± 4a 87 ± 2a
+ GSH-depleted hepatocytes 188 ± 6a,b 78 ± 4a,b
+ N-Acetylcysteine (1 mM) 133 ± 4a,b 94 ± 2a,b
+ Catalase-inhibited hepatocytes 258 ± 5a,b 73 ± 3a,b
+ Catalase (0.25 mg/mL) 131 ± 4a,b 92 ± 3a,b
+ Aldehyde oxidase-inhibited hepatocytes 135 ± 3a,b 91 ± 2a,b
Data are presented as Mean ± S.E.M. (n = 3). Refer to the materials and methods section for a
description of the experiments performed and experimental conditions. GSH-depleted
hepatocytes were obtained by pre-incubating the hepatocytes with 1-bromoheptane (200 µM) for
30 min. N-acetylcysteine was added 30 min prior to the addition of MTX or other agents.
Catalase inhibition was achieved by incubating hepatocytes with 3-amino-1,2,4-triazole (20 mM)
30 min and aldehyde oxidase-inhibited hepatocytes were obtained by preincubating hepatocytes
with 20 μM menadione for 30 min prior to adding other chemicals. All modulating agents were
non-cytotoxic compared to control hepatocytes at the concentrations used (data not shown).
aSignificant compared to control (only hepatocytes) (p<0.05).
bSignificant compared to 300 µM MTX (p<0.05).

76
Figure 3.5. Effects of MTX on GSH and GSSG levels (nmoles/106 cells, measured at 30 min).
Refer to the materials and methods section for a description of the experiments performed and
experimental conditions.
*Significant compared to control (only hepatocytes) (p<0.05).
#Significant compared to 300 µM MTX (p<0.05).
0.00
10.00
20.00
30.00
40.00
50.00
60.00
70.00
GSH
(nmols/106cells)
0.00
0.50
1.00
1.50
2.00
2.50
3.00
3.50
GSSG (nmols/106 cells)
*
*#
*
#
*#
*# *#
*#
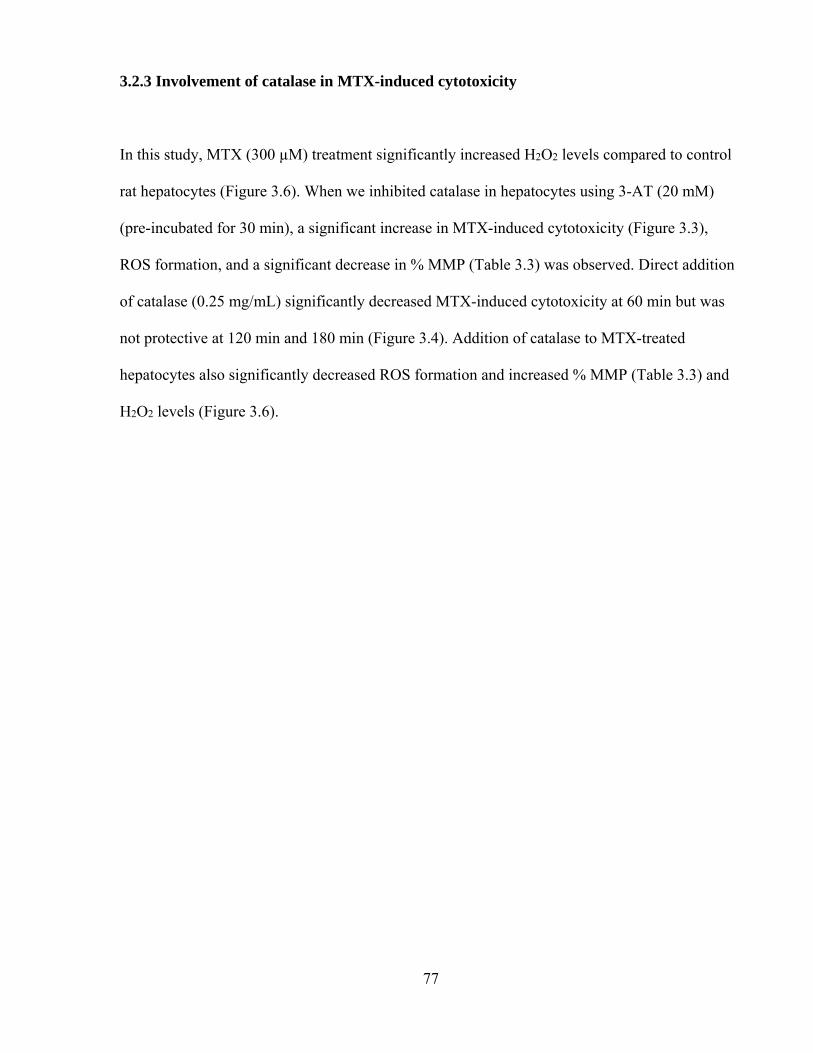
77
3.2.3 Involvement of catalase in MTX-induced cytotoxicity
In this study, MTX (300 µM) treatment significantly increased H2O2 levels compared to control
rat hepatocytes (Figure 3.6). When we inhibited catalase in hepatocytes using 3-AT (20 mM)
(pre-incubated for 30 min), a significant increase in MTX-induced cytotoxicity (Figure 3.3),
ROS formation, and a significant decrease in % MMP (Table 3.3) was observed. Direct addition
of catalase (0.25 mg/mL) significantly decreased MTX-induced cytotoxicity at 60 min but was
not protective at 120 min and 180 min (Figure 3.4). Addition of catalase to MTX-treated
hepatocytes also significantly decreased ROS formation and increased % MMP (Table 3.3) and
H2O2 levels (Figure 3.6).

78
Figure 3.6. MTX-induced H2O2 generation (measured at 30 min.). Refer to the materials and
methods section for a description of the experiments performed and experimental conditions.
Catalase inhibition was achieved by incubating hepatocytes with 3-AT (3-amino-1,2,4-triazole )
(20 mM) for 30 min prior to adding other chemicals. All modulating agents were non-cytotoxic
compared to control hepatocytes at the concentrations used (data not shown).
*Significant compared to control (only hepatocytes) (p<0.05).
#Significant compared to 300 µM MTX (p<0.05).
3.2.4 Cytochrome P450 and xanthine oxidase inhibition
Xanthine oxidase inhibition (by pre-incubating hepatocytes with 20 µM allopurinol for 30 min)
and cytochrome P450 inhibition (by pre-incubating hepatocytes with 200 µM 1-ABT for 60 min)
0
2
4
6
8
10
12
14
16
18
20
H2O
2(nmoles/106cells)
*
* #

79
had no significant effect on MTX-induced cytotoxicity and ROS formation (p>0.05) (data not
shown).
3.2.5 Involvement of aldehyde oxidase in MTX-induced cytotoxicity
Aldehyde oxidase inhibition using 20 µM menadione (pre-incubated for 30 min) resulted in a
significant decrease in MTX-induced cytotoxicity at 60 min and 120 min (Fig. 3.4). Menadione
also significantly decreased ROS and H2O2 formation and increased % MMP (Table 3.3). A
similar result was also found with another aldehyde oxidase inhibitor, amsacrine (data not
shown).
3.2.6 MTX-induced lipid peroxidation and mitochondrial toxicity
MTX (300 µM) had no significant effect on lipid peroxidation (as measured by TBARS assay).
MTX (300 µM) significantly decreased % MMP (Table 3.3) and ATP levels at 30 min (Figure
3.7) in rat hepatocytes whereas addition of 10 mM fructose (pre-incubated for 15 min)
significantly increased % MMP (Table 3.3), ATP (Figure 3.7), and delayed MTX-induced
cytotoxicity (Table 3.4).

80
Figure 3.7. MTX-induced ATP depletion (measured at 30 min.). Refer to the materials and
methods section for a description of the experiments performed and experimental conditions.
Fructose (10 mM) was added 30 min prior to adding other chemicals.
*Significant compared to control (only hepatocytes) (p<0.05).
#Significant compared to 300 µM MTX (p<0.05).
3.2.7 Effects of non-toxic H2O2 and peroxidase or Fe(II) on MTX-induced cytotoxicity
Addition of a non-toxic H2O2 generating system with HRP (0.5 µM) caused a significant
increase in MTX-induced cytotoxicity that was significantly decreased by the addition of PTU (5
µM) (a peroxidase inhibitor) (Fig. 3.8). Furthermore, the addition of a H2O2 generating system
and peroxidase caused a significant increase in lipid peroxidation, ROS formation and a decrease
in % MMP (data not shown). Similar results were obtained when we used the Fention model (a
non-toxic H2O2 generating system and Fe(II) that generates hydroxyl radicals). An iron chelator,
desferoxamine (200 µM, pre-incubated for 30 min) delayed MTX-induced cytotoxicity likely by
inhibiting the Fenton reaction by chelating Fe(II) (Figure 3.8).
0
5
10
15
20
25
30
35
ATP
(n
mo
les/
106 cells)
*
* #
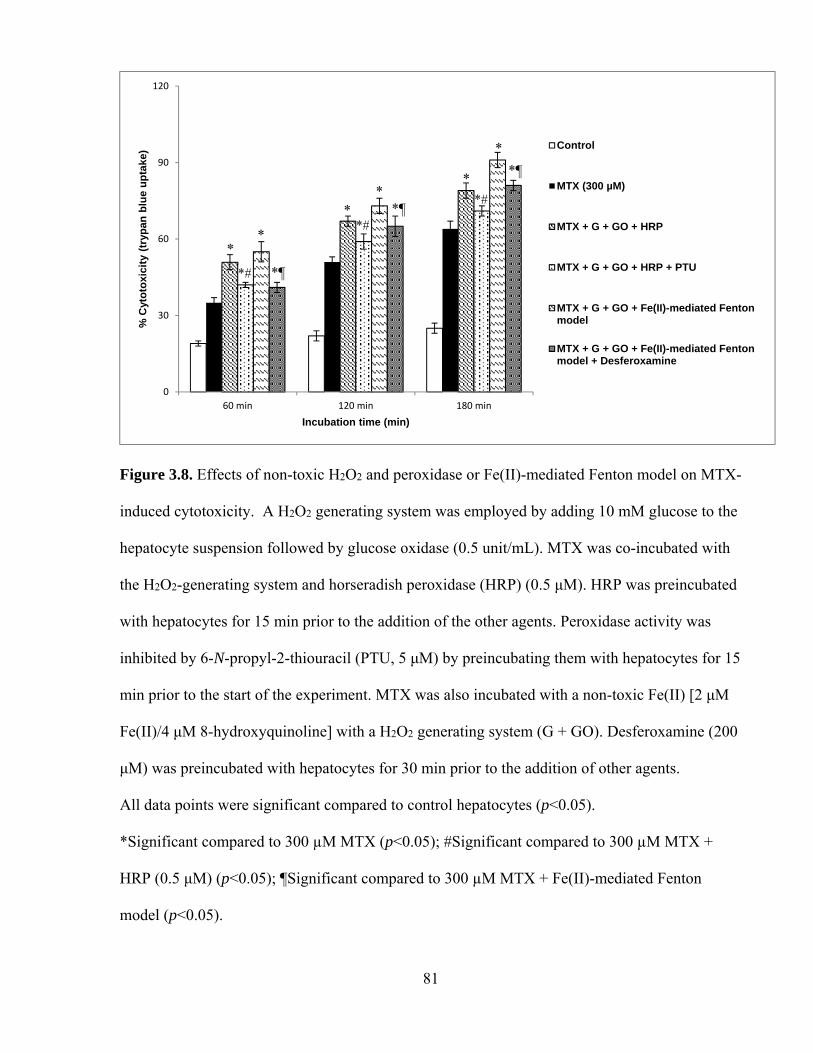
81
Figure 3.8. Effects of non-toxic H2O2 and peroxidase or Fe(II)-mediated Fenton model on MTX-
induced cytotoxicity. A H2O2 generating system was employed by adding 10 mM glucose to the
hepatocyte suspension followed by glucose oxidase (0.5 unit/mL). MTX was co-incubated with
the H2O2-generating system and horseradish peroxidase (HRP) (0.5 μM). HRP was preincubated
with hepatocytes for 15 min prior to the addition of the other agents. Peroxidase activity was
inhibited by 6-N-propyl-2-thiouracil (PTU, 5 μM) by preincubating them with hepatocytes for 15
min prior to the start of the experiment. MTX was also incubated with a non-toxic Fe(II) [2 μM
Fe(II)/4 μM 8-hydroxyquinoline] with a H2O2 generating system (G + GO). Desferoxamine (200
μM) was preincubated with hepatocytes for 30 min prior to the addition of other agents.
All data points were significant compared to control hepatocytes (p<0.05).
*Significant compared to 300 µM MTX (p<0.05); #Significant compared to 300 µM MTX +
HRP (0.5 μM) (p<0.05); ¶Significant compared to 300 µM MTX + Fe(II)-mediated Fenton
model (p<0.05).
0
30
60
90
120
60 min 120 min 180 min
% C
yto
toxi
city
(tr
ypan
blu
e u
pta
ke)
Incubation time (min)
Control
MTX (300 µM)
MTX + G + GO + HRP
MTX + G + GO + HRP + PTU
MTX + G + GO + Fe(II)-mediated Fentonmodel
MTX + G + GO + Fe(II)-mediated Fentonmodel + Desferoxamine
*#
*
*
**
*
*
*#*
*#
*

82
3.2.8 Protection against MTX-induced cytotoxicity using ROS scavengers and antioxidants
Significant cytoprotection against MTX-induced cytotoxicity in isolated rat hepatocytes was
achieved by the ROS scavenger and superoxide dismutase mimetic, TEMPOL (200 µM) (Table
3.4). Antioxidants such as Trolox (1 mM), mesna (2-mercaptoethanesulfonate, 1 mM), and
resveratrol (50 µM) also significantly protected hepatocytes which decreased ROS and H2O2
formation, and significantly increased % MMP (Table 3.4).

83
Table 3.4. Protection against MTX-induced cytotoxicity and oxidative stress in isolated rat
hepatocytes with various antioxidants, radical scavengers and an ATP generator.
Addition Cytotoxicity (%)
(Trypan blue uptake)
ROS
(FI unit)
% MMP
Incubation time 60 min 120 min 180 min 30 min 30 min
Control 19 ± 1 22 ± 2 25 ± 2 101 ± 3 100
+ MTX (300 µM) 35 ± 2a 51 ± 2a 64 ± 3a 148 ± 2a 86 ± 1a
+ Trolox (1 mM) 28 ± 2a,b 37 ± 3a,b 50 ± 3a,b 125 ± 1a,b 92 ± 3a,b
+ Mesna (1 mM) 20 ± 1b 25 ± 2b 38 ± 3a,b 115 ± 3a,b 96 ± 2a,b
+ TEMPOL (200 μM) 24 ± 2 35 ± 3a,b 45 ± 3a,b 128 ± 3a,b 93 ± 1a,b
+ Resveratrol (50 µM) 21 ± 2b 30 ± 1a,b 43 ± 2a,b 118 ± 4a,b 92 ± 2a,b
+ Fructose (10 mM) 27 ± 3a,b 41 ± 2a,b 53 ± 2a,b 145 ± 4a 98 ± 1b
Data are presented as Mean ± S.E.M. (n = 3). Fructose (10 mM) was added 30 min prior to
adding other chemicals. All modulating agents were non-cytotoxic compared to control
hepatocytes at the concentrations used (data not shown). Refer to the materials and methods
section for a description of the experiments performed and experimental conditions. Trolox, (±)-
6-hydroxy-2,5,7,8-tetramethylchromane-2-carboxylic acid; TEMPOL, 4-hydroxy-2,2,6,6-
tetramethylpiperidin-1-oxyl; mesna, 2-mercaptoethanesulfonate; resveratrol (3,5,4'-trihydroxy-
trans-stilbene).
aSignificant compared to control (only hepatocytes).
bSignificant compared to 300 µM MTX (p<0.05).
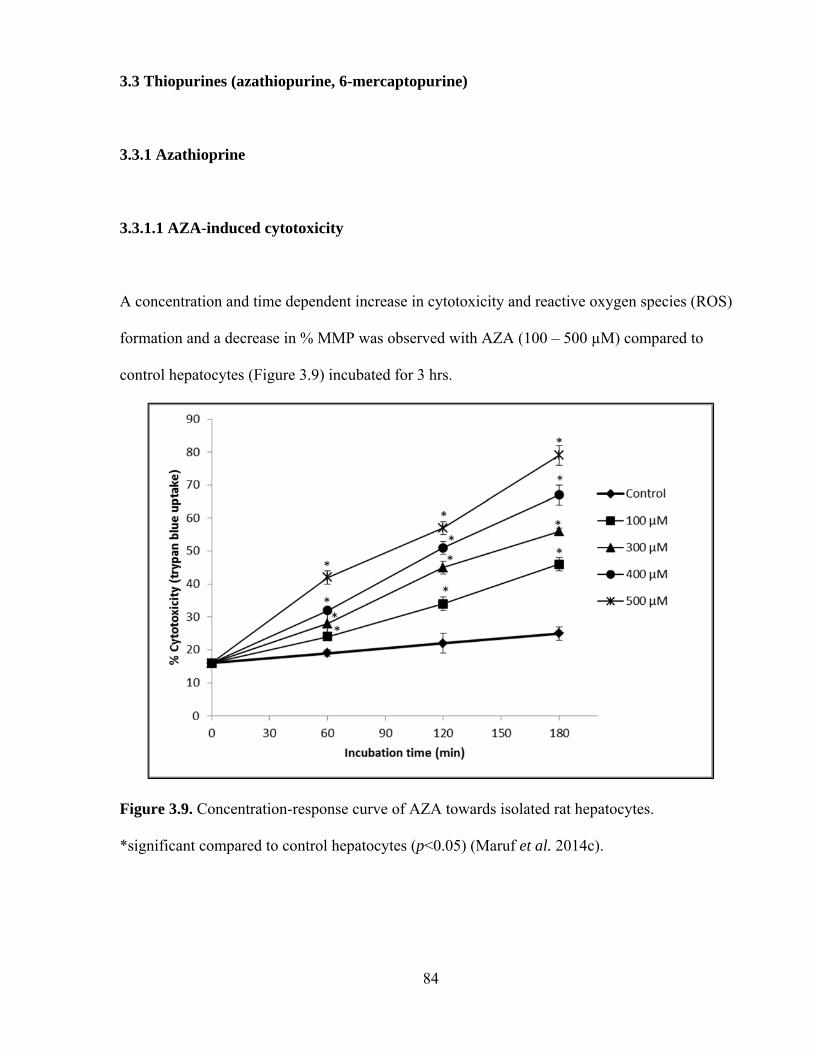
84
3.3 Thiopurines (azathiopurine, 6-mercaptopurine)
3.3.1 Azathioprine
3.3.1.1 AZA-induced cytotoxicity
A concentration and time dependent increase in cytotoxicity and reactive oxygen species (ROS)
formation and a decrease in % MMP was observed with AZA (100 – 500 µM) compared to
control hepatocytes (Figure 3.9) incubated for 3 hrs.
Figure 3.9. Concentration-response curve of AZA towards isolated rat hepatocytes.
*significant compared to control hepatocytes (p<0.05) (Maruf et al. 2014c).

85
3.3.1.2 Functions of GSH and xanthine oxidase in AZA-induced hepatotoxicity
GSH and xanthine oxidase dependence of AZA in isolated rat hepatocytes are presented in
Figure 3.10. AZA treatment (400 µM) significantly depleted hepatocyte GSH (Figure 3.11). A
significant increase in AZA-induced cytotoxicity and ROS formation were observed when
hepatocyte GSH was depleted by using 1-bromoheptane (200 µM) whereas addition of N-
acetylcysteine (1 mM), a cysteine precursor which generates GSH, prevented AZA-induced
cytotoxicity, ROS and H2O2 generation, and increased % MMP (Table 3.5) and hepatocyte GSH.
When we inhibited xanthine oxidase by preincubating hepatocytes with 20 μM
allopurinol, AZA-induced cytotoxicity was significantly prevented (Figure 3.10). A significant
decrease in ROS and H2O2 formation and an increase in % MMP were observed compared to
control hepatocytes with AZA-treated and xanthine oxidase-inhibited hepatocytes (Table 3.5). In
this study, the combined addition of N-acetylcysteine (1 mM) and allopurinol (20 µM) showed
nearly complete protection against AZA-induced cytotoxicity in rat hepatocytes.
3.3.1.3 Effects of aldehyde oxidase and cytochrome P450 inhibition on AZA-induced
cytotoxicity
Aldehyde oxidase inhibition (by 20 µM menadione) and cytochrome P450 inhibition (by 200
µM 1-ABT) had no significant effect on AZA-induced cytotoxicity in rat hepatocytes (data not
shown).
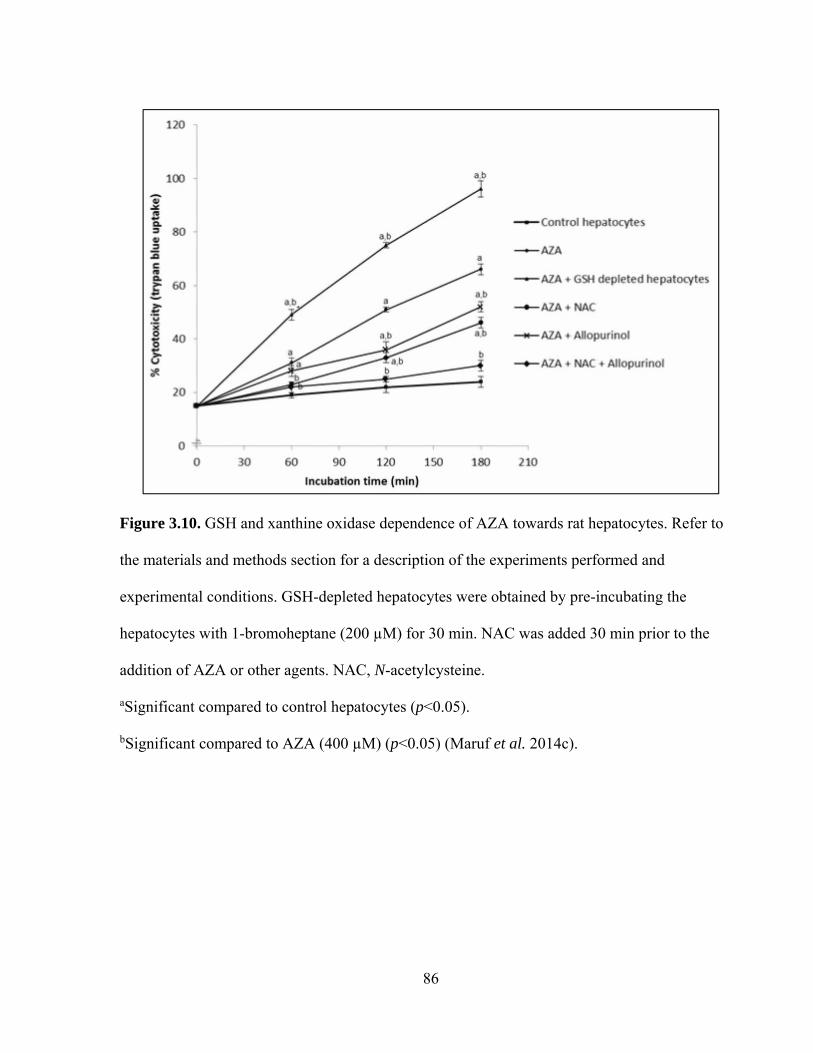
86
Figure 3.10. GSH and xanthine oxidase dependence of AZA towards rat hepatocytes. Refer to
the materials and methods section for a description of the experiments performed and
experimental conditions. GSH-depleted hepatocytes were obtained by pre-incubating the
hepatocytes with 1-bromoheptane (200 µM) for 30 min. NAC was added 30 min prior to the
addition of AZA or other agents. NAC, N-acetylcysteine.
aSignificant compared to control hepatocytes (p<0.05).
bSignificant compared to AZA (400 µM) (p<0.05) (Maruf et al. 2014c).

87
Table 3.5. AZA-induced oxidative stress with GSH depletion and protection with a GSH precursor, a
xanthine oxidase inhibitor, various antioxidants, and a radical scavenger.
Data are presented as mean ± S.E.M. (n = 3). Refer to the materials and methods section for a
description of the experiments performed and experimental conditions. FI, fluorescence
intensity; Mesna, 2-mercaptoethanesulfonate; Trolox, (±)-6-hydroxy-2,5,7,8-
tetramethylchroman-2-carboxylic acid; TEMPOL, 4-hydroxy-2,2,6,6-tetramethylpiperidin-1-
oxyl; DPPD, N,N'-diphenyl-p-phenylenediamine.
aSignificant compared to control (only hepatocytes) (p<0.05).
bSignificant compared to 400 µM AZA (p<0.05).
Addition ROS
(FI Unit)
MMP
(%)
H2O2
(nmoles/106 cells)
Incubation time 30 min 30 min 30 min Control 102 ± 1 100 6.34 ± 0.07
+ 400 µM AZA 139 ± 3a 86 ± 1a 8.11 ± 0.08a
+ GSH depleted hepatocytes 174 ± 5a,b 75 ± 1a,b 9.21 ± 0.13a,b
+ 1 mM N-acetylcysteine 124 ± 3a,b 89 ± 1a 6.97 ± 0.04a,b
+ 20 µM Allopurinol 132 ± 3a 92 ± 1a,b 7.75 ± 0.19a
+ 1 mM NAC + 20 µM Allopurinol 107 ± 1b 97 ± 2b 6.54 ± 0.14b
+ 1 mM Mesna 121 ± 3a,b 93 ± 2a,b 7.10 ± 0.18a,b
+ 1 mM Trolox 113 ± 3b 94 ± 2a,b 7.12 ± 0.02a,b
+ 200 μM TEMPOL 123 ± 4a,b 93 ± 1a,b 7.46 ± 0.18a,b
+ 2 µM DPPD 124 ± 2a,b 92 ± 2a,b 7.26 ± 0.06a,b

88
Figure 3.11. Effects of AZA on GSH and GSSG levels (nmoles/106 cells, measured at 30 min).
Refer to the materials and methods section for a description of the experiments performed and
experimental conditions.
*Significant compared to control (only hepatocytes) (p<0.05).
#Significant compared to 400 µM AZA (p<0.05).
0.00
10.00
20.00
30.00
40.00
50.00
60.00
GSH
(nmols/106cells)
0.00
0.50
1.00
1.50
2.00
2.50
3.00
3.50
4.00
4.50
GSSG (nmoles/106cells)
*
*
#
*#
# #
*
*#
*# *#

89
3.3.1.4 Protection against AZA-induced cytotoxicity using ROS scavengers and
antioxidants
A significant decrease in AZA-induced cytotoxicity (Table 3.6) and ROS formation (Table 3.5)
in isolated rat hepatocytes was achieved by the ROS scavenger and the superoxide dismutase
mimetic TEMPOL (200 µM). Potent antioxidants like Trolox (1 mM), DPPD (2 µM), and mesna
(1 mM), also significantly decreased AZA-induced cytotoxicity (Table 3.6), ROS and H2O2
formation and increased % MMP (Table 3.5).

90
Table 3.6. Effects of a ROS scavenger and various antioxidants on AZA-induced cytotoxicity in
isolated rat hepatocytes (Maruf et al. 2014c).
Addition Cytotoxicity (trypan blue uptake)
(%)
Incubation time 60 min 120 min 180 min
Control hepatocytes 19 ± 1 22 ± 1 24 ± 2
+ 400 µM AZA 31 ± 2a 51 ± 1a 66 ± 2a
+ 1 mM Mesna 23 ± 1b 33 ± 1a,b 45 ± 1a,b
+ 1 mM Trolox 24 ± 1b 35 ± 2a,b 43 ± 1a,b
+ 200 μM TEMPOL 24 ± 1b 38 ± 2a,b 49 ± 2a,b
+ 2 µM DPPD 26 ± 1a 37 ± 1a,b 47 ± 1a,b
Data are presented as mean ± S.E.M. (n = 3). Refer to the materials and methods section for a
description of the experiments performed and experimental conditions. Mesna, 2-
mercaptoethanesulfonate; Trolox, 6-hydroxy-2,5,7,8-tetramethylchroman-2-carboxylic acid;
TEMPOL, 4-hydroxy-2,2,6,6-tetramethylpiperidin-1-oxyl; DPPD, N,N'-diphenyl-p-
phenylenediamine.
aSignificant compared to control (only hepatocytes) (p<0.05).
bSignificant compared to 400 µM AZA (p<0.05).

91
3.3.2 6-Mercaptopurine
3.3.2.1 6-MP-induced cytotoxicity
A concentration and time-dependent increase in cytotoxicity was observed for 6-MP compared to
control hepatocytes (data not shown). Incubation of isolated rat hepatocytes for 2 hr with 1 mM
6-MP induced an approximate 50% loss in hepatocyte viability as measured by the trypan blue
exclusion assay (LC50, according to ACMS).
3.3.2.2 Effects of non-toxic H2O2 and peroxidase on 6-MP-induced cytotoxicity
Addition of a non-toxic concentration of H2O2 generated with peroxidase caused a significant
increase in 6-MP cytotoxicity (p<0.05) which was reversed by the addition of PTU (5 µM)
(Table 3.7). Furthermore, the addition of a H2O2 generating system and peroxidase caused a
significant increase in lipid peroxidation, ROS and a decrease in % MMP (Table 3.7) and GSH
levels (Figure 3.12) compared to control hepatocytes. A significant decrease in GSH levels was
observed when 6-MP was administered with the H2O2 generating system and peroxidase to rat
hepatocytes. This was prevented by 1 mM N-acetylcysteine (a GSH precursor).

92
3.3.2.3 Protection against 6-MP-induced cytotoxicity in rat hepatocytes
Significant protection against 6-MP-induced cytotoxicity with the H2O2 generating system and
peroxidase was achieved by a ROS scavenger, TEMPOL (200 µM) and an antioxidant, DPPD (2
µM). TEMPOL and DPPD also significantly increased % MMP and % GSH compared to 6-MP
treated hepatocytes with the H2O2 generating system and peroxidase (Table 3.7).
Table 3.7. Protection against 6-MP-induced cytotoxicity in rat hepatocytes.
Addition Cytotoxicity
(Trypan blue uptake, %)
MMP
(% control)
Incubation time 60 min 120 min 180 min 30 min
Control 18 ± 1 21 ± 2 24 ± 1 100
+ H2O2 generating system + peroxidase 21 ± 1 23 ± 2 26 ± 1 97 ± 2
+ 1 mM 6-MP 30 ± 3a 49 ± 3a 62 ± 2a 90 ± 3a,b
+ 1 mM 6-MP + H2O2 generating system + peroxidase 53 ± 3a,b 72 ± 2a,b 87 ± 2a,b 76 ± 1a,b
+ 5 µM PTU 41 ± 3a,c 58 ± 2a,c 72 ± 2a,c 85 ± 2a,c
+ 1 mM NAC 33 ± 2a,c 52 ± 4a,c 60 ± 1a,c 90 ± 2a,c
+ 200 μM TEMPOL 31 ± 2a,c 50 ± 3a,c 59 ± 4a,c 92 ± 4a,c
+ 2 µM DPPD 29 ± 4a,c 52 ± 3a,c 61 ± 1a,c 92 ± 3a,c
Data are presented as Mean ± S.E.M. Refer to the materials and methods section for a
description of the experiments performed and experimental conditions. PTU, 6-N-propyl
thiouracil; NAC, N-acetylcysteine; TEMPOL, 4-hydroxy-2,2,6,6-tetramethylpiperidin-1-oxyl;
DPPD, N,N'-diphenyl-p-phenylenediamine. aSignificant compared to control (only hepatocytes) (p<0.05). bSignificant compared to 1 mM 6-MP (p<0.05). cSignificant compared to 1 mM 6-MP + H2O2 generating system and peroxidase (p<0.05).
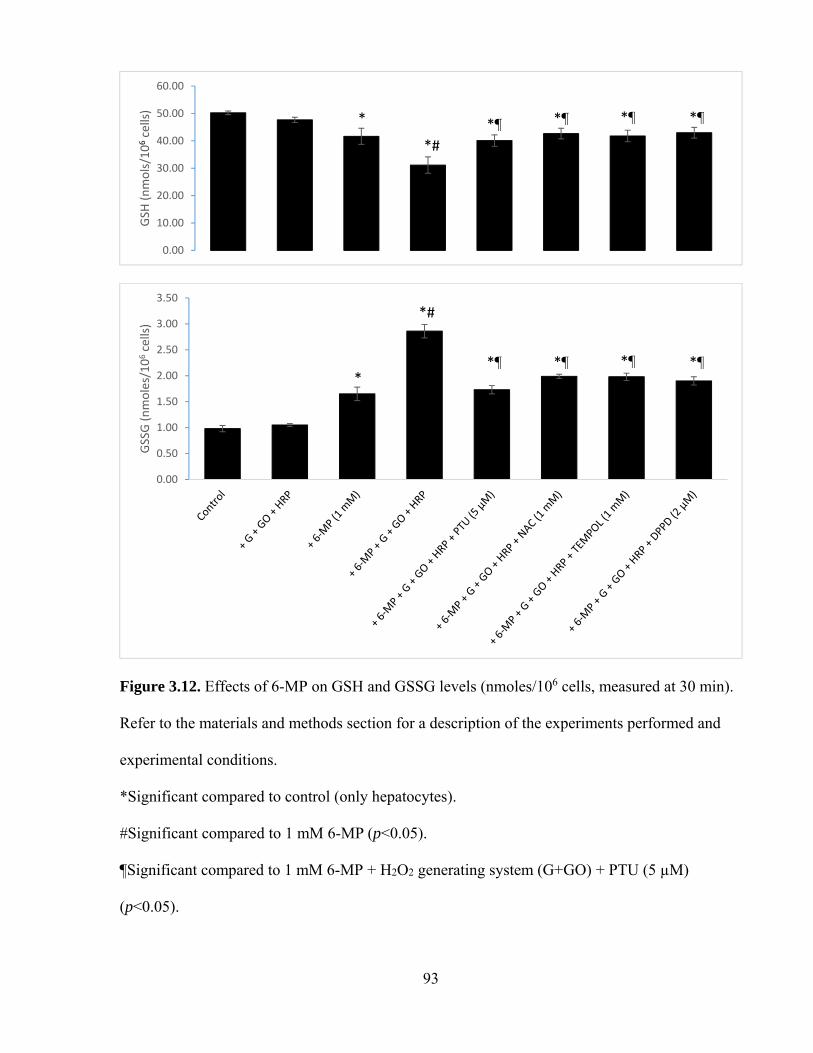
93
Figure 3.12. Effects of 6-MP on GSH and GSSG levels (nmoles/106 cells, measured at 30 min).
Refer to the materials and methods section for a description of the experiments performed and
experimental conditions.
*Significant compared to control (only hepatocytes).
#Significant compared to 1 mM 6-MP (p<0.05).
¶Significant compared to 1 mM 6-MP + H2O2 generating system (G+GO) + PTU (5 µM)
(p<0.05).
0.00
10.00
20.00
30.00
40.00
50.00
60.00
GSH
(nmols/106cells)
0.00
0.50
1.00
1.50
2.00
2.50
3.00
3.50
GSSG (nmoles/106cells)
*
*#
*¶ *¶ *
*
*
*#
*¶ *¶*
*
94
3.3.2.4 Electron spin resonance spectrometry spin trapping
Electron spin resonance (ESR) spectrometry spin trapping studies of 6-MP metabolism by
HRP/H2O2 were also conducted. A mixture of two radicals were trapped (A) using 5,5-dimethyl-
1-pyrroline-N-oxide (DMPO) which were previously reported (Moore et al., 1994) as purine-6-
thiyl (PS•) and superoxide radicals in a photooxidation system containing 6-MP with superoxide
dismutase. In the absence of H2O2 (C), HRP (D), and DMPO, HRP, and H2O2 (E), the spectrum
in A was not observed. When SOD was added to the mixture, a more intense spectrum of 6-MP
thiyl radical was observed. When the reaction was recorded after an additional 6 minutes (F),
only one spectrum remained which corresponded to DMPO-OH (B), (Figure 3.13).

95
Figure 3.13. ESR spectrometry spin trapping studies of 6-MP metabolism by HRP/H2O2.

96
CHAPTER 4: DISCUSSION
An individual’s sensitivity to xenobiotics may be increased by the presence of an inflammatory
response. Numerous studies have shown that a modest inflammatory response enhanced tissue
susceptibility to drugs/xenobiotics (reviewed in Roth et al., 1997). This raises the possibility that
the presence or absence of inflammation is another susceptibility factor for drug toxicity in
humans. This knowledge could allow identification of individuals who are susceptible and
provide a better understanding of the confluence of events required for this type of adverse
response (Tafazoli and O’Brien, 2008). Inflammatory episodes are common in people and
animals and are precipitated by numerous stimuli such as bacteria, viruses, and exposure to
toxins produced by microorganisms. Moreover, episodes of inflammation can be precipitated by
the mammalian gastrointestinal tract. In particular, endotoxin e.g. LPS released from gram-
negative bacteria can translocate across the intestinal mucosa into portal venous circulation (Roth
et al., 1997). Before drug-induced liver injury occurs in vivo, an inflammatory response usually
occurs and cells other than hepatocytes (e.g., Kupffer cells, macrophages) become activated.
Immune cells (e.g., neutrophils and macrophages) also infiltrate the liver. Therefore, it was
hypothesized that inflammatory episodes during drug therapy decreased the threshold for drug
toxicity and, thereby markedly increased the individual’s susceptibility to some
drugs/xenobiotics. Kupffer cells and resident liver macrophages normally play a role in
protecting hepatocytes from xenobiotics by phagocytosing incoming particles and releasing
cytoprotective cytokines (Roberts et al., 2007). Whilst there is little peroxidase activity in
hepatocytes, MPO is located in Kupffer cells that are resident macrophages of the human and
rodent liver (Brown et al., 2001). Furthermore, neutrophil infiltration of the liver in response to

97
inflammation can result in a 50 to 100-fold increase in hepatic MPO activity (Kato et al., 2000).
For these reasons, peroxidase activity is a useful marker for measuring neutrophil/macrophage
infiltration as well as the hepatic inflammatory response. Eosinophil infiltration (e.g., following a
parasite infection) can also cause a marked increase in liver eosinophil peroxidase activity
(Gharib et al., 1999). During the inflammatory response, H2O2 was also formed by activation of
the NADPH oxidase in the infiltrated cells. It is therefore reasonable to suggest that the large
increase in drug liver susceptibility could also be attributed to peroxidase catalyzed drug
oxidation to form reactive pro-oxidant radicals that could also be toxic to hepatocytes.
The present study aimed to validate an in vitro model to identify compounds that increase
hepatocyte susceptibility to drug/xenobiotic-induced toxicity. The in vitro inflammatory model
includes subjecting freshly isolated rat hepatocytes to a low non-toxic flow of a H2O2-generating
system using G/GO and supplementing it with either peroxidase or Fe(II) (MacAllister et al.,
2013a). HRP/H2O2 was used to effect in situ activation of drugs and to simulate MPO. Although
HRP and MPO are not homologous in structure, the catalytically active amino acid residues are
positioned in a similar manner (Welinder, 1985) and the metabolites produced are qualitatively
similar (Eastmond et al., 1986). Furthermore, HRP is a glycoprotein that is believed to be taken
up by fluid-phase endocytosis by hepatocytes (Scharschmidt et al., 1986; Straus, 1981). PTU
was used as a peroxidase inhibitor in this study as evidence for the involvement of HRP/H2O2
catalyzed formation of drug pro-oxidant radicals. PTU inhibits HRP in a noncompetitive form
(Zatón and Ochoa de Aspuru, 1995). Phagocytes generate O2•− and H2O2 and their interaction
results in an Fe(II)-catalyzed reaction to form •OH. Desferoxamine chelates Fe(II) in a
catalytically inactive form, and thus inhibition by desferoxamine has been employed as evidence
for the involvement of hydroxyl radicals generated by the Fenton reaction (Klebanoff and
98
Waltersdorph, 1988). Hydroxyl radical scavengers such as mannitol prevented hepatocyte
cytotoxicity (Tafazoli et al., 2008). Previously this laboratory used a nontoxic H2O2 generating
system with or without HRP to simulate inflammation in vivo. Recent examples from this
laboratory include chlorpromazine (MacAllister et al., 2013b), methanol and formaldehyde
(MacAllister et al., 2011), polychlorinated biphenyls (Chan et al., 2010), amodiaquine (Tafazoli
and O’Brien, 2009), isoniazid (Tafazoli et al., 2008), hydralazine (Tafazoli and O’Brien, 2008).
The system has recently been modified by adding Fe(II) to simulate the Fenton reaction that may
occur during an in vivo inflammation (MacAllister et al., 2013a).
4.1 Nitroaromatics (flutamide, nilutamide, nimesulide)
Drugs containing a nitroaromatic moiety (FLU, NIL, NIM) have been associated with organ–
selective toxicity, including rare cases of idiosyncratic hepatotoxicity. Nitroaromatic drugs are
mostly metabolically activated by various N-reductases to form reactive intermediates that
reduce oxygen to superoxide radicals, which cause oxidative stress. At low oxygen
concentrations, reduction to reactive nitrosoarylamine and hydroxylamine intermediates occurs
which also cause oxidative stress (Boelsterli et al., 2006). Incubation of freshly isolated rat
hepatocytes for 2 hrs at 37°C with 300 µM NIM, 300 µM NIL, and 75 µM FLU induced an
approximate 50% loss in hepatocyte viability as measured by the trypan blue exclusion assay
(LC50, according to ACMS). All of the tested drugs significantly increased cytotoxicity, ROS
formation, and decreased % MMP compared to controls (p<0.05) (Table-3.1). This laboratory
uses the LC50 to investigate potential cytotoxic mechanisms of drug or xenobiotic under
investigation. Although this in vitro study is limited for use at higher concentrations of the drug,

99
the ACMS techniques assume that the drug metabolic/toxic pathways at cytotoxic drug
concentrations in vitro at 2 hrs are similar to those that occur in vivo in 24 – 36 hrs i.e. high
dose/short time (in vitro) exposure simulates low dose/long time (in vivo) exposure (O’Brien and
Siraki, 2005). With 24 halobenzenes, it was found that the relative lethal concentrations required
to cause 50% cytotoxicity in 2 hrs at 37°C in vitro using hepatocytes isolated from
phenobarbital-induced Sprague-Dawley rats) correlated with hepatotoxicity in vivo at 24 – 54 hrs
(Chan et al. 2007). Moreover, using these techniques, the molecular hepatocytotoxic
mechanisms found in vitro for seven classes of xenobiotics/drugs were found to be similar to the
rat hepatotoxic mechanisms reported in vivo (O’Brien et al., 2004).
In the presence of a non-toxic G/GO + HRP with NIM (300 µM), NIL (300 µM), and
FLU (75 µM), a 2.1-, 1.5-, and 1.5-fold increase in toxicity at 2 hrs were observed, respectively.
From the observed results (Table 3.1), it can be suggested that NIM is the drug most susceptible
to inflammation. It had been demonstrated previously that a known NIM metabolite (hydroxy-
NIM) could be bioactivated by neutrophil and MPO, which generated ROS at the site of
inflammation. This may contribute to the toxicity associated with NIM (Yang et al., 2010) and is
in agreement with the current study.
A significant decrease in % MMP was found for all of the nitroaromatic drugs in this
study compared to the control hepatocytes indicating that all of the nitroaromatic compounds
were mitochondrial toxins (Table 3.1). A significant decrease in % MMP was also observed for
all of the drugs when G/GO+HRP was added and compared to the drug controls. NIM, due to its
nitro group, also acted as a potent protonophoretic uncoupler and NADPH oxidant on isolated rat
liver mitochondria and induced Ca2+ efflux or mitochondrial permeability transition (MPT)
within a concentration range which could be reached in vivo (Mingatto et al., 2000). Tay and

100
colleagues (2005) also showed that mitochondrial uncoupling causing MPT and ROS production
was a secondary effect. NIM exposure increased intracellular ROS, translocation of Bax (Bcl2-
associated X protein) and Bcl2 (B-cell lymphoma 2 protein) followed by mitochondrial
depolarization and cytochrome c release along with caspase-9/-3 activity confirming the
involvement of mitochondria in NIM-induced apoptosis (Tripathi et al., 2010). This study found
similar results with or without the inflammation system indicating that NIM is a mitochondrial
toxin (Table 3.1). In isolated mitochondria, NIL (100 µM) inhibited respiration that was
supported by substrates feeding electrons into complex I of the respiratory chain but did not
inhibit respiration that was supported by substrates donating electrons to complexes II, III or IV
(Berson et al., 1994). In sub mitochondrial particles, NIL (100 µM) decreased both oxygen
consumption mediated by NADH and the oxidation of NADH. However, the addition of SOD
and catalase did not alleviate this inhibition (Berson et al., 1991; 1993). These references need to
be separated out based on findings. A significantly decreased % MMP was found (p<0.05) in our
study with NIL indicating its mitochondrial toxin potential (Table 3.1).
Lipid peroxidation may also cause oxidative stress (Masaki et al., 1989; Starke and
Farber, 1985). However, if oxidative stress is due to redox cycling mediated by NADPH-
cytochrome c reductase, lipid peroxidation may be unchanged or even decreased (Comporti,
1989; Dubin et al., 1987, 1990, 1991; Engineer and Sridhar, 1989; Fau et al., 1992). NIL (0.5
mM) had been shown to decrease the formation of TBA-reactants by 70% when induced by
NADPH (0.2 mM) in rat liver microsomes (Berson et al., 1991). TBA-reactants in hepatocytes
were found to be unchanged after 4 hr of incubation with 0.5 mM NIL, but were significantly
decreased after 8 hr of incubation with 0.5 mM NIL. Mingatto and colleagues (2002) showed
that NIM both oxidized NADPH and uncoupled oxidative phosphorylation. The decrease of the

101
cell antioxidant defense due to NIM could be counterbalanced by the low generation of ROS
caused by uncoupling which prevents membrane lipid peroxidation. A similar increase/no
change in lipid peroxidation due to NIL or NIM was found in our study at doses used (p>0.05).
Addition of a non-toxic H2O2 generating system (to simulate inflammation in vitro as
described in the introduction/methods section) with HRP (0.5 µM) caused a significant increase
in FLU-induced cytotoxicity, ROS formation, lipid peroxidation, and a decrease in % MMP
(Table 3.2) and GSH levels (Figure 3.2) that was significantly decreased by the addition of PTU
(5 µM) (a peroxidase inhibitor) (Figure 3.1). Similar results were obtained when we used the
Fenton model. An iron chelator, desferoxamine (200 µM) decreased FLU-induced cytotoxicity
(Figure 3.1). This suggests that using the Fenton system to generate hydroxyl radicals increased
hepatocyte susceptibility to FLU-induced cytotoxicity, similar to that of the non-toxic H2O2 and
HRP inflammation system. Srinivasan and colleagues (1997) showed that FLU altered the
response of PMNs to other stimuli but did not by itself activate PMNs. FLU did not produce
superoxide radicals on PMNs but was cytotoxic to the hepatocytes in the presence of PMNs at
concentrations that were not toxic to hepatocytes alone. It was suggested that in some individuals
FLU simultaneously renders hepatocytes more susceptible to oxidant-mediated injury that can
initiate infiltration of PMNs into the liver and increases PMN responsiveness to endogenous
activators (Srinivasan et al., 1997). The incidence of FLU-induced hepatotoxicity was found in
only 0.36% of 1091 consecutively treated patients with prostate cancer indicating that most
patients do not experience liver toxicity. FLU-induced hepatotoxicity is often associated with
inflammation (Gomez et al., 1992; Rosman et al., 1993). Moreover, serum transaminases are
elevated but return to normal in some patients without alteration of treatment, whereas for other
patients reduction of FLU dose is required (Dourakis et al., 1994; Wysowski et al., 1993). Some
102
cases were found to be associated with blood eosinophilia (Hart and Stricker, 1989). Therefore it
can be speculated that an episode of inflammation during FLU therapy could decrease the
threshold for FLU toxicity, and thereby renders an individual susceptible to a toxic reaction that
would otherwise not occur.
Drug-induced liver injury is often caused by the formation of reactive metabolites, which
may lead to either toxic or immune liver toxicity (Pessayre and Larrey, 1991). Unlike the related
antiandrogen NIL, FLU was not noticeably reduced to a nitroanion free radical by NADPH-
cytochrome P450 reductase. Instead, rat and human microsomal cytochrome P450 oxidatively
metabolized FLU to electrophilic metabolite(s), which bound covalently to microsomal proteins
(Berson et al., 1993). However, the production of nitro-anion free radical was also shown by
Núñez-Vergara and colleagues (2001). When FLU was added to rat hepatocyte and PMN co –
cultures, a significant increase in cytotoxicity was observed which was not observed when FLU
was added to rat hepatocytes and PMNs separately. This suggests that a cytochrome P450-
generated metabolite of FLU produced by hepatocytes is a more potent stimulus for activation of
PMNs than FLU itself (Srinivasan et al., 1997). Further studies are required to confirm that FLU
and/or its metabolite(s) are responsible for FLU-induced hepatotoxicity with or without
inflammation.
FLU may also target hepatic mitochondria and may exert oxidative stress that can lead to
overt hepatic injury (Kashimshetty et al., 2009). In the current study, a decreased % MMP with
the inflammation model was found for FLU, indicating its potential role as a mitochondrial toxin
(Table 3.2). FLU (50 µM) markedly inhibited respiration (mainly at the level of complex I) in
isolated male rat liver mitochondria and at higher concentrations (1 mM) decreased ATP levels
in isolated male rat hepatocytes (Fau et al., 1994).

103
A significant decrease in GSH levels was also observed when FLU was administered
with the H2O2 generating system and peroxidase to rat hepatocytes, potentially increasing
hepatocyte susceptibility to oxidant-mediated injury. This was prevented by 1 mM N-
acetylcysteine (Table 3.2). N-acetylcysteine is frequently used as an acetylated precursor for
GSH in hepatocytes. N-acetylcysteine has been used as a tool for investigating the role of ROS in
numerous biological and pathological processes. The usefulness of N-acetylcysteine in
modulating different diseases that include cardiovascular diseases, cancer, and chemical/metal
toxicity has been reviewed by Zafrullah and colleagues (2003). FLU (1 mM) was reported to
covalently bind reactive electrophilic metabolites to male rat hepatocyte proteins. FLU also
decreased the GSH/GSSG ratio and decreased total protein thiols. This was associated with an
early increase in phosphorylase a activity (a Ca2+ dependent enzyme) and a decrease in
cytoskeleton-associated protein thiols, the formation of plasma membrane blebs, the release of
lactate dehydrogenase and a loss of cell viability (Berson et al., 1993; Fau et al., 1994).
Potent antioxidants, Trolox (1 mM) (the water-soluble vitamin E analogue) and
resveratrol (50 µM) (a polyphenolic compound) significantly decreased FLU-induced
cytotoxicity, ROS, and LPO formation, and increased % MMP (Table 3.2) and GSH levels
(Figure 3.2) compared to control hepatocytes. Resveratrol is found in a wide variety of dietary
sources including grapes, plums, and peanuts. It is also present in wines, especially red wines
(Tunali-Akbay et al., 2010). Resveratrol is both a free radical scavenger and a potent antioxidant
because of its ability to promote the activities of a variety of antioxidant enzymes (Gusman et al.,
2001; Leonard et al., 2003). It has three different antioxidant mechanisms: (i) competition with
coenzyme Q to decrease the oxidative chain complex, the site of reactive oxygen species
generation, (ii) scavenging of O2•− radicals formed in the mitochondria, and (iii) inhibition of

104
lipid peroxidation induced by Fenton reaction products (Zini et al., 1999). Trolox is a
hydrophilic analogue of vitamin E and an established intracellular free radical scavenger (Hamad
et al., 2010).
A significant protection against FLU-induced cytotoxicity with the H2O2 generating
system and peroxidase was also achieved by a ROS scavenger, TEMPOL (200 µM) and an
antioxidant, DPPD (2 µM). Protective agents also significantly increased % MMP and GSH
levels and decreased lipid peroxidation compared to FLU treated hepatocytes with the H2O2
generating system and peroxidase (Table 3.2). This definitely suggests the involvement of ROS
in FLU-induced hepatotoxicity. TEMPOL and other stable nitroxide radicals have long been
known to protect from a variety of oxidative stress-mediated injury in laboratory animals. It can
mimic superoxide dismutase activity. It can also inhibit Fenton chemistry by the ability to
oxidize transition metal ions, termination of radical chain reactions by radical recombination, and
acceptance of electrons from mitochondrial electron transport chains (Kagan et al., 2007; Soule
et al., 2007). TEMPOL was also reported to inhibit MPO-mediated protein nitration (Vaz and
Augusto, 2008). The potent antioxidant DPPD has been reported to enlarge the pool size of lipid
soluble antioxidants in the whole liver cell and especially in the cytoplasmic membranes. It has
also been reported to decrease lipid peroxidation (Di Luzio and Hartman, 1969). A preliminary
treatment with DPPD prevented liver fatty infiltration after carbon tetrachloride poisoning
(Torrielli et al., 1974).
Data obtained from this study suggests that FLU-induced cytotoxicity involves a H2O2
and peroxidase/Fe(II)-catalyzed production of a FLU pro-oxidant radical leading to glutathione
depletion, lipid peroxidation, and mitochondrial toxicity.

105
4.2 Methotrexate
One of the most serious side effects of MTX therapy is hepatic toxicity (Mardini & Record,
2005). Mild hepatitis, cholestasis, fatty changes, fibrosis, and cirrhosis have been reported in
patients receiving MTX for malignant disorders (Hersh et al., 1966) whereas Penalva Polo and
colleagues (2002) reported an acute liver failure in a patient with MTX therapy. A concentration
and time dependent increase in cytotoxicity, ROS formation, and a decrease in % MMP were
also observed for MTX (50 – 500 µM) compared to control hepatocytes over a 3 hr incubation
period (Figure 3.3). The LC50 (ACMS) was 300 µM for MTX. MTX-induced cytotoxicity was
reported to be associated with ROS formation and the depletion of cellular and mitochondrial
GSH and ATP (Babiak et al., 1998; Chang et al., 2013; Chen et al., 1998; Neuman et al., 2001;
Phillips et al., 2003).
In its reduced form, intracellular GSH is an effective antioxidant and is necessary for the
detoxification of xenobiotics (Neuman et al., 2001). A significant increase in MTX-induced
cytotoxicity, ROS formation, and a significant decrease in % MMP was observed when GSH
was depleted by adding 1-bromoheptane (200 µM) to hepatocytes whereas addition of 1 mM N-
acetylcysteine significantly decreased MTX-induced cytotoxicity (Figure 3.4), ROS formation
and increased % MMP (p<0.05) (Table 3.3). This indicates that GSH was involved in MTX
detoxification. MTX treatment (300 µM) significantly depleted GSH (Figure 3.5) in rat
hepatocytes whereas N-acetylcysteine significantly increased GSH. Several studies have reported
that MTX-induced cytotoxicity resulted from the depletion of cellular and mitochondrial GSH
leading to oxidative stress (Babiak et al., 1998; Chang et al., 2013; Neuman et al., 2001; Phillips
et al., 2003). Silymarin, a natural antioxidant that increases mitochondrial GSH, was reported to
be protective against MTX-induced cytotoxicity when ethanol or acetaminophen was added

106
along with MTX in human hepatocytes in vitro (Phillips et al., 2003). GST enzymes detoxify
xenobiotics or ROS by catalyzing the nucleophilic attack by GSH on electrophilic carbon, sulfur,
or nitrogen atoms on drug/xenobiotic substrates or ROS. In the process of donating an electron,
GSH itself becomes reactive and then reacts with another reactive GSH to form GSSG. Genetic
polymorphism of the GST gene (GSTM1 positive/null) was reported to be associated with MTX-
induced hepatotoxicity in patients with childhood acute lymphoblastic leukemia and malignant
lymphoma (Imanishi et al., 2007). These results along with our study results suggest the definite
involvement of GSH in the detoxification of MTX.
In this study, MTX (300 µM) treatment significantly increased H2O2 levels compared to
control rat hepatocytes (Figure 3.6). Catalase catalyzes the decomposition of H2O2 to water and
oxygen without the production of free radicals. Without catalase, H2O2 can form hydroxyl
radicals that are highly toxic to cellular macromolecules. When we inhibited catalase in
hepatocytes using 3-AT (20 mM), a significant increase in MTX-induced cytotoxicity (Figure
3.4), ROS formation, and a significant decrease in % MMP (Table 3.3) were observed. Direct
addition of catalase significantly decreased MTX-induced cytotoxicity at 60 min but was not
protective at 120 min and 180 min (Figure 3.4). Addition of catalase to MTX-treated hepatocytes
also significantly decreased ROS formation and increased % MMP (Table 3.3) and H2O2 levels
(Figure 3.6). MTX-induced generation of H2O2 was previously reported in stimulated peripheral
polymorphonuclear neutrophils (Gressier et al., 1994) as well as monocytes (Phillips et al.,
2003). Several in vitro and in vivo animal studies also reported that MTX administration
significantly altered antioxidant enzymes such as superoxide dismutase, catalase, glutathione
peroxidase, glutathione reductase in liver, intestinal mucosa, and spinal cord tissues
107
(Coleshowers et al., 2010; Uz E et al., 2005; Uzar et al., 2006). Our study results suggest that
MTX-induced generation of H2O2 caused oxidative stress and mitochondrial injury.
MTX undergoes metabolic degradation to 7-OH-MTX by nonspecific aldehyde oxidases
in the rat liver (Bremnes et al., 1991a; Wolfrom et al., 1990). In human liver, both aldehyde
oxidase and xanthine oxidase have been proposed to be involved in MTX-oxidation (Chládek et
al., 1997). However, no involvement of aldehyde oxidase or xanthine oxidase in hydrolyzing
MTX in rat and human has also been reported (Johns and Valerino et al., 1971; Yu et al., 1989)
in earlier studies. When we inhibited aldehyde oxidase using menadione (20 µM), a significant
decrease in MTX-induced cytotoxicity was observed at 60 min and 120 min (Figure 3.4).
Menadione also significantly decreased ROS and H2O2 formation and increased % MMP (Table
3.3). Xanthine oxidase inhibition and cytochrome P450 inhibition had no significant effect on
MTX-induced cytotoxicity and ROS formation. This suggests that the conversion of 7-OH-MTX
from MTX by aldehyde oxidase increased MTX-induced cytotoxicity and ROS formation in rat
hepatocytes that can be decreased by the aldehyde oxidase inhibitor, menadione. A similar result
was also found with another aldehyde oxidase inhibitor, amsacrine.
Both aldehyde oxidase and xanthine oxidase are known to produce ROS. Aldehyde
oxidase has been reported to cause oxidation of NADH in the presence of O2 producing large
amounts of O2•−. Aldehyde oxidase also mobilizes iron from ferritin (Shaw and Jayatilleke,
1990) which can catalyze O2•− radical reduction to form the highly reactive and more toxic •OH
radical that could directly react with NO to produce the powerful oxidant, ONOO−. Thus
aldehyde oxidase functions as an important cellular source of ROS under normal physiological
conditions. Under various pathological conditions such as ischemia, alcohol-induced liver
diseases, and diabetes, this ROS production would increase due to the increase in tissue NADH

108
level, thus contributing to oxidative stress and free-radical-mediated tissue injury (Kundu et al.,
2012).
7-OH-MTX, a major metabolite of MTX in the liver, was once considered to be a
detoxification product due to its lower cytotoxic action in proliferating cells (Johns et al. 1966).
However, this metabolite has been found to induce acute renal and hepatic toxicity in rats in
several studies after high dose MTX therapy (Bremnes et al., 1991a; Smeland et al., 1994; 1996).
Rats with 7-OH-MTX levels of 1 mM, which is lower than the levels of this metabolite routinely
found in patients on high-dose MTX, demonstrated intolerable toxicity and some rats died within
8 hr (Fuskevåg et al., 2000). 7-OH-MTX has also been reported to influence cellular entry,
polyglutamation, and efflux of MTX in vitro (Fabre et al., 1984). Amsacrine (Bremnes et al.,
1991a) and vindesine (Bremnes et al., 1991b) were reported to reduce MTX-induced clinical
toxicities in the rat model by inhibiting MTX-hydroxylation i.e. by inhibiting aldehyde oxidase.
In two clinical studies, MTX and vindesine co-treatment were found to be effective (Bore et al.,
1986; Lena et al., 1984). Similar cytoprotection was found in this study using menadione, which
inhibited aldehyde oxidase in isolated rat hepatocytes. Thus inhibition of aldehyde oxidase could
be beneficial in combination MTX chemotherapy by reducing (a) the generation of ROS and (b)
the formation 7-OH-MTX. However, clinical studies are required to establish the effect of 7-OH-
MTX levels on aldehyde/xanthine oxidase activity as a marker for MTX associated hepatic and
renal toxicity.
Although several in vivo studies reported increased lipid peroxidation in rat livers after
administration of MTX (Banji et al., 2011; Coleshowers et al., 2010; Sener et al., 2006; Tunali-
Akbay et al., 2010), this study observed no significant effect of MTX on lipid peroxidation
probably due to the higher in vitro concentration of MTX used in the study.

109
MTX (300 µM) significantly decreased % MMP (Table 3.3) and ATP levels (Figure 3.7)
in rat hepatocytes whereas addition of 10 mM fructose (pre-incubated for 15 min) significantly
increased % MMP (Table 3.3) and ATP (Figure 3.7) and delayed MTX-induced cytotoxicity
(Table 3.4). Fructose is a glycolytic substrate that has been reported to increase % MMP and
ATP and subsequently decreased cell death in hepatocytes when exposed to the known
mitochondrial toxicant, MPTP (1-methyl-4-phenyl-1,2,3,6-tetrahydropyridine) (Wu et al., 1990).
This suggests that MTX caused a decrease in % MMP and ATP concentration in our study,
leading to hepatocyte cell death in isolated rat hepatocytes. Studies on isolated rat mitochondria
reported that MTX inhibited state III respiration (Yamamoto et al., 1988), decreased membrane
potential (ΔΨ), and ionic conductivity of the mitochondrial inner membrane (Yamamoto et al.,
1989). Tabassum and colleagues (2010) also reported that MTX caused a significant decrease in
mitochondrial GSH levels and a significant increase in mitochondrial lipid peroxidation, protein
carbonyl content, and superoxide generation in isolated rat liver mitochondria.
Addition of a non-toxic H2O2 generating system with HRP (0.5 µM) caused a significant
increase in MTX-induced cytotoxicity that was significantly decreased by the addition of PTU (5
µM) (Figure 3.8). Furthermore, the addition of a H2O2 generating system and peroxidase caused
a significant increase in lipid peroxidation, ROS formation and a decrease in % MMP (data not
shown). Similar results were obtained when the Fenton model was used. An iron chelator,
desferoxamine (200 µM) decreased MTX-induced cytotoxicity likely by inhibiting the Fenton
reaction through chelation of iron (Figure 3.8). This suggests that using the Fenton system to
generate hydroxyl radicals increased hepatocyte susceptibility to MTX-induced cytotoxicity,
similar to that of the non-toxic H2O2 and HRP inflammatory model. Therefore, an episode of
inflammation during MTX therapy could decrease the threshold for MTX toxicity, and thereby

110
render an individual susceptible to a toxic reaction that would otherwise not occur. Increased
MPO activity during MTX therapy has been reported in several in vivo animal studies in hepatic
tissues (Sener et al., 2006; Tunali-Akbay et al., 2010). Kolli and colleagues (2009) provided
evidence that neutrophil infiltration and oxidative damage led to renal damage in rats and
suggested that administration of inhibitors of MPO as an adjuvant therapy could be beneficial in
patients with MTX-induced renal damage. This study suggests a similar recommendation for
adjuvant therapy for treating MTX-induced hepatotoxicity.
Significant cytoprotection against MTX-induced cytotoxicity in isolated rat hepatocytes
was achieved by the ROS scavenger and superoxide dismutase mimic, TEMPOL (200 µM)
(Table 3.4). Antioxidants such as Trolox (1 mM), mesna (1 mM), and resveratrol (50 µM) also
significantly protected hepatocytes, decreased ROS and H2O2 formation, and significantly
increased % MMP (Table 2). This definitely suggests the involvement of ROS in MTX-induced
hepatotoxicity. Mesna (a thiol containing effective antioxidant) was previously found to be
protective in stimulated peripheral blood neutrophils against MTX-induced H2O2 production and
has been proposed for use in combination with cancer therapy during the oxidative burst
(Gressier et al., 1994). Trolox (=< 0.5 mM) was reported to inhibit apoptosis induced by MTX in
keratinocytes (Barry et al., 1998). Previous in vivo rat studies showed the protective effects of
resveratrol against MTX-induced hepatotoxicity (Dalaklioglu et al., 2013; Tunali-Akbay et al.,
2010).
Data obtained from the ACMS techniques suggests that MTX-induced cytotoxicity
towards isolated rat hepatocytes may involve several pathways: an aldehyde oxidase-catalyzed
production of a toxic metabolite (7-OH-MTX), a H2O2 and peroxidase/Fe(II) catalyzed
production of a MTX pro-oxidant radical and MTX-induced generation of H2O2 and other ROS.

111
Oxidative stress leads to mitochondrial injury and ultimately hepatocyte death. The GSH
precursor, N-acetylcysteine; the aldehyde oxidase inhibitor, menadione; and several other
antioxidants significantly prevented hepatocyte death suggesting that combination therapy with
these agents could be beneficial therapeutically to prevent or reduce MTX-induced
hepatotoxicity. In vivo animal and clinical studies are warranted to test their therapeutic
effectiveness against MTX-induced hepatotoxicity.
Possible routes of MTX-induced cytotoxicity and oxidative stress in isolated rat
hepatocytes are presented in Figure 4.1.
Figure 4.1. Proposed pathways of MTX-induced cytotoxicity in isolated rat hepatocytes. PTU,
6-N-propyl-2-thiouracil; GSH, reduced glutathione; GSSG, Glutathione disulfide; GST,
glutathione S-transferase; SOD, Superoxide dismutase.
H2O2 and peroxidase
7-OH-MTX Aldehyde oxidase
PTU
Methotrexate Pro-oxidant radical
ROS Formation
OXIDATIVE STRESS Antioxidants
ROS scavengers and Fe(II) chelator
GSH
GSSH
H2O2
H2O
Catalase
Toxicity
GST
O2‐• SOD
•HO Fe2+
Menadione

112
4.3 Thiopurines (azathioprine, 6-mercaptopurine)
Three thiopurine drugs (AZA, 6-MP, 6-TG) have been commonly used in the last forty years
(Petit et al., 2008). In most of the cases, hepatotoxicity is an unpredictable side effect of these
drugs, whose pathogenic mechanism still remains unknown. Previous studies performed with rat
hepatocyte primary cultures showed that AZA metabolism leads to intracellular GSH depletion,
mitochondrial injury, metabolic activity reduction, decreased ATP levels, and cell death (Lee and
Farrell, 2001; Menor et al., 2004; Petit et al., 2008). In the current study, a concentration and
time dependent increase in cytotoxicity and ROS formation and a decrease in % MMP were
observed with AZA (100 – 500 µM) compared to control hepatocytes (Figure 3.9). The LC50
according to ACMS was found to be 400 µM.
AZA has been reported to conjugate GSH to form 6-MP, catalyzed by GSTs. This
consumes GSH, which is normally present in abundance in hepatocytes. (DeLeve, 1996;
Kaplowitz, 1997; Lee and Farrell, 1999; 2001). AZA treatment (400 µM) significantly depleted
hepatocyte GSH (Figure 3.11) in this study. A significant increase in AZA-induced cytotoxicity
and ROS formation were observed when hepatocyte GSH was depleted using 1-bromoheptane
(200 µM) whereas addition of N-acetylcysteine (1 mM, a cysteine precursor which generates
GSH) prevented AZA-induced cytotoxicity (Figure 3.10), ROS and H2O2 generation, and
increased % MMP (Table 3.5) and hepatocyte GSH, which indicates that GSH was required for
AZA detoxification. A similar depletion of GSH levels and mitochondrial toxicity during AZA
metabolism was observed in previous studies in primary cultures of rat hepatocytes at both toxic
(25 – 250 µM) and clinically relevant AZA concentrations (0.5 – 5 µM) (Lee and Farrell, 2001;
Menor et al., 2004; Petit et al., 2008). However, human liver parenchymal cells were reported to

113
be much less sensitive than rat hepatocytes to thiopurine treatments (Petit et al., 2008).
Protective effects of N-acetylcysteine against AZA-induced hepatotoxicity have been reported in
several in vitro studies (Lee and Farrell, 2001; Menor et al., 2004; Wu et al., 2006) and in vivo
animal studies (Raza et al., 2003) which clearly indicate a potential role of GSH in AZA-induced
cytotoxicity.
Xanthine oxidase is proposed to be involved in several steps of AZA metabolism such as
in the direct metabolism of AZA to form an inactive metabolite, 1-methyl-4-nitrothioimidazole,
in the conversion of AZA to 6-MP, and formation of 6-thiouric acid from 6-MP (Lee and Farrell,
2001; Menor et al., 2004; Tapner et al., 2004). Xanthine oxidase is well known to produce ROS
(Kelley et al., 2010; Tapner et al., 2004). The molybdoflavin enzyme xanthine oxidoreductase
(XOR) catalyzes the terminal two steps of purine degradation (from hypoxanthine to xanthine
and from xanthine to uric acid) in humans. XOR is transcribed as a single gene product, xanthine
dehydrogenase (XDH). Under inflammatory conditions, posttranslational modification by
oxidation of critical cysteine residues or limited proteolysis converts XDH to xanthine oxidase
(Amaya et al., 1990; Kelley et al., 2010). Substrate-derived electrons at the molybdenum (Mb)
cofactor of xanthine oxidase reduce O2 at the FAD cofactor both univalently, generating O2•−,
and divalently, forming H2O2. However, conversion to xanthine oxidase is not a requisite for
ROS production, as XDH displays partial oxidase activity under conditions such as the
ischemic/hypoxic microenvironment encountered in vascular inflammation (Harris et al., 1997).
This same inflammatory milieu leads to enhanced xanthine oxidase levels and thus increased
xanthine oxidase-derived ROS formation, resulting in activation of redox dependent cell
signaling reactions and alterations in vascular function (Kelley et al., 2010). The adverse effect
of xanthine oxidase is exemplified by numerous studies in which inhibition of xanthine oxidase
114
attenuated symptoms of several vascular disease including congestive heart failure, sickle cell
anemia, and diabetes (Aslan et al., 2001; Butler et al., 2000; Desco et al., 2002; Farquharson et
al., 2002).
The possibility that xanthine oxidase may play a role in AZA-induced tissue injury has
been raised by the observation that patients taking allopurinol, a xanthine oxidase inhibitor,
experience less nephrotoxicity during rejection episodes after renal transplantation (Chocair et
al., 1994). When we inhibited xanthine oxidase by preincubating rat hepatocytes with allopurinol
(20 μM), AZA-induced cytotoxicity was significantly prevented (Figure 3.10). A significant
decrease in ROS and H2O2 formation and an increase in % MMP were observed compared to
control hepatocytes with AZA-treated and xanthine oxidase-inhibited hepatocytes (Table 3.5).
Xanthine oxidase inhibition by allopurinol was also found to be protective in primary rat
hepatocytes (Tapner et al., 2004). A recent case study reported that the addition of allopurinol
with appropriate AZA dose reduction may correct AZA-induced hepatotoxicity and can induce
remission of IBD (Al-Shamma et al., 2013). In AZA or 6-MP non-responders, addition of
allopurinol also demonstrated safety and efficacy for long-term maintenance in IBD patients
(Leung et al., 2009; Sparrow et al., 2007). In our study, the combined addition of N-
acetylcysteine (1 mM) and allopurinol (20 µM) showed nearly complete protection against AZA-
induced cytotoxicity in rat hepatocytes. The combination of these two agents for improved AZA
therapeutic efficacy needs future clinical experimentation.
Aldehyde oxidase inhibition (by 20 µM menadione) and cytochrome P450 inhibition (by
100 µM 1-ABT) had no significant effect suggesting that, in rat hepatocytes, aldehyde oxidase
and cytochrome P450 are not involved in AZA metabolism pathways at the AZA concentrations
used in this study.

115
A significant decrease in AZA-induced cytotoxicity (Table 3.6) and ROS formation
(Table 3.5) in isolated rat hepatocytes was achieved by the ROS scavenger and the superoxide
dismutase mimic TEMPOL (200 µM) suggesting the involvement of ROS. Potent antioxidants
like Trolox (1 mM), DPPD (2 µM), and mesna (1 mM), also significantly decreased AZA-
induced cytotoxicity (Table 3.6), ROS and H2O2 formation and increased % MMP (Table 3.5)
suggesting the involvement of oxidative stress in AZA-induced cytotoxicity in hepatocytes.
Data obtained from the ACMS technique suggests that AZA toxicity in isolated rat
hepatocytes involves two distinct pathways (i) a xanthine oxidase-catalyzed production of an
inactive metabolite (1-methyl-4-nitrothioimidazole), (ii) a GST-catalyzed pathway leading to
GSH depletion followed by xanthine oxidase-catalyzed formation of inactive metabolites.
Addition of a GSH precursor, N-acetylcysteine and the xanthine oxidase inhibitor, allopurinol,
together significantly reversed cytotoxicity which raises the possibility of using these two agents
therapeutically. Several antioxidants also prevented hepatocyte death suggesting antioxidant
therapy may be useful therapeutically to prevent or decrease AZA-induced hepatotoxicity. In
vivo animal and clinical studies are warranted to test their therapeutic effectiveness against AZA-
induced hepatotoxicity. Possible routes of cytotoxicity of AZA in isolated rat hepatocytes are
presented in Figure 4.2.

116
Figure 4.2. Proposed routes of AZA-induced cytotoxicity in isolated rat hepatocytes. XO,
xanthine oxidase; GST, glutathione S-transferase; NAC, N-acetylcysteine; HGPRT,
hypoxanthine gunanine phosphoribosyl transferase; TPMT, thiopurine S-methyl transferase
(Maruf et al. 2014c).
Addition of a non-toxic H2O2 generating system with peroxidase caused a significant
increase in 6-MP (1 mM, LC50 according to ACMS) cytotoxicity (p<0.05) which was reversed
by the addition of PTU (5 µM) (Table 3.7). Furthermore, the addition of a H2O2 generating
system and peroxidase caused a significant increase in ROS formation and a decrease in % MMP
compared to control hepatocytes (Table 3.7). A similar effect was also found for AZA but it
1-Methyl-4-nitrothioimidazole
XO
Glutathione Depletion
ROS Formation
Oxidative Stress
Mitochondrial Injury
6-Mercaptopurine 6-Thiouric acid XO
TOXICITY
NAC
ROS Scavenger
Allopurinol
6-Thiogunanine 6-Methyl mercaptopurine
GST
HGPRT TPMT
Antioxidant
Azathioprine
Allopurinol

117
raised the question whether AZA or 6-MP forms the pro-oxidant radical that leads to toxicity as
AZA is readily converted to 6-MP. To answer this question; electron spin resonance
spectrometry spin trapping studies of AZA and 6-MP metabolism by HRP/H2O2 were also
conducted.
Direct detection of some short-lived free radicals (e.g., superoxide and hydroxyl radicals)
is very difficult or impossible in solution at room temperature. Therefore the technique of spin
trapping of short-lived free radical intermediates has become a valuable tool for characterizing
free radicals in chemistry, biology and medicine by electron paramagnetic resonance (EPR)
spectroscopy. Spin trapping is a technique developed at late 1960s where a nitrone or nitroso
compound reacts with a target free radical to form a stable and distinguishable free radical that
can be detected by EPR spectroscopy. The most popular spin trap is 5,5-dimethyl-1-pyrroline N-
oxide (DMPO) (Britigan et al., 1987; Buettner et al., 1990; Janzen, 1984; Khan et al., 2003).
ESR spectra of 6-MP metabolism by HRP/H2O2 are presented in Figure 3.13. A mixture
of two radicals were trapped (A) using DMPO, previously reported (Moore et al. 1994) as
purine-6-thiyl (PS•) and superoxide radicals in a photooxidation system containing 6-MP with
SOD. In the absence of H2O2 (C), HRP (D), and DMPO, HRP, and H2O2 (E), the spectrum in A
was not observed. When SOD was added to the mixture, a more intense spectrum of 6-MP thiyl
radical was observed. When the reaction was recorded after an additional 6 minutes (F), only one
spectrum remained which corresponded to DMPO-OH (B), suggesting that the thiyl radical
adducts decayed (Figure 3.13). AZA did not produce any signal in the ESR spin trapping study.
It was previously reported that thiol containing drugs may produce thiyl radicals when oxidized
by MPO via one-electron oxidations. At physiological pH, MPO was found to be an active
catalyst of thiol oxidation for aliphatic and aromatic thiols (Burner et al., 1999). Thiol oxidation

118
was accompanied by oxygen consumption, superoxide formation and regeneration of H2O2
(Burner and Obinger, 1997; Obinger et al., 1996) which is in agreement with our study results.
A significant decrease in GSH levels was observed when 6-MP was administered with
the H2O2 generating system and peroxidase to rat hepatocytes. This was prevented by 1 mM N-
acetylcysteine (Table 3.7). A similar result was found by Tapner and colleagues (2004) where 6-
MP depleted hepatocyte GSH and increased GSSG formation at clinically relevant
concentrations (0.5 – 5 µM).
Significant protection against 6-MP-induced cytotoxicity with the H2O2 generating
system and peroxidase was achieved by a ROS scavenger, TEMPOL (200 µM) and an
antioxidant, DPPD (2 µM). Protective agents also significantly increased % MMP (Table 3.7)
and GSH levels (Figure 3.12) compared to 6-MP treated hepatocytes with the H2O2 generating
system and peroxidase only (Table 3.7).
Data obtained from the ACMS technique suggests that 6-MP cytotoxicity may involve
H2O2 and peroxidase catalyzed production of thiyl and superoxide radicals leading to glutathione
depletion and mitochondrial toxicity. Possible routes of 6-MP cytotoxicity in isolated rat
hepatocytes are presented in Figure 4.3.

119
Figure 4.3 Possible routes of 6-MP-induced cytotoxicity in isolated rat hepatocytes. XO,
xanthine oxidase; HGPRT, hypoxanthine gunanine phosphoribosyl transferase; TPMT,
thiopurine S-methyl transferase; PTU, 6-N-propyl-2-thiouracil; GSH, reduced glutathione;
GSSG, glutathione disulfide.
6-mercaptopurine 6-thiouric acid
6-thioguanine
6-methylmercaptopurine H2O2+HRP
Thiyl radicals
O2−·
ROS Formation
OXIDATIVE STRESS
Toxicity
GSH
GSSG
HGPRT
TPMT
XO
PTU
ROS Scavenger
Antioxidant
H2O2
120
4.4 Significance and rationale of the research
The in vitro oxidative stress inflammation system used in this study based on ACMS techniques
to evaluate drug-induced hepatotoxicity is a very simple, robust, and cheap method. It can guide
and accelerate the development of safer pharmaceutical agents and reduce the cost and even
deaths associated with adverse drug reactions.
Utilizing the ACMS techniques and using the in vitro inflammation system, it is possible:
(a) To identify possible cytotoxic mechanisms of drugs,
(b) To identify drug-metabolizing enzymes involved in either detoxifying or activating
pathways of a drug,
(b) To investigate the effects of inflammation as a susceptibility factor leading to drug-
induced hepatotoxicity,
(c) To identify potential hepatotoxic drugs and possible effects of inflammation during
the preclinical stages of drug discovery and development,
(d) To identify possible protective agents or antidotes to reverse such drug-induced
hepatotoxicity.
By broadening our thinking regarding the basis for drug idiosyncrasy, doors may open to
increase our understanding of toxicity mechanisms and to find ways for predicting or avoiding
such untoward reactions to otherwise useful drugs.

121
4.5 Limitations
ACMS techniques assume that the drug metabolic/toxic pathways at cytotoxic drug
concentrations in vitro at 2 hrs will be similar to those that occur in vivo in 24 – 36 hrs i.e. high
dose/short time (in vitro) exposure will simulate low dose/long time (in vivo) exposure.
However, in vitro results do not always correlate to in vivo results. The method uses higher
concentrations of the drug under investigation. The mechanism of toxicity at higher drug
concentrations than clinical drug concentrations is not always the same as at clinically relevant
drug concentrations. Caution should be taken in interpretation of the results in humans.
This study used freshly isolated rat hepatocytes. Although they are the gold standard for
studying drug-induced hepatotoxicity, they are functional for only a few hours and therefore
permit the study of acute toxicity only. Isolation of hepatocytes involves multiple steps which
may cause mechanical disruptions of the hepatocytes. Isolating hepatocytes with reproducible
viability of 80-90% is difficult.
The in vitro oxidative stress inflammation system is based on the hypothesis that an acute
episode of inflammation during drug therapy could decrease the threshold for drug toxicity and
thereby render an individual susceptible to a toxic reaction that would otherwise not occur
(Ganey and Roth, 2001; 2003; Roth et al., 1997). The inflammagen hypothesis is based on an
animal model in which rats treated with drugs e.g. ranitidine, trovafloxacin or LPS developed an
acute liver injury with histology dominated by neutrophils (Ganey and Roth, 2001). This model
is fundamentally different in every respect from IDILI that occurs in humans: the injury is acute,
occurring in a few hours after administration of the drug whereas IDILI is generally delayed in
onset. DILI is characterized by a mononuclear infiltrate, sometimes with eosinophil and/or

122
plasma cells. In contrast, the inflammagen model is characterized by an infiltrate of neutrophils,
which is typical of liver injury caused by LPS but not IDILI. Although the mechanism of liver
injury in this model is clearly different from the mechanism of IDILI, it is possible that an
inflammatory stimulus could act as a danger signal and increase the risk of immune-mediated
DILI by APCs (reviewed in Uetrecht, 2013).
The spin trapping agent, DMPO, used in the study cannot distinguish superoxide and
hydroxyl radical easily because of spontaneous decay of the DMPO-superoxide adduct (t1/2 = 45
seconds) into the DMPO-hydroxyl adduct (Zhao et al., 2001).
123
CHAPTER 5: CONCLUSIONS AND FUTURE DIRECTIONS
5.1 Conclusions
The overall goal of the research was to develop a simple and robust in vitro oxidative stress
inflammation system using isolated rat hepatocytes to investigate the effects of inflammation and
oxidative stress on drug toxicity. This could then be used to screen out potential hepatotoxic
molecules during the early phase or drug development. The thesis also investigated the molecular
mechanisms involved in drug-induced liver injury for selected drugs (nimesulide, nilutamide,
flutamide, methotrexate, azathioprine, and 6-mercaptopurine) and tested compounds that can be
used to prevent or decrease drug-induced hepatotoxicity.
5.1.1 Nitroaromatics (nimesulide, nilutamide, flutamide)
All of the nitroaromatic drugs significantly increased cytotoxicity as compared to the controls
(p<0.05). The cytotoxicity was found to be concentration and time dependent. In the presence of
a non-toxic G/GO + HRP system with NIM (300 µM), NIL (300 µM), and FLU (75 µM), a 2.1-,
1.5-, and 1.5-fold increase in toxicity at 2 hrs were observed, respectively. In the absence of
drugs, none of the inflammatory modulators affected hepatocyte viability significantly at the
doses used. ROS formation was also increased with all of the nitroaromatic drugs with and
without G/GO+HRP. A significant decrease in % MMP was observed (p<0.05) with a ranking of
NIL > FLU > NIM compared to control hepatocytes indicating that all of these studied drugs are
mitochondrial toxins. A significant decrease in % MMP was also observed for NIM, NIL and
FLU when incubated with G/GO+HRP compared to respective drug controls. These results

124
implicate H2O2, a cellular mediator of inflammation, as a potential risk factor for drug-induced
hepatotoxicity.
This study suggests that FLU-induced cytotoxicity may involve a H2O2 and
peroxidase/Fe(II)-catalyzed production of a FLU pro-oxidant radical leading to glutathione
depletion, lipid peroxidation, and mitochondrial toxicity. Potent antioxidants, resveratrol (a
polyphenolic compound), and Trolox (the water-soluble vitamin E analogue) significantly
decreased FLU-induced cytotoxicity, ROS and LPO formation, and increased % MMP.
TEMPOL, a known ROS scavenger and superoxide dismutase mimetic, and DPPD, a potent
antioxidant, also reversed toxicity caused by FLU. These results raise the possibility that the
presence or absence of inflammation may be another susceptibility factor for drug-induced
hepatotoxicity.
5.1.2 Methotrexate
The potential molecular cytotoxic mechanisms of MTX towards isolated rat hepatocytes using
the in vitro oxidative stress inflammation system were investigated in this study using ACMS
techniques. MTX-induced cytotoxicity towards isolated rat hepatocytes may involve several
pathways: an aldehyde oxidase-catalyzed production of a toxic metabolite (7-OH-MTX), a H2O2
and peroxidase/Fe(II) catalyzed production of MTX pro-oxidant radicals, and MTX-induced
generation of H2O2 and other ROS. The overall effect is oxidative stress that leads to
mitochondrial injury and ultimately hepatocyte death. The GSH precursor, the N-acetylcysteine,
aldehyde oxidase inhibitor, menadione, and several antioxidants such as mesna (a synthetic
organosulpher compound), resveratrol (a polyphenolic compound), and Trolox (the water-
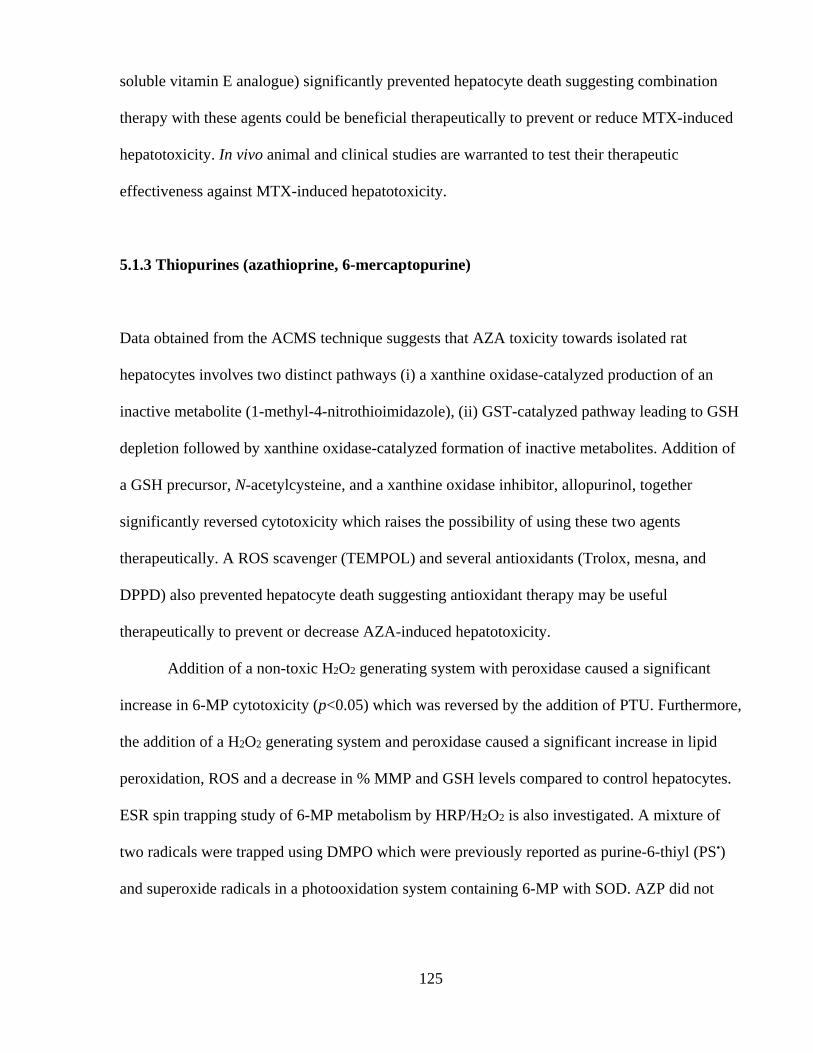
125
soluble vitamin E analogue) significantly prevented hepatocyte death suggesting combination
therapy with these agents could be beneficial therapeutically to prevent or reduce MTX-induced
hepatotoxicity. In vivo animal and clinical studies are warranted to test their therapeutic
effectiveness against MTX-induced hepatotoxicity.
5.1.3 Thiopurines (azathioprine, 6-mercaptopurine)
Data obtained from the ACMS technique suggests that AZA toxicity towards isolated rat
hepatocytes involves two distinct pathways (i) a xanthine oxidase-catalyzed production of an
inactive metabolite (1-methyl-4-nitrothioimidazole), (ii) GST-catalyzed pathway leading to GSH
depletion followed by xanthine oxidase-catalyzed formation of inactive metabolites. Addition of
a GSH precursor, N-acetylcysteine, and a xanthine oxidase inhibitor, allopurinol, together
significantly reversed cytotoxicity which raises the possibility of using these two agents
therapeutically. A ROS scavenger (TEMPOL) and several antioxidants (Trolox, mesna, and
DPPD) also prevented hepatocyte death suggesting antioxidant therapy may be useful
therapeutically to prevent or decrease AZA-induced hepatotoxicity.
Addition of a non-toxic H2O2 generating system with peroxidase caused a significant
increase in 6-MP cytotoxicity (p<0.05) which was reversed by the addition of PTU. Furthermore,
the addition of a H2O2 generating system and peroxidase caused a significant increase in lipid
peroxidation, ROS and a decrease in % MMP and GSH levels compared to control hepatocytes.
ESR spin trapping study of 6-MP metabolism by HRP/H2O2 is also investigated. A mixture of
two radicals were trapped using DMPO which were previously reported as purine-6-thiyl (PS•)
and superoxide radicals in a photooxidation system containing 6-MP with SOD. AZP did not

126
produce any signal in ESR spin trapping study. Data obtained from this study suggests that 6-MP
cytotoxicity may involve H2O2 and peroxidase catalyzed production of thiyl and superoxide
radicals leading to glutathione depletion and mitochondrial toxicity.
5.1.4 Hypothesis revisited
“Exposure of drugs such as nimesulide, flutamide, nilutamide, methotrexate, azathioprine, 6-
mercaptopurine to an in vitro oxidative stress inflammation system will increase hepatotoxicity
through the formation of pro-oxidant radicals and other reactive oxygen species leading to
oxidative stress”.
From the findings reported in this thesis, it can be concluded that all the investigated
drugs (except for azathioprine) formed pro-oxidant radicals and other reactive oxygen species
when exposed to the in vitro oxidative stress inflammation system in isolated rat hepatocytes and
caused oxidative stress leading to cell death.

127
5.2 Future directions
We are planning to incorporate the ESR spin trapping studies into this system for all of the tested
drugs so that we can confirm the formation of drug pro-oxidant free radicals (due to oxidation by
HRP/H2O2) and other ROS formation. In the current study, DMPO (5,5-dimethyl-1-pyrroline N-
oxide) was used as a spin trap agent. However, this agent has some limitations. It cannot
distinguish superoxide and hydroxyl radical easily because of spontaneous decay of DMPO-
superoxide adduct (t1/2 = 45 seconds) into the DMPO-hydroxyl adduct. BMPO (5-tert-
butoxycarbonyl 5-methyl-1-pyrroline N-oxide) can be used as its alternative to easily distinguish
superoxide and hydroxyl radical as BMPO-superoxide adduct does not decay into a hydroxyl
adduct and has a much longer half-life (t1/2 = 23 minutes) (Zhao et al., 2001). This method may
also be used in in vivo systems to detect short lived radicals.
We are planning to compare and validate our study results with other currently available
in vitro systems to study endotoxin-induced hepatotoxicity. Commonly used in vitro systems are:
(a) Co-culture of stimulated PMNs with hepatocytes:
Co-culturing of isolated rat hepatocytes with PMNs stimulated with phorbol myristate acetate
(PMA) or f-methionyl-leucyl-phenylalanine (fmlp) in the presence or absence of xenobiotic, and
evaluation of cytotoxicity to hepatocytes from the release of alanine aminotransferase into the
medium (Srinivasan et al., 1997)
(b) Co-culture of stimulated Kupffer cells with hepatic parenchymal cells (HPC):
“A rat Kupper cell-hepatocyte coculture system”. Treatment of cocultures with various
concentrations of either LPS or Interleukin 2 (IL2), the xenobiotic under investigation, vehicle

128
(culture medium) or a combination compared to Kupffer cells and HPC alone (Tukov et al.,
2006).
Although our in vitro model can screen out drug molecules having a potential for toxicity
associated with inflammation, this needs to be translated in an in vivo system. Confirmation from
both in vitro and in vivo studies can help to detect drugs having potential for idiosyncratic
reactions. Several models are available based on different hypotheses of IDILI (reviewed in Roth
and Ganey, 2011). However, we are interested in adapting one model developed by Roth and
colleagues (Roth et al., 1997) in our laboratory so that we can include it in an in vitro – in vivo
correlation in our system. The hypothesis of the model was that altered tissue homeostasis
initiated by small, otherwise nontoxic doses of xenobiotic agents can progress to overt toxicity in
the presence of inflammatory factors generated by concurrent endotoxin exposure such as LPS.
This hypothesis is supported by studies in animals, in which considerable evidence has
accumulated indicating that endotoxin exposure can influence the magnitude of responses to
toxic chemicals. In this model, rats or mice are treated with nonhepatotoxic doses of LPS and the
xenobiotic under investigation alone or in combination. Liver histopathology and liver enzymes
are checked after 6 hrs of xenobiotic and/or LPS administration (Roth et al., 1997).
The “In Vitro Oxidative Stress Inflammation System” is a simple and robust system
which, after further validation, can be used as a powerful screening tool to screen out potential
hepatotoxic drug molecules associated with inflammation during pre-clinical stages of drug
development.

129
REFERENCES
Al-Motagabani, M.A. (2006). Histological and histochemical studies on the effects of
methotrexate on the liver of adult male albino rat. International Journal of Morphology, 24(3), 417–22.
Alperine, M., Cohen, L., Cocheton, J.J., Lecomte, I., & Meyniel, D. (1991). Hépatite aiguë due au flutamide. La Presse M'Edicale, 20(30), 1459–1460.
Al-Shamma, S., Eross, B., & Mclaughlin, S. (2013). Use of a xanthine oxidase inhibitor in autoimmune hepatitis. Hepatology, 57(3), 1281–1282.
Amaya, Y., Yamazaki, K., Sato, M., Noda, K., & Nishino, T. (1990). Proteolytic conversion of xanthine dehydrogenase from the NAD-dependent type to the O2-dependent type: amino acid sequence of rat liver xanthine dehydrogenase and identification of the cleavage sites of the enzyme protein during irreversible conversion by trypsin. Journal of Biological Chemistry, 265, 14170–14175.
Andersson, B.S., Aw, T.Y., & Jones, D.P. (1987). Mitochondrial transmembrane potential and pH gradient during anoxia. American Journal of Physiology-Cell Physiology, 252(4), 349–355.
Andrade, R.J., Camargo, R., Lucena, M.I., González-Grande, R. (2004). Causality assessment in drug-induced hepatotoxicity. Expert Opinion on Drug Safety, 3(4), 329–344.
Andrejic, J., Rojas-Balcazar, J., Dennis, M., & Berkelhammer, C. (2010). Azathioprine-induced hypersensitivity hepatitis: Tolerance to 6-mercaptopurine. Inflammatory Bowel Diseases, 16(11), 1828–1829.
Antonenkov, V.D., Grunau, S., Ohlmeier, S., & Hiltunen, J.K. (2010). Peroxisomes are oxidative organelles. Antioxidants & Redox Signaling, 13(4), 525–537.
Antunes, F. & Cadenas, E. (2001). Cellular titration of apoptosis with steady state concentrations of H(2)O(2): submicromolar levels of H(2)O(2) induce apoptosis through Fenton chemistry independent of the cellular thiol state. Free Radical Biology & Medicine, 30(9), 1008–1018.
Arthur, J. (2001). The glutathione peroxidases. Cellular and Molecular Life Sciences, 57(13–14), 1825–1835.
Arvadia, P., Narwaley, M., Whittal, R.M. & Siraki, A.G. (2011). 4-Aminobenzoic acid hydrazide inhibition of microperoxidase-11: catalytic inhibition by reactive metabolites. Archives of Biochemistry and Biophysics, 515(1-2), 120–6.
Asakawa, N. (1995). Studies on the metabolic fate of flutamide (4): biliary excretion, enterohepatic circulation, absorption from gastro-intestinal tract, metabolism and drug-metabolizing enzymes induction in rats. Xenobiotic Metabolism and Disposition, 10, 470–483.
Asci, H., Ozer, M.K., Calapoglu, M., Savran, M., Oncu, M., & Yesilot, S. et al. (2011). Effects of Misoprostol on Methotrexate-Induced Hepatic and Renal Damages. Journal of Biology and Life Sciences, 2(1), 32–37.
Ask, K., D'ecologne, N., Asare, N., Holme, J., Artur, Y., Pelczar, H., & Camus, P. (2003). Distribution of nitroreductive activity toward nilutamide in rat. Toxicology and Applied Pharmacology, 201(1), 1–9.
Aslan, M., Ryan, T.M., Adler, B., Townes, T.M., Parks, D.A., & Thompson, J.A. et al. (2001).

130
Oxygen radical inhibition of nitric oxide-dependent vascular function in sickle cell disease. Proceedings of the National Academy of Sciences, 98(26), 15215–15220.
Aytaç, S., Yetgin, S., & Tavil, B. (2006). Acute and long-term neurologic complications in children with acute lymphoblastic leukemia. Turkish Journal of Pediatrics, 48(1), 1–7.
Beland, G., Elhilali, M., Faadet, Y., Laroche, B., Ramsey, E.W., Teachtenberg, J., & Venner, P. M. (1998). Total androgen blockade for metastatic cancer of the prostate. American Journal of Clinical Oncology, 11(Suppl. 2), 5187–5190.
Babiak, R.M., Campello, A.P., Carnieri, E.G, & Oliveira, M.B. (1998). Methotrexate: pentose cycle and oxidative stress. Cell Biochemistry and Function, 16(4), 283–293.
Badr, M.O.T.; Edrees, N.M.M.; Abdallah, A.A.M.; Hashem, M.A.; El-Deen N.A.M.N.; Neamat-Allah, A.N.F., & Ismail, H.T.H. (2011). Propolis protects against methotrexate induced hepatorenal dysfunctions during treatment of Ehrlich carcinoma. Journal of American Science, 7(12), 313–319.
Balani, S.K., Zhu, T., Yang, T.J., Liu, Z., He, B., & Lee, F.W. (2002). Effective dosing regimen of 1-aminobenzotriazole for inhibition of antipyrine clearance in rats, dogs, and monkeys. Drug Metabolism and Disposition, 30(10), 1059–1062.
Ballet, F. (1997). Hepatotoxicity in drug development: detection, significance and solutions. Journal of Hepatology, 26, 26–36.
Banji, D., Pinnapureddy, J., Banji, O.J., Saidulu, A., & Hayath, M.S. (2011). Synergistic activity of curcumin with methotrexate in ameliorating Freund's Complete Adjuvant induced arthritis with reduced hepatotoxicity in experimental animals. European Journal of Pharmacology, 668(1), 293–298.
Barry, R., Niland, S., Cremer, A., & Mahrle, G. (1998). Methotrexate (MTX) induces apoptosis in keratinocytes. Journal of Dermatological Science, 16 (Supp 1), S83.
Basivireddy, J., Jacob, M., Pulimood, A., & Balasubramanian, K. (2004). Indomethacin-induced renal damage: role of oxygen free radicals. Biochemical Pharmacology, 67(3), 587–599.
Beedham, C. (2010). 4.10 - Xanthine oxidoreductase and aldehyde oxidase, In C.A. McQueen (Ed.), Comprehensive Toxicology (2nd edition, pp. 185–205). Oxford: Elsevier.
Beland, G., Elhilali, M., Faadet, Y., Laroche, B., Ramsey, E.W., Teachtenberg, J., & Venner, P. M. (1998). Total androgen blockade for metastatic cancer of the prostate. American Journal of Clinical Oncology, 11(Suppl. 2), 5187–5190.
Berends, M.A., Snoek, J., de Jong, E.M., van de Kerkho, P.C., van Oijen, M.G., van Krieken, J.H., Drenth, J.P. (2006). Liver injury in long-term methotrexate treatment in psoriasis is relatively infrequent. Alimentary Pharmacology Therapeutics, 24(5), 805–811.
Bernareggi, A. & Rainsford, K.D. (2005). Pharmacokinetics of nimesulide. In K.D. Rainsford (Ed.), Nimesulide. Actions and uses (pp. 63–120). Basel: Birkhäuser.
Berson, A., Cazanave, S., Descatoire, V., Tinel, M., Grodet, A., & Wolf, C. et al. (2006). The anti-inflammatory drug, nimesulide (4-nitro-2-phenoxymethane-sulfoanilide), uncouples mitochondria and induces mitochondrial permeability transition in human hepatoma cells: protection by albumin. Journal of Pharmacology and Experimental Therapeutics, 318(1), 444–454.
Berson, A., Schmets, L., Fisch, C., Fau, D., Wolf, C., & Fromenty, B. et al. (1994). Inhibition by nilutamide of the mitochondrial respiratory chain and ATP formation. Possible contribution to the adverse effects of this antiandrogen. Journal of Pharmacology and Experimental Therapeutics, 270(1), 167–176.
Berson, A., Wolf, C., Berger, V., Fau, D., Chachaty, C., Fromenty, B., & Pessayre, D. (1991).

131
Generation of free radicals during the reductive metabolism of the nitroaromatic compound, nilutamide. Journal of Pharmacology and Experimental Therapeutics, 257(2), 714–719.
Berson, A., Wolf, C., Chachaty, C., Fisch, C., Fau, D., & Eugene, D. et al. (1993). Metabolic activation of the nitroaromatic antiandrogen flutamide by rat and human cytochromes P-450, including forms belonging to the 3A and 1A subfamilies. Journal of Pharmacology and Experimental Therapeutics, 265(1), 366–372.
Bessone, F., Colombato, L., Fassio, E., Virginia Reggiardo, M., Vorobioff, J., & Tanno, H. (2010). The Spectrum of Nimesulide-Induced-Hepatotoxicity. An Overview. Anti-Inflammatory & Anti-Allergy Agents in Medicinal Chemistry, 9(4), 355–365.
Blokhina, O. & Fagerstedt, K. (2010). Oxidative metabolism, ROS and NO under oxygen deprivation. Plant Physiology and Biochemistry, 48(5), 359–373.
Boelsterli, U.A., Ho, H., Zhou, S., & Yeow Leow, K. (2006). Bioactivation and hepatotoxicity of nitroaromatic drugs. Current Drug Metabolism, 7(7), 715–727.
Boelsterli, U.A. (2002). Mechanisms of NSAID-induced hepatotoxicity. Drug Safety, 25(9), 633–648.
Boelsterli, U.A. (2003a). Disease-related determinants of susceptibility to drug-induced idiosyncratic hepatotoxicity. Current Opinion in Drug Discovery & Development, 6(1), 81–91.
Boelsterli, U.A. (2003b). Idiosyncratic drug hepatotoxicity revisited: new insights from mechanistic toxicology. Toxicology Mechanisms and Methods, 13(1), 3–20.
Boelsterli, U.A. & Kashimshetty, R. (2010). 9.17 - Idiosyncratic drug-induced liver injury: mechanisms and susceptibility factors. In C.A. McQueen (Ed.), Comprehensive Toxicology (2nd edition, pp. 383–402), Oxford: Elsevier.
Bore, P., Lena, N., Imbert, A.M., Favre, R., Cano, J.P., Meyer, G., & Carcassonne, Y. (1986). Methotrexate-vindesine association in head and neck cancer: modification of methotrexate's hydroxylation in presence of vindesine. Cancer Chemotherapy and Pharmacology, 17(2), 171–176.
Boutin, J.A., Kass, G.E., & Mold'eus, P. (1989). Drug-induced hydrogen peroxide production in isolated rat hepatocytes. Toxicology, 54(2), 129–137.
Bradford, K., & Shih, D.Q. (2011). Optimizing 6-mercaptopurine and azathioprine therapy in the management of inflammatory bowel disease. World Journal of Gastroenterology, 17(37), 4166–73.
Bremnes, R.M., Slordal, L., Wist, E., & Aarbakke, J. (1989). Dose-dependent pharmacokinetics of methotrexate and 7-hydroxymethotrexate in the rat in vivo. Cancer Research, 49(22), 6359–6364.
Bremnes, R., Smel, Willassen, N., Wist, E., & Aarbakke, J. (1991a). Inhibition of 7-hydroxymethotrexate formation by amsacrine. Cancer Chemotherapy and Pharmacology, 28(5), 377–383.
Bremnes, R., Smel, Slordal, L., Wist, E., & Aarbakke, J. (1991b). The effect of vindesine on methotrexate hydroxylation in the rat. Biochemical Pharmacology, 42(8), 1561–1568.
Bremnes, R.M., Smel, Huseby, N.E., Eide, T.J., & Aarbakke, J. (1991c). Acute Hepatotoxicity after High-Dose Methotrexate Administration to Rats. Pharmacology & Toxicology, 69(2), 132–139.
Brisset, J.M., Boccon-Gibod, L., Botto, H., Camey, M., Cariou, G., & Duclos, J.M. et al. (1987). Anandron (RU 23908) associated to surgical castration in previously untreated stage D prostate cancer: a multicenter comparative study of two doses of the drug and of a placebo.

132
Progress in Clinical and Biological Research, 243, 411–22. Britigan, B.E., Cohen, M.S., & Rosen, G.M. (1987). Detection of the production of oxygen-
centered free radicals by human neutrophils using spin trapping techniques: a critical perspective. Journal of Leukocyte Biology, 41(4), 349–362.
Brown, K.E., Brunt, E.M., & Heinecke, J.W. (2001). Immunohistochemical detection of myeloperoxidase and its oxidation products in Kupffer cells of human liver. The American Journal of Pathology, 159(6), 2081–2088.
Buchweitz, J.P., Ganey, P.E., Bursian, S.J., & Roth, R.A. (2002). Underlying endotoxemia augments toxic responses to chlorpromazine: is there a relationship to drug idiosyncrasy? Journal of Pharmacology and Experimental Therapeutics, 300(2), 460–467.
Buettner, G.R. & Mason, R.P. (1990). Spin-trapping methods for detecting superoxide and hydroxyl free radicals in vitro and in vivo. Methods in Enzymology, 186, 127–133.
Burner, U. & Obinger, C. (1997). Transient-state and steady-state kinetics of the oxidation of aliphatic and aromatic thiols by horseradish peroxidase. FEBS Letters, 411(2), 269–274.
Burner, U., Jantschko, W., & Obinger, C. (1999). Kinetics of oxidation of aliphatic and aromatic thiols by myeloperoxidase compounds I and II. FEBS Letters, 443(3), 290–296.
Butler, R., Morris, A.D., Belch, J.J., Hill, A., & Struthers, A.D. (2000). Allopurinol normalizes endothelial dysfunction in type 2 diabetics with mild hypertension. Hypertension, 35(3), 746–751.
Cadenas, E. & Davies, K.J. (2000). Mitochondrial free radical generation, oxidative stress, and aging. Free Radical Biology and Medicine, 29(3), 222–230.
Cetin, A., Kaynar, L., Kocyigit, I., Hacioglu, S., Saraymen, R., & Ozturk, A. et al. (2008). Role of grape seed extract on methotrexate induced oxidative stress in rat liver. The American Journal of Chinese Medicine, 36(05), 861–872.
Chalasani, N. & Björnsson, E. (2010). Risk factors for idiosyncratic drug-induced liver injury. Gastroenterology, 138(7), 2246–2259.
Chan, K., Jensen, N.S., Silber, P.M., & O’Brien, P.J. (2007). Structure-activity relationships for halobenzene induced cytotoxicity in rat and human hepatocytes. Chemico-Biological Interactions, 165(3), 165–174.
Chan, K., Lehmler, H.J., Sivagnanam, M., Feng, C.Y., Robertson, L., & O'Brien, P.J. (2010). Cytotoxic effects of polychlorinated biphenyl hydroquinone metabolites in rat hepatocytes. Journal of Applied Toxicology, 30(2), 163–171.
Chang, C.J., Lin, J.F., Chang, H.H., Lee, G.A., & Hung, C.F. (2013). Lutein protects against methotrexate-induced and reactive oxygen species-mediated apoptotic cell injury of IEC-6 cells. Plos One, 8(9), 72553.
Chen, V.J., Bewley, J.R., Andis, S.L., Schultz, R.M., Iversen, P.W., & Shih, C. et al. (1998). Preclinical cellular pharmacology of LY231514 (MTA): a comparison with methotrexate, LY309887 and raltitrexed for their effects on intracellular folate and nucleoside triphosphate pools in CCRF-CEM cells. British Journal of Cancer, 78(Suppl 3), 27–34.
Chen, Y., Jungsuwadee, P., Vore, M., Butterfield, D.A., & St Clair, D.K. (2007). Collateral damage in cancer chemotherapy: oxidative stress in nontargeted tissues. Molecular Interventions, 7(3), 147–56.
Chen, Y.X., Mao, Y.Y., & Xie, X. (2003). [Efficacy and side effects of methotrexate in the treatment of ectopic pregnancy]. Zhonghua Fu Chan Ke Za Zhi, 38(12), 749–751.
Chibber, S., Hassan, I., Farhan, M., & Naseem, I. (2011). In vitro pro-oxidant action of Methotrexate in presence of white light. Journal of Photochemistry and Photobiology B:

133
Biology, 104(3), 387–393. Chládek, J., Martínková, J., & Sispera, L. (1996). An in vitro study on methotrexate
hydroxylation in rat and human liver. Physiological Research, 46(5), 371–379. Chocair, P.R, Duley, J.A., Cameron, J.S., Arap, S., Ianhez, L., Sabbaga, E., & Simmonds, H.A.
(1994). Does low-dose allopurinol, with azathioprine, cyclosporin and prednisolone, improve renal transplant immunosuppression? Advances in Experimental Medicine and Biology, 370, 205–8.
Çakır, T., Özkan, E., Dulundu, E., Topaloğlu, Ü., Şehirli, A.Ö., Ercan, F. et al. (2011). Caffeic acid phenethyl ester (CAPE) prevents methotrexate-induced hepatorenal oxidative injury in rats. Journal of Pharmacy and Pharmacology, 63(12), 1566–1571.
Coleshowers, C.L., Oguntibeju, O.O., Ukpong, M., & Truter, E.J. (2010). Effects of methotrexate on antioxidant enzyme status in a rodent model. Medical Technology SA, 24(1), 4–9.
Comporti, M. (1989). Three models of free radical-induced cell injury. Chemico-Biological Interactions, 72(1), 1–56.
Comporti, M., Saccocci, C., & Dianzani, M.U. (1965). Effect of CCl-4 in vitro and in vivo on lipid peroxidation of rat liver homogenates and subcellular fractions. Enzymologia, 29(3), 185–204.
Corkery, J.C., Bihrle, W., McCaffrey, J.A., Whitcomb, F.F., Levy, C., & Ellis, R. (1991). Flutamide-related fulminant hepatic failure. Journal of Clinical Gastroenterology, 13(3), 364–365.
Corpet, D. E., Gueraud, F., & O'Brien, P. J. (2010). Iron from meat produces endogenous procarcinogenic peroxides. In P. J. O'Brien & W. R. Bruce (Eds.), Endogenous toxins. Diet, genetics, disease and treatment (pp. 133–149). Weinheim: Wiley-VCH Verlag.
Dalaklioglu, S., Genc, G.E., Aksoy, N.H., Akcit, F., & Gumuslu, S. (2013). Resveratrol ameliorates methotrexate-induced hepatotoxicity in rats via inhibition of lipid peroxidation. Human & Experimental Toxicology, 32(6), 662–671.
Dambach, D.M., Andrews, B.A., & Moulin, F. (2005). New technologies and screening strategies for hepatotoxicity: use of in vitro models. Toxicologic Pathology, 33(1), 17–26.
Daniel, F., Cadranel, J.F., Seksik, P., Cazier, A., Duong Van Huyen, J.P., & Ziol, M. et al. (2005). Azathioprine induced nodular regenerative hyperplasia in IBD patients. Gastroentérologie Clinique et Biologique, 29(5), 600–603.
Dankoff, J.S. (1992). Near fatal liver dysfunction secondary to administration of flutamide for prostate cancer. The Journal of Urology, 148(6), 1914–1914.
Dastis, S.N., Rahier, J., Lerut, J., & Geubel, A.P. (2007). Liver transplantation for nonsteroidal anti-inflammatory drug-induced liver failure: nimesulide as the first implicated compound. European Journal of Gastroenterology & Hepatology, 19(11), 919–922.
Davila, J.C., & Morris, D.L. (1999). Analysis of cytochrome P450 and phase II conjugating enzyme expression in adult male rat hepatocytes. In Vitro Cellular & Developmental Biology-Animal, 35(3), 120–130.
Davila, J., Xu, J., Hoffmaster, K., O'Brien, P., & Storm, S. (2008). Current in vitro Models to Study Drug-Induced Liver Injury. Hepatotoxicity, 1–55.
Davila, J.C., Xu, J.J., Hoffmaster, K.A., O’Brien, P.J. & Strom, S.C. Current in vitro models to study drug-induced liver injury. In S. C. Sahu (Ed.), Hepatotoxicity: From genomics to in vitro and in vivo models (pp. 141–176), New York, NY: John Wiley.
Deavall, D.G., Martin, E.A., Horner, J.M., & Roberts, R. (2012). Drug-induced oxidative stress

134
and toxicity. Journal of Toxicology, Article ID 645460. Degott, C., Rueff, B., Kreis, H., Duboust, A., Potet, F., & Benhamou, J.P. (1978). Peliosis
hepatis in recipients of renal transplants. Gut, 19(8), 748–753. DeLeve, L.D., Wang, X., Kuhlenkamp, J.F., & Kaplowitz, N. (1996). Toxicity of azathioprine
and monocrotaline in murine sinusoidal endothelial cells and hepatocytes: the role of glutathione and relevance to hepatic venoocclusive disease. Hepatology, 23(3), 589–599.
Deng, X., Luyendyk, J.P., Ganey, P.E., & Roth, R.A. (2009). Inflammatory stress and idiosyncratic hepatotoxicity: hints from animal models. Pharmacological Reviews, 61(3), 262–282.
Desco, M.C., Asensi, M., M'arquez, R., Mart'inez-Valls, J., Vento, M., & Pallard'o, FV. et al. (2002). Xanthine oxidase is involved in free radical production in type 1 diabetes protection by allopurinol. Diabetes, 51(4), 1118–1124.
Di Luzio, N.R. & Costales, F. (1965). Inhibition of the ethanol and carbon tetrachloride induced fatty liver by antioxidants. Experimental and Molecular Pathology, 4(2), 141–154.
Donehower, R.C., Hande, K.R., Drake, J.C., & Chabner, B.A. (1979). Presence of 2, 4-diamino-N10-methylpteroic acid after high-dose methotrexate. Clinical Pharmacology and Therapeutics, 26(1), 63–72.
Dourakis, S.P, Alexopoulou, A.A., & Hadziyannis, S.G. (1994). Fulminant hepatitis after flutamide treatment. Journal of Hepatology, 20(3), 350–353.
Dröge, W. (2002). Free radicals in the physiological control of cell function. Physiology Review, 82(1), 47–95.
Dubin, M., Fern, ez Villamil, S.H., Paulino de Blumenfeld, M, & Stoppani, A.O. (1991). Inhibition of microsomal lipid peroxidation and cytochrome P-450-catalyzed reactions by nitrofuran compounds. Free Radical Research, 14(5-6), 419–431.
Dubin, M., Grinblat, L., Villamil, S.H., & Stoppani, A.O. (1987). Nitrofuran inhibition of microsomal lipid peroxidation. FEBS Letters, 220(1), 197–200.
Dubin, M., Villamil, S.F.F., & Stoppani, A.O.M. (1990). Inhibition of microsomal lipid peroxidation and cytochrome P-450-catalyzed reactions by β-lapachone and related naphthoquinones. Biochemical Pharmacology, 39(7), 1151–1160.
Dubinsky, M. (2004). Azathioprine, 6-mercaptopurine in inflammatory bowel disease: pharmacology, efficacy, and safety. Clinical Gastroenterology and Hepatology, 2(9), 731–743.
Ekström, T. & Högberg, J. (1980). Chloroform-induced glutathione depletion and toxicity in freshly isolated hepatocytes. Biochemical Pharmacology, 29(22), 3059–3065.
El-Azhary, R.A. (2003). Azathioprine: current status and future considerations. International Journal of Dermatology, 42(5), 335–341.
El-Beshbishy, H.A., Tork, O.M., El-Bab, M.F., & Autifi, M.A. (2011). Antioxidant and antiapoptotic effects of green tea polyphenols against azathioprine-induced liver injury in rats. Pathophysiology, 18(2), 125–135.
Eastmond, D. A., Smith, M. T., Ruzo, L. O., and Ross, D., 1986. Metabolic activation of phenol by human myeloperoxidase and horseradish peroxidase. Mol. Pharmacol. 30, 674-679.
Engineer, F. & Sridhar, R. (1989). Inhibition of rat heart and liver microsomal lipid peroxidation by nifedipine. Biochemical Pharmacology, 38(8), 1279–1285.
Eyer, P. & Podhradský, D. (1986). Evaluation of the micromethod for determination of glutathione using enzymatic cycling and Ellman's reagent. Analytical Biochemistry, 153(1), 57–66.

135
Fabre, G., Fabre, I., Matherly, L.H., Cano, J.P., & Goldman, I.D. (1984). Synthesis and properties of 7-hydroxymethotrexate polyglutamyl derivatives in Ehrlich ascites tumor cells in vitro. Journal of Biological Chemistry, 259(8), 5066–5072.
Farber, S., Toch, R., Sears, E., & Pinkel, D. (1956) Advances in chemotherapy of cancer in man. J.P. Greebstein JP (ed), Advances in Cancer Research (pp 2–73). New York: Academic Press.
Farquhar, D., Loo, T.L., & Vadlamudi, S. (1972). Synthesis and biologic evaluation of 7-hydroxymethotrexate, 7-methylaminopterin, and 7-methylmethotrexate. Journal of Medicinal Chemistry, 15(5), 567–569.
Farquharson, C.A., Butler, R., Hill, A., Belch, J.J., & Struthers, A.D. (2002). Allopurinol improves endothelial dysfunction in chronic heart failure. Circulation, 106(2), 221–226.
Fau, D., Berson, A., Eugene, D., Fromenty, B., Fisch, C., & Pessayre, D. (1992). Mechanism for the hepatotoxicity of the antiandrogen, nilutamide. Evidence suggesting that redox cycling of this nitroaromatic drug leads to oxidative stress in isolated hepatocytes. Journal of Pharmacology and Experimental Therapeutics, 263(1), 69–77.
Fau, D., Eugene, D., Berson, A., Letteron, P., Fromenty, B., Fisch, C., & Pessayre, D. (1994). Toxicity of the antiandrogen flutamide in isolated rat hepatocytes. Journal of Pharmacology and Experimental Therapeutics, 269(3), 954–962.
Fialho, D., Chan, Y.C., Allen, D.C., Reilly, M.M., & Hughes, R.A. (2006). Treatment of chronic inflammatory demyelinating polyradiculoneuropathy with methotrexate. Journal of Neurology, Neurosurgery & Psychiatry, 77(4), 544–547.
Fridovich, I. (1995). Superoxide radical and superoxide dismutases. Annual Review of Biochemistry, 64(1), 97–112.
Fritz, R., Bol, J., Hebling, U., Angermüller, S., Völkl, A., Fahimi, H.D., & Mueller, S. (2007). Compartment-dependent management of H(2)O(2) by peroxisomes. Free Radical Biology and Medicine, 42(7), 1119–1129.
Fuksa, L., Brcakova, E., Kolouchova, G., Hirsova, P., Hroch, M., & Cermanova, J. et al. (2010). Dexamethasone reduces methotrexate biliary elimination and potentiates its hepatotoxicity in rats. Toxicology, 267(1), 165–171.
Fung, M., Thornton, A., Mybeck, K., Wu, J.H., Hornbuckle, K., & Muniz, E. (2001). Evaluation of the characteristics of safety withdrawal of prescription drugs from worldwide pharmaceutical markets-1960 to 1999*. Drug Information Journal, 35(1), 293–317.
Fuskevaag, O.M., Kristiansen, C., Lindal, S., & Aarbakke, J. (2000). Maximum tolerated doses of methotrexate and 7-hydroxy-methotrexate in a model of acute toxicity in rats. Cancer Chemotherapy and Pharmacology, 46(1), 69–73.
Ganey, P.E. & Roth, R.A. (2001). Concurrent inflammation as a determinant of susceptibility to toxicity from xenobiotic agents. Toxicology, 169(3), 195–208.
Ghaffari, A.R., Noshad, H., Ostadi, A., Ghojazadeh, M., & Asadi, P. (2011). The effects of milk thistle on hepatic fibrosis due to methotrexate in rat. Hepatitis Monthly, 11(6), 464–468.
Gharib, B., Abdallahi, O.M., Dessein, H., & De Reggi, M. (1999). Development of eosinophil peroxidase activity and concomitant alteration of the antioxidant defenses in the liver of mice infected with Schistosoma mansoni. Journal of Hepatology, 30(4), 594–602.
Giorgio, M., Trinei, M., Migliaccio, E., & Pelicci, P.G. (2007). Hydrogen peroxide: a metabolic by-product or a common mediator of ageing signals? Nature Reviews Molecular Cell Biology, 8(9), 722–728.
Gisbert, J.P., Gonz'alez-Lama, Y., & Mat'e, J. (2007). Thiopurine-induced liver injury in patients

136
with inflammatory bowel disease: a systematic review. The American Journal of Gastroenterology, 102(7), 1518–1527.
Gomes, A., Fernandes, E., & Lima, J. L. (2005). Fluorescence probes used for detection of reactive oxygen species. Journal of Biochemical and Biophysical Methods, 65(2), 45–80.
Gomez, J.L., Dupont, A., Cusan, L., Tremblay, M., Suburu, R., Lemay, M., & Labrie, F. (1992). Incidence of liver toxicity associated with the use of flutamide in prostate cancer patients. The American Journal of Medicine, 92(5), 465–470.
Gressier, B., Lebegue, S., Brunet, C., Luyckx, M., Dine, T., Cazin, M., & Cazin, J.C. (1994). Pro-oxidant properties of methotrexate: evaluation and prevention by an anti-oxidant drug. Die Pharmazie, 49(9), 679–681.
Griffith, O.W. (1980). Determination of glutathione and glutathione disulfide using glutathione reductase and 2-vinylpyridine. Analytical Biochemistry, 106(1), 207–212.
Guillouzo, A. (1998). Liver cell models in in vitro toxicology. Environmental Health Perspectives, 106(Suppl 2), 511–32.
Gupta, P., Gokhale, R., & Kirschner, B. (2001). 6-mercaptopurine metabolite levels in children with inflammatory bowel disease. Journal of Pediatric Gastroenterology and Nutrition, 33(4), 450–454.
Gusman, J., Malonne, H., & Atassi, G. (2001). A reappraisal of the potential chemopreventive and chemotherapeutic properties of resveratrol. Carcinogenesis, 22(8), 1111–1117.
Halliwell, B. & Gutteridge, J.M.C. (1985). Free Radicals in Biology and Medicine, Edition 3. Oxford University Press, Oxford.
Hamad, I., Arda, N., Pekmez, M., Karaer, S., & Temizkan, G. (2010). Intracellular scavenging activity of Trolox (6-hydroxy-2, 5, 7, 8-tetramethylchromane-2-carboxylic acid) in the fission yeast, Schizosaccharomyces pombe. Journal of Natural Science, Biology, and Medicine, 1(1), 16–21.
Hampton, M.B., Kettle, A.J., & Winterbourn, C.C. (1998). Inside the neutrophil phagosome: oxidants, myeloperoxidase, and bacterial killing. Blood, 92(9), 3007–3017.
Harris, C. & Massey, V. (1997). The oxidative half-reaction of xanthine dehydrogenase with NAD; reaction kinetics and steady-state mechanism. Journal of Biological Chemistry, 272(45), 28335–28341.
Hart, W. & Stricker, B.H. (1989). Flutamide and hepatitis. Annals of Internal Medicine, 110(11), 943–944.
Hemeida, R.A & Mohafez, O.M (2008). Curcumin attenuates methotraxate-induced hepatic oxidative damage in rats. Journal of the Egyptian National Cancer Institute, 20(2), 141–148.
Hersh, E.M., Wong, V.G., Henderson, E.S., & Freireich, E.J. (1966). Hepatotoxic effects of methotrexate. Cancer, 19(4), 600–606.
Iannitti, T. & Palmieri, B. (2009). Antioxidant therapy effectiveness: an up to date. European Review for Medical and Pharmacological Sciences, 13(4), 245–278.
Imanishi, H., Okamura, N., Yagi, M., Noro, Y., Moriya, Y., & Nakamura, T. et al. (2007). Genetic polymorphisms associated with adverse events and elimination of methotrexate in childhood acute lymphoblastic leukemia and malignant lymphoma. Journal of Human Genetics, 52(2), 166–171.
Issabeagloo, E., Kermanizadeh, P., Taghizadiyeh, M., & Ahmadpoor, F. (2011). Study of Cytoprotective Effects of Lycopene on Azathioprine Induced Hepatic Injury in Rat. Journal of Applied Sciences Research, 7(11), 1026.

137
Jahovic, N., Cevik, H., Sehirli, A., Yeğen, B.C., & Sener, G. (2003). Melatonin prevents methotrexate-induced hepatorenal oxidative injury in rats. Journal of Pineal Research, 34(4), 282–287.
Jaeschke, H. (2010). 9.14 - Antioxidant defense mechanisms, In C.A. McQueen (Ed.), Comprehensive Toxicology (2nd edition, pp. 319–337). Oxford: Elsevier.
Janzen, E. G. (1984). Spin trapping. Methods in Enzymology. 105, 188–198. Jezek, P. & Hlavatá, L. (2005). Mitochondria in homeostasis of reactive oxygen species in cell,
tissues, and organism. The International Journal of Biochemistry & Cell Biology, 37(12), 2478–2503.
Johns, D.G., Iannotti, A.T., Sartorelli, A.C., & Bertino, J.R. (1966). The relative toxicities of methotrexate and aminopterin. Biochemical Pharmacology, 15(5), 555–561.
Johns, D.G. & Valerino, D.M. (1971). Metabolism of folate antagonists. Annals of the New York Academy of Sciences, 186, 378–86.
Jones, D.P. & Go, Y.M. (2010). Redox compartmentalization and cellular stress. Diabetes Obesity Metabolism, 12(Suppl 2), 116–25.
Ju, C. & Uetrecht, J.P. (2002). Mechanism of idiosyncratic drug reactions: reactive metabolite formation, protein binding and the regulation of the immune system. Current Drug Metabolism, 3(4), 367–77.
Kagan, V.E., Jiang, J., Bayir, H., & Stoyanovsky, D.A. (2007). Targeting nitroxides to mitochondria: location, location, location, and …concentration? Highlight Commentary on “Mitochondria superoxide dismutase mimetic inhibits peroxide-induced oxidative damage and apoptosis: Role of mitochondrial superoxide”. Free Radical Biology and Medicine, 43(3), 348–350.
Kale, V.M., Hsiao, C.J., & Boelsterli, U.A. (2010). Nimesulide-induced electrophile stress activates Nrf2 in human hepatocytes and mice but is not sufficient to induce hepatotoxicity in Nrf2-deficient mice. Chemical Research in Toxicology, 23(5), 967–976.
Kang, P., Dalvie, D., Smith, E., Zhou, S., & Deese, A. (2007). Identification of a novel glutathione conjugate of flutamide in incubations with human liver microsomes. Drug Metabolism and Disposition, 35(7), 1081–1088.
Kaplowitz, N. (1977). Interaction of azathioprine and glutathione in the liver of the rat. Journal of Pharmacology and Experimental Therapeutics, 200(3), 479–486.
Kaplowitz, N. (2001). Drug-induced liver disorders: implications for drug development and regulation. Drug Safety, 24, 483–90.
Kashimshetty, R., Desai, V.G., Kale, V.M., Lee, T., Moland, C.L., & Branham, W.S. et al. (2009). Underlying mitochondrial dysfunction triggers flutamide-induced oxidative liver injury in a mouse model of idiosyncratic drug toxicity. Toxicology and Applied Pharmacology, 238(2), 150–159.
Kato, A., Yoshidome, H., Edwards, M.J., & Lentsch, A.B. (2000). Regulation of liver inflammatory injury by signal transducer and activator of transcription-6. The American Journal of Pathology, 157(1), 297–302.
Katsanos, K.H. & Tsianos, E.V. (2008). Azathioprine/6-mercaptopurine toxicity: The role of the TPMT gene. Annals of Gastroenterology, 20(4), 251–264.
Kehrer, J.P. (2000). The Haber-Weiss reaction and mechanisms of toxicity. Toxicology, 149(1), 43–50.
Kelley, E.E., Khoo, N.K., Hundley, N.J., Malik, U.Z., Freeman, B.A., & Tarpey, M.M. (2010). Hydrogen peroxide is the major oxidant product of xanthine oxidase. Free Radical Biology

138
and Medicine, 48(4), 493–498. Khan, N., Wilmot, C.M., Rosen, G.M., Demidenko, E., Sun, J., & Joseph, J. et al. (2003). Spin
traps: in vitro toxicity and stability of radical adducts. Free Radical Biology and Medicine, 34(11), 1473–1481.
Khan, S. & O'Brien, P. (1991). 1-Bromoalkanes as new potent nontoxic glutathione depletors in isolated rat hepatocytes. Biochemical and Biophysical Research Communications, 179(1), 436–441.
King, P.D. & Perry, M.C. (2001). Hepatotoxicity of chemotherapy. The Oncologist, 6(2), 162-176.
Klaunig, J.E., Kamendulis, L.M., & Hocevar, B.A. (2010). Oxidative stress and oxidative damage in carcinogenesis. Toxicologic Pathology, 38(1), 96–109.
Klebanoff, S.J. & Waltersdorph, A.M. (1988). Inhibition of peroxidase-catalyzed reactions by deferoxamine. Archives of Biochemistry and Biophysics, 264(2), 600–606.
Kolli, V.K., Abraham, P., Isaac, B., & Selvakumar, D. (2009). Neutrophil infiltration and oxidative stress may play a critical role in methotrexate-induced renal damage. Chemotherapy, 55(2), 83–90.
Kovacic, P. & Somanathan, R. (2013). Broad overview of oxidative stress and its complications in human health. Open Journal of Preventive Medicine, 3(1), 32–41.
Kundu, T.K., Velayutham, M., & Zweier, J.L. (2012). Aldehyde oxidase functions as a superoxide generating NADH oxidase: an important redox regulated pathway of cellular oxygen radical formation. Biochemistry, 51(13), 2930–2939.
Lee, A.U. & Farrell, G.C. (1999). Comparative toxicity of azathioprine to rat hepatocytes and sinusoidal endothelial cells in culture. In E. Wisse, D. Knook, R. de Zanger, & R. Fraser (Eds.), Cells of the hepatic sinusoid (1st ed., pp. 108–109). Leiden: Kupffer Cell Foundation.
Lee, A.U. & Farrell, G.C. (2001). Mechanism of azathioprine-induced injury to hepatocytes: roles of glutathione depletion and mitochondrial injury. Journal of Hepatology, 35(6), 756-–764.
Lee, E., Miki, Y., Katsljra, H., & Kariya, K. (1990). Mechanism of inactivation of myeloperoxidase by propylthiouracil. Biochemical Pharmacology, 39(9), 1467–1471.
Lee, W.M. (2003a). Acute liver failure in the United States. Seminars in Liver Disease, 23(3), 217–226.
Lee, W.M. (2003b). Drug-induced hepatotoxicity. New England Journal of Medicine, 349(5), 474–485.
Lena, N., Imbert, A.M., Pignon, T., Favre, R., Meyer, G., Cano, J.P., & Carcassonne, Y. (1984). Methotrexate-vindesine association in the treatment of head and neck cancer Influence of vindesine on methotrexate's pharmacokinetic behavior. Cancer Chemotherapy and Pharmacology, 12(2), 120–124.
Lennard, L., Welch, J.C., & Lilleyman, J.S. (1997). Thiopurine drugs in the treatment of childhood leukaemia: the influence of inherited thiopurine methyltransferase activity on drug metabolism and cytotoxicity. British Journal of Clinical Pharmacology, 44(5), 455–461.
Leonard, S.S., Xia, C., Jiang, B.H., Stinefelt, Klandorf, H., Harris, G.K., & Shi, X. (2003). Resveratrol scavenges reactive oxygen species and effects radical-induced cellular responses. Biochemical and Biophysical Research Communications, 309(4), 1017–1026.
Leung, Y., Sparrow, M.P., Schwartz, M., & Hanauer, S.B. (2009). Long term efficacy and safety

139
of allopurinol and azathioprine or 6-mercaptopurine in patients with inflammatory bowel disease. Journal of Crohn's and Colitis, 3(3), 162–167.
Liochev, S.I. (1999). The mechanism of "Fenton-like" reactions and their importance for biological systems. A biologist's view. Metal Ions in Biological Systems, 36, 1-–39.
Lip, H. (2014). The health consequences of fructose and its metabolite, dihydroxyacetone, and the hepatoprotective effects of selected natural polyphenols in rat hepatocytes (M.Sc. Dissertation), University of Toronto.
Luyendyk, J.P., Roth, R.A., & Ganey P.E. (2010). R. 9.13 - Inflammation and Hepatotoxicity. In C.A. McQueen (Ed.), Comprehensive Toxicology (2nd edition, pp. 295–317), Oxford: Elsevier.
Ma, Q. (2010). Transcriptional responses to oxidative stress: pathological and toxicological implications. Pharmacology & Therapeutics, 125(3), 376–393.
MacAllister, S.L. (2013). Investigating the cytotoxic mechanisms of hepatotoxicity induced by xenobiotics and their metabolites (Ph.D. dissertation), University of Toronto.
MacAllister, S.L., Choi, J., Dedina, L., & O’Brien, P.J. (2011). Metabolic mechanisms of methanol/formaldehyde in isolated rat hepatocytes: carbonyl-metabolizing enzymes versus oxidative stress. Chemico-Biological Interactions, 191(1), 308–314.
*MacAllister, S.L., *Maruf, A.A., Wan, L., Chung, E., & O'Brien, P.J. (2013a). Modeling xenobiotic susceptibility to hepatotoxicity using an in vitro oxidative stress inflammation model. Canadian Journal of Physiology and Pharmacology, 91(3), 236–240. *Equal contribution.
MacAllister, S.L., Young, C., Guzdek, A., Zhidkov, N., & O'Brien, P. (2013b). Molecular cytotoxic mechanisms of chlorpromazine in isolated rat hepatocytes. Canadian Journal of Physiology and Pharmacology, 91(1), 56–63.
Maciá, M.A., Carvajal, A., del Pozo, J.G., Vera, E., & del Pino, A. (2002). Hepatotoxicity associated with nimesulide: data from the Spanish Pharmacovigilance System. Clinical Pharmacology and Therapeutics, 72(5), 596–597.
Mannery, Y.O., Ziegler, T.R., Park, Y., & Jones, D.P. (2010). Oxidation of plasma cysteine/cystine and GSH/GSSG redox potentials by acetaminophen and sulfur amino acid insufficiency in humans. Journal of Pharmacology and Experimental Therapeutics, 333(3), 939–947.
Maruf, A.A., Lee, O., & O’Brien, P.J. (2014a). Modifications of mitochondrial function by toxicants. In M. Kaplan (Ed), Reference Module in Biomedical Sciences. Oxford: Elsevier (in press).
Maruf, A.A., Wan, L., & O’Brien, P.J. (2014b). Evaluation of azathioprine-induced cytotoxicity in an in vitro rat hepatocyte system. BioMed Research International, vol. 2014, Article ID 379748, 7 pages.
Mardini, H. & Record, C. (2005). Detection assessment and monitoring of hepatic fibrosis: biochemistry or biopsy? Annals of Clinical Biochemistry, 42(6), 441–447.
Marin-Kuan, M., Ehrlich, V., Delatour, T., Cavin, C., & Schilter, B. (2011). Evidence for a role of oxidative stress in the carcinogenicity of ochratoxin A. Journal of Toxicology, 645361.
Masaki, N., Kyle, M.E., & Farber, J.L. (1989). tert-Butyl hydroperoxide kills cultured hepatocytes by peroxidizing membrane lipids. Archives of Biochemistry and Biophysics, 269(2), 390–399.
Matsuzaki, Y., Nagai, D., Ichimura, E., Goda, R., Tomura, A., Doi, M., & Nishikawa, K. (2006). Metabolism and hepatic toxicity of flutamide in cytochrome P450 1A2 knockout SV129

140
mice. Journal of Gastroenterology, 41(3), 231–239. McDonnell, N.D. & Livingston, R.B. (1994). Severe reversible neutropenia following treatment
of prostate cancer with flutamide. The Journal of Urology, 151(5), 1353–1354. McGovern, D., Travis, S., Duley, J., Shobowale-Bakre, E., & Dalton, H. (2002). Azathioprine
intolerance in patients with IBD may be imidazole-related and is independent of TPMT activity. Gastroenterology, 122(3), 838–839.
McLeod, D.G. (1997). Tolerability of nonsteroidal antiandrogens in the treatment of advanced prostate cancer. The Oncologist, 2(1), 18–27.
Medzhitov, R. (2008). Origin and physiological roles of inflammation. Nature, 454(7203), 428–435.
Medzhitov, R. (2010). Inflammation 2010: new adventures of an old flame. Cell, 140(6), 771–776.
Mehta, R. (2011). Investigating the cytoprotective mechanisms of vitamins B6 and B1 against endogenous toxin-induced oxidative stress (Ph.D. Dissertation), University of Toronto.
Menor, C., Fernández-Moreno, M.D., Fueyo, J., Escribano, O., & Olleros, T. et al. (2004). Azathioprine acts upon rat hepatocyte mitochondria and stress-activated protein kinases leading to necrosis: protective role of N-acetyl-L-cysteine. Journal of Pharmacology and Experimental Therapeutics, 311(2), 668–676.
Mico, B.A., Federowicz, D.A., Ripple, M.G. & Kerns, W. (1988). In vivo inhibition of oxidative drug metabolism by, and acute toxicity of, 1-aminobenzotriazole (ABT). A tool for biochemical toxicology. Biochemical Pharmacology, 37(13), 2515–9.
Mingatto, F.E., Dos Santos, A.C., Rodrigues, T., Pigoso, A.A., Uyemura, S.A., & Curti, C. (2000). Effects of nimesulide and its reduced metabolite on mitochondria. British Journal of Pharmacology, 131(6), 1154–1160.
Mohammad, B.I., Hadi, N.R., & Swadi, A.A.J. (2011). Hepatoprotective Effect of Omega-3 and Selenium on Methotrexate induced Hepatotoxicity. Asian Journal of Pharmaceutical and Biological Research, 1(4), 431–440.
Moldéus, P., Högberg, J., & Orrenius, S. (1978). Isolation and use of liver cells. Methods in Enzymology, 52, 60–71.
Møller, S., Iversen, P., & Franzmann, M.B. (1990). Flutainide-induced liver failure. Journal of Hepatology, 10, 346–349.
Moore, D.E, Sik, R.H., Bilski, P., Chignell, C.F., & Reszka, K.J. (1994). Photochemical sensitization by azathioprine and its metabolites. Part 3. A direct EPR and spin-trapping study of light-induced free radicals from 6-mercaptopurine and its oxidation products. Photochemistry and Photobiology, 60(6), 574–581.
Moustafa, A.M. & Badria, F.A. (2010). Impact of L-arginine on azathioprine-induced chronic hepatotoxicity in mice: biochemical and ultrastructural study. Egyptian Journal of Histology, 33(3), 407–418.
Muller, F.L., Liu, Y., & Van Remmen, H. (2004). Complex III releases superoxide to both sides of the inner mitochondrial membrane. Journal of Biological Chemistry, 279(47), 49064–49073.
Murphy, M.P. (2009). How mitochondria produce reactive oxygen species. Biochemical Journal, 417, 1–13.
Núñez-Vergara, L.J., Farias, D., Bollo, S., & Squella, J.A. (2001). An electrochemical evidence of free radicals formation from flutamide and its reactivity with endo/xenobiotics of pharmacological relevance. Bioelectrochemistry, 53(1), 103–110.

141
Nair, U., Bartsch, H., & Nair, J. (2007). Lipid peroxidation-induced DNA damage in cancer-prone inflammatory diseases: a review of published adduct types and levels in humans. Free Radical Biology and Medicine, 43(8), 1109–1120.
Negre-Salvayre, A., Coatrieux, C., Ingueneau, C., & Salvayre, R. (2008). Advanced lipid peroxidation end products in oxidative damage to proteins. Potential role in diseases and therapeutic prospects for the inhibitors. British Journal of Pharmacology, 153(1), 6–20.
Neuman, M.G., Cameron, R.G., Haber, J.A., Katz, G.G., Malkiewicz, I.M., & Shear, N.H. (1999). Inducers of cytochrome P450 2E1 enhance methotrexate-induced hepatocytotoxicity. Clinical Biochemistry, 32(7), 519–536.
Nyström, T. (2005). Role of oxidative carbonylation in protein quality control and senescence. The EMBO Journal, 24(7), 1311–1317.
O'Brien, P.J. (1991). Molecular mechanisms of quinone cytotoxicity. Chemico-Biological Interactions, 80(1), 1–41.
O'Brien, P.J., Chan, K., Silber, P.M. (2004). Human and animal hepatocytes in vitro with extrapolation in vivo. Chemico-Biological Interactions, 150(1), 97–114.
O’Brien P.J. & Haskins J.R. (2006). In vitro Cytotoxicity Assessment. High content screening: A powerful approach to systems cell biology and drug discovery. In D.L. Taylor, J.R. Haskins & K. Giuliano (Eds.), Methods in Molecular Biology, 356 (pp. 415–425). Totoya, NJ: Humana Press.
O’Brien, P., & Siraki, A. (2005). Accelerated cytotoxicity mechanism screening using drug metabolizing enzyme modulators. Current Drug Metabolism, 6(2), 101–109.
Ojasoo, T. (1987). Nilutamide. Drugs Future, 12, 763–770. Olfert, E., Cross, B., & McWilliam, A. (1993). Guide to the care and use of experimental
animals (1st ed.). Ottawa: Canadian Council on Animal Care. Olson, H., Betton, G., Robinson, D., Thomas, K., Monro, A., Kolaja, G., et al. (2000).
Concordance of the toxicity of pharmaceuticals in humans and in animals. Regulatory Toxicology and Pharmacology, 32, 56–67.
Ostapowicz, G., Fontana, R.J., Schiodt, F.V., Larson, A., Davern, T.J., & Han, S.H. et al. (2002). Results of a prospective study of acute liver failure at 17 tertiary care centers in the United States. Annals of Internal Medicine, 137(12), 947–954.
Ou, P. & Wolff, S. (1996). A discontinuous method for catalase determination at ‘near physiological’ concentrations of H2O2 and its application to the study of H2O2 fluxes within cells. Journal of Biochemical and Biophysical Methods, 31(1-2), 59–67.
Pérez-Matute, P., Zulet, M., & Mart'inez, J. (2009). Reactive species and diabetes: counteracting oxidative stress to improve health. Current Opinion in Pharmacology, 9(6), 771–779.
Padeh, S., Sharon, N., Schiby, G., Rechavi, G., & Passwell, J.H. (1997). Hodgkin's lymphoma in systemic onset juvenile rheumatoid arthritis after treatment with low dose methotrexate. The Journal of Rheumatology, 24(10), 2035–2037.
Paravicini, T.M. & Touyz, R.M. (2008). NADPH oxidases, reactive oxygen species, and hypertension clinical implications and therapeutic possibilities. Diabetes Care, 31(Suppl 2), 170–180.
Park, B.K., Naisbitt, D.J., Gordon, S.F., Kitteringham, N.R., & Pirmohamed, M. (2001). Metabolic activation in drug allergies. Toxicology, 158(1), 11–23.
Penalva Polo, J.C., Gómez Andrés, A., Vela, P., & Niveiro, M. (2002). Acute liver failure in a patient with methotrexate therapy. Revista Espanola De Enfermedades Digestivas: Organo Oficial De La Sociedad Espanola De Patologia Digestiva, 94(7), 440–441.
142
Pereira, C.V., Nadanaciva, S., Oliveira, P.J., & Will, Y. (2012). The contribution of oxidative stress to drug-induced organ toxicity and its detection in vitro and in vivo. Expert Opinion on Drug Metabolism & Toxicology, 8(2), 219–237.
Perlman, Z.E., Slack, M.D., Feng, Y., Mitchison, T.J., Wu, L.F., & Altschuler, S. J. (2004). Multidimensional drug profiling by automated microscopy. Science, 306(5699), 1194–1198.
Pessayre, D., & Larrey, D. (1991). Drug-induced liver injury. In N. McIntyre, J. Benhamou, J. Bircher, M. Rizzeto, & J. Rodes (Eds.), Oxford Textbook of Clinical Hepatology (2nd edition, pp. 875–902). Oxford: Oxford University Press.
Petit, E., Langouet, S., Akhdar, H., Nicolas-Nicolaz, C., Guillouzo, A., & Morel, F. (2008). Differential toxic effects of azathioprine, 6-mercaptopurine and 6-thioguanine on human hepatocytes. Toxicology in Vitro, 22(3), 632–642.
Phillips, D.C., Woollard, K.J., & Griffiths, H.R. (2003). The anti-inflammatory actions of methotrexate are critically dependent upon the production of reactive oxygen species. British Journal of Pharmacology, 138(3), 501–511.
Pirmohamed, M., James, S., Meakin, S., Green, C., Scott, A.K., & Walley, T.J. et al. (2004). Adverse drug reactions as cause of admission to hospital: prospective analysis of 18 820 patients. British Medical Journal, 329(7456), 15–19.
Possel, H., Noack, H., Augustin, W., Keilhoff, G., & Wolf, G. (1997). 2, 7-Dihydrodichlorofluorescein diacetate as a fluorescent marker for peroxynitrite formation. FEBS Letters, 416(2), 175–178.
Radwanski, E., Perentesis, G., Symchowicz, S., & Zampaglione, N. (1989). Single and multiple dose pharmacokinetic evaluation of flutamide in normal geriatric volunteers. The Journal of Clinical Pharmacology, 29(6), 554–558.
Ray, S., Chowdhury, P., & Ray, S. (2008). Evaluation of protective effect of reduced glutathione on flutamide-induced lipid peroxidation and changes in cholesterol content using common laboratory markers. FABAD Journal of Pharmaceutical Sciences, 33, 1–10.
Raynaud, J.P., Bonne, C., Moguilewsky, M., Lefebvre, F., Belanger, A., & Labrie, F. (1984). The pure antiandrogen RU 23908 (Anandron), a candidate of choice for the combined antihormonal treatment of prostatic cancer: a review. The Prostate, 5(3), 299–311.
Raza, M., Ahmad, M., Gado, A., & Al-Shabanah, O.A. (2003). A comparison of hepatoprotective activities of aminoguanidine and N-acetylcysteine in rat against the toxic damage induced by azathioprine. Comparative Biochemistry and Physiology Part C: Toxicology & Pharmacology, 134(4), 451–456.
Read, A.E., Wiesner, R.H., LaBrecque, D.R., Tifft, J.G., Mullen, K.D., Sheer, R.L., et al. (1986). Hepatic veno-occlusive disease associated with renal transplantation and azathioprine therapy. Annals of Internal Medicine, 104(5), 651–655.
Richter, C., Park, J.W., Ames, B.N. (1988). Normal oxidative damage to mitochondrial and nuclear DNA is extensive. Proceedings of the National Academy of Sciences of the USA, 85(17), 6465–7.
Riechelmann, H. (2004). Cellular and molecular mechanisms in environmental and occupational inhalation toxicology. GMS Current Topics in Otorhinolaryngology, Head and Neck Surgery, 3, Doc02.
Rietdijk, S.T., Bertelsman, J., Hommes, D.W., Vogels, E., Reitsma, P.H., & Van Deventer, S.J.H. (2001). Genetic polymorphisms of the thiopurine S-methyltransferase (TPMT) locus in patients treated with azathioprine for inflammatory bowel disease. Gastroenterology,

143
120(Suppl):622A. Roberts, R.A., Ganey, P.E., Ju, C., Kamendulis, L.M., Rusyn, I., & Klaunig, J.E. (2007). Role of
the Kupffer cell in mediating hepatic toxicity and carcinogenesis. Toxicological Sciences, 96(1), 2–15.
Romagnuolo, J., Sadowski, D.C., Lalor, E., Jewell, L., & Thomson, A.B. (1998). Cholestatic hepatocellular injury with azathioprine: a case report and review of the mechanisms of hepatotoxicity. Canadian Journal of Gastroenterology, 12(7), 479–483.
Rosman, A.S., Frissora-Rodeo, C., Marshall, A.T., Reiter, B.P., & Paronetto, F. (1993). Cholestatic hepatitis following flutamide. Digestive Diseases and Sciences, 38(9), 1756–1759.
Rota, C., Chignell, C.F., & Mason, R.P. (1999). Evidence for free radical formation during the oxidation of 2'-7'-dichlorofluorescin to the fluorescent dye 2'-7'-dichlorofluorescein by horseradish peroxidase: Possible implications for oxidative stress measurements. Free Radical Biology and Medicine, 27(7), 873–881.
Roth, R.E. & Ganey, P.E. (2010). Intrinsic versus idiosyncratic drug-induced hepatotoxicity-two villains or one? Journal of Pharmacology and Experimental Therapeutics, 332(3), 692–697.
Roth, R.E. & Ganey, P.E. (2011). Animal models of idiosyncratic drug-induced liver injury-current status. Critical Reviews in Toxicology, 41(9), 723–739.
Roth, R.A., Harkema, J.R., Pestka, J.P., & Ganey, P.E. (1997). Is exposure to bacterial endotoxin a determinant of susceptibility to intoxication from xenobiotic agents? Toxicology and Applied Pharmacology, 147(2), 300–311.
Roth, R., Luyendyk, J.P., Maddox, J.F., & Ganey, P.E. (2003). Inflammation and drug idiosyncrasy-is there a connection? Journal of Pharmacology and Experimental Therapeutics, 307(1), 1–8.
Rubbo, H., Radi, R., Trujillo, M., Telleri, R., Kalyanaraman, B., Barnes, S., Kirk, M. & Freeman, B. A. (1994). Nitric oxide regulation of superoxide and peroxynitrite-dependent lipid peroxidation. Formation of novel nitrogen-containing oxidized lipid derivatives. Journal of Biological Chemistry, 269, 26066–26075.
Russmann, S., Zimmermann, A., Krähenbühl, S., Kern, B., & Reichen, J. (2001). Veno-occlusive disease, nodular regenerative hyperplasia and hepatocellular carcinoma after azathioprine treatment in a patient with ulcerative colitis. European Journal of Gastroenterology & Hepatology, 13(3), 287–290.
Russo, M.W., Galanko, J.A., Shrestha, R., Fried, M.W., & Watkins, P. (2004). Liver transplantation for acute liver failure from drug induced liver injury in the United States. Liver Transplantation, 10(8), 1018–1023.
Séguin, B. & Uetrecht, J. (2003). The danger hypothesis applied to idiosyncratic drug reactions. Current Opinion in Allergy and Clinical Immunology, 3(4), 235–242.
Scharschmidt, B. F., Lake, J. R., Renner, E. L., Licko, V., and Van Dyke, R. W., 1986. Fluid phase endocytosis by cultured rat hepatocytes and perfused rat liver: implications for plasma membrane turnover and vesicular trafficking of fluid phase markers. Proc. Natl. Acad. Sci. U. S. A 83, 9488-9492.
Sczesny, F., Hempel, G., Boos, J., & Blaschke, G. (1998). Capillary electrophoretic drug monitoring of methotrexate and leucovorin and their metabolites. Journal of Chromatography B: Biomedical Sciences and Applications, 718(1), 177–185.
Seither, R.L., Rape, T.J., & Goldman, I.D. (1989). Further studies on the pharmacologic effects

144
of the 7-hydroxy catabolite of methotrexate in the L1210 murine leukemia cell. Biochemical Pharmacology, 38(5), 815–822.
Sener, G., Ekcsiouglu-Demiralp, E., cCetiner, M., Ercan, F., & Yeugen, B.C. (2006). Beta-glucan ameliorates methotrexate-induced oxidative organ injury via its antioxidant and immunomodulatory effects. European Journal of Pharmacology, 542(1), 170–178.
Shanmugarajan, T.S., Prithwish, N., Somasundaram, I., Arunsundar, M., Niladri, M., Lavande, J.P., Ravichandiran, V. (2008). Mitigation of azathioprine-induced oxidative hepatic injury by the flavonoid quercetin in wistar rats. Toxicology Mechanisms and Methods, 18(8), 653–660.
Shaw, S. & Jayatilleke, E. (1990). The role of aldehyde oxidase in ethanol-induced hepatic lipid peroxidation in the rat. Biochemical Journal, 268, 579–583.
Sholar, P.W., Baram, J., Seither, R., & Allegra, C. (1988). Inhibition of folate-dependent enzymes by 7-OH-methotrexate. Biochemical Pharmacology, 37(18), 3531–3534.
Siegel, C.A. & Sands, B.E. (2005). Review article: practical management of inflammatory bowel disease patients taking immunomodulators. Alimentary Pharmacology & Therapeutics, 22(1), 1–16.
Silva, J. & O'Brien, P. (1989). Diaziquone-induced cytotoxicity in isolated rat hepatocytes. Cancer Research, 49(20), 5550–5554.
Singh, B.K., Tripathi, M., Chaudhari, B.P., Chaudhari, B.P., Pandey, P.K., & Kakkar, P. (2012). Natural terpenes prevent mitochondrial dysfunction, oxidative stress and release of apoptotic proteins during nimesulide-hepatotoxicity in rats. Plos One, 7(4), 34200.
Singh, B.K., Tripathi, M., Pandey, P.K., & Kakkar, P. (2010). Nimesulide aggravates redox imbalance and calcium dependent mitochondrial permeability transition leading to dysfunction in vitro. Toxicology, 275(1), 1–9.
Singh, I. (1996). Mammalian peroxisomes: metabolism of oxygen and reactive oxygen species. Annals of the New York Academy of Sciences, 804(1), 612–627.
Slater, T.F. (1988). Free radical mechanisms in tissue injury. Cell Function and Disease, Springer, 209–218.
Smeland, E., Bremnes, R.M., Andersen, A., Jaeger, R., Eide, T.J., Huseby, N.E., & Aarbakke, J. (1994). Renal and hepatic toxicity after high-dose 7-hydroxymethotrexate in the rat. Cancer Chemotherapy and Pharmacology, 34(2), 119–124.
Smeland, E., Fuskevåg, O.M., Nymann, K., Svendsen, J.S., Olsen, R., & Lindal, S. et al. (1996). High-dose 7-hydroxymethotrexate: Acute toxicity and lethality in a rat model. Cancer Chemotherapy and Pharmacology, 37(5), 415–422.
Smith, M.T., Thor, H., Hartzell, P., & Orrenius, S. (1982). The measurement of lipid peroxidation in isolated hepatocytes. Biochemical Pharmacology, 31(1), 19–26.
Snow, J.L. & Gibson, L.E. (1995). The role of genetic variation in thiopurine methyltransferase activity and the efficacy and/or side effects of azathioprine therapy in dermatologic patients. Archives of Dermatology, 131(2), 193–7.
Soule, B.P., Hyodo, F., Matsumoto, K., Simone, N.L., Cook, J.A., Krishna, M.C., & Mitchell, J.B. (2007). The chemistry and biology of nitroxide compounds. Free Radical Biology and Medicine, 42(11), 1632–1650.
Sparrow, M.P., Hande, S.A., Friedman, S., Cao, D., & Hanauer, S.B. (2007). Effect of allopurinol on clinical outcomes in inflammatory bowel disease nonresponders to azathioprine or 6-mercaptopurine. Clinical Gastroenterology and Hepatology, 5(2), 209–214.

145
Srinivasan, R., Buchweitz, J.P., & Ganey, P. E. (1997). Alteration by flutamide of neutrophil response to stimulation: implications for tissue injury. Biochemical Pharmacology, 53(8), 1179–1185.
Stadtman, E.R. & Levine, R.L. (2000). Protein oxidation. Annals of the New York Academy of Sciences, 899, 191–208.
Stadlmann, S., Zoller, H., Vogel, W., & Offner, F. (2002). COX-2 inhibitor (nimesulide) induced acute liver failure. Virchows Archiv, 440(5), 553–555.
Starke, P.E. & Farber, J.L. (1985). Endogenous defenses against the cytotoxicity of hydrogen peroxide in cultured rat hepatocytes. Journal of Biological Chemistry, 260(1), 86–92.
Straus, W., 1981. Cytochemical detection of mannose-specific receptors for glycoproteins with horseradish peroxidase as a ligand. Histochemistry 73, 39-47.
Steinsapir, J., Mora, G., & Muldoon, T.G. (1991). Effects of steroidal and non-steroidal antiandrogens on the androgen binding properties of the rat ventral prostate androgen receptor. Biochimica et Biophysica Acta-Molecular Cell Research, 1094(1), 103–112.
Tabassum, H., Parvez, S., Pasha, S.T., Banerjee, B.D., & Raisuddin, S. (2010). Protective effect of lipoic acid against methotrexate-induced oxidative stress in liver mitochondria. Food and Chemical Toxicology, 48(7), 1973–1979.
Tabrizi, B., Mohajeri, D., Mousavi, G., Farajzade, F., Khodadadi, A., Alizade, S., & Reihani, B. (2009). Biochemical and pathological study of protective effect of vitamin E in azathioprine-induced hepatotoxicity in rat. Journal of Biological Sciences, 9(4), 339–344.
Tafazoli, S. (2008). Mechanisms of drug-induced oxidative stress in the hepatocyte inflammation model (Ph.D. Dissertation), University of Toronto.
Tafazoli, S., Mashregi, M., & O'Brien, P. (2008). Role of hydrazine in isoniazid-induced hepatotoxicity in a hepatocyte inflammation model. Toxicology and Applied Pharmacology, 229(1), 94–101.
Tafazoli, S. & O’Brien, P. (2008). Accelerated cytotoxic mechanism screening of hydralazine using an in vitro hepatocyte inflammatory cell peroxidase model. Chemical Research in Toxicology, 21(4), 904–910.
Tafazoli, S. & O’Brien, P. (2009). Amodiaquine-induced oxidative stress in a hepatocyte inflammation model. Toxicology, 256(1), 101–109.
Tafazoli, S. & O'Brien, P. (2005). Peroxidases: a role in the metabolism and side effects of drugs. Drug Discovery Today, 10(9), 617–625.
Tafazoli, S., Spehar, D.D., & O'Brien, P. (2005). Oxidative stress mediated idiosyncratic drug toxicity. Drug Metabolism Reviews, 37(2), 311–325.
Thomas, J.A. & Aithal, G.P. (2005). Monitoring liver function during methotrexate therapy for psoriasis: are routine biopsies really necessary? American Journal of Clinical Dermatology, 6(6), 357–63.
Tan, H.H., Ong, W.M., Lai, S.H., Chow, W.C. (2007). Nimesulide-induced hepatotoxicity and fatal hepatic failure. Singapore Medical Journal, 48(6), 582–585.
Tapner, M.J., Jones, B.E., Wu, W.M., & Farrell, G.C. (2004). Toxicity of low dose azathioprine and 6-mercaptopurine in rat hepatocytes. Roles of xanthine oxidase and mitochondrial injury. Journal of Hepatology, 40(3), 454–463.
Tay, V.K., Wang, A.S., Leow, K.Y., Ong, M.M., Wong, K.P., & Boelsterli, U.A. (2005). Mitochondrial permeability transition as a source of superoxide anion induced by the nitroaromatic drug nimesulide in vitro. Free Radical Biology and Medicine, 39(7), 949–959.

146
Temple, R.J. & Himmel, M.H. (2002). Safety of newly approved drugs: implications for prescribing. The Journal of American Medical Association, 287(17), 2273–2275.
Tomasi, A., Billing, S., Garner, A., Slater, T.F., & Albano, E. (1983). The metabolism of halothane by hepatocytes: a comparison between free radical spin trapping and lipid peroxidation in relation to cell damage. Chemico-Biological Interactions, 46(3), 353–368.
Torrielli, M.V., Ugazio, G., Gabriel, L., & Burdino, E. (1974). Time course of protection by N,N'-diphenyl-p-phenylendiamine (DPPD) against carbon tetrachloride hepatotoxicity. Agents and Actions, 4(5), 383–390.
Toyokuni, S. (1998). Oxidative stress and cancer: The role of redox regulation. Biotherapy, 11(2-3), 147–154.
Traversa, G., Bianchi, C., Da Cas, R., Abraha, I., Menniti-Ippolito, F., & Venegoni, M. (2003). Cohort study of hepatotoxicity associated with nimesulide and other non-steroidal anti-inflammatory drugs. British Medical Journal, 327(7405), 18–22.
Tripathi, M., Singh, B.K., Mishra, C., Raisuddin, S., & Kakkar, P. (2010). Involvement of mitochondria mediated pathways in hepatoprotection conferred by Fumaria parviflora Lam. extract against nimesulide induced apoptosis in vitro. Toxicology in Vitro, 24(2), 495–508.
Tukov, F.F., Maddox, J.F., Amacher, D.E., Bobrowski, W.F., Roth, R.A., & Ganey, P.E. (2006). Modeling inflammation-drug interactions in vitro: a rat Kupffer cell-hepatocyte coculture system. Toxicology in Vitro, 20(8), 1488–1499.
Tunali-Akbay, T., Sehirli, O., Ercan, F., & Sener, G. (2010). Resveratrol protects against methotrexate-induced hepatic injury in rats. Journal of Pharmacy & Pharmaceutical Sciences, 13(2), 303–310.
Turrens, J. (2003). Mitochondrial formation of reactive oxygen species. The Journal of Physiology, 552(2), 335–344.
Tuschl, G., Hrach, J., Hewitt, P.G., & Stefan, O. (2008). Application of short- and long-term hepatocyte cultures to predict toxicities. In S. C. Sahu (Ed.), Hepatotoxicity: From genomics to in vitro and in vivo models (pp. 141–176), New York, NY: John Wiley.
Uetrecht, J. (2013). Chapter 11: Role of the adaptive immune System in idiosyncratic drug-induced liver injury. In N. Kaplowitz, L. D. DeLeve (Eds.), Drug-induced liver disease (3rd edition, pp. 175–193). Boston: Academic Press.
Uz, E., Oktem, F., Yilmaz, H.R., Uzar, E., & Ozgüner, F. (2005). The activities of purine-catabolizing enzymes and the level of nitric oxide in rat kidneys subjected to methotrexate: protective effect of caffeic acid phenethyl ester. Molecular and Cellular Biochemistry, 277(1-2), 165–170.
Uzar, E., Sahin, O., Koyuncuoglu, H.R., Uz, E., Bas, O., & Kilbas, S. et al. (2006). The activity of adenosine deaminase and the level of nitric oxide in spinal cord of methotrexate administered rats: protective effect of caffeic acid phenethyl ester. Toxicology, 218(2), 125–133.
Valko, M., Izakovic, M., Mazur, M., Rhodes, C.J., & Telser, J. (2004). Role of oxygen radicals in DNA damage and cancer incidence. Molecular and Cellular Biochemistry, 266(1-2), 37–56.
Valko, M., Leibfritz, D., Moncol, J., Cronin, M., Mazur, M.T., & Telser, J. (2007). Free radicals and antioxidants in normal physiological functions and human disease. The International Journal of Biochemistry & Cell Biology, 39(1), 44–84.
Valko, M., Rhodes, C.J., Moncol, J., Izakovic, M., & Mazur, M. (2006). Free radicals, metals

147
and antioxidants in oxidative stress-induced cancer. Chemico-Biological Interactions, 160(1), 1–40.
Van den Bosch, H., Schutgens, R.B., Wanders, R.J., & Tager, J.M. (1992). Biochemistry of peroxisomes. Annual Review of Biochemistry, 61(1), 157–197.
Van Steenbergen, W., Peeters, P., De Bondt, J., Staessen, D., Büscher, H., & Laporta, T. et al. (1998). Nimesulide-induced acute hepatitis: evidence from six cases. Journal of Hepatology, 29(1), 135–141.
Vardi, N., Parlakpinar, H., Cetin, A., Erdogan, A., & Cetin Ozturk, I. (2010). Protective effect of beta-carotene on methotrexate--induced oxidative liver damage. Toxicologic Pathology, 38(4), 592–597.
Vaz, S.M. & Augusto, O. (2008). Inhibition of myeloperoxidase-mediated protein nitration by tempol: Kinetics, mechanism, and implications. Proceedings of the National Academy of Sciences, 105(24), 8191–8196.
Vernier-Massouille, G., Cosnes, J., Lemann, M., Marteau, P., Reinisch, W., & Laharie, D. et al. (2007). Nodular regenerative hyperplasia in patients with inflammatory bowel disease treated with azathioprine. Gut, 56(10), 1404–1409.
Wada, T., Ueda, M., Abe, K., Kobari, T., Yamazaki, H. & Nakata, J., et al. (1999). Risk factor of liver disorders caused by flutamide--statistical analysis using multivariate logistic regression analysis. Hinyokika Kiyo, 45, 521–6.
Wang, H.X., Ma, X.C., Deng, Q.L. & Li, D. (2002). Cytotoxicity of flutamide and 2-hydroxyflutamide and their effects on CYP1A2 mRNA in primary rat hepatocytes. Acta Pharmacologica Sinica, 23(6), 562–6.
Welinder, K. G., 1985. Plant peroxidases. Their primary, secondary and tertiary structures, and relation to cytochrome c peroxidase. European Journal of Biochemistry. 151, 497-504.
Widemann, B.C., Sung, E., Anderson, L., Salzer, W.L., Balis, F.M., & Monitjo, K.S. et al. (2000). Pharmacokinetics and metabolism of the methotrexate metabolite 2, 4-diamino-N 10-methylpteroic acid. Journal of Pharmacology and Experimental Therapeutics, 294(3), 894–901.
Wolfrom, C., Hepp, R., Hartmann, R., Breithaupt, H., & Henze, G. (1990). Pharmacokinetic study of methotrexate, folinic acid and their serum metabolites in children treated with high-dose methotrexate and leucovorin rescue. European Journal of Clinical Pharmacology, 39(4), 377–383.
Wollina, U., Ständer, K., & Barta, U. (2001). Toxicity of methotrexate treatment in psoriasis and psoriatic arthritis-short-and long-term toxicity in 104 patients. Clinical Rheumatology, 20(6), 406–410.
Wu, E.Y., Smith, M.T., Bellomo, G., & Monte, D. (1990). Relationships between the mitochondrial transmembrane potential, ATP concentration, and cytotoxicity in isolated rat hepatocytes. Archives of Biochemistry and Biophysics, 282(2), 358–362.
Wu, Y.T., Shen, C., Yin, J., Yu, J.P., & Meng, Q. (2006). Azathioprine hepatotoxicity and the protective effect of liquorice and glycyrrhizic acid. Phytotherapy Research, 20(8), 640–645.
Wysowski, D.K., Freiman, J.P., Tourtelot, J.B., & Horton, M.L. 3rd (1993). Fatal and nonfatal hepatotoxicity associated with flutamide. Annals of Internal Medicine, 118(11), 860–864.
Xu, J.J, Diaz, D., & O’Brien, P. (2004). Applications of cytotoxicity assays and pre-lethal mechanistic assays for assessment of human hepatotoxicity potential. Chemico-Biological Interactions, 150(1), 115–128.
Yamamoto, N., Oliveira, M., Campello, A., Lopes, L., & Klüppel, M.L. (1988). Methotrexate:

148
studies on the cellular metabolism. I. Effect on mitochondrial oxygen uptake and oxidative phosphorylation. Cell Biochemistry and Function, 6(1), 61–66.
Yamamoto, N., Lopes, L.C., Campello, A.P., & Klüppel, M.L. (1989). Methotrexate: studies on cellular metabolism. II—Effects on mitochondrial oxidative metabolism and ion transport. Cell Biochemistry and Function, 7(2), 129–134.
Yang, M.D., Chordia, M., Li, F., Huang, T., Linden, J., & Macdonald, T.L. (2010). Neutrophil-and myeloperoxidase-mediated metabolism of reduced nimesulide: evidence for bioactivation. Chemical Research in Toxicology, 23(11), 1691–1700.
Yu, B.P. (1994). Cellular defenses against damage from reactive oxygen species. Physiological Reviews, 74(1), 139–62.
Yu, D., Brasch, H., & Iven, H. (1989). No influence of enzyme inhibitors on the hydroxylation of methotrexate in rats. Cancer Letters, 48(2), 153–-156.
Zafarullah, M., Li, W.Q., Sylvester, J., & Ahmad, M. (2003). Molecular mechanisms of N-acetylcysteine actions. Cellular and Molecular Life Sciences, 60(1), 6–20.
Zatón, A.M. & Ochoa de Aspuru, E. (1995). Horseradish peroxidase inhibition by thiouracils. FEBS Letters, 374(2), 192–194.
Zhao, H., Joseph, J., Zhang, H., Karoui, H., & Kalyanaraman, B. (2001). Synthesis and biochemical applications of a solid cyclic nitrone spin trap: a relatively superior trap for detecting superoxide anions and glutathiyl radicals. Free Radical Biology and Medicine, 31(5), 599–606.
Zimmerman, H.J. (1999). Hepatotoxicity: The Adverse Effects of Drugs and Other Chemicals on the Liver (2nd edition). Philadelphia: Lippincott, Williams & Wilkins.
Zini, R., Morin, C., Bertelli, A., Bertelli, A.A., & Tillement, J.P. (1999). Effects of resveratrol on the rat brain respiratory chain. Drugs under Experimental and Clinical Research, 25(2-3), 87–97.

149
LIST OF PUBLICATIONS AND ABSTRACTS
Full papers: Maruf, A.A. & O’Brien, P.J. (2014). Flutamide-induced cytotoxicity and oxidative stress in an
in vitro rat hepatocyte system. Oxidative Medicine and Cellular Longevity (under review).
Maruf, A.A., Wan, L., & O’Brien, P.J. (2014). Evaluation of azathioprine-induced cytotoxicity in an in vitro rat hepatocyte system. BioMed Research International, vol. 2014, Article ID 379748, 7 pages, 2014.
McAllister, S.L.*, Maruf, A.A.*, Wan, L., Chung, E., & O’Brien, P. J. (2013). Modeling xenobiotic susceptibility to hepatotoxicity using an in vitro oxidative stress inflammation model. Canadian Journal of Physiology and Pharmacology, 91(3):236–40. *Equal contribution.
Book chapters: Maruf, A.A. & O’Brien, P.J. (2014). Pharmaceutical agents. In J. Kehrer, L.-O. Klotz, & S.
Roberts (Eds.), Studies on Experimental Toxicology & Pharmacology. New York, NY: Springer (in press).
Maruf, A.A., Lee, O., & O’Brien, P.J. (2014). Modifications of Mitochondrial Function by Toxicants. In M. Kaplan (Ed), Reference Module in Biomedical Sciences. Oxford: Elsevier (in press).
Conference proceedings: Maruf, A.A., Lip, H., Li, R., & O’Brien, P.J. (2014). Protection against glyoxal and methyl
glyoxal-induced hepatotoxicity using ferulic acid and related ferulic acid derivatives. 17th International Workshop on the Enzymology and Molecular Biology of Carbonyl Metabolism, Pennsylvania, USA, July 8–13 (Oral and Poster).
Maruf, A.A. & O’Brien, P.J. (2014). Evaluation of flutamide-induced hepatotoxicity in an in vitro oxidative stress-inflammation model. 8th Meeting of the Canadian Oxidative Stress Consortium (COSC), Carleton University, Ottawa, Canada, June 11–13 (Poster).
Maruf, A.A. & O’Brien, P.J. (2014). Accelerated cytotoxicity mechanism screening of flutamide in isolated rat hepatocytes. 53rd Annual Meeting of the Society of Toxicology (SOT), Phoenix, Arizona, USA, March 23–27, 2014. The Toxicologist, 493 (Poster).
Maruf, A.A. & O’Brien, P.J. (2013). Potential molecular cytotoxic mechanisms of methotrexate in isolated rat hepatocytes. 10th International Society for the Study of Xenobiotics Meeting (ISSX), Toronto, Ontario, Canada, Sep 29-Oct 3. Drug Metabolism Reviews, 45(S1):176 (Poster).

150
Maruf, A.A., Arvadia, P., Michail, K., Khan, S.R., Siraki, A.G., & O’Brien, P.J. (2013). Effects of inflammation on 6-mercaptopurine induced cytotoxicity towards freshly isolated rat hepatocytes. 20th Annual Meeting Society for Free Radical Biology and Medicine (FRBM), San Antonio, Texas, USA, November 20–24. Free Radical Biology and Medicine, 65 (Suppl 2):37 (Poster).
Maruf, A.A. & O’Brien, P.J. (2013). Azathioprine-induced hepatotoxicity in an in vitro inflammation-immune model. 52nd Annual Meeting of the Society of Toxicology (SOT), San Antonio, Texas, USA, March 10-14. The Toxicologist, 512 (Poster).
Maruf, A.A. & O’Brien, P.J. (2012). Accelerated cytotoxicity mechanism screening of methotrexate using an in vitro hepatocyte inflammation-immune model. 33rd Annual Meeting of American College of Toxicology (ACT), Orlando, Florida, USA, November 4–7 (Poster).

151
COPYRIGHT ACKNOWLEDGEMENTS
1. Table 1.1 is reprinted from Idiosyncratic drug-induced liver injury: Mechanisms and
susceptibility factors, Volume 9.17, Boelsterli and Kashimshetty, In: Comprehensive Toxicology (Second Edition), edited by C.A. McQueen, pp. 383–402 © 2010, with permission from Elsevier.
2. Figure 1.1 is reprinted from Transcriptional responses to oxidative stress: Pathological and toxicological implications, Ma, Pharmacol. Ther., 125(3):376–93 © 2010, with permission from Elsevier.
3. Figure 1.3 is reprinted from Antioxidant defense mechanisms, Volume 9.14, Jaeschke, In: Comprehensive Toxicology (Second Edition), edited by C.A. McQueen, pp. 319–337 © 2010, with permission from Elsevier.
4. Figure 1.4 is reprinted from Is exposure to bacterial endotoxin a determinant of susceptibility to intoxication from xenobiotic agents? Roth and colleagues, Toxicol. Appl. Pharmacol., 147(2):300–11 © 1997 with permission from Elsevier.
5. Figure 1.5 is reprinted from Concurrent inflammation as a determinant of susceptibility to toxicity from xenobiotic agents, Ganey and Roth, Toxicol. Appl. Pharmacol., 147(2):300–11 © 2001, with permission from Elsevier.
6. Figure 1.6 is reprinted with permission from {Yang, M., Chordia, M.D., Li, F., Huang, T., Linden, J., Macdonald, T.L. Neutrophil- and myeloperoxidase-mediated metabolism of reduced nimesulide: Evidence for bioactivation. Chem. Res. Toxicol., 23(11):1691–1700}. Copyright {2010} American Chemical Society.
7. Figure 1.7 is reprinted with permission from {Ask, K., Dijols, S., Giroud, C., et al. Reduction of nilutamide by no synthases: implications for the adverse effects of this nitroaromatic antiandrogen drug. Chem. Res. Toxicol., 16(12):1547–1554}. Copyright {2003}American Chemical Society.
8. Figure 1.8 is reprinted with permission from Matsuzaki and colleagues, Metabolism and hepatic toxicity of flutamide in cytochrome P4501A2 knockout SV129 mice. J. Gastroenterol., 41(3):231–9. Copyright © 2006 Springer.
9. Figure 1.9 is reprinted from Capillary electrophoretic drug monitoring of methotrexate and leucovorin and their metabolites, Sczesny and colleagues, J. Chromatogr. B Biomed. Sci. Appl., 718(1), 177–185 © 1998 with permission from Elsevier.
10. Figure 1.11 is reprinted from Mechanism of azathioprine-induced injury to hepatocytes: Roles of glutathione depletion and mitochondrial injury, Lee and Farrell, J. Hepatol., 35(6), 756–764 © 2001, with permission from Elsevier.
11. Figure 2.2 and 2.3 are adapted from Lip (2014), M.Sc. dissertation, University of Toronto

152
with permission].
12. Table-3.1 and related results and discussion were reproduced from McAllister, S.L.*, Maruf, A.A.*, Wan, L., Chung, E., & O’Brien, P. J. (2013). Modeling xenobiotic susceptibility to hepatotoxicity using an in vitro oxidative stress inflammation model. Canadian Journal of Physiology and Pharmacology, 91(3):236–40. *Equal contribution, with permission © 2013 Canadian Science publishing.
13. All results and discussion related to azathioprine were reproduced from Maruf, A.A., Wan, L. & O’Brien, P.J. (2014). Evaluation of azathioprine-induced cytotoxicity in an in vitro rat hepatocyte system. BioMed Research International, vol. 2014, Article ID 379748, 7 pages, 2014. It is an open access article distributed under the Creative Commons Attribution License.


