
Evaluation of Best Practices in Restitution and Victim Compensation
Orders and Payments
R. Barry Ruback
Alison C. Cares
Stacy N. Hoskins
April 2006
R. Barry Ruback
Crime, Law, & Justice Program
Department of Sociology
Penn State University
University Park, PA 16802

2
Executive Summary
Over the past 25 years, the use of economic sanctions has increased because of pressures
to punish offenders, to reimburse victims, and to have offenders pay for the costs of prosecution,
incarceration, and supervision. In Pennsylvania there are at least 36 different county-level costs
and fees, as well as mandatory restitution, fines, and various state costs. This research project
was concerned with how these different economic sanctions are imposed and with whether they
are paid. In addition, the research examined whether state fees and restitution to the state were
imposed as mandated by law.
This research consisted of five parts. First, we coded data from approximately 2100
randomly selected adult criminal cases in six counties, in order to examine the imposition and
payment of different types of economic sanctions. Second, we examined data from
approximately 650 juvenile criminal cases in five counties in order to determine what factors
were related to the imposition and payment of economic sanctions. Third, we examined 228
DAVE (Dependable Access for Victimization Expenses) cases in four counties. These cases,
provided by the Pennsylvania Commission on Crime and Delinquency (PCCD), were those in
which the state had paid money to the victims, and the state was interested in knowing whether
restitution to the state had been ordered for the compensation paid to the victims. Fourth, we
sent a mail survey to victims in two counties in order to determine victims‟ reactions to the
criminal justice system, particularly the restitution process. Finally, we sent a mail survey to
offenders in two counties in order to learn about their understanding and perceptions of
economic sanctions, as well as their ability to make the ordered payments.
Adult and Juvenile Data
To examine the imposition and collection of criminal economic sanctions in
Pennsylvania, we collected data from six counties1: Blair, Centre, Cumberland, Delaware,
Lancaster, and Westmoreland. We selected these counties because they varied along four
dimensions that we suspected would influence the use and effect of economic sanctions: (a)
county population size, (b) the number of criminal cases processed by the county, (c) the
methods each county uses to collect economic sanctions, and (d) geographic location. In terms
of population size, Blair, Centre, and Cumberland Counties have relatively small populations,
Delaware and Lancaster Counties have substantially larger populations, and Westmoreland
County has a population midway between the other counties. In terms of annual caseloads, the
number of criminal cases processed varied closely with the population of the county; Blair,
Centre, and Cumberland Counties handled fewer criminal cases than the three other counties. In
terms of the method of collecting economic sanctions, all of the counties except Centre and
Westmoreland Counties used specialized collections units to collect economic sanctions.
Finally, in terms of geographical diversity, Westmoreland County is located in the western part
of the state, Centre and Blair Counties are located in the middle of the state, and Cumberland,
Delaware, and Lancaster Counties are located in the southeastern part of the state.
We created computerized data coding forms for the adult and juvenile cases in each
county. We recorded the following types of information: offender characteristics (e.g., race,
gender, age, and prior record), case characteristics (e.g., charge and conviction offenses, type of
disposition, and sentence imposed), victim characteristics (e.g., race, gender, age, and type of
1 We also coded data in a seventh county, Luzerne. However, because of limitations in the data, especially missing
data, we were unable to perform analyses for Luzerne that are comparable to those we performed in the other six
counties. We do provide information about Luzerne County in Appendix I.
3
injury), economic sanctions imposed and paid (e.g., fines, fees, costs, and restitution), and
recidivism. We also included several variables that record the different sources of information
used to collect data in each county.
In each county, we collected a random sample of approximately 500 adult cases and
approximately 200 juvenile cases from the year 2000. We chose to collect data from cases
docketed in the year 2000 in order to ensure that the case would have been resolved in terms of
guilt or innocence, that sentencing would have occurred, and that the offender would have had
some record of making or not making payments toward the amounts owed.
DAVE Cases
The Crime Victims Compensation (CVC) fund provides victims with compensation for
medical expenses, counseling, crime-scene cleanup, lost earnings, stolen benefits cash, funeral
expenses, and the like. When the CVC provides compensation to the victim, the judge is
mandated by law to order the offender to pay restitution to the CVC. To test whether judges are
ordering offenders to pay restitution to the CVC, we collected data from four counties: Centre,
Cumberland, Delaware, and Westmoreland.
The DAVE system, implemented on January 22, 2002, allows victim service providers to
file compensation claims electronically. Furthermore, the DAVE system helps victim advocates
determine the victim‟s eligibility and obtain the documentation necessary to process the victim‟s
claim. We obtained the list of DAVE cases from Ed Katz at PCCD. Because there were so few
DAVE cases per county per year, we recorded information about all of the DAVE cases in each
county that were on the PCCD list. We collected information about the DAVE cases using the
adult data coding forms created in the previous study.
Victim Survey
Victims are important to the criminal justice system because they can support efforts to
prosecute the crime they suffered and can report future crimes against them. To test whether
crime victims‟ satisfaction with the criminal justice system related to their perceptions of the
fairness of the process and their outcomes in their case, we surveyed 238 victims in two
Pennsylvania counties: Cumberland and Lancaster.
In both counties, we worked with county victim witness services personnel to obtain a list
of all victims who received orders of restitution in 2002 and 2003. After obtaining the two
samples, we mailed victims packets containing a cover letter from the victim witness services
office, two consent forms, a survey, and a one-dollar incentive. After we received the completed
survey and a signed consent form, we paid the victims an additional 10 dollars for their
participation.
The self-report survey was divided into four sections. The first section asked a series of
questions about the victimization: the type of crime of which they were a victim (e.g., burglary,
theft, robbery, assault, or other), when and where the victimization occurred, their relationship to
the offender(s), and the gender, race, and age of the offender(s). This section also included
questions about the case disposition and the victim‟s involvement in the criminal proceedings
(i.e., whether the victim testified at trial).

4
The second section asked victims about their experiences with the restitution process:
how victims became aware they were eligible for restitution, whether they completed a form to
receive restitution, and who determined the amount of restitution owed to them. This section
also asked victims whether the judge imposed an order of restitution, the amount and distribution
of restitution imposed (i.e., the amount of restitution awarded for medical bills, lost wages, lost
or stolen property, repair to property, or other), and how much restitution they had received so
far. Furthermore, victims were asked to indicate whether they felt the amount of restitution
imposed was fair and how well they understood the restitution process.
The third section asked victims about their experiences with the criminal justice system,
including the amount and quality of their contact with the police, the prosecutor/district attorney,
the judge, the probation officer, and the victim-witness advocate. Also included in this section
were questions about how much input victims believed they had at various stages of the criminal
justice process. Respondents were also asked to rate their likelihood of reporting crimes in the
future. Additionally, there was a 22-item scale assessing victims‟ punishment goals (e.g., just
deserts, revenge, recognition of victim status, deterrence of the offender, rehabilitation, general
deterrence, positive general prevention, victim security, and societal security).
The fourth section asked about the victim‟s background. Included in this section were
questions about the victim‟s gender, race, age, marital status, education, and socioeconomic
status. In all, the survey included 49 questions. The survey was pretested on victims who, after
completing the survey, participated in structured cognitive interviews, in which they were asked
their thought process when they initially completed the items.
Offender Survey
Because there are increased pressures to collect more money from offenders in order to
punish them, to make them pay at least part of their costs to the criminal justice system, and to
restore victims to their precrime condition, we were interested in the extent to which offenders
were able to make the ordered payments.
We conducted a survey of offenders in Blair and Westmoreland Counties in order to
obtain basic descriptive information about the offenders‟ economic situation, including their total
debts and total payments due to the criminal justice system. In addition, this study explored four
possible reasons for the low rate of payment of these sanctions: (a) lack of understanding of the
sanctions, (b) disagreement with the rationale for the sanctions, (c) perception that the sanctions
are unfairly applied, and (d) lack of money to pay the sanctions.
In both counties, we worked with local probation personnel to obtain a list of all
offenders who were sentenced in 2003. After obtaining the two samples, we mailed offenders
packets containing a cover letter from the probation office, two consent forms, a survey, and a
one-dollar incentive. Participants were promised that their responses would remain completely
confidential and would not be shared with their probation officers or any other criminal justice
personnel. After we received the completed survey and a signed consent form, we paid the
offender an additional 10 dollars for their participation.
The self-report survey was divided into four sections. The first section asked a series of
questions about the offense and the punishment for the crime, in terms of incarceration and
probation. The second section asked offenders about the economic sanctions in their case,
including the amounts for costs, fees, fines, and restitution and the payments they had made.
5
This section also asked offenders how well they understood how the various amounts of
economic sanctions were set. The third section asked offenders about their case, including their
perceived responsibility for the crime, the judgments about the amounts and procedures for
economic sanctions in their case. Additionally, there was a 22-item scale assessing offenders=
understanding of different punishment goals as they applied to their case (e.g., just deserts,
revenge, recognition of victim status, deterrence of the offender, rehabilitation, general
deterrence, positive general prevention, victim security, and societal security). The fourth
section asked for the offenders‟ opinions about economic sanctions in general, including their
perception of the burden that payment placed on them and other offenders. The final section
asked about the offender=s background. Included in this section were questions about the
offender=s gender, race, age, marital status, education, and socioeconomic status. In all, the
survey included 41 questions.
Summary of Findings Across Studies
This multimethod research program was designed to answer questions about the
imposition and payment of different types of economic sanctions in Pennsylvania. In prior
research we had focused on restitution. In this set of studies, in addition to restitution we
examined fees, fines and costs, and focused especially on two mandatory state costs, Crime
Commission Cost (CCC) and Crime Victim‟s Compensation Fund (CVC).
A. Variation in the Definition and Use of Economic Sanctions
Counties vary significantly in their use of economic sanctions. There were large
differences in what is termed a cost or fee and in terms of how restitution is used. We found
relatively high levels of variation among the counties in terms of the rates of imposition of all
types of economic sanctions.
Part of the reason for this difference among counties relates to differences in practice
(i.e., informal rules about the imposition of economic sanctions) rather than to differences in
explicit policy (i.e., formal guidelines about the imposition of economic sanctions). For
example, Cumberland County seldom imposed fines, fees, or costs for juvenile cases in the year
2000. In Delaware County, economic sanctions could be paid by the county, in which case the
juvenile usually completed community service in lieu of court costs, by the parents, or by the
juvenile.
There were also differences among counties in terms of the economic sanctions they
imposed. For example, Lancaster imposes a $10 per month administration fee for probation on
top of the $25 per month supervision fee. Other counties have only a flat supervision fee of $25.
Some counties charge fees for staying in jail (e.g., Centre County has a jail maintenance fee), and
counties package fees for DUI convictions differently.
B. Imposition of Economic Sanctions
1. Crime-Related Factors vs. Offender-Related Factors
In general, we found that the imposition of economic sanctions was dependent more on
crime-related factors, such as severity and type of crime, than on offender-related factors such as
age, race, or gender. As one would expect, higher levels of all economic sanctions varied
6
directly with the severity of the conviction offense, such that higher levels of economic sanctions
were imposed for more severe crimes. In general, higher levels of fines and costs were imposed
for traffic and DUI than for other types of crimes. Overall, crime-related and offender-related
factors did not explain very well the total amount of economic sanctions ordered.
2. Adult vs. Juvenile Offenders
In general, we found that economic sanctions were more consistently imposed on adults
than on juveniles. This difference is not too surprising, since many mandated costs and fees do
not apply to juvenile cases. Moreover, this pattern is consistent with the fact that juvenile
offenders are less able than adults to pay (because of lack of income) and with the fact that
juvenile cases are more likely to be handled informally and with more individually tailored
sanctions.
3. Mandatory State Penalties
We investigated two mandatory state penalties, Crime Victim Compensation (CVC) and
Crime Commission Cost (CCC). Although CVC is mandatory for adults, we found rates of
imposition across six counties ranging from 86% to 97% (M = 91%).2 Across counties, CVC
was generally less likely to be imposed for summary offenses. We found rates of imposition of
CCC ranging from 84% to 97% (M = 90%). As with CVC, CCC was generally less likely to be
imposed for summary offenses.
As with the adult sample, we investigated the rates of imposition of Crime Victim
Compensation (CVC) and Crime Commission Cost (CCC) for juvenile cases. The imposition of
these costs for juveniles is mandatory only for consent decrees and adjudications of delinquency;
costs do not have to be ordered for informal adjustments or deferred hearings. For juveniles, we
found rates of imposition of CVC across four counties ranging from 19% to 82% (M = 55%).
Being adjudicated delinquent was positively related to imposition in two of the four counties.
We found rates of imposition of CCC ranging from 42% to 82% (M = 67%). In two of the three
counties in which we collected data, CCC was significantly more likely to be imposed when the
juvenile was adjudicated delinquent.
4. DAVE Cases
When the CVC provides compensation to the victim, the judge is supposed to order the
offender to pay restitution to the CVC. We examined four counties to determine whether in fact
restitution was ordered. At the low end, the percentage of cases in which judges acknowledged
CVC restitution was 3% in Delaware County. Next highest was Westmoreland County (19%).
At the high end were Centre County (50%) and Cumberland County (56%). The average
amount of CVC restitution ordered was lowest in Centre County ($741). Delaware County
($2,301), Westmoreland County ($3,196), and Cumberland County ($5,428) all imposed higher
amounts of CVC restitution.
2 The symbol M refers to the mean or average.

7
C. Payment of Economic Sanctions
1. Crime-Related Factors vs. Offender-Related Factors
In general, we found that case-related factors were better predictors than offender-related
factors of payment. The percent of economic sanctions paid was significantly lower for property
offenders than for offenders convicted of personal, drug, traffic or other offenses. Compared to
nonincarcerated offenders, incarcerated offenders paid a lower percentage of their economic
sanctions.
2. Adult vs. Juvenile Offenders
In terms of payment of economic sanctions overall, juveniles usually paid as high or a
higher percentage of the amount they owed than adults (perhaps reflecting that the economic
sanctions levels imposed on them are more reasonable to their situation than for adults). Also, in
three out of five counties, juveniles sentenced to a commitment rather than probation paid
significantly less of their economic sanctions, consistent with the finding that adults who went to
prison paid a significantly smaller percentage of their economic sanctions.
3. Mandatory State Penalties
The percent of adult cases in which CVC was paid in full ranged from 44% to 68% (M =
56%). Across counties, the percent of cases in which CVC was paid in full was significantly
higher for offenders convicted of drug or traffic offenses and significantly lower for offenders
incarcerated in jail. The percent of cases in which CCC was paid in full ranged from 44% to
68% (M = 55%). As with CVC, the percent of cases in which CCC was paid in full was
significantly higher for offenders convicted of traffic offenses and significantly lower for
offenders incarcerated in jail
.
We were also interested in the percent of cases in which CVC and CCC were paid in full
for juvenile cases. However, in most cases this information was unavailable.
D. Victims and Restitution
Victims are important to the criminal justice system because they can support efforts to
prosecute the crime they suffered and can report future crimes against them. We were
particularly interested in how victims judged the fairness of the outcomes they received (e.g.,
restitution, the offender‟s sentence) and the procedures by which those outcomes were reached
(e.g., how information was gathered, how much voice they had in the final decision). Research
suggests that individuals care about both the outcomes they receive and the process by which
those outcomes were reached.
To test whether crime victims‟ satisfaction with the criminal justice system was related to
their perceptions of the fairness of their outcomes and the procedures in their case, we surveyed
238 victims in two Pennsylvania counties. Results indicated that victims were more satisfied
with procedural than outcome fairness and that the more satisfied victims were with the
outcomes and procedures in their case, the more willing they said they would be to report crimes
in the future. Overall, women said they desired more input into criminal justice decisions, and

8
this difference may explain the general finding that women are more likely than men to report
crimes to the police.
E. Offenders and Economic Sanctions
We explored four possible reasons for offenders‟ low rate of payment of economic
sanctions: (a) lack of understanding of the sanctions, (b) disagreement with the rationale for the
sanctions, (c) perception that the sanctions are unfairly applied, and (d) lack of money to pay the
sanctions. Although there was some support for the first three explanations, offenders‟ reported
lack of money was the best predictor of nonpayment.
We asked both victims and offenders to rate the importance of 22 reasons for punishing
offenders. Offenders and victims differed significantly on 20 of the 22 items; the only 2
nonsignificant items related to rehabilitation. Most of the differences between the two groups
were large. On four items in particular, the differences were very large: three of the items related
to victim or societal safety, and the fourth item concerned restitution to the victim. Victims were
much more likely than offenders to say that their safety and the safety of society is an important
reason for punishing offenders. Moreover, victims were much more likely than offenders to say
that restoring victims to their precrime condition is an important purpose for punishment.
Recommendations
We suggest that PCCD consider two recommendations regarding understanding and
consistency.
1) Understanding
Our survey of offenders indicated that they had little understanding (a) of how the
economic sanctions they were ordered to pay were set and (b) of where their payments were
directed. They also seemed to have little understanding of how much they owed in total.
Understanding could be increased if offenders were reminded of what they owe for each type of
economic sanction.
2) Consistency
Across counties, and even within counties, there is a high level of variation in how
economic sanctions are handled. In conversations with different staff members, we received
different information about procedures and policies. We think it would be helpful if each county
had a list explaining all of the possible economic sanctions that could be imposed, as well as a
clear description of the policies and procedures operating in the county.
9
Acknowledgments
We received an extraordinary amount of help during the two years in which we collected data. First, we
would like to thank the staff at PCCD, particularly Doug Hoffman, Carol Lavery, and Ed Katz for their
help.
Second, we would like to thank the President Judges in the Counties for giving us approval to conduct the
research. We would also like to thank the Clerks of Court, Chief Probation Officers, Victim-Witness
Advocates, probation staffs, and clerk of courts staffs for helping us collect the data and answering our
questions. These individuals are listed below by county.
Blair County
Judge Thomas Peoples, Jr., President Judge
Carol Newman, Prothonotary & Clerk of Courts
Stan Sral, Chief Adult Probation Officer
Staff in Adult Probation – Catherine Wyland
Doug Weaver, Adult Probation
Doug Keating, Assistant DA
David Gorman, District Attorney
Sue Griep, Victim Witness Coordinator
Centre County
Judge Charles C. Brown, Jr., President Judge
Tom Young, Director of Probation & Parole
Debra Reed, Probation & Parole
Deborah Immel, Prothonotary & Clerk of Courts
Judge Charles Brown, President Judge
Pat Mitara, Probation & Parole
Cumberland County
Judge George E. Hoffer, President Judge
Sam Miller, Chief, Juvenile Probation
John Roller, Chief, Adult Probation
Chuck Bear, Adult Probation
Judge George Hoffer, President Judge
Donna Vandemortel, Executive Director, Victim Services Division, District Attorney's
Office
Karla Kocher, Victim Services Division, District Attorney's Office
Joe Osenkarski, Retired, Chief, Juvenile Probation
Tom Boyle, Juvenile Probation
Delaware County
Judge Kenneth A. Clouse, President Judge
Danielle Dimatteo, Juvenile Probation
Philip Damiani, Court Executive Director
Kenneth Clouse, President Judge
Nancy in Adult Probation
Lancaster County
Judge Michael A. Georgelis, President Judge
Chris Reed, Supervisor, Collections Enforcement Unit, Adult Probation & Parole
Pam Grosh, Victim-Witness Office
10
David Mueller, Director, Juvenile Probation & Parole
Jeff Worley, Senior Probation Officer, Juvenile Probation & Parole
Dale Denlinger, Clerk of Courts
Staff in Clerk of Courts – Dee, Donna, Marie
Staff in Files Office – Carol, Lynn, Florence, Herb
Luzerne County
Judge Michael T. Conahan, President Judge
Karl Blight
Phyllis Mantione
Bob O'Reilly, Clerk of Courts
Pat in Clerk of Courts Office
Westmoreland County
Judge Daniel J. Ackerman, President Judge
John J. Driscoll, Juvenile Court Judge
Andrew Urban, Director of Adult Probation
Heather Stegman, Adult Probation
Paul S. Kuntz, Court Administrator
David L. Patterson, Clerk of Courts
Brenda Wright, Accounts Supervisor, Clerk of Courts Office
Addie Beighley, Director of Juvenile Probation
Third, we would like to thank the members of our Advisory Committee: Mary Achilles (Office of Victim
Advocate), Bret Bucklen (Department of Corrections), Chad Firestone (JNET), Tom Green (Juvenile
Court Judges Commission), Pamela Grosh (Lancaster County District Attorney‟s Victim Witness
Services), Deborah Buchanan Haar (Dauphin County Victim Witness), Doug Hoffman (PCCD),
Annmarie Kaiser (Pennsylvania District Attorneys Association), Ed Katz (PCCD), Carol Lavery (PCCD),
Warren Klunk (Department of Revenue), Ron Mull (Treasury), Lawrence Murray (County Chief Adult
Probation Officers Association), Brinda Penyak (County Commissioners Association), Bob Reiber
(Pennsylvania Board of Probation and Parole), Laurie Reiley (Victim/Witness Assistance Program),
Michael Schwoyer (Pennsylvania House of Representatives Judiciary Committee), Tom Shuster
(Pennsylvania Council of Chief Juvenile Probation Officers), Jennifer Storm (Victim/Witness Assistance
Program), and Donna VandeMortel (Cumberland County District Attorney‟s Victim Services Division).
Fourth, we would like to thank Mark Bergstrom, Cynthia Kempinen, Jodi Ripka, Phil Ponselle, and Cathy
Dittman at the Pennsylvania Commission on Sentencing for their help in conducting the research and
managing the grant.
Finally, we would like to thank Ben Feldmeyer, who helped develop the coding instruments and
supervised undergraduate students during the first year of the project. In addition, we would like to thank
the undergraduates who went to the counties to collect data from court records and probation files.
During 2003, the students were Adrienne Lonas, Jessica Ames, Patrick Smythe, Laura Detweiler, Stefanie
Hauck, and Tara Gardner. During 2004 and 2005, the students were Jennifer Krupa, Nora Flaherty,
Lauren Merian, Daniel Brian, Kevin Bilwin, and Mary Dzielski.
11
Table of Contents
Executive Summary ……………………………………………………………………… 1
Acknowledgments …………………………………..……………………………………. 9
Chapter 1 - Introduction, Literature Review, Overview of the Studies ………………….. 12
Chapter 2 - Adult Data – Calendar Year 2000
Blair, Centre, Cumberland, Delaware, Lancaster, & Westmoreland Counties …... 32
Chapter 3 - Juvenile Data – Calendar Year 2000
Blair, Centre, Delaware, Lancaster, & Westmoreland Counties………………….. 53
Chapter 4 - DAVE Cases
Centre, Cumberland, Delaware, & Westmoreland Counties ……………………… 65
Chapter 5 - Victim Survey ……………………………………………………………… 69
Chapter 6 - Offender Survey …………………………………………………………….. 90
Chapter 7 - Summary, Discussion, and Implications …………………………………….. 114
References ……………………………………………………………………………… 127
Appendix A Adult Master Data Collection Form …………………………………… 138
Appendix B Juvenile Master Data Collection Form ……………………………… …. 139
Appendix C Complete List of Variables …………………………………………….. 140
Appendix D Blair County …………………………………………………………… 150
Appendix E Centre County …………………………………………………………… 156
Appendix F Cumberland County…………………………………………………… 167
Appendix G Delaware County……………………………………………………… 177
Appendix H Lancaster County……………………………………………………….. 185
Appendix I Luzerne County………………………………………………………….. 198
Appendix J Westmoreland County…………………………………………………… 203
Appendix K Victim Survey Questionnaire and Descriptive Statistics……………….. 211
Appendix L Offender Survey Questionnaire and Descriptive Statistics ……………… 218

12
Chapter 1: Introduction
Literature Review and Overview of the Studies
This project was funded by the Pennsylvania Commission on Crime and Delinquency
(PCCD) in order to determine how economic sanctions are imposed in Pennsylvania and whether
those sanctions are paid. In particular, PCCD was interested in whether two state fines, the CCC
and the CVC, were imposed for every offense as mandated by law and whether these costs were
paid. PCCD was also interested in whether judges imposed restitution on offenders to be paid to
the CVC Fund in cases in which PCCD had already paid compensation to the victim.
Literature Review3
Although economic sanctions have been criticized because they are perceived to be unfair
to poor defendants, to have no effect on wealthy defendants, and to be unenforceable because it
is unconstitutional to imprison offenders for nonpayment of debt, three pressures suggest that
they are likely to be used more frequently in the future. First, the costs of criminal justice
operations are becoming so prohibitively high that offenders are now expected to pay at least
part of those costs, even the costs of incarceration (Butterfield, 2004). Second, concern for
victims has increased, so that restitution is likely to be awarded more frequently (Office for
Victims of Crime, 1998). Third, although the number of prisoners has jumped from 218,205 at
year-end 1974 (Hindelang, Gottfredson, Dunn, & Parisi, 1977, p. 686) to 1,381,892 at year-end
2000 (Beck & Harrison, 2001), imprisonment is now less likely than it was 10 years ago (Levin,
Langan, & Brown, 2000). This trend means that there are increasing pressures for intermediate
sanctions, including economic sanctions, both because of the high cost of incarceration and
because of the beliefs that long periods of incarceration are unjustified on grounds of just deserts
and are ineffective in deterring future crime.
Although economic sanctions are typically discussed as if they were independent, it is
3 Most of this literature review comes from Ruback and Bergstrom (2006).

13
important to note that in practice economic sanctions are generally additional penalties rather
than sole sanctions (Hillsman, 1990). Moreover, there are likely to be multiple economic
sanctions. For example, Meyer and Gray (1997) found that convicted DUI offenders in a county
in southern California had to pay about $1,200, including a fine of $390, $664 in statutorily
mandated penalty assessment fees, $50 for the Alcohol Abuse Prevention Fund, a $37 fee for
testing, a $25 citation fee, and a $25 payment to the state restitution fund.
The primary legal limitation on the use of economic sanctions is that under the U.S.
Constitution, individuals cannot be imprisoned for debt. Thus, if an indigent defendant cannot
pay fees or restitution, the state cannot revoke probation. In Bearden v. Georgia (1983), the
Supreme Court held that for offenses for which imprisonment is not an authorized penalty,
judges cannot impose incarceration as a penalty for default unless there is a hearing that
determines the defendant has the ability to pay but willfully does not. For indigent offenders,
judges must consider whether societal goals of punishment and deterrence can be accomplished
through a noncustodial sanction.
Economic sanctions have five advantages. First, compared with incarceration, they are
about as effective in deterring future crime (Gordon & Glaser, 1991) but are substantially
cheaper, because the state does not have to pay for housing (Morris & Tonry, 1990). Moreover,
economic sanctions can avoid the stigma and secondary effects of incarceration, such as loss of
employment and dependents who would otherwise have to rely on public assistance (Gordon &
Glaser, 1991). Second, economic sanctions can be delivered more consistently than other types
of sanctions, an important advantage because continuous punishment, in which punishment is
delivered after every response, deters behavior better than intermittent punishment, in which
punishment is delivered after some, but not every, response (Brennan & Mednick, 1994). In

14
general, it is easier to impose financial penalties after every crime than to impose incarceration
after every crime. Third, compared with simple probation, economic sanctions are more
punitive. Fourth, economic sanctions are flexible, in that they can be adjusted to the facts of the
case and the changing circumstances of the offender. Moreover, they can be used alone, with
incarceration, with probation, or with both incarceration and probation. Fifth, evaluating the
basic fulfillment of economic sanctions is relatively easy and straightforward, and is usually
determined by an offender‟s level of payment.
Continuum of Economic Sanctions
Economic sanctions rest on a continuum, ranging from sanctions that most directly
benefit the victim to those that most directly punish the offender. At the extremes of this
continuum, the purposes of economic sanctions are fairly clear: restitution focuses almost
exclusively on reparation to a specific victim (with little or no consideration of punishing the
offender), while fines focus almost exclusively on punishing the offender (with little or no
consideration of reparation to a victim). However, most economic sanctions are less pure in
purpose and occupy the „middle ground,‟ because they seek reparations for „society‟ as a victim
(and in particular the court system), and require offenders to pay substantial (and increasing)
amounts in an effort to hold them accountable for their actions. These „middle ground‟
economic sanctions include costs and fees.
Victim-Focused Economic Sanctions (Restitution)
Restitution, a payment by the offender to the victim for financial losses, embodies both
the just deserts notion of offense-based penalties and concern for the victim (Harland, 1981).
Until the late 1970s, state statutes broadly stated that restitution may be ordered, but did not
specify the conditions under which restitution would be appropriate (Harland, 1980, p. 3). By
15
1990, all states had implemented statutes regarding restitution (Shapiro, 1990), consistent with
the recommendation of the President‟s Task Force on Victims of Crime (1982).
Contemporary use. In most states, restitution is a permissible condition of probation,
although some states have made restitution a mandatory condition in every case (Klein, 1997, p.
154). In some states, restitution is justified by its rehabilitative effects on offenders, whereas in
other states it is justified by its restorative effects on victims. Restitution is aimed at doing
justice by having the offender compensate a victim for damages caused by the crime.
Nationally, restitution is handled in one of four different ways (McGillis, 1986): (a) as a
component of Victim/Witness Assistance Programs, (b) through Victim-Offender Reconciliation
Programs (VORP), (c) in conjunction with probation or parole supervision, and (d) through
court-based employment programs. The first two methods, Victim/Witness Assistance Programs
and VORPs, are victim-focused agencies, whereas the last two methods, probation/parole
supervision and court-based employment programs, are offender-focused agencies.
Victim/Witness Assistance Programs usually focus on the economic aspects of restitution,
whereas VORPs typically focus on the psychological harm resulting from the victimization.
To be fair to victims, restitution programs must give them the opportunity to make a
claim for all relevant losses. In most states, victims are limited to economic losses that are
“easily ascertainable” (McGillis, 1986, p. 36). Some states use the general language of “losses
and damages,” whereas others list specific types of losses, such as medical expenses and stolen
property. Most states do not allow restitution for pain and suffering and other general damages,
because judges believe that these damages should be sought in civil suits. The other aspect of
fairness to victims is that they not be misled into believing that they will recover restitution in
full (McGillis, 1986, p. 36).
16
To be fair to offenders, McGillis (1986, pp. 35-40) argued that restitution programs
should meet four standards. First, they should use selection criteria that treat all victims equally.
Research suggests that poor offenders, including minority offenders, are less likely to be ordered
to pay restitution than are nonpoor offenders (Hudson & Chesney, 1977). Second, restitution
programs should use fair procedures to determine the amount of damages owed the victim.
When probation officers believe that an amount is distorted, they should investigate without
offending the victim and then rely on the sentencing hearing to bring out the truth of the claim.
Third, restitution programs should give offenders the opportunity to challenge restitution
recommendations. Many states provide that offenders have the opportunity to participate in a
restitution plan prior to the sentencing hearing, and some states allow offenders to a detailed
hearing in which the defendant can challenge the victim‟s claims of losses. Fourth, the judge‟s
restitution order must be precise about the amount of restitution owed and the schedule for
paying it. In states, where restitution can be ordered only as a condition of probation, the period
of probation must be long enough to allow offenders to reasonably meet their financial
obligations.
Nationally, restitution is imposed in 14% of all felony convictions: 13% for violent
offenses, 26% for property offenses, 6% for drug offenses, 6% for weapons offenses, and 10%
for other offenses (Durose & Langan, 2003). Restitution programs have generally been seen as
unsuccessful for three reasons (Office for Victims of Crime, 1998, p. 358): (a) judges are
reluctant to impose restitution on offenders who are assumed to be unable to pay it; (b) payment
on restitution orders typically follows other financial obligations (e.g., costs, fines); and (c) there
is often ambiguity about who is responsible for monitoring, collecting, disbursing, and enforcing
restitution payments. Moreover, there are differences among states in terms of whether indirect
17
victims (e.g., insurance companies) and local governments are entitled to restitution (Klein,
1997).
Research. Studies with adults suggest that judges are more likely to order restitution
when the offender is better educated and employed, characteristics that make it more likely that
the offender will pay the imposed restitution (Lurigio & Davis, 1990). In a Bureau of Justice
Statistics study of felony probation in 32 counties, the average restitution order imposed per
probationer was $3,368, of which on average only 54% was paid by the time probationers had
completed their sentences (Cohen, 1995). Research with adults suggests that the collection rates
of restitution are low, 45% in one national study (Smith, Davis, & Hillenbrand, 1989) and 34%
in Cook County (Chicago) (Lurigio, 1984). If offenders have no money, they are often unwilling
to make any efforts to pay the restitution (Galaway & Hudson, 1975). The likelihood of
payment is increased if offenders are (a) told about the importance of restitution, (b) given
employment opportunities, (c) closely supervised, and (d) allowed to pay in installments (Van
Voorhis, 1985). These factors have also been found in research on the payment of fines,
suggesting that payment increases with ability to pay and closer supervision (Hillsman,
Mahoney, Cole, & Auchter, 1987).
In their multivariate analyses of restitution decisions in Pennsylvania from 1990-1998,
Ruback, Ruth, and Shaffer (in press) found that restitution was ordered more for property
offenders, offenders with no prior record, white offenders, and younger offenders. A 1995
statutory change making restitution mandatory increased the proportion of restitution orders
statewide in 1996-1998, but the level of this change was not equal in all counties or for all types
of cases.
In an extension of this research, Ruback and Shaffer (2003) found that restitution was

18
significantly more likely to be imposed if the victim-witness assistance office was in the
courthouse building than elsewhere, probably because judges were more likely to be aware of
victims‟ losses if workers in the victim-witness office were physically closer to the district
attorney. Restitution was also more likely to be imposed in counties that did not have a separate
collections unit.
Outlaw and Ruback (1999) examined adult probation cases from Allegheny County
(Pittsburgh), Pennsylvania in which restitution was or could have been a condition of probation.
Results indicated that judges ordered restitution most often when damages were easy to quantify
and that offenders were most likely to pay the restitution when they were able to pay and when
the victim was a business. Restitution payment was negatively related to rearrest, and this effect
was especially strong among married persons, suggesting that restitution was particularly
effective for individuals who were better integrated into the community.
In one of the few experimental studies of economic sanctions, Lurigio and Davis (1990)
randomly assigned adult probationers who were delinquent in payment of restitution to (a) a
treatment group that received a letter notifying them of the amount of money they owed, telling
them how to make payment and threatening them with serious consequences if they did not or
(b) a control group that did not receive a letter. Results indicated that offenders who received a
notification letter were significantly more likely to pay restitution. Moreover, this effect was
particularly strong for probationers who had jobs and who had shorter criminal histories,
probably because these individuals had greater ability to make payment and because their greater
ties to the community mean that probation revocation would be a greater punishment for them.

19
Society-Focused Economic Sanctions (Costs, Fees)
Fees are used to reimburse the state for the administrative cost of operating the criminal
justice system. Current distinctions in the labeling of fees (e.g., court costs, supervision fees,
etc.) help to differentiate the purpose or use of the funding, but do not otherwise change the
nature of these society-focused sanctions.
In a recent survey of Pennsylvania counties, Bergstrom (2002) identified 36 different
county-based costs and fees imposed on offenders, which are in addition to state-mandated costs
and fees. As shown in Table 1-1, the number of counties (of 67) imposing each of these costs
and fees ranged from 1 to 64, and the range in the dollar amounts was sometimes substantial.
Overall, the label „cost‟ is used to describe a blanket charge for program admission/participation
and can include a number of specific (direct) charges and/or a general (indirect) charge based on
average processing expenses. As an example, ARD/Fast Track is a cost imposed in several
counties, ranging from $125 to $400, to cover all court processing expenses associated with a
diversion program. The label „fee‟ is much more common and is used to describe a specific,
individual charge for a service. As an example, it is common for counties to impose a $250 fee
for DNA Analysis.
Table 1-1. County Costs and Fees in Pennsylvania
Number of Counties (of 67)
Imposing the Cost/Fee Range
ARD Standard 15 $30 - $400
ARD/Fast Track 5 $125 - $400
ARD/DUI 16 $100 - $525
Non-DUI Court Costs 17 $52 - $300
DUI Court Costs 17 $24 - $310.56
Bench Warrant 13 $4 - $200
Court/Clerk Fee 20 $5 - $200
Fingerprint Card 4 $7.50 - $17.50
ARD Expungement Fee 1 $15
Case Management Fee 1 $10
Bail Administration Fee 15 $3 - $50
Automation Fee 36 $1.50 - $5

20
Law Enforcement Fee 2 $5 - $10
Live Scan Processing Fee 1 $150
DUI Fee 11 $50 - $525
Crime Lab Fee 34 $40 - $90
Blood Analysis Fee 12 $15 - $112.25
DNA Fee 26 $8 - $250
Drug Testing Fee 16 $5 - $90
D&A/TASC Evaluation Fee 9 $16 - $100
Psychological Evaluation Fee 2 $158 - $185
Psychological and D&A
Evaluation Fee 1 $220
Psychiatric/Medical Evaluation Fee 5 $45 - $266
Court Reporting Network Fee 24 $25 - $150
Administration Fee (Fines, Costs,
Restitution, ARD) 10 $2 - $400
Supervision Fee (monthly) 64 $25 - $60
Nominal Supervision Fee (monthly) 1 $25
Other Supervision Fee 5 $10 - $200
Supervision Transfer Fee 5 $25
Drug Supervision Fee 3 $5 - $100
Electronic Monitoring Fee (Daily) 22 $2 - $15
Electronic Monitoring Fee (Flat Fee) 11 $15 - $200
Community Service Fee (Insurance) 20 $5 - $100
Victim Impact Panel Fee 3 $25
Highway Safety Class Fee 25 $50 - $300
Other Program Fees 6 $125 - $650
Purposes. Many jurisdictions impose fees on offenders to offset under-funding, because
high probation caseloads often mean offenders are subject to no supervision (Petersilia, 1997).
Supervision fees are the most common type of special condition of probation (Bonczar, 1997).
In most jurisdictions, there is a monthly fee, which defrays the costs of preparing presentence
reports and engaging in regular supervision activities. Additional fees can be imposed for
specific services, such as electronic monitoring. In 1992, probation departments nationally
imposed fees ranging from $10 to $40 per month, although the fee was lowered if the offender
could not pay (Finn & Parent, 1992). The use of supervisory fees has been upheld by the courts.
For example, in Taylor v. Rhode Island (1996), the First Circuit Court of Appeals held that the
monthly fee the defendant paid was not a punishment. The Court noted that the fee was directly
related to the costs associated with supervising probationers and parolees and went into a
separate fund used only for defraying those costs; the amount was reasonable and rationally
21
related to those costs; and the fee did not serve, primarily, the sentencing goals of deterrence or
retribution.
Probation fees are aimed at having offenders partially pay for the costs of their
supervision (Olson & Ramker, 2001). There is a need for fees to cover the costs of
administering probation, because, even though two-thirds of convicted offenders are placed on
community supervision, only one-tenth of correctional budgets pay for supervision (Petersilia,
1997, p. 172). Not surprisingly, probation officers generally believe that collecting fees takes too
much time and infringes on their ability to do what they consider to be more important duties
(Morgan, 1995). Probation officers seem to have higher collection rates if they are evaluated in
part on their collection rates (Wheeler & Rudolph, 1990).
Some probation departments have become self-supporting through supervision fees,
whereas other departments are able to cover only a portion of their costs (Olson & Ramker,
2001). Texas is generally considered the most successful state in generating fees, with about
40% of the cost of basic probation covered by fees paid by offenders (Finn & Parent, 1992).
Research. Research suggests that probationers in rural counties are more likely than
probationers in urban counties to be ordered to pay probation fees (Ellsworth & Weisheit, 1997),
even when individual difference variables are controlled statistically (Olson & Ramker, 2001).
In their analysis of probation fees in Illinois, Olson and Ramker (2001) found that fees were
ordered in 55% of the cases and, on average, probationers paid 72% of the ordered amounts.
Multivariate analyses indicated that probation fees were significantly more likely to be imposed
in rural than urban jurisdictions, when treatment or fines were also imposed, and, in terms of
individual characteristics, for white offenders, offenders with higher incomes, offenders with
prior convictions, and offenders convicted of a misdemeanor rather than a felony. The total
22
amount of the probation fee ordered was greater in urban than rural jurisdictions and for
offenders who were given longer sentences. Probationers were likely to pay higher percentages
of their probation fees if they were white, had higher incomes, had lower amounts of fees
ordered, were sentenced to pay fines, were sentenced in a rural area, and did not have their
probations revoked.
Olson and Ramker suggested that the difference in imposition of fees is attributable to the
fact that rural judges are likely to be more responsive than urban judges to their communities and
more concerned with the imposition of justice in individual cases than with the processing of
large numbers of cases (see also Weisheit, Wells, & Falcone, 1995). It might also be the case
that rural areas have lower available tax bases to support government operations, and therefore
they have a greater need to rely on revenues from fees (Olson, Weisheit, & Ellsworth, 2001).
With regard to their finding that collection rates were higher in rural areas, Olson and
Ramker suggested that judges in rural areas were concerned that offenders pay something,
whereas judges in urban areas were concerned that fees should be imposed and enforced only if
they were set at a level high enough to justify the time and expense of collection.
Offender-Focused Economic Sanctions (Fines)
Fines are monetary penalties for crime. They have several inherent advantages over other
types of penalties (Campbell, 1991, pp. 1-9; Hillsman, 1990). They are obviously punitive and
can be tailored to the seriousness of the particular crime and to a specific individual‟s criminal
history and resources. They are also flexible in terms of serving as sole penalties or of being
combined with other sanctions, ranging from treatment to incarceration. They also have the
advantage of providing funds to support both the collections office and other related
expenditures, such as victim/witness assistance and victim compensation. For example, in the

23
federal system, fines are aimed primarily at benefiting victims, in that most fines are deposited in
the Crime Victims Fund, 90% of which goes to the states for victim compensation and assistance
(General Accounting Office, 1999).
Contemporary use. In the United States, in contrast, many judges are opposed to fines
because many believe that fines cannot be enforced against the poor and have little effect on the
wealthy, whom they perceive as buying their way out of punishment (Hillsman, 1990). Judges
generally believe that fines by themselves cannot serve as an alternative to either probation or
incarceration (Cole, Mahoney, Thornton, & Hanson, 1987). Moreover, most model penal codes
and sentencing standards are opposed to fines, which are assumed to have little correctional
value and to be biased against the poor (National Advisory Commission, 1973, pp. 162-164). In
addition, flat fines and fines with absolute maximums may become ineffective when legislatures
do not regularly update them to adjust for inflation (Gillespie, 1981). For some offenses, in
which the fine is statutorily determined, fines are regressive and fail to meet the goals of
individualized justice. As a result, fines are used primarily in courts of limited jurisdiction,
especially traffic courts (Hillsman, Sichel, & Mahoney, 1984).
For example, in lower courts, fines are used for minor offenses (e.g., shoplifting),
particularly for first-time offenders who have enough money to pay the fine (Hillsman et al.,
1987). In the municipal court in Columbus, Ohio fines were imposed on 87% of the convicted
offenders, and especially among those convicted of drunk driving (Ryan, 1980). Although the
day fine was initially tested in Staten Island, New York in 1988-89, and has been introduced in
several other U.S. jurisdictions, it has failed to gain widespread support.
Nationally, fines are imposed in 25% of all felony convictions: 20% of violent offenses,
24% of property offenses, 27% of drug offenses, 19% of weapons offenses, and 27% of other

24
offenses (Durose & Langan, 2003). Fines are often used in connection with probation to
increase the likelihood of payment and the level of punishment. When they impose fines, judges
in many state systems rarely have information about the offender‟s ability to pay. This lack of
information may result in fines that are too high, especially because legislatively imposed
sanctions are required and may themselves be beyond what some offenders can pay. But it is
also possible that fines might be set too low, which means that the sentence will fail to fulfill its
potential for retribution and deterrence (Cole, 1992). In the federal system, where judges might
have better information than in many state systems, fines are strongly and positively related to
ability to pay (Waldfogel, 1995).
According to Hillsman and Greene (1992), within a jurisdiction, judges usually apply the
“going rate” for fines, so that all violators of a particular offense are obligated to pay the same or
similar amounts. Because judges tend to use this going rate for fines, however, they neglect to
adjust the seriousness of the penalty to the particular defendant. And, because this going rate is
usually low (in order to accommodate the poorest offenders), fines have little penalty value for
affluent offenders. Rather than at initial sentencing, judges‟ adjustments to fines tend to be at the
back end, when they often excuse the remaining unpaid portion or simply let the probation
period expire without enforcing the fine. Research suggests that fines are more likely to be paid
if the amounts and payment schedules are reasonable and take into account an offender‟s ability
to pay, if the offender‟s payments are closely monitored, and if progressively more coercion is
used in response to nonpayment (Hillsman, 1990).
Morris and Tonry (1990) argued that the fines rather than incarceration in jail or prison
should be the primary type of punishment because fines can be as effective in punishing past
crime and in deterring future crime. In making decisions about the most reasonable level of

25
fines, the “light touch of the law” seems appropriate (i.e., a penalty sufficiently harsh to get the
offender‟s attention but not so harsh as to produce negative results, such as losing a job; McCord,
1985).
Imposition of Economic Sanctions
Few studies have examined how economic sanctions are imposed or how judges impose
multiple sanctions. In one of the only studies to investigate multiple sanctions, Gordon and
Glaser (1991) focused on the use and effects of monetary sanctions, jail, and probation in cases
sentenced to probation by the Los Angeles municipal courts between 1981 and 1984. Cases
were sampled from each of five offense groups (assaults, burglaries, drug crimes, DUI, and theft)
and stratified by type of sanction (fines, restitution, cost of probation supervision, and jail). Each
case was followed for a two-year period to track revocations, arrests, convictions, and
incarcerations. Gordon and Glaser found that type of offense significantly predicted sentences of
probation only, of jail and probation, and of jail, probation, and financial penalties. However,
individual attributes (race, ethnicity, drug problems, and prior convictions) failed to predict
sentences of probation and financial penalties. Gordon and Glaser also found that the amount of
financial penalties was affected by the type of crime and the offender‟s employment status.
Compared with drug offenders, offenders convicted of burglary, DUI, and theft received
significantly higher financial penalties, suggesting that judges believed financial penalties were
inappropriate for drug offenders. In addition, employed offenders were ordered to pay
significantly larger amounts than unemployed offenders.
In terms of postsentencing outcomes, Gordon and Glaser (1991) found that, among their
sample of offenders, those who received jail terms had significantly higher odds of subsequent
arrest, compared with offenders who received a sentence of probation with financial penalties,
26
even after controlling for individual attributes, offense, and previous convictions. Individuals
ordered to pay higher financial amounts were significantly more likely to have their probation
revoked, although the simple imposition of a financial penalty resulted in lower risk of probation
revocation (Gordon & Glaser, 1991). Not surprisingly, individuals who were ordered to pay
more financial penalties were less likely to pay the entire amount due (Gordon & Glaser, 1991).
In another examination of multiple economic sanctions in a big city, Ruback (2004)
examined the imposition and effect of restitution, fines, and costs in Philadelphia during the
seven-year period 1994-2000. Restitution was significantly more likely to be ordered and to be
ordered for higher amounts when the victim was the State rather than a private individual or
business. For both State-victim and private-victim cases, the imposition of fines and the
imposition of restitution were negatively related and generally were predicted by different
factors.
Discussion
The use of economic sanctions is likely to increase because of greater pressure on
offenders to pay for the costs of supervision and the harm done to crime victims. But perhaps
the most important reason for increases in the use of economic sanctions is that they appear to be
as effective as incarceration in reducing recidivism (Cherry, 2001; Gordon & Glaser, 1991;
Outlaw & Ruback, 1999). Of course, without experimental control, the results of studies could
be attributed to selection bias, with judges imposing economic sanctions only on the best risks
and impose incarceration on the rest.
Why should economic sanctions be as effective? Brennan and Mednick (1994) tested
and found support for five principles of behavior: (a) punishment following a crime produces a
lower rate of recidivism, (b) different types of punishing stimuli have similar effects in reducing

27
recidivism, (c) the more crimes that are punished, the greater the reduction in recidivism, (d)
crimes that are always punished are less likely to be repeated than are crimes that are only
intermittently punished, and (e) criminal behavior is likely to be repeated if punishment is
discontinued. Using data from a cohort of men born in Copenhagen during a three-year period in
the 1940s and followed for 26 years, Brennan and Mednick found that fines were as, if not more,
effective than incarceration, a finding that supports the notion that sanctions have similar effects
on recidivism regardless of their severity.
Overview of the Studies
Adult and Juvenile Data
To examine the imposition and collection of criminal economic sanctions in
Pennsylvania, we collected data from seven counties: Blair, Centre, Cumberland, Delaware,
Lancaster, Luzerne, and Westmoreland.4 We selected these counties because they varied along
four dimensions that we suspected would influence the use and effect of economic sanctions: (a)
county population size, (b) the number of criminal cases processed by the county, (c) the
methods each county uses to collect economic sanctions, and (d) geographic location.
First, as can be seen in Table 1-2, all seven counties in the study are mid-sized urban
counties.5 However, Blair, Centre, and Cumberland Counties have relatively small populations,
while Delaware and Lancaster Counties have substantially larger populations. The populations
of Luzerne and Westmoreland Counties are about midway between the other counties. Centre
County is less densely populated and has fewer young people than the other counties. Delaware
County is by far the most densely populated county. Second, the yearly criminal caseloads of the
4 The Advisory Committee originally chose Dauphin County for investigation. However, because the President
Judge of Dauphin County did not allow us to collect data from probation records, we replaced Dauphin County with
Cumberland County. 5 The Center for Rural Pennsylvania defines a county as urban if more than half of its population lives in an urban
area, as defined by the Census.
28
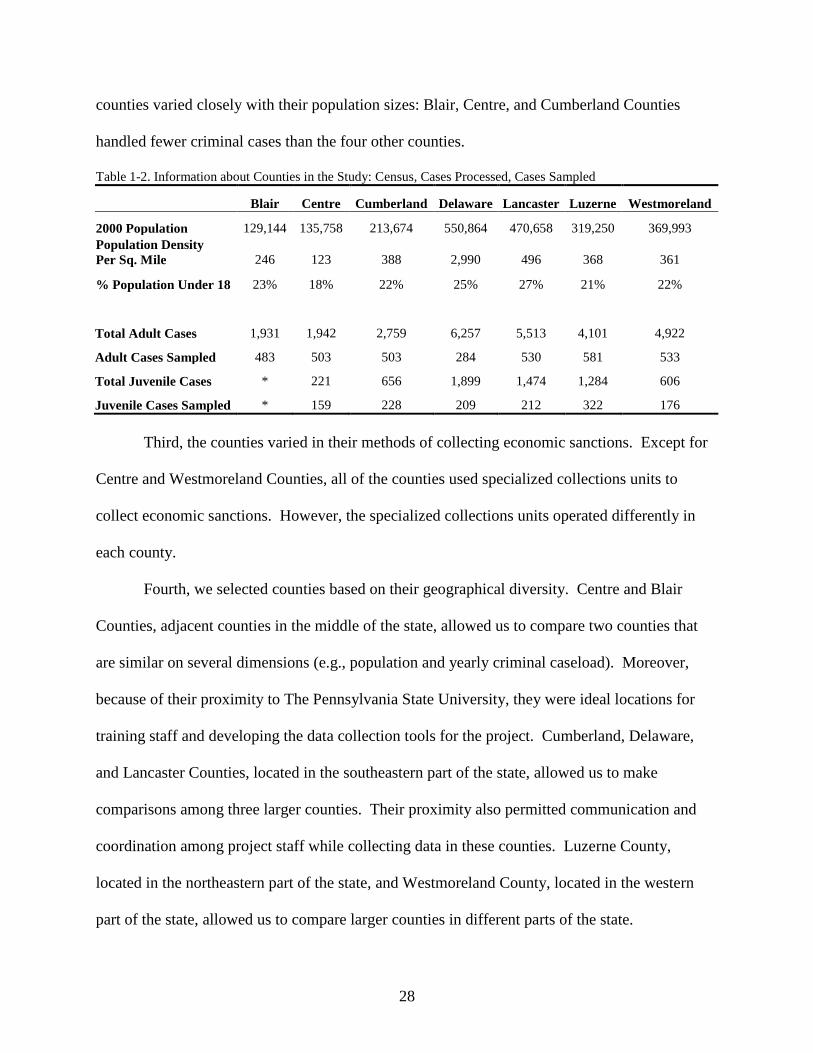
counties varied closely with their population sizes: Blair, Centre, and Cumberland Counties
handled fewer criminal cases than the four other counties.
Table 1-2. Information about Counties in the Study: Census, Cases Processed, Cases Sampled
Blair Centre Cumberland Delaware Lancaster Luzerne Westmoreland
2000 Population 129,144 135,758 213,674 550,864 470,658 319,250 369,993
Population Density
Per Sq. Mile 246 123 388 2,990 496 368 361
% Population Under 18 23% 18% 22% 25% 27% 21% 22%
Total Adult Cases 1,931 1,942 2,759 6,257 5,513 4,101 4,922
Adult Cases Sampled 483 503 503 284 530 581 533
Total Juvenile Cases * 221 656 1,899 1,474 1,284 606
Juvenile Cases Sampled * 159 228 209 212 322 176
Third, the counties varied in their methods of collecting economic sanctions. Except for
Centre and Westmoreland Counties, all of the counties used specialized collections units to
collect economic sanctions. However, the specialized collections units operated differently in
each county.
Fourth, we selected counties based on their geographical diversity. Centre and Blair
Counties, adjacent counties in the middle of the state, allowed us to compare two counties that
are similar on several dimensions (e.g., population and yearly criminal caseload). Moreover,
because of their proximity to The Pennsylvania State University, they were ideal locations for
training staff and developing the data collection tools for the project. Cumberland, Delaware,
and Lancaster Counties, located in the southeastern part of the state, allowed us to make
comparisons among three larger counties. Their proximity also permitted communication and
coordination among project staff while collecting data in these counties. Luzerne County,
located in the northeastern part of the state, and Westmoreland County, located in the western
part of the state, allowed us to compare larger counties in different parts of the state.
29
The information about adult and juvenile cases is presented in two ways. In the main
text, one chapter is devoted to adult cases and one chapter is devoted to juvenile cases. In the
appendices, adult and juvenile cases are discussed separately for each county.
DAVE Cases
The Crime Victims Compensation (CVC) Fund provides victims with compensation for
medical expenses, counseling, crime-scene cleanup, lost earnings, stolen benefits cash, funeral
expenses, and the like. When the CVC provides compensation to the victim, the judge is
mandated by law to order the offender to pay restitution to the CVC. To test whether judges are
ordering offenders to pay restitution to the CVC, we collected data from four counties: Centre,
Cumberland, Delaware, and Westmoreland.6
The DAVE (Dependable Access for Victimization Expenses) system, implemented on
January 22, 2002, allows victim service providers to file compensation claims electronically.
Furthermore, the DAVE system helps victim advocates determine the victim‟s eligibility and
obtain the documentation necessary to process the victim‟s claim. We obtained the list of DAVE
cases from Ed Katz at the PCCD. Because there were so few cases per county per year, we
recorded information about all of the DAVE cases in each county that were on the PCCD list.7
Victim Survey
Victims are important to the criminal justice system because they can support efforts to
prosecute the crime they suffered and can report future crimes against them. To test whether
crime victims‟ satisfaction with the criminal justice system related to their perceptions of the
6 We started collecting DAVE cases during the second year of our research project. We did not collect DAVE cases
in Lancaster and Luzerne Counties because we had already completed our data collection in those counties. We did
not collect DAVE cases in Blair County because we did not have a staff member to send to the county. 7 In Centre County, we collected information about cases from 2002-2003. In Cumberland County, we collected
information about cases from 2000-2004. In Delaware County, we collected information about cases from 2001-
2004. In Westmoreland County, we collected information about cases from 2000-2004.

30
fairness of the process and their outcomes in their case, we surveyed 238 victims in two
Pennsylvania counties: Cumberland and Lancaster.
Results indicated that victims were more satisfied with procedural than outcome fairness
and that the more satisfied victims were with the outcomes and procedures in their case, the more
willing they said they would be to report crimes in the future. Overall, women said they desired
more input into criminal justice decisions, and this difference may explain the general finding
that women are more likely than men to report crimes to the police.
Offender Survey
In recent years the number of economic sanctions imposed on offenders has increased
because of increased pressures to punish offenders, have offenders pay for at least part of their
treatment and correctional supervision, and make offenders restore victims as much as possible
to the condition they were in before the crime occurred. With these increased pressures to
collect more money for more different purposes, we were interested in the extent to which
offenders were able to make the ordered payments.
We conducted a survey of offenders in Blair and Westmoreland Counties to obtain basic
descriptive information about the offenders‟ economic situation, including their total debts and
total payments due to the criminal justice system. In addition, we explored four possible reasons
for offenders‟ low rate of payment of economic sanctions: (a) lack of understanding of the
sanctions, (b) disagreement with the rationale for the sanctions, (c) perception that the sanctions
are unfairly applied, and (d) lack of money to pay the sanctions. Although there was some
support for the first three explanations, offenders‟ reported lack of money was the best predictor
of nonpayment.

31
We asked both victims and offenders to rate the importance of 22 reasons for punishing
offenders. Offenders and victims differed significantly on 20 of the 22 items; the only 2
nonsignificant items related to rehabilitation. Most of the differences between the two groups
were large. On four items in particular, the differences were very large: three of the items related
to victim or societal safety, and the fourth item concerned restitution to the victim. Victims were
much more likely than offenders to say that their safety and the safety of society is an important
reason for punishing offenders. Moreover, victims were much more likely than offenders to say
that restoring victims to their precrime condition is an important purpose for punishment.
32
Chapter 2: Adult Data
Method
We chose to collect data from adult cases docketed in the year 2000 in order to ensure
that the case would have been resolved in terms of guilt or innocence, that sentencing would
have occurred, and that the offender would have had some record of making or not making
payments toward the amounts owed.
Sampling
In each county, we selected a random sample of approximately 500 adult cases.8 In order
to draw the sample, we first identified the total number of adult cases docketed in the year 2000.
We then selected random samples of one hundred cases and counted the number of cases that
were missing in each sample. This procedure allowed us to estimate the total number of missing
cases in the year 2000 (i.e., the number of cases for which no information was available). We
determined the sampling frame we needed to select in order to produce a sample of 500 adult
cases by dividing the total number of cases docketed during the year by 500. We then sampled
every “nth
” docket number. For example, in Centre County, which had 1942 cases in calendar
year 2000 and 16% missing cases, we collected data from every 3rd case to obtain a sample of at
least 500 adult cases.9
Data Collection
In each county, project staff used laptops and computerized coding forms to record
information. Although we developed the coding form for data collection in Centre County, we
modified the form to reflect variations across counties (see Appendix A for the adult data
8 In Delaware County, because of constraints on time and manpower, we selected a random sample of only 250
cases. 9 In Blair County, we used a slightly different sampling procedure because the probation office organized its files by
defendant name, rather than by docket number. However, we do not believe this difference in sampling affects the
analyses or findings.

33
collection forms). The computerized coding form was useful because it allowed us to transfer
the data directly into SPSS, a program used for statistical analysis of data.
We collected information from various sources, including Clerk of Courts files, probation
files, and Victim/Witness Services files. In several counties, these sources provided both
computer and paper files. Because they often contained different information, we reviewed both
computer and paper files when available. We collected information from Clerk of Courts paper
files in all but Cumberland, Delaware, and Westmoreland Counties. We also had access to Clerk
of Courts computer files in all but Centre County. We reviewed probation computer files in all
but Westmoreland County and we had access to probation paper files in Blair, Cumberland,
Delaware, and Westmoreland Counties.
Although the probation computer files provided most of the desired information, the
probation paper files usually contained detailed information about the offender‟s background.
As a result, we were unable to collect data for several variables when the probation paper files
were unavailable. The reason we could not access probation paper files varied by county (see
Appendices D-J for a more detailed discussion of the problems encountered in each county).
In Blair and Cumberland Counties, we collected additional data from the Victim/Witness
Office.10
We used these records to obtain basic demographic information about the victim(s),
victim estimates of loss, and the use of victim impact statements. However, because not all
victims receive services from the Victim/Witness Office, our data does not include information
about all victims.
10
The Luzerne County Victim/Witness Office no longer had information on individual cases from the year 2000 and
we were denied access in Centre, Delaware, and Westmoreland Counties. In Lancaster County, the District
Attorney‟s Office, which was responsible for victims in the year 2000, was not interested in working with our
project.

34
Variables
For each adult case, we recorded the following types of information: offender
characteristics (e.g., race, gender, age, and prior record), case characteristics (e.g., charge and
conviction offenses, type of disposition, and sentence imposed), victim characteristics (e.g., race,
gender, age, and type of injury), economic sanctions imposed and paid (e.g., fines, fees, costs,
and restitution), and recidivism. We also included several variables that record the different
sources of information used to collect data in each county. In order to link offender information
across the different types of criminal records, we had to collect several pieces of identifying
information (e.g., social security number and state identification number). Once our data
collection was complete, however, we removed all unique identifiers from the data in order to
maintain the confidentiality of the information.
Although the amount of information available varied slightly by county, we were able to
obtain most of the desired information from all seven counties. The following discussion
describes the variables and data collection techniques used across counties. We discuss
variations on these techniques and variables in more detail in Appendices D-J.
We used several variables to record offender characteristics, which includes both
demographic information and information about the offender‟s criminal record (see Appendix C
for a complete list of variables). Demographic information was available for almost all cases
examined during our data collection. When probation paper files were missing or unavailable,
we were able to collect only limited information. As a result, offender characteristics collected
in Centre, Lancaster, and Luzerne Counties may be incomplete.
In terms of the offender‟s criminal record, we were interested in the number of prior
convictions for misdemeanors and felonies and in whether the offender had an official history of

35
violence. To collect this information, we relied primarily on the Pennsylvania Commission on
Sentencing (PCS) sentencing guideline form, which is typically located in Clerk of Courts paper
files. From these forms we were able to determine the offender‟s number of prior convictions
and whether the offender had been convicted of a violent crime. However, there was ambiguity
in several offense categories (e.g., felony 3), and it was often difficult to determine whether a
prior conviction had been for a violent crime. Additionally, in Blair and Luzerne Counties, the
Clerk of Courts paper files rarely contained PCS sentencing guideline forms. As a result, we had
to rely on Clerk of Courts computer files to collect prior record information.
We also collected information about a variety of case characteristics, including the charge
and conviction offenses, type of disposition, and type and severity of the sentence imposed (see
Appendix C for a complete list of variables). We typically recorded the information that
corresponded to the offender‟s most serious conviction offense for a particular case. If not
convicted of a crime, we recorded information corresponding to the offender‟s most serious
charge offense. In Luzerne County, we could not identify which case characteristics applied to
charge offenses and which applied to conviction offenses. Because we could not record
information corresponding to the most serious conviction offense, the data we collected
corresponded to both charge and conviction offenses.
Information about the Offense Gravity Score (OGS) and about whether the case was
plea-bargained was available only on the PCS sentencing guideline form.11
Given that most
sentencing guideline forms were missing in Blair and Luzerne Counties, data for these variables
may be incomplete. We also collected detailed information about both the sentence imposed and
11
In Cumberland County, plea bargaining was not tracked on the PCS sentencing guideline form and therefore is
missing.

36
the sentence actually served by offenders. However, the information we recorded corresponded
to all conviction offenses, rather than to the most serious conviction offense.
Although we tried to collect detailed information about victims, it was largely
unavailable. However, we were able to obtain victim information in cases where the offender
was ordered to pay restitution to a victim (see Appendix C for a complete list of variables).
Where available, we collected information about victim demographics, the type of injury
sustained (e.g., personal, psychological, or property), and the victim‟s estimate of loss.
We also collected detailed information about the economic sanctions imposed and
collected in each case. Although some economic sanctions were common across counties, there
was considerable variation in the types of economic sanctions imposed (see Appendix C for a
complete list of variables). We recorded information about the total amount of economic
sanctions ordered in each case, as well as the amounts ordered for restitution, costs, fees, fines,
Crime Commision Cost (CCC), and the Crime Victim‟s Compensation (CVC) Fund. In several
counties, these categories were broken down into subcategories (e.g., county fines and state
fines). However, it was not possible to create such subcategories in all of the counties.
Regarding the collection of economic sanctions, we recorded such information as the
total amount of money paid and the total number of payments made. For example, we recorded
the amount of money paid to date for restitution, CCC, and CVC. In several counties, we were
able to collect information about money still owed and money being paid for previous
convictions. When available, we also collected detailed information about restitution orders. In
general, however, detailed restitution information was rarely available across counties. We
recorded information on economic sanctions that corresponded to each case as a whole, rather
than to the most serious conviction offense.

37
Lastly, we recorded information about recidivism (see Appendix C for a complete list of
variables). The collection of this information was uniform across counties. When an offender
had multiple violations of supervision orders, multiple re-arrests, or multiple revocations, for
each of these variables, we recorded only the first incident or outcome that followed sentencing.
Results
The results of this study are presented in three parts. First, we provide descriptive
information about the counties. Second, we describe how case and offender characteristics affect
the imposition and payment of economic sanctions. In this section, we estimate regression
models predicting the total amount of economic sanctions ordered and the percent of economic
sanctions paid across counties. Third, we present results describing the imposition and payment
of specific economic sanctions across counties.
Descriptive Analyses Adult Data
Table 2-1 provides a description of the adult sample in each county. There were a
number of similarities across counties, especially in terms of gender, age, and education. The
results show that most offenders were male and white. The average age at sentencing ranged
from 30.4 in Centre County to 33.4 in Westmoreland County. The average amount of education
offenders received ranged from 11.5-12.3 years. Most offenders were convicted of misdemeanor
offenses, followed by felony offenses and summary offenses. In Centre, Cumberland, Delaware,
and Westmoreland Counties, most convictions were for traffic offenses. In Blair and Lancaster
Counties, most convictions were for property offenses.
Table 2-1. Description of the Sample
Blair Centre Cumberland Delaware Lancaster Westmoreland
% n % n % n % n % n % n
Gender
Male 77.7 321 81.5 343 81.4 355 81.4 193 82.0 402 79.6 336
Female 22.3 92 18.5 78 18.6 81 18.6 44 18.0 88 20.4 86
Total 413 421 436 237 490 422
Missing 0 3 8 2 3 0

38
Race
White 89.6 370 92.9 382 81.4 320 56.3 129 77.5 307 87.8 330
Nonwhite 9.8 40 7.1 29 18.6 73 43.7 100 22.5 89 12.2 46
Total 410 411 393 229 396 376
Missing 3 13 51 10 97 46
Education M = 11.7 M = 12.3 M = 11.7 M = 12.1 M = 11.5 M = 12.1
Total 352 204 134 138 19 345
Missing 61 220 310 101 474 77
Offense
Grading
Summary 7.2 29 14.8 62 17.1 76 1.3 3 2.0 10 11.8 50
Misdemeanor 74.9 301 73.1 307 59.9 266 81.0 187 74.1 364 70.1 296
Felony 17.9 72 12.1 51 23.0 102 17.7 41 23.8 117 18.0 76
Total 402 420 444 231 491 422
Missing 11 4 0 8 2 0
Type of
Offense
Property 27.4 113 23.8 101 26.4 117 18.4 44 29.0 143 21.1 89
Personal 16.9 70 15.8 67 14.2 63 15.1 36 14.0 69 17.5 74
Drug 15.5 64 10.4 44 13.3 59 22.6 54 18.9 93 12.6 53
Traffic 24.2 100 37.0 157 29.6 131 35.6 85 27.2 134 40.3 170
Other 16.0 66 13.0 55 16.5 73 8.4 20 11.0 54 8.5 36
Total 413 424 443 239 493 422
Missing 0 0 1 0 0 0
Age at
sentencing
M = 31.5 M = 30.4 M = 31.4 M = 32 M = 30.9 M = 33.4
Total 422 434 226 469 385
Missing 2 10 13 24 37
Multivariate Analyses
The following discussion describes how case and offender characteristics affect the
imposition and payment of economic sanctions, both overall and separately for specific
economic sanctions.12
Total amount of economic sanctions ordered. Table 2-2 describes the total amount of
economic sanctions ordered across counties. The results show that the type (i.e., property,
personal, drug, traffic, or other) and severity (i.e., summary, misdemeanor, or felony) of the
12
We excluded Luzerne County from our analyses because sentencing information and data on economic sanctions
were combined across multiple cases. As a result, we were unable to collect complete information about a particular
case.
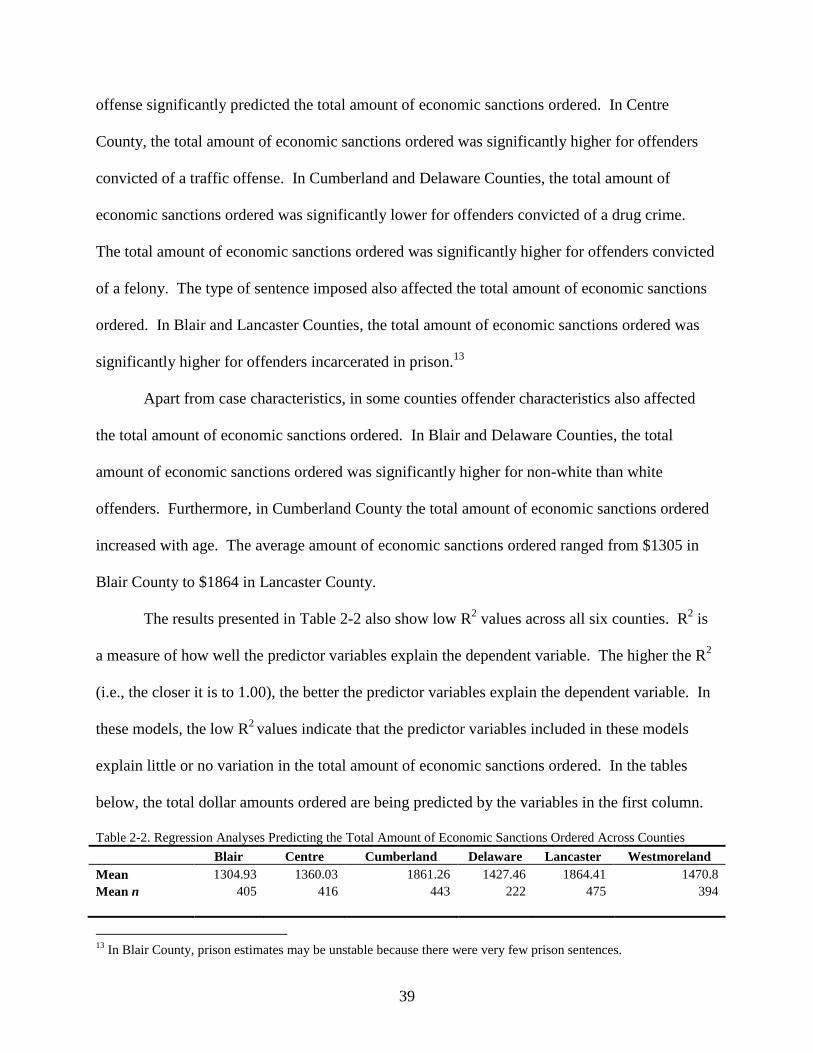
39
offense significantly predicted the total amount of economic sanctions ordered. In Centre
County, the total amount of economic sanctions ordered was significantly higher for offenders
convicted of a traffic offense. In Cumberland and Delaware Counties, the total amount of
economic sanctions ordered was significantly lower for offenders convicted of a drug crime.
The total amount of economic sanctions ordered was significantly higher for offenders convicted
of a felony. The type of sentence imposed also affected the total amount of economic sanctions
ordered. In Blair and Lancaster Counties, the total amount of economic sanctions ordered was
significantly higher for offenders incarcerated in prison.13
Apart from case characteristics, in some counties offender characteristics also affected
the total amount of economic sanctions ordered. In Blair and Delaware Counties, the total
amount of economic sanctions ordered was significantly higher for non-white than white
offenders. Furthermore, in Cumberland County the total amount of economic sanctions ordered
increased with age. The average amount of economic sanctions ordered ranged from $1305 in
Blair County to $1864 in Lancaster County.
The results presented in Table 2-2 also show low R2 values across all six counties. R
2 is
a measure of how well the predictor variables explain the dependent variable. The higher the R2
(i.e., the closer it is to 1.00), the better the predictor variables explain the dependent variable. In
these models, the low R2 values indicate that the predictor variables included in these models
explain little or no variation in the total amount of economic sanctions ordered. In the tables
below, the total dollar amounts ordered are being predicted by the variables in the first column.
Table 2-2. Regression Analyses Predicting the Total Amount of Economic Sanctions Ordered Across Counties
Blair Centre Cumberland Delaware Lancaster Westmoreland
Mean 1304.93 1360.03 1861.26 1427.46 1864.41 1470.8
Mean n 405 416 443 222 475 394
13
In Blair County, prison estimates may be unstable because there were very few prison sentences.

40
Summary -325.54 -533.97 -832.69 -956.13 -374.22
Felony 419.65 1455.38*** 3325.99*** 1193.99** -306.03 3012.84***
Personal -335.43 286.44 -652.48 -724.99a -1021.39 -882.59
Drug -296.45 -434.52 -2265.58** -1061.69** -802.83 -1397.95
Traffic 266.48 837.28** -65.16 -171.56 -535.06 -186.66
Other Offense -89.66 -14.60 -1070.76 -427.48 -1135.06 240.06
Prison 2589.97* -615.08 1882.91 -1220.60a 5292.24*** 352.22
Jail -38.37 386.98a -807.98 -206.96 -611.93 876.92
RIP -59.83 680.58 865.95 222.49 -612.05 476.76
No Sentence -459.95 -710.24 482.93 -1493.64 -1294.40 -304.91
Non-White 1171.72* -18.45 -938.42 580.67* -87.26 -1019.70
Age 3.82 8.15 69.90** 16.78a 11.93 46.67
a
Male 43.69 -219.01 413.96 -15.64 662.14 -959.70
Constant 1073.46 870.06* -411.65 1014.23* 1617.00 371.15
R2 0.06 0.15 0.12 0.14 0.06 0.08
n 372 401 387 211 373 350
*p<.05, **p<.01, ***p<.001 ap<.10
Percent of economic sanctions paid. Table 2-3 describes the percent of economic
sanctions paid across counties. The results show that case characteristics were stronger
predictors than offender characteristics of the percent of economic sanctions paid. The percent
of economic sanctions paid was significantly higher for offenders convicted of personal, drug,
traffic, or other offenses than for property offenses. Furthermore, the percent of economic
sanctions paid was significantly lower for incarcerated offenders, particularly those incarcerated
in prison. The only offender characteristic that affected the percent of economic sanctions paid
was the offender‟s race. In Cumberland, Delaware, and Lancaster Counties, the percent of
economic sanctions paid was significantly lower for non-white than white offenders.
The R2 values are higher for these models than for the previous ones, a finding that
suggests we can better predict the percent of economic sanctions paid than the total amount of
economic sanctions ordered.
Table 2-3. Regression Analyses Predicting the Percent of Economic Sanctions Paid Across Counties
Blair Centre Cumberland Delaware Lancaster Westmoreland
Mean 56.59 76.9 65.06 45.79 42.81 64.63
Mean n 405 412 443 221 475 236
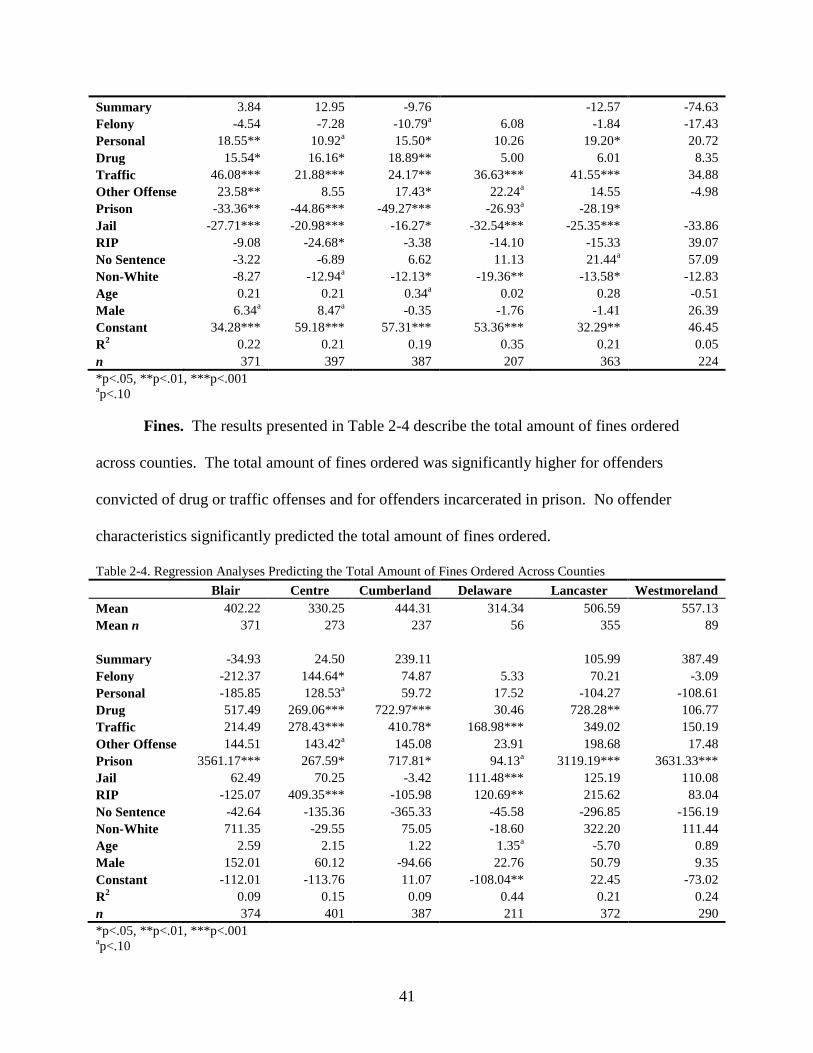
41
Summary 3.84 12.95 -9.76 -12.57 -74.63
Felony -4.54 -7.28 -10.79a 6.08 -1.84 -17.43
Personal 18.55** 10.92a 15.50* 10.26 19.20* 20.72
Drug 15.54* 16.16* 18.89** 5.00 6.01 8.35
Traffic 46.08*** 21.88*** 24.17** 36.63*** 41.55*** 34.88
Other Offense 23.58** 8.55 17.43* 22.24a 14.55 -4.98
Prison -33.36** -44.86*** -49.27*** -26.93a -28.19*
Jail -27.71*** -20.98*** -16.27* -32.54*** -25.35*** -33.86
RIP -9.08 -24.68* -3.38 -14.10 -15.33 39.07
No Sentence -3.22 -6.89 6.62 11.13 21.44a 57.09
Non-White -8.27 -12.94a -12.13* -19.36** -13.58* -12.83
Age 0.21 0.21 0.34a 0.02 0.28 -0.51
Male 6.34a 8.47
a -0.35 -1.76 -1.41 26.39
Constant 34.28*** 59.18*** 57.31*** 53.36*** 32.29** 46.45
R2 0.22 0.21 0.19 0.35 0.21 0.05
n 371 397 387 207 363 224
*p<.05, **p<.01, ***p<.001 ap<.10
Fines. The results presented in Table 2-4 describe the total amount of fines ordered
across counties. The total amount of fines ordered was significantly higher for offenders
convicted of drug or traffic offenses and for offenders incarcerated in prison. No offender
characteristics significantly predicted the total amount of fines ordered.
Table 2-4. Regression Analyses Predicting the Total Amount of Fines Ordered Across Counties
Blair Centre Cumberland Delaware Lancaster Westmoreland
Mean 402.22 330.25 444.31 314.34 506.59 557.13
Mean n 371 273 237 56 355 89
Summary -34.93 24.50 239.11 105.99 387.49
Felony -212.37 144.64* 74.87 5.33 70.21 -3.09
Personal -185.85 128.53a 59.72 17.52 -104.27 -108.61
Drug 517.49 269.06*** 722.97*** 30.46 728.28** 106.77
Traffic 214.49 278.43*** 410.78* 168.98*** 349.02 150.19
Other Offense 144.51 143.42a 145.08 23.91 198.68 17.48
Prison 3561.17*** 267.59* 717.81* 94.13a 3119.19*** 3631.33***
Jail 62.49 70.25 -3.42 111.48*** 125.19 110.08
RIP -125.07 409.35*** -105.98 120.69** 215.62 83.04
No Sentence -42.64 -135.36 -365.33 -45.58 -296.85 -156.19
Non-White 711.35 -29.55 75.05 -18.60 322.20 111.44
Age 2.59 2.15 1.22 1.35a -5.70 0.89
Male 152.01 60.12 -94.66 22.76 50.79 9.35
Constant -112.01 -113.76 11.07 -108.04** 22.45 -73.02
R2 0.09 0.15 0.09 0.44 0.21 0.24
n 374 401 387 211 372 290
*p<.05, **p<.01, ***p<.001 ap<.10
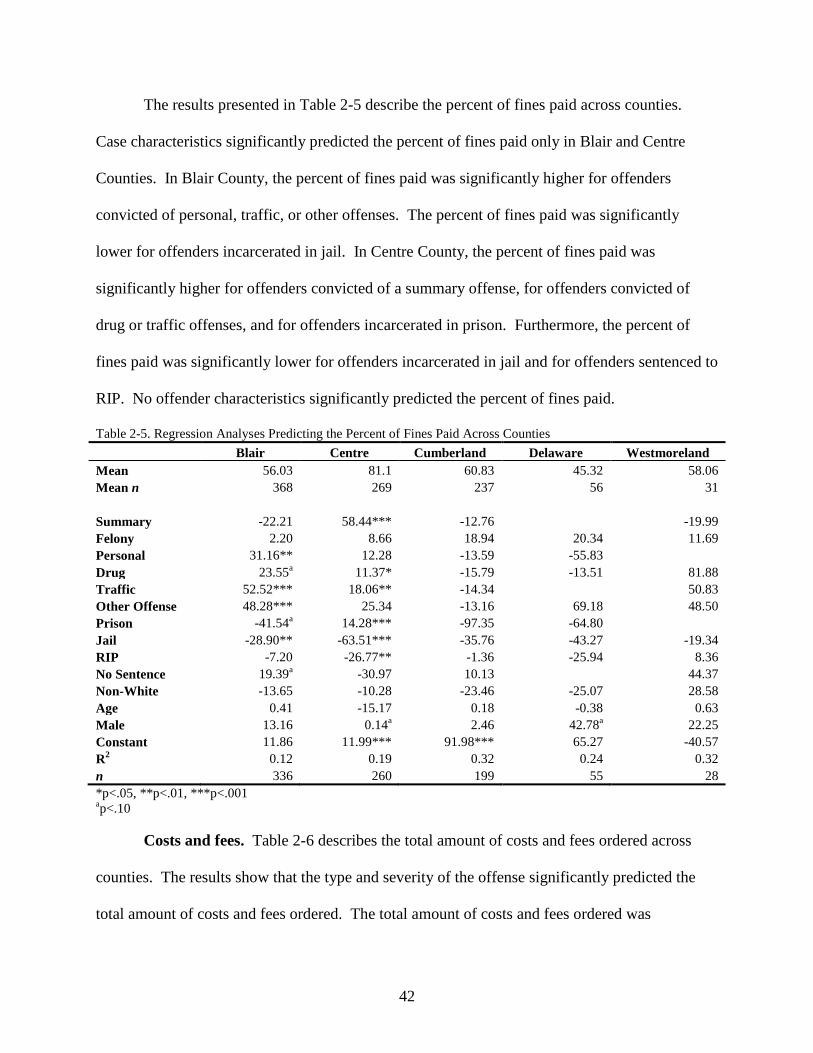
42
The results presented in Table 2-5 describe the percent of fines paid across counties.
Case characteristics significantly predicted the percent of fines paid only in Blair and Centre
Counties. In Blair County, the percent of fines paid was significantly higher for offenders
convicted of personal, traffic, or other offenses. The percent of fines paid was significantly
lower for offenders incarcerated in jail. In Centre County, the percent of fines paid was
significantly higher for offenders convicted of a summary offense, for offenders convicted of
drug or traffic offenses, and for offenders incarcerated in prison. Furthermore, the percent of
fines paid was significantly lower for offenders incarcerated in jail and for offenders sentenced to
RIP. No offender characteristics significantly predicted the percent of fines paid.
Table 2-5. Regression Analyses Predicting the Percent of Fines Paid Across Counties
Blair Centre Cumberland Delaware Westmoreland
Mean 56.03 81.1 60.83 45.32 58.06
Mean n 368 269 237 56 31
Summary -22.21 58.44*** -12.76 -19.99
Felony 2.20 8.66 18.94 20.34 11.69
Personal 31.16** 12.28 -13.59 -55.83
Drug 23.55a 11.37* -15.79 -13.51 81.88
Traffic 52.52*** 18.06** -14.34 50.83
Other Offense 48.28*** 25.34 -13.16 69.18 48.50
Prison -41.54a 14.28*** -97.35 -64.80
Jail -28.90** -63.51*** -35.76 -43.27 -19.34
RIP -7.20 -26.77** -1.36 -25.94 8.36
No Sentence 19.39a -30.97 10.13 44.37
Non-White -13.65 -10.28 -23.46 -25.07 28.58
Age 0.41 -15.17 0.18 -0.38 0.63
Male 13.16 0.14a 2.46 42.78
a 22.25
Constant 11.86 11.99*** 91.98*** 65.27 -40.57
R2 0.12 0.19 0.32 0.24 0.32
n 336 260 199 55 28
*p<.05, **p<.01, ***p<.001 ap<.10
Costs and fees. Table 2-6 describes the total amount of costs and fees ordered across
counties. The results show that the type and severity of the offense significantly predicted the
total amount of costs and fees ordered. The total amount of costs and fees ordered was
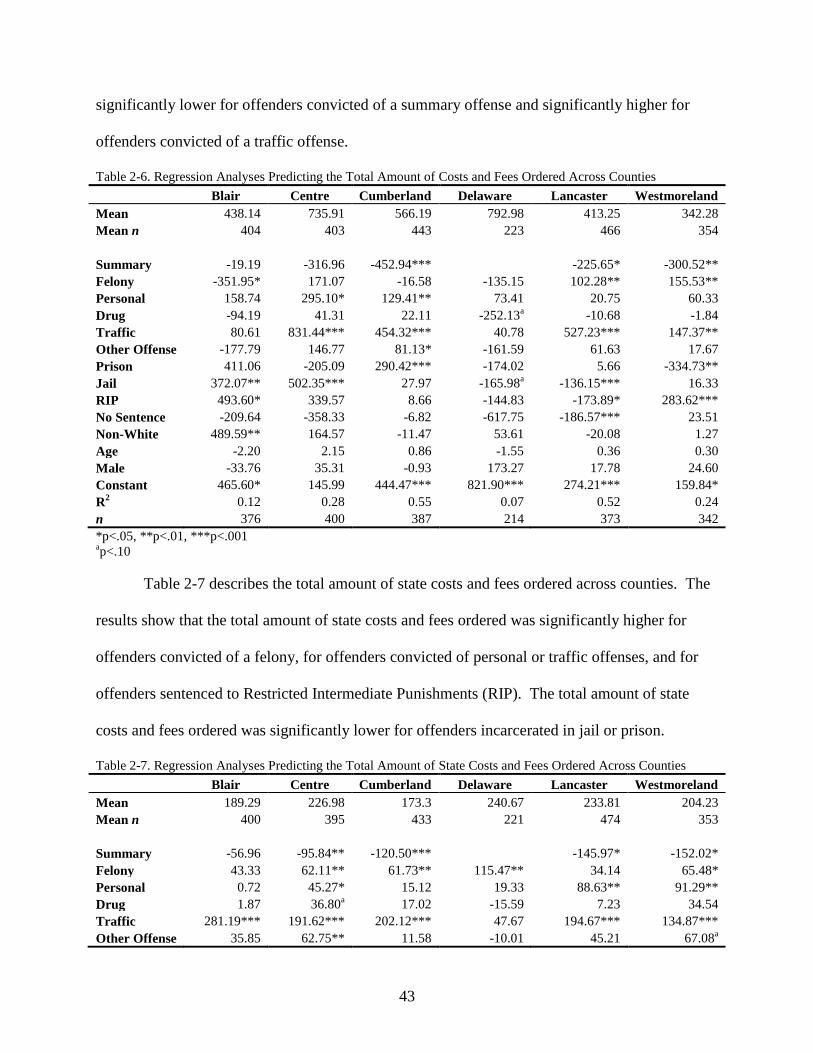
43
significantly lower for offenders convicted of a summary offense and significantly higher for
offenders convicted of a traffic offense.
Table 2-6. Regression Analyses Predicting the Total Amount of Costs and Fees Ordered Across Counties
Blair Centre Cumberland Delaware Lancaster Westmoreland
Mean 438.14 735.91 566.19 792.98 413.25 342.28
Mean n 404 403 443 223 466 354
Summary -19.19 -316.96 -452.94*** -225.65* -300.52**
Felony -351.95* 171.07 -16.58 -135.15 102.28** 155.53**
Personal 158.74 295.10* 129.41** 73.41 20.75 60.33
Drug -94.19 41.31 22.11 -252.13a -10.68 -1.84
Traffic 80.61 831.44*** 454.32*** 40.78 527.23*** 147.37**
Other Offense -177.79 146.77 81.13* -161.59 61.63 17.67
Prison 411.06 -205.09 290.42*** -174.02 5.66 -334.73**
Jail 372.07** 502.35*** 27.97 -165.98a -136.15*** 16.33
RIP 493.60* 339.57 8.66 -144.83 -173.89* 283.62***
No Sentence -209.64 -358.33 -6.82 -617.75 -186.57*** 23.51
Non-White 489.59** 164.57 -11.47 53.61 -20.08 1.27
Age -2.20 2.15 0.86 -1.55 0.36 0.30
Male -33.76 35.31 -0.93 173.27 17.78 24.60
Constant 465.60* 145.99 444.47*** 821.90*** 274.21*** 159.84*
R2 0.12 0.28 0.55 0.07 0.52 0.24
n 376 400 387 214 373 342
*p<.05, **p<.01, ***p<.001 ap<.10
Table 2-7 describes the total amount of state costs and fees ordered across counties. The
results show that the total amount of state costs and fees ordered was significantly higher for
offenders convicted of a felony, for offenders convicted of personal or traffic offenses, and for
offenders sentenced to Restricted Intermediate Punishments (RIP). The total amount of state
costs and fees ordered was significantly lower for offenders incarcerated in jail or prison.
Table 2-7. Regression Analyses Predicting the Total Amount of State Costs and Fees Ordered Across Counties
Blair Centre Cumberland Delaware Lancaster Westmoreland
Mean 189.29 226.98 173.3 240.67 233.81 204.23
Mean n 400 395 433 221 474 353
Summary -56.96 -95.84** -120.50*** -145.97* -152.02*
Felony 43.33 62.11** 61.73** 115.47** 34.14 65.48*
Personal 0.72 45.27* 15.12 19.33 88.63** 91.29**
Drug 1.87 36.80a 17.02 -15.59 7.23 34.54
Traffic 281.19*** 191.62*** 202.12*** 47.67 194.67*** 134.87***
Other Offense 35.85 62.75** 11.58 -10.01 45.21 67.08a

44
Prison -38.79 -80.41* 18.61 -164.43** -103.22* -172.97*
Jail 101.58 -34.20* 1.09 93.95*** -38.35a 6.85
RIP 33.40 86.55* 32.76 135.42** -103.84a 77.35**
No Sentence -56.56 -140.11*** 1.20 -110.96 -73.33* -82.12
Non-White -40.27 5.20 -25.73 -27.60 -44.20* 0.29
Age 0.73 -0.25 1.16a 1.38 -0.04 1.54
a
Male 27.17 -1.01 9.42 11.43 -16.14 11.29
Constant 62.35 163.01*** 70.34* 113.44* 195.36*** 42.36
R2 0.12 0.44 0.37 0.25 0.25 0.2
n 373 399 387 212 373 342
*p<.05, **p<.01, ***p<.001 ap<.10
The results presented in Table 2-8 describe the total amount of county costs and fees paid
across counties. The total amount of county costs and fees paid was significantly lower for
offenders convicted of a summary offense and significantly higher for offenders convicted of
traffic offenses. The average amount of county costs and fees paid ranged from $309 in
Westmoreland County to $828 in Delaware County.
Table 2-8. Regression Analyses Predicting the Total Amount of County Costs and Fees Paid Across Counties
Blair Centre Cumberland Delaware Lancaster Westmoreland
Mean 366.85 706.31 493.35 827.92 469.7 309.13
Mean n 405 388 443 223 477 353
Summary -18.94 -361.58a -428.77*** -388.99** -252.94*
Felony -264.54a 163.66 29.25 -13.27 114.61* 183.47***
Personal 151.02 229.80a 86.84* 61.39 77.97 123.39*
Drug -124.85 -53.04 -69.64a -258.64
a -49.26 -16.94
Traffic 0.45 740.93*** 298.98*** -81.73 576.89*** 70.50
Other Offense -180.25 158.16 14.42 -178.42 90.59 30.63
Prison 242.52 -348.08a 133.91
a -362.35 -136.75 -430.27**
Jail 241.10a 384.88*** 4.41 -113.39 -208.59*** -64.22
RIP 331.95a 331.23 20.26 -72.14 -367.66** 262.95***
No Sentence -251.06a -356.48 1.24 -643.45 -261.74*** -66.59
Non-White 536.35** 200.04 -13.55 27.69 -83.32a 3.02
Age -2.10 1.85 1.28 -1.31 -0.22 1.20
Male -13.85 10.72 14.33 187.95 -12.42 -3.25
Constant 438.54* 218.85 414.62*** 857.97*** 414.05*** 168.13*
R2 0.09 0.27 0.41 0.06 0.42 0.21
n 373 400 387 212 373 342
*p<.05, **p<.01, ***p<.001 ap<.10
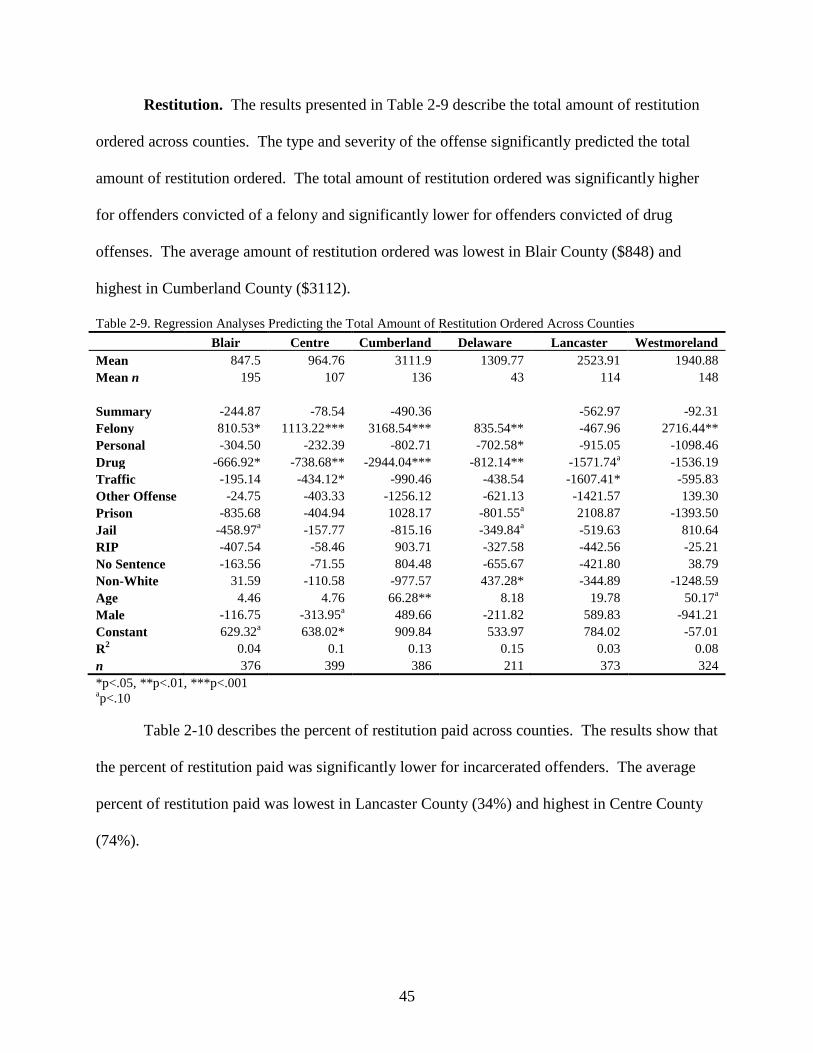
45
Restitution. The results presented in Table 2-9 describe the total amount of restitution
ordered across counties. The type and severity of the offense significantly predicted the total
amount of restitution ordered. The total amount of restitution ordered was significantly higher
for offenders convicted of a felony and significantly lower for offenders convicted of drug
offenses. The average amount of restitution ordered was lowest in Blair County ($848) and
highest in Cumberland County ($3112).
Table 2-9. Regression Analyses Predicting the Total Amount of Restitution Ordered Across Counties
Blair Centre Cumberland Delaware Lancaster Westmoreland
Mean 847.5 964.76 3111.9 1309.77 2523.91 1940.88
Mean n 195 107 136 43 114 148
Summary -244.87 -78.54 -490.36 -562.97 -92.31
Felony 810.53* 1113.22*** 3168.54*** 835.54** -467.96 2716.44**
Personal -304.50 -232.39 -802.71 -702.58* -915.05 -1098.46
Drug -666.92* -738.68** -2944.04*** -812.14** -1571.74a -1536.19
Traffic -195.14 -434.12* -990.46 -438.54 -1607.41* -595.83
Other Offense -24.75 -403.33 -1256.12 -621.13 -1421.57 139.30
Prison -835.68 -404.94 1028.17 -801.55a 2108.87 -1393.50
Jail -458.97a -157.77 -815.16 -349.84
a -519.63 810.64
RIP -407.54 -58.46 903.71 -327.58 -442.56 -25.21
No Sentence -163.56 -71.55 804.48 -655.67 -421.80 38.79
Non-White 31.59 -110.58 -977.57 437.28* -344.89 -1248.59
Age 4.46 4.76 66.28** 8.18 19.78 50.17a
Male -116.75 -313.95a 489.66 -211.82 589.83 -941.21
Constant 629.32a 638.02* 909.84 533.97 784.02 -57.01
R2 0.04 0.1 0.13 0.15 0.03 0.08
n 376 399 386 211 373 324
*p<.05, **p<.01, ***p<.001 ap<.10
Table 2-10 describes the percent of restitution paid across counties. The results show that
the percent of restitution paid was significantly lower for incarcerated offenders. The average
percent of restitution paid was lowest in Lancaster County (34%) and highest in Centre County
(74%).

46
Table 2-10. Regression Analyses Predicting the Percent of Restitution Paid Across Counties
Blair Centre Cumberland Delaware Lancaster Westmoreland
Mean 59.65 73.9 59.87 53.76 33.64 58.44
Mean n 191 106 136 43 114 79
Summary 16.99 9.11 -20.71 52.52
Felony 1.17 -6.80 -26.59** 21.67 -14.61 -15.04
Personal 25.67* 19.23a 17.02 -14.88 11.98 37.05
a
Drug 10.39 34.54 39.34** 28.32 27.89 19.10
Traffic 45.64*** 24.72 -17.72 42.99a -5.05 19.09
Other Offense 19.30 17.26 12.89 -4.42 1.15 -3.39
Prison -29.22a -31.60* -18.72 -23.84 -43.50*
Jail -23.34* -17.68 1.70 -3.99 -22.60a -27.81
a
RIP -7.22 -81.44** -1.28 -68.52 -28.279*
No Sentence -13.54 -15.00 29.00 -56.86
Non-White -12.63 3.50 -3.21 -28.90a 6.95 0.63
Age 0.26 0.22 1.13* 0.22 0.54 1.21*
Male 9.77 5.60 -1.59 -17.59 -2.45 14.70
Constant 35.83** 65.54*** 35.34* 61.49* 35.05a 6.89
R2 0.27 0.21 0.21 0.45 0.23 0.36
n 185 104 127 40 92 75
*p<.05, **p<.01, ***p<.001 ap<.10
Supervision fees. Table 2-11 describes the total amount of supervision fees ordered
across counties. The results show that the total amount of supervision fees ordered was
significantly higher for offenders convicted of a felony and for offenders convicted of traffic
offenses. Furthermore, the total amount of supervision fees ordered was significantly lower for
offenders convicted of a summary offense and for offenders incarcerated in prison.
Table 2-11. Regression Analyses Predicting the Total Amount of Supervision Fees Ordered Across Counties
Blair Centre Cumberland Delaware Lancaster Westmoreland
Mean 237.02 308.66 261.95 554.78 657.72 392.43
Mean n 214 279 169 116 217 165
Summary -46.03 -138.28* -109.01** -310.16* -188.71
Felony 136.74a 102.42** 112.53*** 252.39*** 47.05 104.01*
Personal -9.00 59.42a -31.32 10.14 148.06* 209.25***
Drug -7.42 -32.61 -84.00* -46.78 -32.59 19.56
Traffic 198.06** 140.02*** 48.02 -47.30 244.42*** 114.29*
Other Offense 39.84 83.08* -45.78 -33.36 74.03 102.02
Prison -206.46 -253.39*** -138.88* -388.46** -239.14* -349.79*
Jail -0.60 -87.60** -22.51 161.78*** -110.06* -48.02
RIP -88.36 48.07 58.00 201.07* -297.58* 86.69*
No Sentence -105.65 -162.97** 23.28 -160.78 -148.35a -123.83
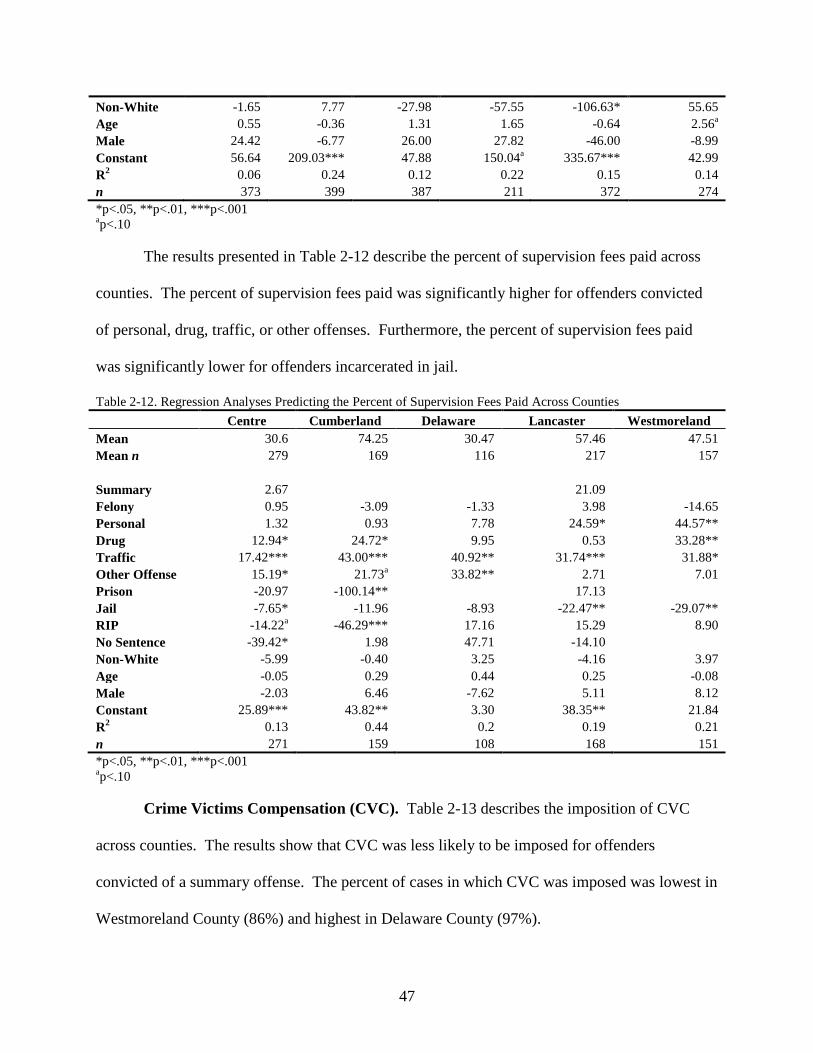
47
Non-White -1.65 7.77 -27.98 -57.55 -106.63* 55.65
Age 0.55 -0.36 1.31 1.65 -0.64 2.56a
Male 24.42 -6.77 26.00 27.82 -46.00 -8.99
Constant 56.64 209.03*** 47.88 150.04a 335.67*** 42.99
R2 0.06 0.24 0.12 0.22 0.15 0.14
n 373 399 387 211 372 274
*p<.05, **p<.01, ***p<.001 ap<.10
The results presented in Table 2-12 describe the percent of supervision fees paid across
counties. The percent of supervision fees paid was significantly higher for offenders convicted
of personal, drug, traffic, or other offenses. Furthermore, the percent of supervision fees paid
was significantly lower for offenders incarcerated in jail.
Table 2-12. Regression Analyses Predicting the Percent of Supervision Fees Paid Across Counties
Centre Cumberland Delaware Lancaster Westmoreland
Mean 30.6 74.25 30.47 57.46 47.51
Mean n 279 169 116 217 157
Summary 2.67 21.09
Felony 0.95 -3.09 -1.33 3.98 -14.65
Personal 1.32 0.93 7.78 24.59* 44.57**
Drug 12.94* 24.72* 9.95 0.53 33.28**
Traffic 17.42*** 43.00*** 40.92** 31.74*** 31.88*
Other Offense 15.19* 21.73a 33.82** 2.71 7.01
Prison -20.97 -100.14** 17.13
Jail -7.65* -11.96 -8.93 -22.47** -29.07**
RIP -14.22a -46.29*** 17.16 15.29 8.90
No Sentence -39.42* 1.98 47.71 -14.10
Non-White -5.99 -0.40 3.25 -4.16 3.97
Age -0.05 0.29 0.44 0.25 -0.08
Male -2.03 6.46 -7.62 5.11 8.12
Constant 25.89*** 43.82** 3.30 38.35** 21.84
R2 0.13 0.44 0.2 0.19 0.21
n 271 159 108 168 151
*p<.05, **p<.01, ***p<.001 ap<.10
Crime Victims Compensation (CVC). Table 2-13 describes the imposition of CVC
across counties. The results show that CVC was less likely to be imposed for offenders
convicted of a summary offense. The percent of cases in which CVC was imposed was lowest in
Westmoreland County (86%) and highest in Delaware County (97%).

48
Table 2-13. Regression Analyses Predicting the Imposition of Crime Victims Compensation (CVC) Across Counties
Blair Centre Cumberland Delaware Lancaster Westmoreland
Mean 93% 89% 90.30% 97.30% 91% 86.30%
Mean n 407 416 444 226 493 372
Summary 0.28 -3.02** -4.16*** -0.67 -2.28*
Felony -0.36 8.91 -2.90 11.66 1.98* 0.61
Personal -0.15 11.88 -8.27 10.76 1.42 -0.19
Drug -1.04 0.67 0.41 -0.95 -1.25* 0.66
Traffic -2.65** 1.90** -12.94 39.36 0.27 -0.14
Other Offense -0.46 2.45** -9.79 12.58 -0.15 1.00
Prison 0.41 5.27 -0.43 10.72 -0.74 -2.50*
Jail 2.30* -2.26** 3.60** -2.82 0.06 0.10
RIP 7.69 6.51 2.06 0.03 6.06 -0.58
No Sentence -1.23 -3.28** 2.67* -40.65 0.22 -0.86
Non-White -1.61* 0.40 0.05 0.01 -0.02 0.12
Age 0.02 -0.04a -0.06 0.56 -0.03 0.03
Male -1.45 0.25 -8.63 -11.90 -0.15 0.13
Constant 5.22** 3.92*** 23.66 3.48 3.17*** 1.16
R2
n 372 399 387 212 493 340
*p<.05, **p<.01, ***p<.001 ap<.10
The results presented in Table 2-14 describe the percent of cases in which CVC was paid
in full. The percent of cases in which CVC was paid in full was significantly higher for
offenders convicted of drug or traffic offenses and significantly lower for offenders incarcerated
in jail.
Table 2-14. Regression Analyses Predicting the Percent of Crime Victims Compensation (CVC) Paid in Full Across
Counties
Blair Centre Cumberland Delaware Westmoreland
Mean 51% 56% 68% 43.60% 60%
Mean n 378 366 401 220 180
Summary 0.23 0.60 0.37
Felony -0.68 -0.24 -0.47 0.75 -0.13
Personal 1.03** 0.01 0.71a -0.03 1.01
a
Drug 1.12* 1.03* 0.95* -0.09 0.75
Traffic 2.69*** 1.26*** 1.81*** 1.85** 1.10*
Other Offense 1.44*** 0.59 0.73a 0.80 0.44
Prison -6.85 -0.63 -1.54* -1.16
Jail -1.64*** -0.66* -1.14** -2.00*** -0.88*
RIP -0.66 -1.24* -0.65 -1.24a -0.38
No Sentence -0.22 -1.17 -0.53 3.35 4.27
Non-White -0.55 -0.26 -0.39 -0.53 -0.52
Age 0.01 -0.01 0.03a -0.01 0.01
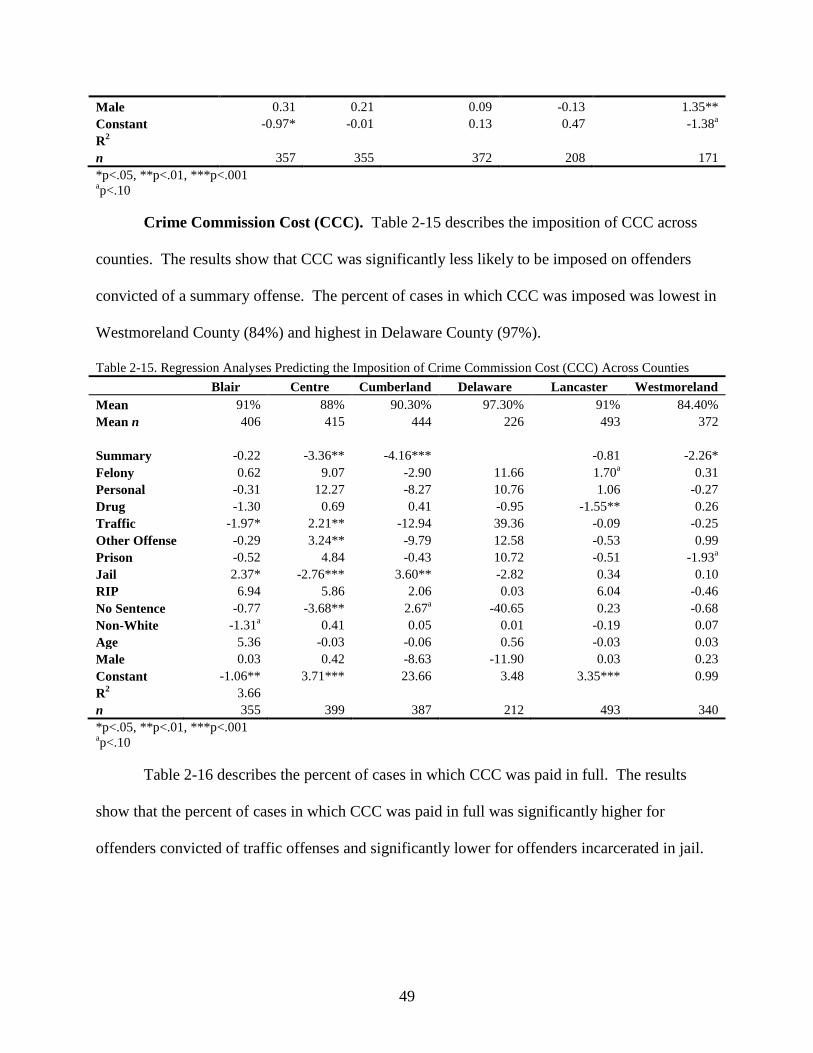
49
Male 0.31 0.21 0.09 -0.13 1.35**
Constant -0.97* -0.01 0.13 0.47 -1.38a
R2
n 357 355 372 208 171
*p<.05, **p<.01, ***p<.001 ap<.10
Crime Commission Cost (CCC). Table 2-15 describes the imposition of CCC across
counties. The results show that CCC was significantly less likely to be imposed on offenders
convicted of a summary offense. The percent of cases in which CCC was imposed was lowest in
Westmoreland County (84%) and highest in Delaware County (97%).
Table 2-15. Regression Analyses Predicting the Imposition of Crime Commission Cost (CCC) Across Counties
Blair Centre Cumberland Delaware Lancaster Westmoreland
Mean 91% 88% 90.30% 97.30% 91% 84.40%
Mean n 406 415 444 226 493 372
Summary -0.22 -3.36** -4.16*** -0.81 -2.26*
Felony 0.62 9.07 -2.90 11.66 1.70a 0.31
Personal -0.31 12.27 -8.27 10.76 1.06 -0.27
Drug -1.30 0.69 0.41 -0.95 -1.55** 0.26
Traffic -1.97* 2.21** -12.94 39.36 -0.09 -0.25
Other Offense -0.29 3.24** -9.79 12.58 -0.53 0.99
Prison -0.52 4.84 -0.43 10.72 -0.51 -1.93a
Jail 2.37* -2.76*** 3.60** -2.82 0.34 0.10
RIP 6.94 5.86 2.06 0.03 6.04 -0.46
No Sentence -0.77 -3.68** 2.67a -40.65 0.23 -0.68
Non-White -1.31a 0.41 0.05 0.01 -0.19 0.07
Age 5.36 -0.03 -0.06 0.56 -0.03 0.03
Male 0.03 0.42 -8.63 -11.90 0.03 0.23
Constant -1.06** 3.71*** 23.66 3.48 3.35*** 0.99
R2 3.66
n 355 399 387 212 493 340
*p<.05, **p<.01, ***p<.001 ap<.10
Table 2-16 describes the percent of cases in which CCC was paid in full. The results
show that the percent of cases in which CCC was paid in full was significantly higher for
offenders convicted of traffic offenses and significantly lower for offenders incarcerated in jail.
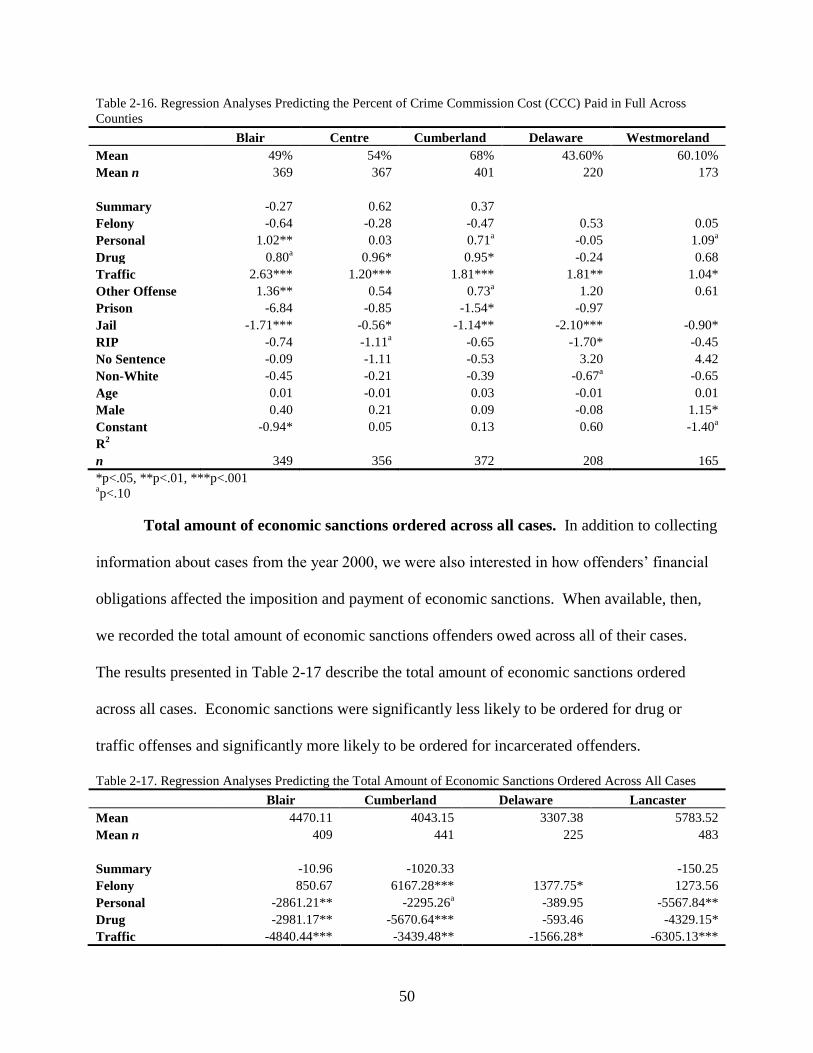
50
Table 2-16. Regression Analyses Predicting the Percent of Crime Commission Cost (CCC) Paid in Full Across
Counties
Blair Centre Cumberland Delaware Westmoreland
Mean 49% 54% 68% 43.60% 60.10%
Mean n 369 367 401 220 173
Summary -0.27 0.62 0.37
Felony -0.64 -0.28 -0.47 0.53 0.05
Personal 1.02** 0.03 0.71a -0.05 1.09
a
Drug 0.80a 0.96* 0.95* -0.24 0.68
Traffic 2.63*** 1.20*** 1.81*** 1.81** 1.04*
Other Offense 1.36** 0.54 0.73a 1.20 0.61
Prison -6.84 -0.85 -1.54* -0.97
Jail -1.71*** -0.56* -1.14** -2.10*** -0.90*
RIP -0.74 -1.11a -0.65 -1.70* -0.45
No Sentence -0.09 -1.11 -0.53 3.20 4.42
Non-White -0.45 -0.21 -0.39 -0.67a -0.65
Age 0.01 -0.01 0.03 -0.01 0.01
Male 0.40 0.21 0.09 -0.08 1.15*
Constant -0.94* 0.05 0.13 0.60 -1.40a
R2
n 349 356 372 208 165
*p<.05, **p<.01, ***p<.001 ap<.10
Total amount of economic sanctions ordered across all cases. In addition to collecting
information about cases from the year 2000, we were also interested in how offenders‟ financial
obligations affected the imposition and payment of economic sanctions. When available, then,
we recorded the total amount of economic sanctions offenders owed across all of their cases.
The results presented in Table 2-17 describe the total amount of economic sanctions ordered
across all cases. Economic sanctions were significantly less likely to be ordered for drug or
traffic offenses and significantly more likely to be ordered for incarcerated offenders.
Table 2-17. Regression Analyses Predicting the Total Amount of Economic Sanctions Ordered Across All Cases
Blair Cumberland Delaware Lancaster
Mean 4470.11 4043.15 3307.38 5783.52
Mean n 409 441 225 483
Summary -10.96 -1020.33 -150.25
Felony 850.67 6167.28*** 1377.75* 1273.56
Personal -2861.21** -2295.26a -389.95 -5567.84**
Drug -2981.17** -5670.64*** -593.46 -4329.15*
Traffic -4840.44*** -3439.48** -1566.28* -6305.13***

51
Other Offense -2467.60* -3863.35** -1211.00 -3554.49
Prison 7435.85*** 1322.18 -649.36 10653.29**
Jail 2990.82** 610.21 1608.86** 554.53
RIP 3089.76* 1281.64 1167.39 485.09
No Sentence -497.36 2885.90a 225.31 -2774.98
Non-White -286.60 -1877.63* -237.61 -1562.32
Age -45.1252 56.68 18.33 40.68
Male 494.4561 2255.35* 500.84 2079.17
Constant 6876.5*** 1482.11 2307.67* 5967.61*
R2 0.16 0.21 0.14 0.11
n 374 387 211 373
*p<.05, **p<.01, ***p<.001 ap<.10
Percent of economic sanctions paid across all cases. Table 2-18 describes the percent
of economic sanctions paid across all cases. The results show that the percent of economic
sanctions paid was significantly higher for offenders convicted of personal, traffic, or other
offenses. Furthermore, the percent of economic sanctions paid was significantly lower for
offenders incarcerated in jail or prison.
Table 2-18. Regression Analyses Predicting the Percent of Economic Sanctions Paid Across All Cases
Blair Cumberland Delaware Lancaster
Mean 57.43 55.11 63.37 46.45
Mean n 409 441 130 483
Summary 6.50 -2.36 -8.00
Felony -2.20 -10.18 8.49 -10.22a
Personal 21.12** 24.02** 14.79 20.17**
Drug 16.47* 26.59** 2.90 1.56
Traffic 45.78*** 35.23*** 38.76*** 27.50***
Other Offense 22.08** 27.08** 17.37 9.65
Prison -37.10** -51.71*** -43.96* -22.99*
Jail -27.65*** -15.36* -33.44*** -15.63***
RIP -9.61 -1.62 -27.50* -0.39
No Sentence -4.32 -13.41 -2.77 11.78
Non-White -5.56 -6.12 -18.63* -14.33**
Age 0.28 0.49* -0.17 0.55**
Male 5.04 -4.52 7.92 4.21
Constant 33.39*** 36.54** 62.00*** 27.03***
R2 0.24 0.17 0.39 0.28
n 374 387 121 367
*p<.05, **p<.01, ***p<.001 ap<.10

52
Discussion
Overall, case characteristics were stronger predictors than offender characteristics of the
amount of economic sanctions ordered and the percent of economic sanctions paid across
counties. More specifically, the amount of economic sanctions ordered was significantly higher
for offenders convicted of a felony. Furthermore, the percent of economic sanctions paid was
significantly lower for incarcerated offenders. The total amount of fines, costs and fees, and
supervision fees ordered was significantly higher for offenders convicted of a traffic offense.
This finding probably reflects the fact that most traffic offenses were for DUI, as the amount of
economic sanctions imposed in these cases is generally high.

53
Chapter 3: Juvenile Data
In addition to examining the imposition and payment of economic sanctions for adult
offenders, we also examined these same issues for juvenile offenders.
Method
Sampling
We collected data from juvenile cases docketed in the year 2000. In each county, we
selected a random sample of approximately 200 juvenile cases.14
In order to draw the sample,
we first identified the total number of juvenile cases in the year 2000. We then selected random
samples of one hundred cases and counted the number of cases that were missing in each sample.
This procedure allowed us to estimate the total number of missing cases in the year 2000 (i.e.,
the number of cases for which no information was available). Accounting for this number, we
determined how many docket numbers we needed to select in order to produce a sample of 200
juvenile cases. We then sampled every “nth
” docket number.
It was often difficult to draw the juvenile samples because counties do not always assign
docket numbers or similar tracking numbers to juvenile records. Furthermore, each county
organized its juvenile files and records differently and there were few similarities across
counties. Because many juvenile cases were informally processed, several counties did not have
a readily available list of all juvenile cases handled in the year 2000. As a result, we had to
develop a unique sampling procedure for each county. Because Centre County processed only a
small number of juvenile cases, we coded all juvenile cases from the year 2000.
Data Collection
To collect data on juvenile cases, we first modified the adult data collection form to
accommodate juvenile cases. For example, we added several juvenile-specific variables (e.g.,
14
We were unable to collect juvenile data in Blair County because the president judge denied us access to the files.

54
case processing variables and additional programs) to the adult data collection form. We then
customized the data collection form for each county (see Appendix B for the juvenile data
collection forms).
In all but Westmoreland County, we collected juvenile data primarily from the juvenile
probation department.15
We examined both computer and paper files when available. We had
access to probation paper files in Cumberland, Delaware, Lancaster, and Luzerne Counties. In
the remaining counties, we relied on the limited amount of information provided by probation
computer records, Clerk of Courts paper and computer records, and Victim/Witness Services
paper records.
Although probation paper files were a rich source of information, we found that even
when we could access probation paper files, many of those from the year 2000 were missing. In
most cases, files were missing because probation departments frequently removed juvenile
records from their files when offenders reached a certain age (i.e., 18 to 21) and were discharged
from probation.
We used the same basic data collection procedures in all six counties, but there were
several differences across counties in the way information was collected and what was available
to us (see Appendices D-J for information about data collection procedures specific to each
county).
Variables
For each juvenile case, we recorded the following types of information: offender
characteristics (e.g., race, gender, age, and adults in the home), case characteristics (e.g., charge
and conviction offenses and type of disposition), victim characteristics (e.g., gender, and type of
15
Due to time constraints in Westmoreland County, we were able to collect information from only Clerk of Courts
paper files.

55
injury), economic sanctions imposed and paid (e.g., fines, fees, costs, and restitution), and
recidivism. Because juvenile files often combined information across cases, we were not always
able to collect information about specific cases.
Juvenile cases differed from adult cases in several ways. Juvenile probation files usually
contained detailed information about offenders‟ backgrounds and living conditions. In contrast
to adult probation files, however, juvenile probation files also included mental health
assessments and results of regular drug tests. Juvenile probation files also contained detailed
victim information, including demographic information (e.g., gender) and participation in the
criminal justice process (e.g., whether the victim submitted a victim impact statement). Because
juvenile probation files were a rich source of data, we were able to collect most of the desired
background information when we had access to these files. Unfortunately, we had access to
probation paper files only in Cumberland, Delaware, Lancaster, and Luzerne Counties.
Juvenile cases provided only limited information about the imposition and collection of
economic sanctions, perhaps because economic sanctions were assessed less frequently for
juveniles, especially for informally handled cases. When information on economic sanctions
was available, however, the different types of economic sanctions were usually combined. As a
result, we were often unable to collect detailed economic sanctions information for juvenile
cases.
Results
Descriptive Analyses Juvenile Data
Table 3-1 describes the juvenile sample in each county. The results show that most
offenders were male and white. The only exception to this finding was in Delaware County,
where most offenders were nonwhite (56.8%). The average age at sentencing ranged from 15.6-

56
16.2 years. The average amount of education offenders received ranged from 8.6-10 years.
Most offenders were convicted of misdemeanor offenses, followed by felony offenses and
summary offenses. Most offenders were convicted of property offenses. In Westmoreland
County, however, most offenders were convicted of personal offenses.
Table 3-1. Description of the Sample
Centre Cumberland Delaware Lancaster Westmoreland
% n % n % n % n % n
Gender
Male 77.8 123 85.8 157 77.0 151 81.1 146 79.6 113
Female 22.2 35 14.2 26 23.0 45 18.9 34 20.4 29
Total 158 183 196 180 142
Missing 0 1 0 6 1
Race
White 93.6 147 76.5 140 43.2 79 89.1 57 89.4 127
Nonwhite 6.4 10 23.5 43 56.8 104 10.9 7 10.6 15
Total 157 183 183 64 142
Missing 1 1 13 122 1
Education M = 8.6 M = 10 M = 9.5 M = 10
Total 177 153 55 95
Missing 158 7 43 131 48
Offense Grading
Summary 4.4 7 3.3 6 6.7 12 6.6 12 1.4 2
Misdemeanor 64.6 102 65.2 120 73.7 132 66.9 121 78.9 112
Felony 31.0 49 31.5 58 19.6 35 26.5 48 19.7 28
Total 158 184 179 181 142
Missing 0 0 17 5 1
Type of Offense
Property 43.7 69 38.8 71 34.2 67 32.1 59 32.2 46
Personal 21.5 34 30.1 55 30.1 59 25.5 47 33.6 48
Drug 13.9 22 15.8 29 19.9 39 27.2 50 21.0 30
Traffic 5.7 9 3.8 7 2.0 4 2.2 4 4.9 7
Other 15.2 24 11.5 21 13.8 27 24 8.4 12
Total 158 183 196 184 143
Missing 0 0 2 0
Age at sentencing M = 16.2 M = 15.6 M = 16 M = 16.2 M = 16
Total 131 183 173 181 132
Missing 27 1 23 5 11
Multivariate Analyses
The following discussion describes how case and offender characteristics affect the
imposition and payment of economic sanctions. We begin by estimating regression models
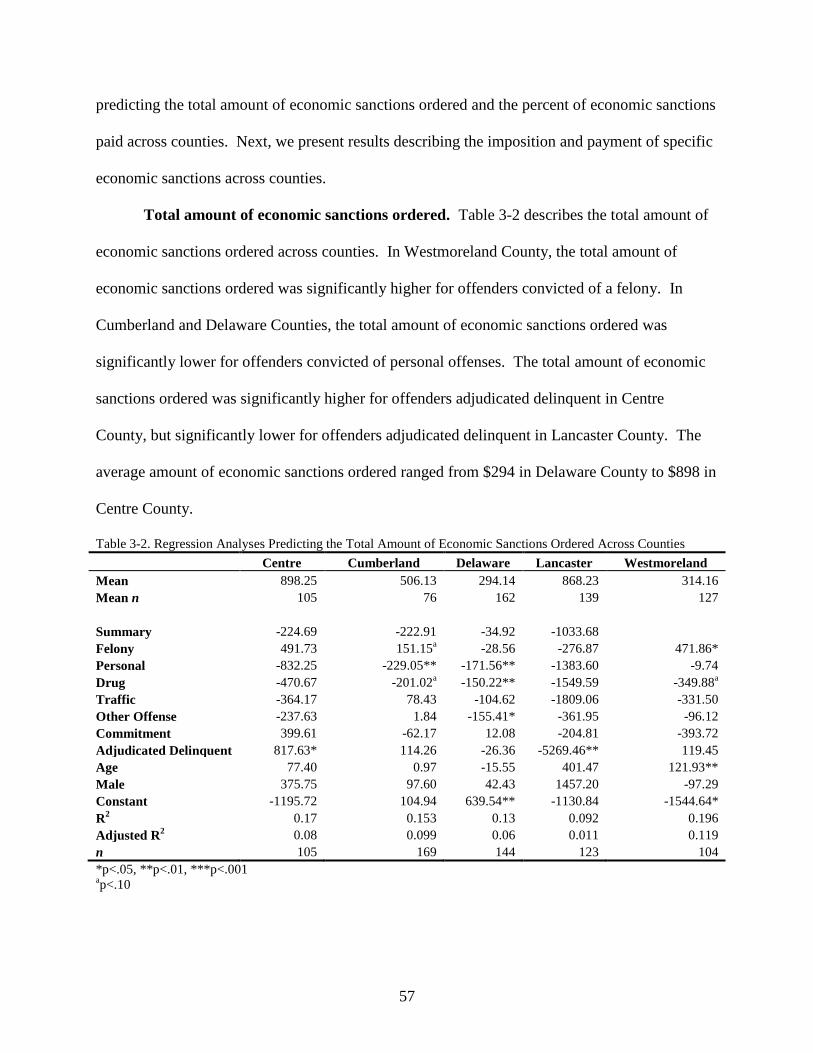
57
predicting the total amount of economic sanctions ordered and the percent of economic sanctions
paid across counties. Next, we present results describing the imposition and payment of specific
economic sanctions across counties.
Total amount of economic sanctions ordered. Table 3-2 describes the total amount of
economic sanctions ordered across counties. In Westmoreland County, the total amount of
economic sanctions ordered was significantly higher for offenders convicted of a felony. In
Cumberland and Delaware Counties, the total amount of economic sanctions ordered was
significantly lower for offenders convicted of personal offenses. The total amount of economic
sanctions ordered was significantly higher for offenders adjudicated delinquent in Centre
County, but significantly lower for offenders adjudicated delinquent in Lancaster County. The
average amount of economic sanctions ordered ranged from $294 in Delaware County to $898 in
Centre County.
Table 3-2. Regression Analyses Predicting the Total Amount of Economic Sanctions Ordered Across Counties
Centre Cumberland Delaware Lancaster Westmoreland
Mean 898.25 506.13 294.14 868.23 314.16
Mean n 105 76 162 139 127
Summary -224.69 -222.91 -34.92 -1033.68
Felony 491.73 151.15a -28.56 -276.87 471.86*
Personal -832.25 -229.05** -171.56** -1383.60 -9.74
Drug -470.67 -201.02a -150.22** -1549.59 -349.88
a
Traffic -364.17 78.43 -104.62 -1809.06 -331.50
Other Offense -237.63 1.84 -155.41* -361.95 -96.12
Commitment 399.61 -62.17 12.08 -204.81 -393.72
Adjudicated Delinquent 817.63* 114.26 -26.36 -5269.46** 119.45
Age 77.40 0.97 -15.55 401.47 121.93**
Male 375.75 97.60 42.43 1457.20 -97.29
Constant -1195.72 104.94 639.54** -1130.84 -1544.64*
R2 0.17 0.153 0.13 0.092 0.196
Adjusted R2 0.08 0.099 0.06 0.011 0.119
n 105 169 144 123 104
*p<.05, **p<.01, ***p<.001 ap<.10
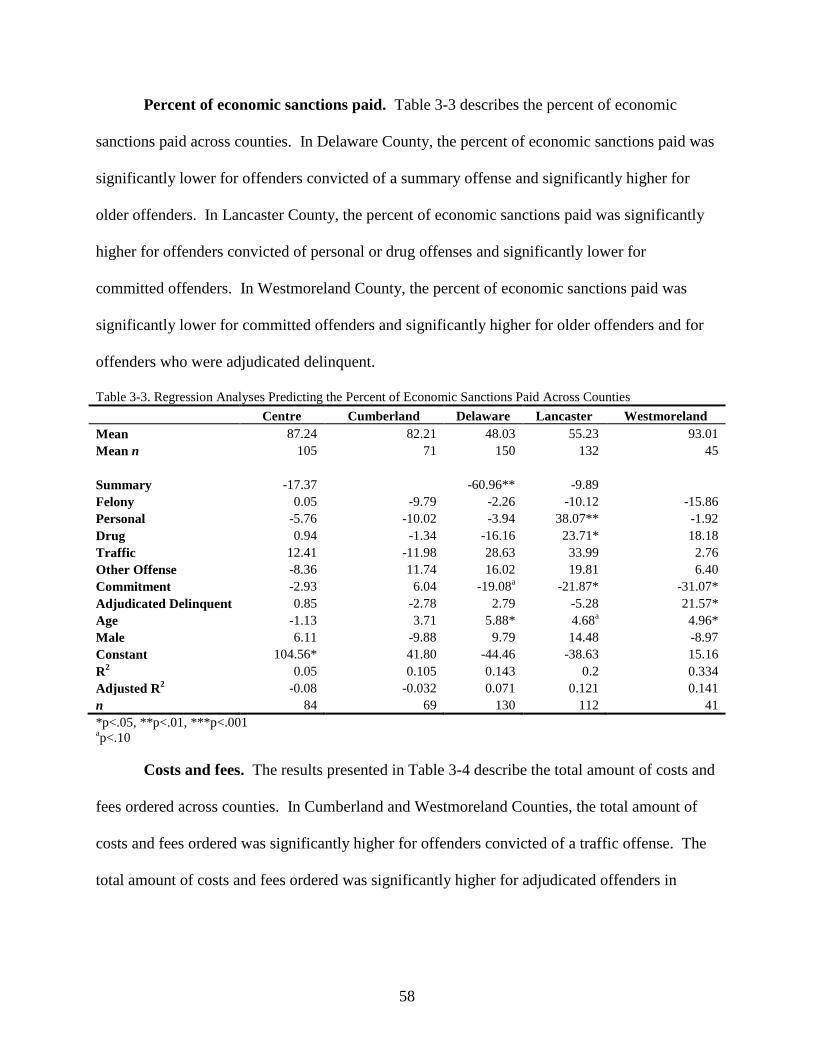
58
Percent of economic sanctions paid. Table 3-3 describes the percent of economic
sanctions paid across counties. In Delaware County, the percent of economic sanctions paid was
significantly lower for offenders convicted of a summary offense and significantly higher for
older offenders. In Lancaster County, the percent of economic sanctions paid was significantly
higher for offenders convicted of personal or drug offenses and significantly lower for
committed offenders. In Westmoreland County, the percent of economic sanctions paid was
significantly lower for committed offenders and significantly higher for older offenders and for
offenders who were adjudicated delinquent.
Table 3-3. Regression Analyses Predicting the Percent of Economic Sanctions Paid Across Counties
Centre Cumberland Delaware Lancaster Westmoreland
Mean 87.24 82.21 48.03 55.23 93.01
Mean n 105 71 150 132 45
Summary -17.37 -60.96** -9.89
Felony 0.05 -9.79 -2.26 -10.12 -15.86
Personal -5.76 -10.02 -3.94 38.07** -1.92
Drug 0.94 -1.34 -16.16 23.71* 18.18
Traffic 12.41 -11.98 28.63 33.99 2.76
Other Offense -8.36 11.74 16.02 19.81 6.40
Commitment -2.93 6.04 -19.08a -21.87* -31.07*
Adjudicated Delinquent 0.85 -2.78 2.79 -5.28 21.57*
Age -1.13 3.71 5.88* 4.68a 4.96*
Male 6.11 -9.88 9.79 14.48 -8.97
Constant 104.56* 41.80 -44.46 -38.63 15.16
R2 0.05 0.105 0.143 0.2 0.334
Adjusted R2 -0.08 -0.032 0.071 0.121 0.141
n 84 69 130 112 41
*p<.05, **p<.01, ***p<.001 ap<.10
Costs and fees. The results presented in Table 3-4 describe the total amount of costs and
fees ordered across counties. In Cumberland and Westmoreland Counties, the total amount of
costs and fees ordered was significantly higher for offenders convicted of a traffic offense. The
total amount of costs and fees ordered was significantly higher for adjudicated offenders in

59
Centre County and for committed offenders in Westmoreland County. The average amount of
costs and fees ordered ranged from $85 in Westmoreland County to $431 in Centre County.
Table 3-4. Regression Analyses Predicting the Total Amount of Costs and Fees Ordered Across Counties
Centre Cumberland Delaware Lancaster Westmoreland
Mean 430.65 92.28 139.8 117.67 84.85
Mean n 85 36 133 137 125
Summary -133.38 -16.71 -69.99 65.46a
Felony -136.02 12.51 -5.04 -6.08 5.82
Personal -333.30a 1.06 20.16 35.18* 10.20
Drug -24.00 9.37 13.23 8.77 -7.63
Traffic 40.21 328.54*** 100.49 41.79 76.49**
Other Offense -178.38 8.85 6.12 12.50 -2.62
Commitment 172.18 8.48 -5.34 19.48 56.23**
Adjudicated Delinquent 268.25* 6.75 -30.54 19.89 6.39
Age -9.86 1.04 0.29 0.38 -0.28
Male 59.07 -0.91 4.05 9.41 0.06
Constant 350.62 -15.32 118.38 68.12 78.41
R2 0.11 0.678 0.037 0.127 0.205
Adjusted R2 0.02 0.655 -0.03 0.043 0.125
n 105 152 156 115 99
*p<.05, **p<.01, ***p<.001 ap<.10
Table 3-5 describes the total amount of state costs and fees ordered across counties. The
results show that the total amount of state costs and fees ordered was significantly higher for
offenders convicted of a traffic offense. In Delaware County, the total amount of state costs and
fees ordered was significantly higher for offenders convicted of a felony and significantly lower
for offenders who were adjudicated delinquent.
Table 3-5. Regression Analyses Predicting the Total Amount of State Costs and Fees Ordered Across Counties
Centre Cumberland Delaware Lancaster Westmoreland
Mean 56.41 39.93 2.7 39.29 47.65
Mean n 71 29 106 126 103
Summary -13.13 -10.10 -1.82 0.66
Felony 13.45 4.36 1.70* 0.42 3.75
Personal -0.01 -1.20 -0.74 -2.20 -3.18
Drug 5.84 -0.77 -0.54 -4.97 -1.31
Traffic 1.28 66.20*** -1.26 31.96*** 18.37***
Other Offense 32.88 4.10 0.48 0.71 -1.43
Commitment -9.18 -0.58 0.70 -1.08 3.97
Adjudicated Delinquent 33.54* 5.00 -7.06** 0.48 -0.92

60
Age 0.74 0.00 0.18 0.89 0.93a
Male -4.54 -0.82 1.04 -0.26 -0.55
Constant -1.34 5.02 5.56 26.09* 32.05**
R2 0.09 0.175 0.172 0.263 0.292
Adjusted R2 0.00 0.115 0.079 0.19 0.21
n 105 148 100 112 88
*p<.05, **p<.01, ***p<.001 ap<.10
Table 3-6 describes the total amount of county costs and fees ordered across counties. In
Centre County, the total amount of costs and fees ordered was significantly higher for offenders
who were adjudicated delinquent. Apart from this finding, however, no other factors
significantly predicted the total amount of costs and fees ordered across counties.
Table 3-6. Regression Analyses Predicting the Total Amount of County Costs and Fees Ordered Across Counties
Centre Delaware Lancaster Westmoreland
Mean 123.24 221.38 65.19 31.99
Mean n 63 81 136 121
Summary -55.79 -80.55 26.59
Felony 69.12a -16.69 2.27 -7.25
a
Personal 18.48 13.65 8.93 -0.32
Drug 23.60 12.14 6.10 -1.56
Traffic 19.99 98.47 19.95 -5.71
Other Offense 73.01 0.15 -1.15 9.35
Commitment -56.94 -2.83 14.55a 5.92
Adjudicated Delinquent 73.15* -31.44 3.90 3.65
Age 3.94 0.33 -1.40 1.08
Male 5.64 0.50 -4.32 1.07
Constant -73.93 122.85 78.35* 10.97
R2 0.11 0.046 0.09 0.122
Adjusted R2 0.01 -0.02 0 0.029
n 105 156 114 95
*p<.05, **p<.01, ***p<.001 ap<.10
Restitution. Table 3-7 describes the total amount of restitution ordered across counties.
The results show that the total amount of restitution ordered was significantly lower for offenders
convicted of a personal offense. In Delaware County, the total amount of restitution ordered was
also significantly lower for offenders convicted of a drug offense and for older offenders. In
Lancaster County, the total amount of restitution ordered was significantly lower for offenders

61
who were adjudicated delinquent. In Westmoreland County, the total amount of restitution
ordered was significantly higher for offenders convicted of a felony.
Table 3-7. Regression Analyses Predicting the Total Amount of Restitution Ordered Across Counties
Centre Cumberland Delaware Lancaster Westmoreland
Mean 1261.58 580.95 470.97 3035.11 703.72
Mean n 43 58 24 32 41
Summary -45.52 -215.24 10.77 -1182.64
Felony 617.03 124.50 -42.22 -440.47 920.29*
Personal -496.05 -213.23** -240.93*** -1647.05 664.05
Drug -453.15 -190.02a -185.45** -1389.16 -723.85
Traffic -449.44 -221.74 -157.45 -2049.45
Other Offense -172.79 11.07 -154.65a -336.67 730.47
Commitment 257.66 -53.25 4.08 -289.45 -834.32
Adjudicated Delinquent 527.67 104.58 20.37 -5784.68** 92.67
Age 80.40 1.41 -40.65** 465.86 190.23a
Male 295.73 85.58 27.29 1629.85 -83.85
Constant -1417.35 94.86 833.00** -1929.26 -2768.41
R2 0.15 0.136 0.222 0.103 0.283
Adjusted R2 0.055 0.08 0.149 0.013 0.109
n 105 165 118 111 42
*p<.05, **p<.01, ***p<.001 ap<.10
The results presented in Table 3-8 describe the percent of restitution paid across counties.
We obtained information about the percent of restitution paid in Centre and Cumberland
Counties. However, no case or offender characteristics significantly predicted the percent of
restitution paid.
Table 3-8. Regression Analyses Predicting the Percent of Restitution Paid Across Counties
Centre Cumberland
Mean 85.52 83.73
Mean n 43 55
Summary
Felony 7.19 -8.01
Personal -40.03a 17.62
Drug -13.70
Traffic 10.62 0.05
Other Offense -13.80 14.51
Commitment -36.11 -8.23
Adjudicated Delinquent -1.28 -3.01
Age -1.49 4.16
Male 0.31 17.22

62
Constant 114.20a 9.53
R2 0.20 0.166
Adjusted R2 -0.031 -0.009
n 37 53
*p<.05, **p<.01, ***p<.001 ap<.10
Crime Victims Compensation (CVC). Table 3-9 describes the imposition of Crime
Victims Compensation (CVC) across counties. The percent of cases in which CVC was imposed
was lowest in Cumberland County (19%) and highest in Lancaster County (82%).
Table 3-9. Regression Analyses Predicting the Imposition of Crime Victims Compensation (CVC) Across Counties
Centre Cumberland Lancaster Westmoreland
Mean 43% 18.70% 82% 76.50%
Mean n 158 150 147 132
Summary -0.43 -19.21 2.30
Felony 0.12 1.14* 0.65 0.18
Personal -0.41 -0.42 -0.32 0.04
Drug 0.14 -0.36 18.81 1.65
Traffic -20.99 -19.73 18.48 18.89
Other Offense -1.18 0.56 -3.30* 1.18
Commitment 0.19 -19.52 -2.92* -3.12***
Adjudicated Delinquent 1.36** -0.48 4.22*** -0.60
Age -0.08 0.04 0.02 0.08
Male 0.08 -0.65 0.46 0.62
Constant 0.46 -1.60 -0.76 0.39
R2
Adjusted R2
n 130 147 125 104
*p<.05, **p<.01, ***p<.001
Crime Commission Cost (CCC). Table 3-10 describes the imposition of Crime
Commission Cost (CCC) across counties. The percent of cases in which CCC was imposed was
lowest in Centre County (42%) and highest in Lancaster County (82%).
Table 3-10. Regression Analyses Predicting the Imposition of Crime Commission Cost (CCC) Across Counties
Centre Lancaster Westmoreland
Mean 41.90% 82% 75.80%
Mean n 129 147 132
Summary 0.79 2.06
Felony 0.54 1.76 0.11
Personal 0.30 0.76 -0.26
Drug 0.58 0.82 1.61
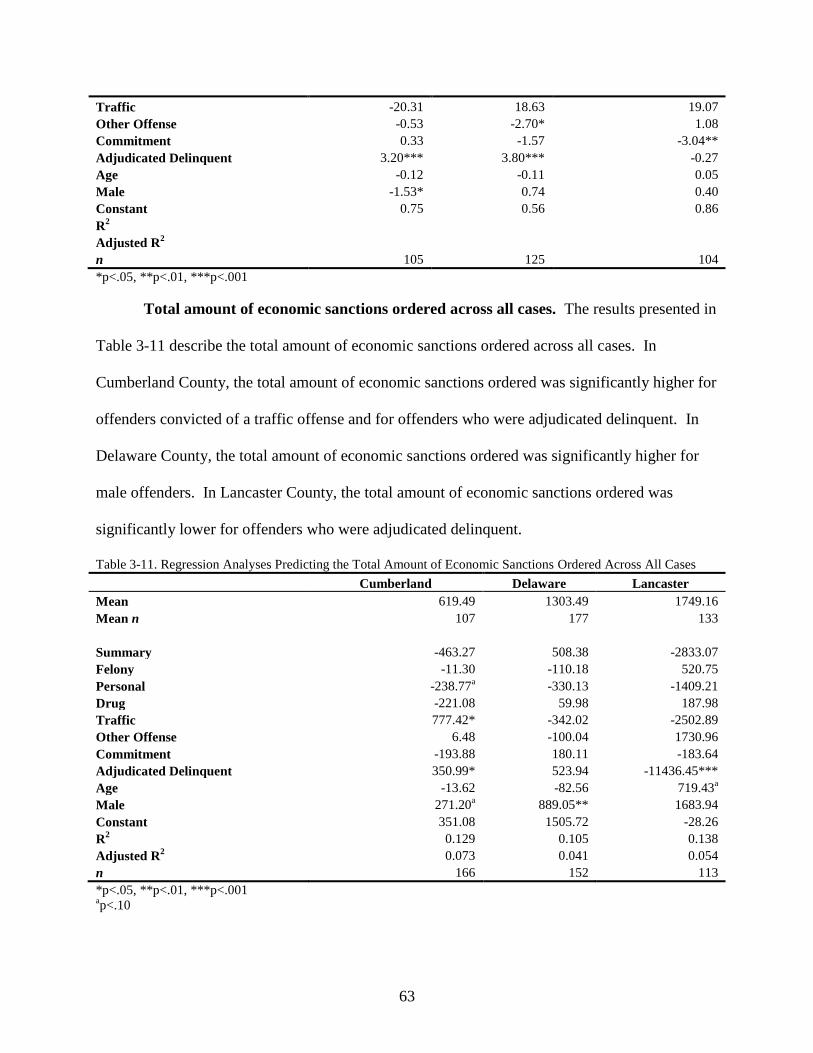
63
Traffic -20.31 18.63 19.07
Other Offense -0.53 -2.70* 1.08
Commitment 0.33 -1.57 -3.04**
Adjudicated Delinquent 3.20*** 3.80*** -0.27
Age -0.12 -0.11 0.05
Male -1.53* 0.74 0.40
Constant 0.75 0.56 0.86
R2
Adjusted R2
n 105 125 104
*p<.05, **p<.01, ***p<.001
Total amount of economic sanctions ordered across all cases. The results presented in
Table 3-11 describe the total amount of economic sanctions ordered across all cases. In
Cumberland County, the total amount of economic sanctions ordered was significantly higher for
offenders convicted of a traffic offense and for offenders who were adjudicated delinquent. In
Delaware County, the total amount of economic sanctions ordered was significantly higher for
male offenders. In Lancaster County, the total amount of economic sanctions ordered was
significantly lower for offenders who were adjudicated delinquent.
Table 3-11. Regression Analyses Predicting the Total Amount of Economic Sanctions Ordered Across All Cases
Cumberland Delaware Lancaster
Mean 619.49 1303.49 1749.16
Mean n 107 177 133
Summary -463.27 508.38 -2833.07
Felony -11.30 -110.18 520.75
Personal -238.77a -330.13 -1409.21
Drug -221.08 59.98 187.98
Traffic 777.42* -342.02 -2502.89
Other Offense 6.48 -100.04 1730.96
Commitment -193.88 180.11 -183.64
Adjudicated Delinquent 350.99* 523.94 -11436.45***
Age -13.62 -82.56 719.43a
Male 271.20a 889.05** 1683.94
Constant 351.08 1505.72 -28.26
R2 0.129 0.105 0.138
Adjusted R2 0.073 0.041 0.054
n 166 152 113
*p<.05, **p<.01, ***p<.001 ap<.10
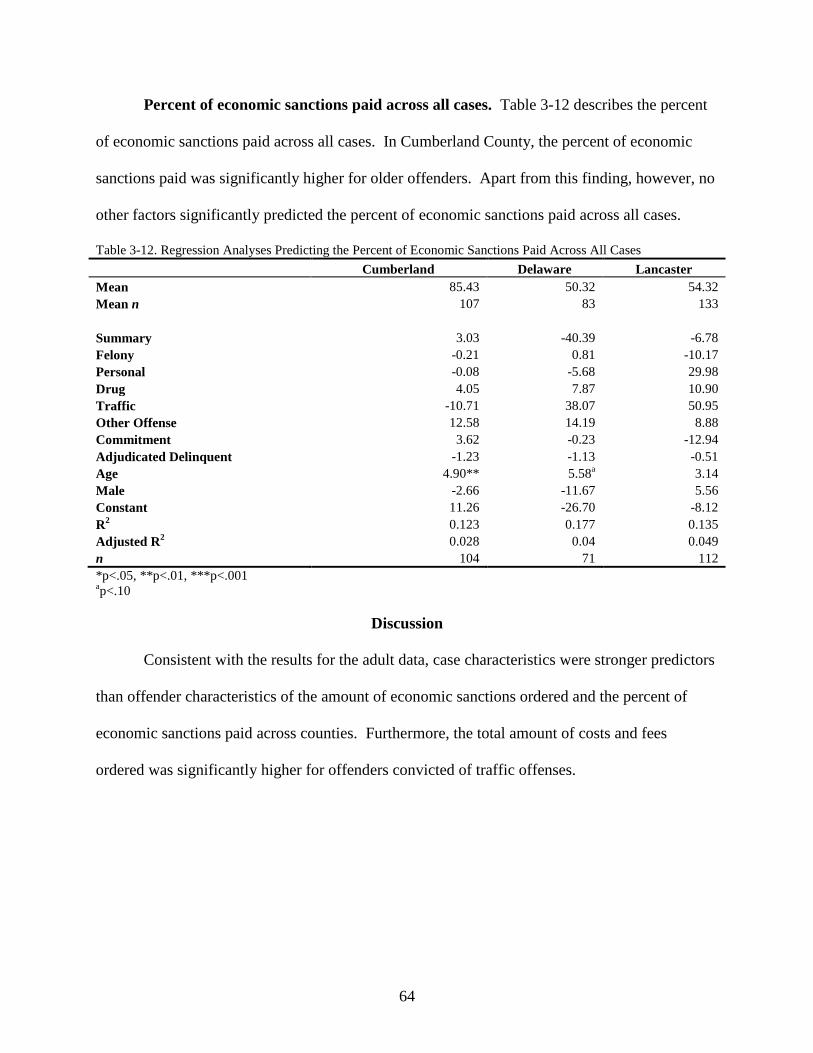
64
Percent of economic sanctions paid across all cases. Table 3-12 describes the percent
of economic sanctions paid across all cases. In Cumberland County, the percent of economic
sanctions paid was significantly higher for older offenders. Apart from this finding, however, no
other factors significantly predicted the percent of economic sanctions paid across all cases.
Table 3-12. Regression Analyses Predicting the Percent of Economic Sanctions Paid Across All Cases
Cumberland Delaware Lancaster
Mean 85.43 50.32 54.32
Mean n 107 83 133
Summary 3.03 -40.39 -6.78
Felony -0.21 0.81 -10.17
Personal -0.08 -5.68 29.98
Drug 4.05 7.87 10.90
Traffic -10.71 38.07 50.95
Other Offense 12.58 14.19 8.88
Commitment 3.62 -0.23 -12.94
Adjudicated Delinquent -1.23 -1.13 -0.51
Age 4.90** 5.58a 3.14
Male -2.66 -11.67 5.56
Constant 11.26 -26.70 -8.12
R2 0.123 0.177 0.135
Adjusted R2 0.028 0.04 0.049
n 104 71 112
*p<.05, **p<.01, ***p<.001 ap<.10
Discussion
Consistent with the results for the adult data, case characteristics were stronger predictors
than offender characteristics of the amount of economic sanctions ordered and the percent of
economic sanctions paid across counties. Furthermore, the total amount of costs and fees
ordered was significantly higher for offenders convicted of traffic offenses.

65
Chapter 4: DAVE Cases
PCCD was particularly interested in whether judges were ordering restitution to PCCD in
cases in which the victim had received compensation from the state. To answer this question, we
obtained a list of DAVE cases for four of the counties in which we coded data.
DAVE Cases
Table 4-1 describes the sample of DAVE cases in each county. The results show that
most offenders were male and white. The average age at sentencing ranged from 25.3 years in
Centre County to 29.8 years in Delaware County. The average amount of education offenders
received ranged from 11.9-13.3 years. Most offenders were convicted of misdemeanor offenses,
followed by felony offenses and summary offenses. In Centre, Cumberland, and Delaware
Counties, most offenders were convicted of personal offenses. In Westmoreland County, almost
equal percentages of offenders were convicted of property (43.5%) and personal (42.4%)
offenses.
Table 4-1. Description of the Sample
Centre Cumberland Delaware Westmoreland
% n % n % n % n
Gender
Male 100 8 92.2 59 88.4 107 75.3 64
Female 0 0 7.8 5 11.6 14 24.7 21
Total 8 64 121 85
Missing 0 0 1 0
Race
White 87.5 7 0 0 55.3 63 85.5 71
Nonwhite 12.5 1 0 0 44.7 51 14.5 12
Total 8 0 114 83
Missing 0 0 8 2
Education M = 13.3 M = 11.9 M = 11.9
Total 6 0 54 51
Missing 2 0 68 34
Offense Grading
Summary 12.5 1 12.7 8 0.9 1 3.6 3
Misdemeanor 37.5 3 49.2 31 47.2 51 60.7 51
Felony 50 4 38.1 24 51.9 56 35.7 30
Total 8 63 108 84

66
Missing 0 1 14 1
Type of Offense
Property 0 0 12.5 8 19.0 23 43.5 37
Personal 87.5 7 75.0 48 58.7 71 42.4 36
Drug 0 0 6.3 4 5.0 6 0 0
Traffic 0 0 3.1 2 14.0 17 14.1 12
Other 12.5 1 3.1 2 3.3 4 0 0
Total 8 64 121 85
Missing 0 0 1 0
Age at sentencing M = 25.3 M = 29.6 M = 29.8
Total 8 62 117
Missing 0 2 5
Results
The results presented in Table 4-2 describe the average amount of economic sanctions
ordered and the percent paid across counties.16
The average amount of fines imposed ranged
from $187 in Cumberland County to $495 in Westmoreland County. The average amount of
restitution imposed was lowest in Delaware County ($3,538) and highest in Cumberland County
($18,073). The percent of restitution paid was generally low, ranging from 8% in Westmoreland
County to 14% in Delaware County. The average amount of supervision fees imposed ranged
from $295 in Centre County to $746 in Westmoreland County. The average amount of costs and
fees ordered was substantially lower in Westmoreland County ($568) than in Centre ($2,064),
Cumberland ($1,253), and Delaware ($3,575) Counties.
Table 4-2. Average Amount of Economic Sanctions Ordered and the Percent Paid Across Counties
Centre Cumberland Delaware Westmoreland
Amount
Ordered
%
Paid
Amount
Ordered
%
Paid
Amount
Ordered
%
Paid
Amount
Ordered
%
Paid
Total Current
Case
Mean 6617.03 15.15 14745.62 25.14 3258.12 47.46 5228.13 16.34
Mean n 7 7 64 64 116 25 65 40
Fines Mean 233.33 0 186.86 22.22 273.75 75 495 33.33
Mean n 3 3 9 9 10 2 3 3
Restitution Mean 5968.16 12.28 18072.85 3537.5 14.12 5649.03 7.68
Mean n 5 5 53 70 47 53 28
16
Because there were so few DAVE cases, we conducted only simple descriptive analyses of the data. Multivariate
analyses are not appropriate for such small samples.

67
Supervision
Fees
Mean 295 8.33 512.94 43.91 598.28 75 746.43 10.36
Mean n 5 5 17 17 58 8 21 18
Total Costs
and Fees
Mean 2063.74 1253.39 3574.56 567.56
Mean n 7 63 117 41
State Costs
and Fees
Mean 285.76 301.05 261.51 350.91
Mean n 7 63 113 40
County Costs
and Fees
Mean 1639.45 859.01 3585.07 457.57
Mean n 7 63 117 41
Total Across
All Cases
Mean 16258.94 26.69 6234.1 50.5
Mean n 63 63 118 10
*p<.05, **p<.01, ***p<.001 ap<.10
Table 4-3 describes the imposition and payment of CVC and CCC across counties. In
Centre County, CVC and CCC were ordered in all cases. In Cumberland County, CVC (98%)
was ordered more often than CCC (67%). In Delaware County, CVC and CCC were ordered in
virtually all cases (97% for both). Similarly, in Westmoreland County, both CVC and CCC were
ordered in almost all cases (98% and 97%, respectively).
Table 4-3. Imposition and Payment of CVC and CCC Across Counties
Centre Cumberland Delaware Westmoreland
If
Ordered
Paid in
Full
If
Ordered
Paid in
Full
If
Ordered
Paid in
Full
If
Ordered
Paid in
Full
CVC Mean 100% 0% 98% 76% 97% 89% 98% 59%
Mean n 7 7 64 63 117 18 40 34
CCC Mean 100% 0% 67% 79% 97% 82% 97% 55%
Mean n 7 7 64 43 117 17 39 33
*p<.05, **p<.01, ***p<.001 ap<.10
Table 4-4 describes the imposition of CVC restitution across counties. When the CVC
provides compensation to the victim, the judge is supposed to order the offender to pay
restitution to the CVC. We examined four counties to determine whether in fact restitution was
ordered. At the low end, the percentage of cases in which judges acknowledged CVC restitution
was 3% in Delaware County. Next highest was Westmoreland County (19%). At the high end
were Centre County (50%) and Cumberland County (56%). The average amount of CVC

68
restitution ordered was lowest in Centre County ($741). Delaware County ($2,301),
Westmoreland County ($3,196), and Cumberland County ($5,428) all imposed higher amounts
of CVC restitution.
Table 4-4. Imposition and Payment of CVC Restitution Across Counties
Acknowledged Ordered Paid
Centre Mean 50% 740.67 0.00
Mean n 8 4 2
Cumberland Mean 56% 5427.72 203.31
Mean n 64 37 37
Delaware Mean 3% 2300.94 0.00
Mean n 122 3 2
Westmoreland Mean 19% 3195.63 20.67
Mean n 85 16 16
*p<.05, **p<.01, ***p<.001 ap<.10
Discussion
Our examination of DAVE cases suggests that some counties are more effective than
others in ordering restitution to CVC. One possible explanation for the relatively low rates of
imposing this restitution is that, on average, the offenders involved owe high amounts of costs
and fees, as well as restitution (see Table 4-2). However, because our analysis of DAVE cases
involved only four counties, caution must be exercised in making any generalizations.

69
Chapter 5: Victim Survey
Victims are typically the initiators of the criminal justice process, in that most police
investigations begin with victims‟ reports. However, victims are often left out of subsequent
decision making, in major part because, under the law, crimes are committed against the state,
not individual victims. Victims‟ omission from the process also reflects the criminal justice
system‟s concern with protecting the constitutional rights of the accused. Moreover, the efficient
operation of the criminal justice system relies on the interplay of a community of professional
actors, and the victim is merely a temporary and tangential player in this ongoing enterprise.
Reforms in the past 30 years have been aimed at recognizing victims‟ rights and
increasing their role in the system. In addition, there is a practical concern, in that victims‟
cooperation is often needed to prosecute an offender. And future victims, who are
disproportionately past victims (Outlaw, Ruback, & Britt, 2002), must report their victimizations
if the criminal justice system is to be successful in identifying, prosecuting, and monitoring
offenders. Despite these reforms, many victims still feel left out of the criminal justice process.
Victims‟ reactions to their experience with the criminal justice system probably relates to
what they should expect about their interactions with the criminal justice system regarding
process and outcome. With regard to process, they might expect to learn information about their
case, such as whether the offender was arrested, when the trial and sentencing are to occur, and
whether they are entitled to compensation or restitution. They might also expect to be treated
with respect and to have some input into decisions about the case, such as plea bargaining,
sentencing, and parole. With regard to outcome, they might expect the offender to be punished
and some sort of monetary compensation for their losses. This study examined victims‟
perceptions of the criminal justice system, focusing particularly on issues of process and
70
outcome, and tested whether these perceptions are related to victims‟ willingness to report future
victimizations.
Outcomes and Process
Another possible explanation for the consistent gender difference in reporting concerns
differences in the perception of justice. Scholars have differentiated two types of justice,
distributive justice and procedural justice. Distributive justice refers to the perceived fairness of
outcomes. As might be expected, individuals are upset when their outcomes are not fair, and
they are particularly upset when their outcomes (e.g., wages) are too low rather than too high.
Procedural justice refers to the perceived fairness of the process by which decisions are made.
Procedural justice includes how information is gathered, how the decision process is structured,
and how a decision can be appealed (Leventhal, 1980). Research suggests that individuals are
concerned with both distributive and procedural justice. That is, they care about both the
outcomes they receive and the process by which those outcomes were reached.
In the context of victims‟ interactions with the criminal justice system, we expected that
both distributive justice and procedural justice factors would affect victims‟ judgments, as, for
example, research indicates that victims are more satisfied when police responded quicker
(Percy, 1980; Poister & McDavid, 1978), and, consistent with the notion of procedural justice,
victims seem to be more satisfied when they feel that police officers have listened to them
(Shapland, 1983). First, we expected that victims would care about two specific outcomes: the
defendant‟s sentence (e.g., incarceration, fines) and whether or not the defendant was ordered to
pay restitution.
Second, we expected that victims would be concerned about procedures used to
determine the outcomes in their case. Consistent with what is known as fairness heuristic theory

71
(van den Bos, Lind, Vermunt, & Wilke, 1997), procedures should be especially important for
victims, for three reasons. First, according to this theory, procedures can reveal more than
outcomes about what an authority thinks about an individual, because they touch on fundamental
questions of trust, respect, and inclusion. Second, process typically comes before outcomes and
therefore is more likely to influence judgments about overall fairness. Third, procedural fairness
may be easier than distributive fairness to judge. For example, in many situations outcomes are
difficult to interpret because the outcomes of others are not known, and procedural information
thus becomes the standard by which overall fairness is determined. Crime victims‟ outcomes are
generally poor; that is, offenders are often not caught, or, if prosecuted, their charges are plea
bargained and sentences are less severe than what they would have been for the most serious
crimes. If victims do not know other victims‟ outcomes, they are likely to rely on their
judgments about procedural fairness (e.g., how they were treated) to affect their judgments about
outcome fairness. The most important way that individuals judge procedural fairness is whether
or not they have a voice about the outcome they would receive (Tyler, 1988; van den Bos, Wilke,
Lind, & Vermunt, 1998). Procedural fairness is important because it indicates to victims that
their complaint is being taken seriously, that they matter as individuals, and that they have
standing in the community (Lind & Tyler, 1988).
Third, based on research from organizations (Sweeney & McFarlin, 1997), we expected
women to be more concerned than men with procedural justice. This greater concern with
process has three bases: (a) because women are socialized to be concerned with and derive
satisfaction from relationships, (b) because women lack access to informal mechanisms (e.g.,
social networks) to resolve unfairness, and (c) because of past discrimination and sex-role
stereotyping women have to rely on more formal procedures to obtain fair outcomes. This
72
greater concern with procedural justice is coupled with research indicating that, compared to
men, women expect lower outcomes, such as lower wages (Major, 1994). In the context of the
criminal justice system, the hypothesis would be that female victims report more, not because
they expect to have better outcomes, but because they are more concerned with procedural
justice.
Purposes of Punishment
In addition to assessing victims‟ satisfaction with the outcomes of their case and with the
way they were treated, we were also concerned with how victims viewed the purposes of
punishment. The most complete investigation of victims‟ view of punishment was conducted
using 174 victims of violent crime (84 victims of rape, 90 victims of nonsexual assault; 84%
female) who had received financial support from a German victim assistance association within
the prior five years (Orth, 2003). Participants rated the importance of each of 18 statements
about punishment goals, two for each of nine a priori categories. A factor analysis of the 18
items revealed five factors: retaliation, recognition of victim status, confirmation of societal
values, concern with victim security, and concern with societal security. Orth suggested that the
first three are moral goals, in that they relate to sensitivity to befallen injustice, whereas the last
two are instrumental goals predicting increased punishment severity.
The same basic pattern was true for both rape victims and nonsexual assault victims.
Orth found that gender and crime type were generally unrelated to the punishment goals. The
primary strength of this study is that victims, as opposed to third parties, were asked to rate
different punishment goals in terms of a real criminal case versus a hypothetical scenario.
However, the study has two limitations: only victims of severe violent crime were included and

73
most of the victims (84%) were female. In addition, the fact that Orth‟s sample was German
raises questions about the generalizability of his results to the United States.
For two reasons, in this study we investigated how victims view the purposes of
punishment. First, we wanted to test whether Orth‟s findings would be replicated in the United
States. Second, we were interested in discovering how the purposes of punishment related to
measures of process and outcome fairness. We expected that victims who endorsed a goal of
punishment, regardless of what the particular goal was, would be more likely to say they wanted
a voice in the criminal justice process and that they would report future victimizations to the
police.
Method
We surveyed victims in two Pennsylvania counties in order to determine their
understanding of the sentencing process, their desire for having input to the criminal justice
process, and their satisfaction with outcomes and the Pennsylvania system for providing
restitution to crime victims.
Description of the Survey
The self-report survey, which is included in Appendix K, was divided into four sections.
The first section asked a series of questions about the victimization: the type of crime of which
they were a victim (e.g., burglary, theft, robbery, assault, or other), when and where the
victimization occurred, their relationship to the offender(s), and the gender, race, and age of the
offender(s). This section also included questions about the case disposition and the victim‟s
involvement in the criminal proceedings (i.e., whether the victim testified at trial).
The second section asked victims about their experiences with the restitution process:
how victims became aware they were eligible for restitution, whether they completed a form to

74
receive restitution, and who determined the amount of restitution owed to them. This section
also asked victims whether the judge imposed an order of restitution, the amount and distribution
of restitution imposed (i.e., the amount of restitution awarded for medical bills, lost wages, lost
or stolen property, repair to property, or other), and how much restitution they had received so
far. Furthermore, victims were asked to indicate on a four-point scale (“Very unfair,”
“Somewhat unfair,” “Somewhat fair,” “Very fair”) whether they felt the amount of restitution
imposed was fair and how well they understood the restitution process (on a seven-point scale
ranging from 1, “Not well at all” to 7 “Very well”).
The third section asked victims about their experiences with the criminal justice system,
including the amount and quality of their contact with the police, the prosecutor/district attorney,
the judge, the probation officer, and the victim-witness advocate. Also included in this section
were questions about how much input victims believed they had at various stages of the criminal
justice process. All of these items were rated on four-point scales (“Strongly disagree” to
“Strongly agree,” “Not important” to “Very important,” and “Very dissatisfied” to “Very
satisfied,” the specific response options depending on the particular question asked).
Respondents were also asked to rate on a seven-point scale their likelihood of reporting crimes in
the future. Additionally, there was a 22-item scale assessing victims‟ punishment goals (e.g.,
just deserts, revenge, recognition of victim status, deterrence of the offender, rehabilitation,
general deterrence, positive general prevention, victim security, and societal security). Victims
were asked to read a series of statements beginning, “It was important to me that the offender
should be punished…” and to indicate the importance of each statement for why the offender in
their case should be punished. Statements included such items as “to even out the wrong the
offender had done,” “to bring satisfaction to me, the victim,” “to stop the offender from further
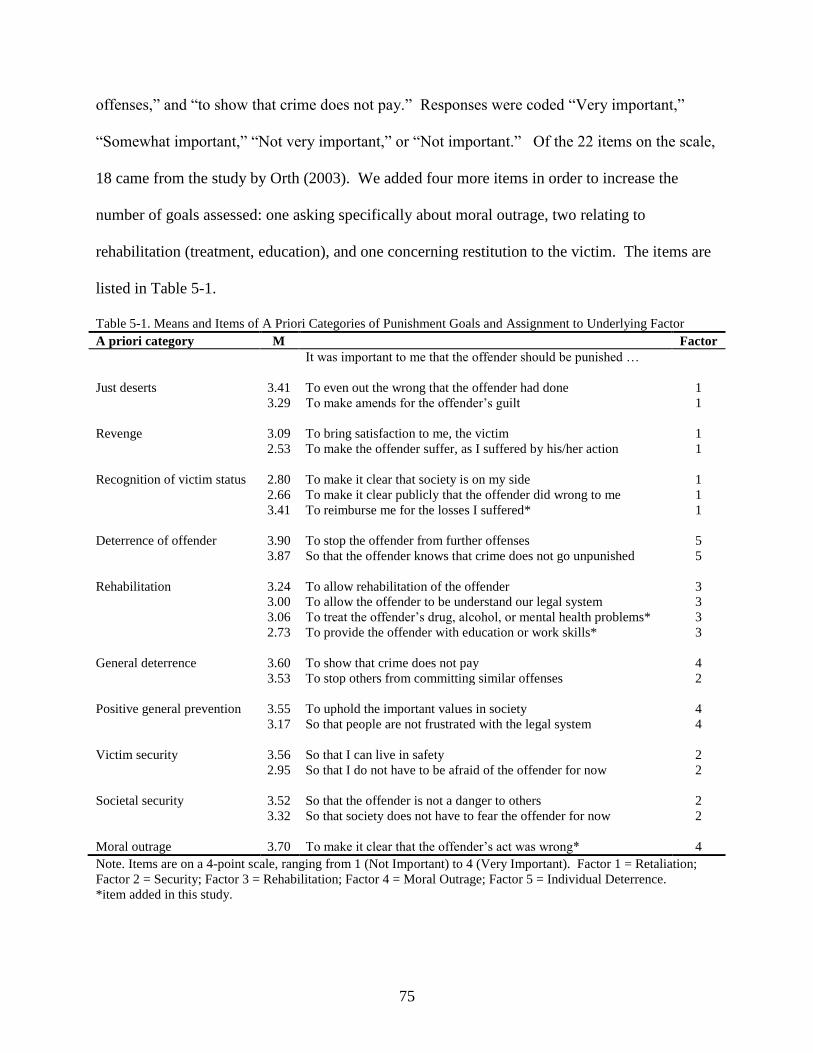
75
offenses,” and “to show that crime does not pay.” Responses were coded “Very important,”
“Somewhat important,” “Not very important,” or “Not important.” Of the 22 items on the scale,
18 came from the study by Orth (2003). We added four more items in order to increase the
number of goals assessed: one asking specifically about moral outrage, two relating to
rehabilitation (treatment, education), and one concerning restitution to the victim. The items are
listed in Table 5-1.
Table 5-1. Means and Items of A Priori Categories of Punishment Goals and Assignment to Underlying Factor
A priori category M Factor
It was important to me that the offender should be punished …
Just deserts 3.41 To even out the wrong that the offender had done 1
3.29 To make amends for the offender‟s guilt 1
Revenge 3.09 To bring satisfaction to me, the victim 1
2.53 To make the offender suffer, as I suffered by his/her action 1
Recognition of victim status 2.80 To make it clear that society is on my side 1
2.66 To make it clear publicly that the offender did wrong to me 1
3.41 To reimburse me for the losses I suffered* 1
Deterrence of offender 3.90 To stop the offender from further offenses 5
3.87 So that the offender knows that crime does not go unpunished 5
Rehabilitation 3.24 To allow rehabilitation of the offender 3
3.00 To allow the offender to be understand our legal system 3
3.06 To treat the offender‟s drug, alcohol, or mental health problems* 3
2.73 To provide the offender with education or work skills* 3
General deterrence 3.60 To show that crime does not pay 4
3.53 To stop others from committing similar offenses 2
Positive general prevention 3.55 To uphold the important values in society 4
3.17 So that people are not frustrated with the legal system 4
Victim security 3.56 So that I can live in safety 2
2.95 So that I do not have to be afraid of the offender for now 2
Societal security 3.52 So that the offender is not a danger to others 2
3.32 So that society does not have to fear the offender for now 2
Moral outrage 3.70 To make it clear that the offender‟s act was wrong* 4
Note. Items are on a 4-point scale, ranging from 1 (Not Important) to 4 (Very Important). Factor 1 = Retaliation;
Factor 2 = Security; Factor 3 = Rehabilitation; Factor 4 = Moral Outrage; Factor 5 = Individual Deterrence.
*item added in this study.

76
The fourth section asked about the victim‟s background. Included in this section were
questions about the victim‟s gender, race, age, marital status, education, and socioeconomic
status. In all, the survey included 49 questions. The survey was pretested on victims who, after
completing the survey, participated in structured cognitive interviews, in which they were asked
their thought process when they initially completed the items.
Sampling
We sampled victims from Cumberland and Lancaster Counties, which were chosen
because they had relatively complete data on adult cases and because they were willing to
participate and were very cooperative in the research we had worked with them on a previous
study examining the imposition and payment of economic sanctions in Pennsylvania. In both
counties, we worked with county victim witness services personnel to obtain a list of all victims
who received orders of restitution in 2002 and 2003. In Cumberland County, we excluded large
companies (e.g., Wal-Mart), victims who requested but did not receive an order of restitution,
and victims never recorded in the victim witness services agency files (i.e., victims who were not
listed in either the criminal complaint or the district attorney‟s files). This procedure yielded a
sample of 514 victims.17
In Lancaster County, we excluded duplicate victims, banks, insurance
companies, institutional victims, police, and out-of-state businesses. This procedure yielded a
sample of 523 victims.
After obtaining the two samples, we mailed victims packets containing a cover letter
from the victim witness services office, two consent forms, a survey, and a one-dollar incentive.
After we received the completed survey and a signed consent form, we paid the victims an
additional 10 dollars for their participation.
17
The victim-witness advocates in Cumberland County did not record which cases were from 2002 and which cases
were from 2003. As a result, we could not separate the 514 victims by year. However, there were 863 victims in
2002 and 806 victims in 2003.
77
Results
Participants
We received 143 completed surveys from Cumberland County and 95 completed surveys
from Lancaster County, for a final sample of 238 victims. After eliminating those surveys that
were returned as undeliverable, the response rates for Cumberland and Lancaster Counties were
31% and 20%, respectively. One factor that might explain the dramatic difference in response
rates between the two counties is that in Cumberland County letters to victims were individually
addressed and signed, whereas in Lancaster County the letter was not addressed to the individual
victim and the signature was photocopied. Overall, 1,037 surveys were sent out, of which 124
were returned as undeliverable. The response rates were 23% of those sent out (238/1037) and
26% of those actually delivered (238/913). Although low, these response rates are consistent
with other studies of victims (e.g., Orth, 2003) and with studies using a single contact, as we did
here, because we wanted to minimize the intrusiveness to victims. In addition, Pennsylvania
(and the Northeast in general) tends to have a lower response rate to surveys than the rest of the
country (Groves, Fowler, Couper, Lepkowski, Singer, & Tourangeau, 2004). Of 70 comparisons
between counties, only 2 were significant, a number below what would be expected by chance.
Thus, in subsequent analyses, we pooled responses across counties.
The sample was primarily white (94%), male (59%), married (67%), and fairly well
educated (91% high school graduates, 35% with at least a college degree). Of the 238
respondents, 24% were victims of burglary, 42% were victims of theft, 4% were victims of
robbery, 12% were victims of assault, and 30% were victims of other crimes, most of which
were vandalism (19%) or automobile accidents (7%). Most of the crimes (54%) occurred at the
respondent‟s home. An additional 16% occurred at work, and 8% occurred in the respondent‟s

78
neighborhood. Summary information about the sample is presented in Table 5-2. In the table, M
stands for the mean or average and “Mdn” stands for median, which is the number separating the
top half from the bottom half.
Table 5-2. Description of the Sample
Overall Cumberland County Lancaster County
(n = 238) (n = 143) (n = 95)
Gender (% male) 59% 62% 55%
Race (% white) 94% 93% 95%
Age 17-97 17-97 18-91
M = 47.6; Mdn = 47.0 M = 47.4; Mdn = 47.0 M = 47.4; Mdn = 47.0
Marital Status (% married) 67% 63% 73%
Education
High School graduate 24% 31% 15%
Some post-secondary 32% 30% 35%
At least a B.A. 35% 34% 36%
Current Work Situation 65% full-time 67% full-time 64% full-time
14% retired 15% retired 14% retired
Household Income
Less than $20,000 16% 17% 14%
$20,001 - $40,000 24% 27% 18%
$40,001 - $60,000 17% 20% 13%
$60,001 - $80,000 15% 14% 17%
More than $80,000 28% 21% 38%
Time in Current Home 1 month - 47.7 yrs 2 months - 46.0 yrs 1 month - 47.7 yrs.
M = 12.8; Mdn = 10.0 M = 12.5; Mdn = 7.8 M = 13.3; Mdn = 11.1
Living With
Spouse only 37% 37% 38%
Spouse & children 33% 28% 39%
Restitution Ordered (%)
Yes 62% 64% 59%
Don‟t Know 28% 27% 30%
Received CVC funds (%) 6% 6% 5%
Slightly more than half of the crimes involved one offender (54%). Twenty-three percent
involved two offenders, 14% involved three offenders, and about 4% involved four or more
offenders (the remainder were missing this information). The offender was known to the victim

79
in 37% of the cases. Almost all of the offenders (88%) were male, with an estimated median age
of 22 (M = 27.2). Most of the cases (69%) were resolved by guilty plea, although 25% went to
trial. About 60% of the samples in the two counties said the offender in their case was ordered to
pay restitution, although more than a quarter said they did not know whether restitution had been
ordered.
Variables Relevant to the Victim-Witness Assistance Program
In terms of notification about the trial, 43% were notified by the District Attorney‟s
Office and 17% were notified by the Victim-Witness Services Office. About 3% said they called
to find out, and 13% said they were not notified. Of the sample, 16% said they testified at trial.
The defendant was convicted in 84% of the cases, not convicted in 2% of the cases, and the
respondent did not know the outcome in 11% of the cases (3% missing). Property was taken in
63% of the cases (n = 149), was fully returned in 5% of the cases (8% of those in which property
was taken; n = 12), and was partially returned or returned damaged in 16% of the cases (26% of
those in which property was taken; n = 38).
In terms of notification, respondents said they learned they were eligible for restitution
primarily from the victim-witness advocate (45%) and the police (23%). Of the respondents,
70% (n = 167) said they were asked to fill out a form in order to request restitution, and 59% of
the entire group (84% of whose who had been asked; n = 141) said they did complete it. Of the
respondents, 46% (n = 109) said no one helped them complete the form.
In general, these percentages suggest that victims received only some support from
officials in the criminal justice system. However, we need to be a little skeptical of such self-
reports. For example, Erez and Tontodonato (1990) found that 20% of victims who reported that
they had not completed a victim impact statement had actually done so, as evidenced by the
80
statement in prosecutors‟ files. Davis and Smith (1994) found that only about half of individuals
who had been interviewed about how the crime had affected them remembered being
interviewed when asked after their case had been disposed of.
Restitution was ordered in 61% of the cases (n = 144), most for stolen property (n = 65)
or for repair to property (n = 53). Restitution ranged from $0 to $61,800 (M = $7342; Mdn =
$500). Restitution was paid completely in 53 cases (22%), partly in 62 cases (26%), and not at
all in 106 cases (45%) (7% missing).
Purposes of Punishment
A factor analysis, using a Varimax rotation, of the 22 items regarding punishment goals
resulted in five factors, all of which had eigenvalues greater than one. The rotated factors
accounted for 63% of the variance. We assigned each of the 22 items to the factor on which it
loaded highest and then averaged the scores across the items for each of the five scales. Factor 1,
Retaliation, consisted of 7 items ( = .85). Factor 2, Security, consisted of 5 items ( = .84).
Factor 3, Rehabilitation, consisted of 4 items ( = .83). Factor 4, Moral Outrage, consisted of 4
items ( = .73). Factor 5, Individual Deterrence, consisted of 2 items ( = .62). Item means
and assignment to the factors are presented in Table 1.
A 2 Between (Gender) x 5 Within (Punishment Goals) repeated measures analysis of
variance revealed significant effects for gender, F(1, 223) = 4.03, p < .05, and punishment goals,
F(4, 892) = 91.04, p < .001. Overall, males endorsed the five goals (M = 3.43) significantly
more than did females (M = 3.30). In terms of differences among the goals, Moral Outrage (M =
3.87) was endorsed significantly more than Individual Deterrence (M = 3.51), and Individual
Deterrence was endorsed significantly more than Security (M = 3.38), according to a post-hoc
Newman-Keuls test (p < .05). All three of those goals were endorsed significantly more than
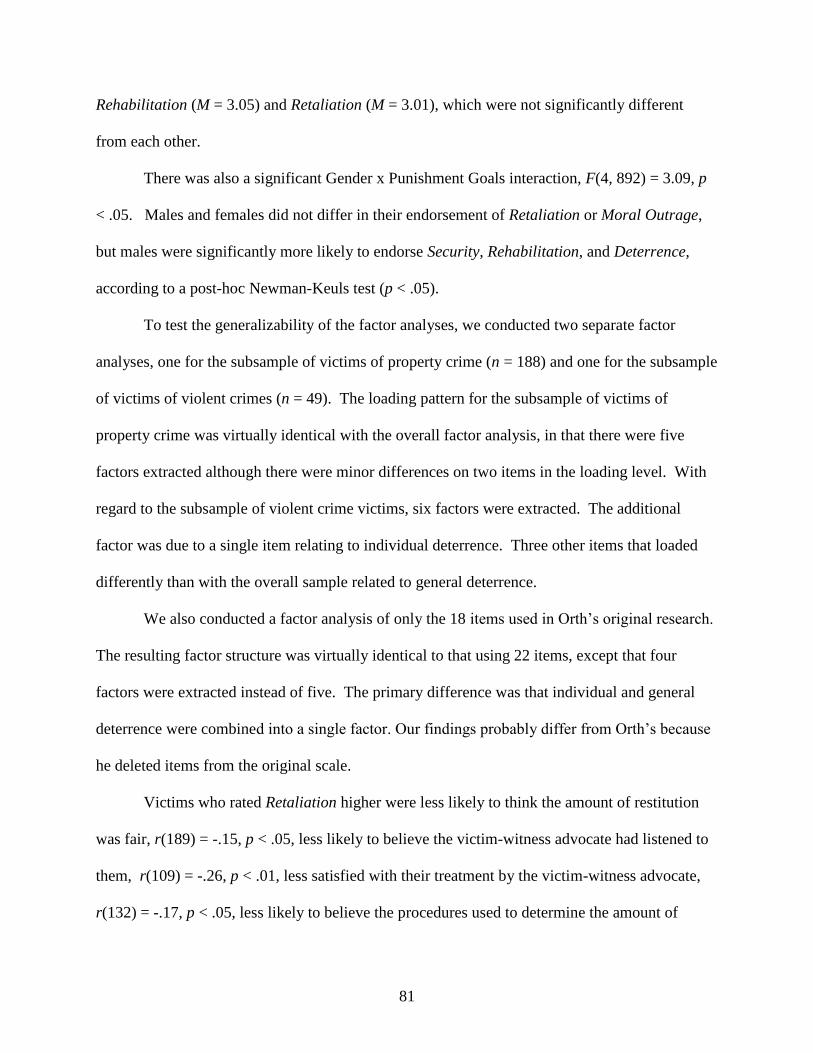
81
Rehabilitation (M = 3.05) and Retaliation (M = 3.01), which were not significantly different
from each other.
There was also a significant Gender x Punishment Goals interaction, F(4, 892) = 3.09, p
< .05. Males and females did not differ in their endorsement of Retaliation or Moral Outrage,
but males were significantly more likely to endorse Security, Rehabilitation, and Deterrence,
according to a post-hoc Newman-Keuls test (p < .05).
To test the generalizability of the factor analyses, we conducted two separate factor
analyses, one for the subsample of victims of property crime (n = 188) and one for the subsample
of victims of violent crimes (n = 49). The loading pattern for the subsample of victims of
property crime was virtually identical with the overall factor analysis, in that there were five
factors extracted although there were minor differences on two items in the loading level. With
regard to the subsample of violent crime victims, six factors were extracted. The additional
factor was due to a single item relating to individual deterrence. Three other items that loaded
differently than with the overall sample related to general deterrence.
We also conducted a factor analysis of only the 18 items used in Orth‟s original research.
The resulting factor structure was virtually identical to that using 22 items, except that four
factors were extracted instead of five. The primary difference was that individual and general
deterrence were combined into a single factor. Our findings probably differ from Orth‟s because
he deleted items from the original scale.
Victims who rated Retaliation higher were less likely to think the amount of restitution
was fair, r(189) = -.15, p < .05, less likely to believe the victim-witness advocate had listened to
them, r(109) = -.26, p < .01, less satisfied with their treatment by the victim-witness advocate,
r(132) = -.17, p < .05, less likely to believe the procedures used to determine the amount of

82
restitution were fair, r(207) = -.17, p < .01, and less likely to believe the sentence imposed on the
offender was fair, r(203) = -.21, p < .001. Victims who rated Security higher were more likely to
believe the police had listened to them, r(174) = .16, p < .05. Victims who rated Rehabilitation
higher were more likely to be satisfied with their treatment by the Crime Victims Compensation
Board, r(25) = .45, p < .001, more likely to be satisfied with their treatment by the police, r(217)
= .16, p < .05, and more likely to believe the sentence imposed on the offender was fair, r(202) =
.17, p < .05. Victims who rated Moral Outrage higher were less likely to believe the sentence
imposed on the offender was fair, r(205) = -.19, p < .01. Victims‟ ratings of Deterrence were
unrelated to any of the measures or distributive and procedural justice. No other correlations
were significant.
Individuals with lower household incomes were significantly more likely to say they
favored punishment for purposes of Retaliation, r(214) = - .19, p < .01, Security, r(217) = -.16, p
< .05, and Rehabilitation, r(213) = -.21, p < .01. Individuals with more education were
significantly less likely to say they favored punishment for purposes of Retaliation, r(219) = -
.21, p < .01, Security, r(220) = -.19, p < .01, and Deterrence, r(220) = -.17, p < .05. Age was
related only to Rehabilitation, r(215) = .16, p < .05, such that older individuals were more likely
to favor punishment for purposes of rehabilitation.
The 189 property crime victims were significantly more likely to endorse Deterrence as a
punishment goal (M = 3.55) than were the 49 personal crime victims (M = 3.35), t(229) = 2.14, p
< .05. Type of crime did not affect the other four goals of punishment.
Process and Outcome
To compare process and outcome, we conducted paired t-tests of satisfaction with
treatment and satisfaction with outcome for police, the victim-witness advocate, the prosecutor,

83
the judge, and the probation officer.
Across all stages of the criminal justice system, victims were more satisfied with process
than with outcomes: (a) police: M‟s = 3.47 vs. 3.37, t(217) = 2.94, p < .01; (b) prosecutor: M‟s =
3.22 vs. 3.05, t(147) = 4.23, p < .001; (c) judge: M‟s = 3.19 vs. 2.97, t(78) = 3.66, p < .001; (d)
probation officer: M‟s = 2.61 vs. 2.31, t(46) = 2.66, p < .05; (e) victim-witness advocate: M‟s =
3.12 vs. 3.05, t(133) = 1.78, p < .08. Similarly, victims were somewhat more satisfied with the
procedure for restitution (M = 3.03) than with the amount of restitution the offender was ordered
to pay (M = 2.94, t(187) = 1.72, p < .09). Although process and outcome were generally rated
significantly different for these six pairs of variables, the two were highly correlated, r‟s ranging
from .78 to .91, all p‟s < .001.
Process. In general, individuals reported contacting the victim-witness advocate
significantly more often (M = 1.60) about restitution payments than they were contacted by the
victim-witness advocate (M = 1.32), t(139) = 3.26, p < .001. Similarly, individuals reported that
they were more likely to have to contact the court themselves about the status of the restitution
order (M = 3.18) than they were to be contacted by the court (M = 1.59), t(136) = 10.14, p <
.001. Contacting the court and being contacted by the court were negatively related, r(136) = -
.66, p < .001, suggesting that if victims were contacted by the court, victims would not contact
the court. However, contacting the victim-witness advocate and being contacted by the victim-
witness advocate were unrelated, r(139) = -.04, n.s., suggesting that victims‟ actions regarding
the victim-witness advocate‟s office were unrelated to what the victim-witness advocate did.
Age was positively related to judgments about the fairness of restitution procedures,
r(211) = .18, p < .01, judgments that the police listened to the victim, r(175) = .23, p < .01,
satisfaction with treatment by the police, r(221) = .14, p < .05, satisfaction with the outcome of

84
the interaction with the police, r(216) = .13, p < .05, and judgments that the prosecutor listened
to the victim, r(49) = .35, p < .05. Household income was negatively related to the number of
times the victim contacted the victim-witness office, r(140) = -.18, p < .05.
Because most respondents had had only limited or no contact with most criminal justice
officials, we could not use satisfaction with actual contact as a measure of procedural fairness.
Instead, we used a composite scale consisting of the average of five items assessing victims‟
desired input with the police, prosecutor, judge, probation office, and victim-witness services
advocate. These five items were averaged to form a composite scale ( = .78). Females (M =
3.71) wanted significantly more input into the criminal justice system than did males (M = 3.48),
t(227) = 3.33, p < .001. Desired input into the criminal justice system was positively related to
all five punishment goals: Retaliation, r(225) = .20, p < .01; Security, r(226) = .25, p < .001;
Rehabilitation, r(226) = .21, p < .001; Deterrence, r(227) = .26, p < .001; and Moral Outrage,
r(227) = .13, p < .05. That is, the more victims endorsed the goal, the more they wanted to have
input with agents of the criminal justice system.
A multiple regression analysis indicated that desired input into the criminal justice system
was significantly predicted only by gender (female), F(8, 206) = 3.61, p < .001 (Adjusted R2 =
.089). Household income, age, education, whether the offense was a property crime, and the five
goals of punishment were all nonsignificant predictors.
Outcome. Retaliation was negatively related to judgments about whether the amount of
restitution was fair, r(189) = -.15, p < .05, about the fairness of the procedures used to determine
restitution, r(207) = -.17, p < .05, about satisfaction with treatment by the victim-witness
advocate, r(132) = -.17, p < .05, about satisfaction with the outcome of interaction with the
victim-witness advocate, r(137) = -.19, p < .05, and about the fairness of the sentence imposed,

85
r(203) = -.21, p < .01. Security was positively related to judgments about the extent to which the
police listened to the victim, r(174) = .16, p < .05. Rehabilitation was positively related to
judgments about the extent to which the police listened to the victim, r(172) = .20, p < .01,
judgments about the extent to which the prosecutor listened to the victim, r(48) = .31, p < .05,
satisfaction with treatment by the police, r(217) = .16, p < .05, and satisfaction with the outcome
of the interaction with the police, r(212) = .21, p < .01.
A multiple regression analysis indicated that perceived fairness of the sentence imposed
on the defendant was significantly predicted by whether the offense was a property crime, if the
victim endorsed Retaliation, Security, and Moral Outrage less as punishment goals, and if the
victim endorsed Rehabilitation more as a punishment goal, F(8, 185) = 4.91, p < .001 (Adjusted
R2 = .140). Gender, household income, age, education, and Security as a goal of punishment
were all nonsignificant predictors.
Willingness to Report Crimes in the Future
One of the important dependent variables was whether respondents would be willing to
report crimes in the future. This item was positively related to the degree to which respondents
said they understood the restitution process ( r(227) = .25, p < .01), to how satisfied they were
with the amount of contact they had had with the victim-witness advocate ( r(134) = .33, p <
.001), and to how fair they perceived the procedures used to determine the amount of restitution
in their case ( r(208) = .18, p < .01). The more input victims said they desired, the less likely
they were to say they would report crimes in the future, ( r(225) = .25, p < .001).
Willingness to report crimes in the future was positively related to four of the five
punishment goals: Retaliation, r(228) = .15, p < .05; Security, r(229) = .13, p < .06;
Rehabilitation, r(228) = .18, p < .01; and Deterrence, r(229) = .21. The more victims endorsed

86
the goal, the more they said they were willing to report crimes in the future. Endorsement of
Moral Outrage was unrelated to willingness to report crimes in the future. Individuals with
higher household incomes were somewhat more likely to say they would report crimes in the
future, r(226) = .14, p < .05. Age and education were unrelated to stated willingness to report
crimes in the future.
To determine whether satisfaction with outcome and process affect victims‟ willingness
to report future victimizations, we conducted a series of regression analyses. We began with
gender, income, and type of crime, as males reported having significantly higher incomes (M =
3.47) than did females (M = 2.68), t(227) = 4.17, p < .001. A chi-square analysis revealed that
males were more likely than females to be property crime victims (85% vs. 70%, X2 (1, 232) =
6.56, p < .01 (Yates‟ correction).
As shown in Table 5-3, females and individuals with higher incomes were more likely to
say that they would be willing to report crimes in the future. The type of crime did not affect this
judgment. The only punishment factor that was significantly related to willingness to report after
controlling for gender, income, and type of crime was Retaliation. Victims who endorsed
Retaliation as a goal of punishment were more likely to say they would report future
victimizations. In the second model, a measure of outcome fairness, the perceived fairness of the
defendant‟s sentence, was added to the equation and was a significant predictor. In the third
model, when the composite measure of procedural fairness (Desired Input) was added to the
equation, gender was no longer significant, suggesting that the effect of gender was mediated by
procedural fairness.
Table 5-3. Regression Analysis of Willingness to Report Crimes in the Future
Model 1 Model 2 Model 3
Gender (1 = female) .144* .142* .094
Income .152* .218** .191*
Type of crime (1 = property) .019 -.021 -.019
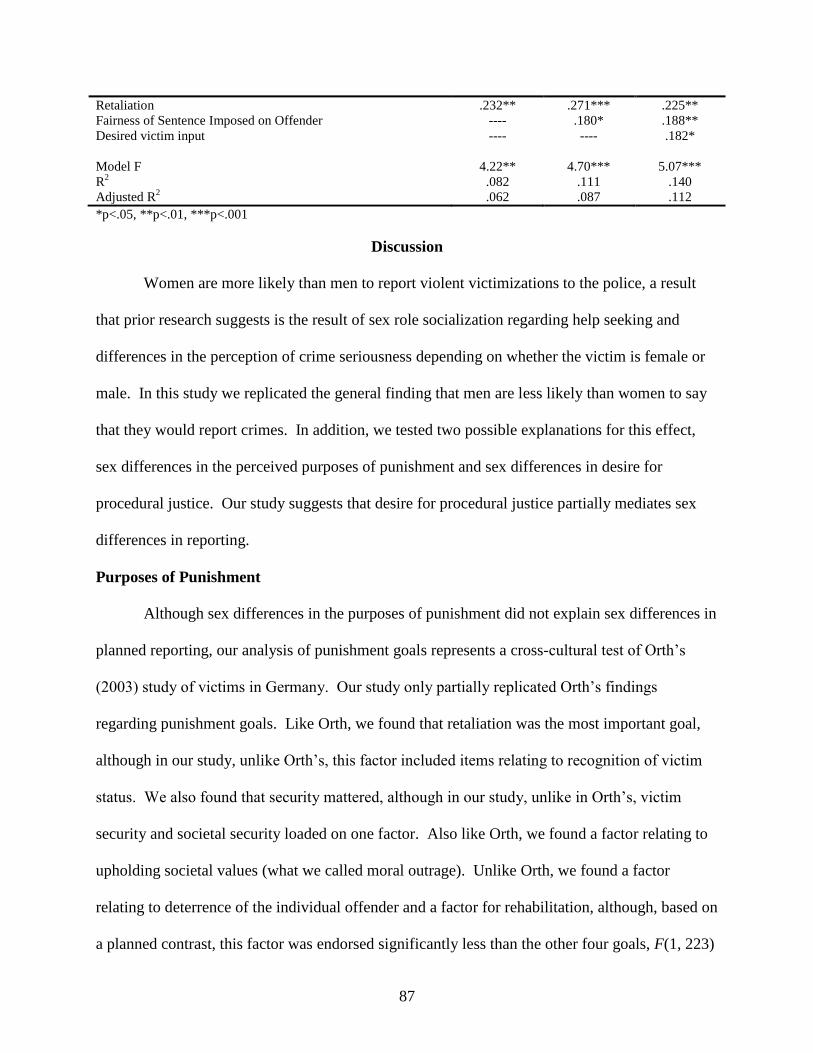
87
Retaliation .232** .271*** .225**
Fairness of Sentence Imposed on Offender ---- .180* .188**
Desired victim input ---- ---- .182*
Model F 4.22** 4.70*** 5.07***
R2 .082 .111 .140
Adjusted R2 .062 .087 .112
*p<.05, **p<.01, ***p<.001
Discussion
Women are more likely than men to report violent victimizations to the police, a result
that prior research suggests is the result of sex role socialization regarding help seeking and
differences in the perception of crime seriousness depending on whether the victim is female or
male. In this study we replicated the general finding that men are less likely than women to say
that they would report crimes. In addition, we tested two possible explanations for this effect,
sex differences in the perceived purposes of punishment and sex differences in desire for
procedural justice. Our study suggests that desire for procedural justice partially mediates sex
differences in reporting.
Purposes of Punishment
Although sex differences in the purposes of punishment did not explain sex differences in
planned reporting, our analysis of punishment goals represents a cross-cultural test of Orth‟s
(2003) study of victims in Germany. Our study only partially replicated Orth‟s findings
regarding punishment goals. Like Orth, we found that retaliation was the most important goal,
although in our study, unlike Orth‟s, this factor included items relating to recognition of victim
status. We also found that security mattered, although in our study, unlike in Orth‟s, victim
security and societal security loaded on one factor. Also like Orth, we found a factor relating to
upholding societal values (what we called moral outrage). Unlike Orth, we found a factor
relating to deterrence of the individual offender and a factor for rehabilitation, although, based on
a planned contrast, this factor was endorsed significantly less than the other four goals, F(1, 223)
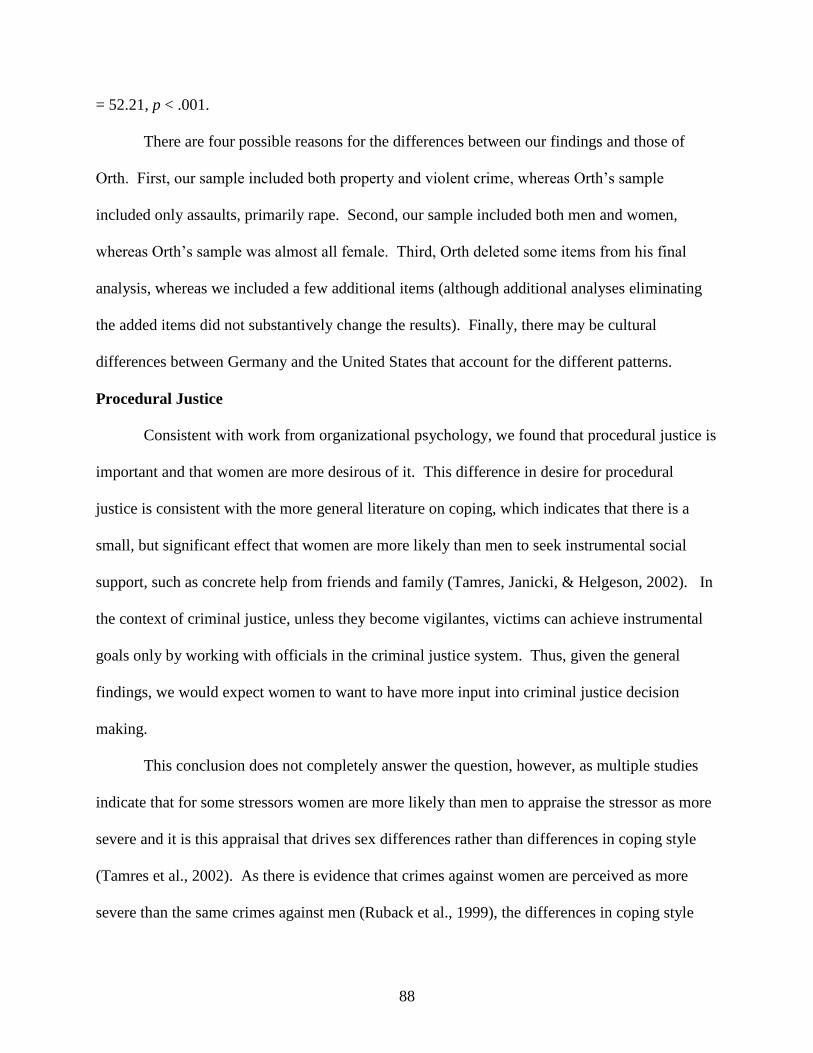
88
= 52.21, p < .001.
There are four possible reasons for the differences between our findings and those of
Orth. First, our sample included both property and violent crime, whereas Orth‟s sample
included only assaults, primarily rape. Second, our sample included both men and women,
whereas Orth‟s sample was almost all female. Third, Orth deleted some items from his final
analysis, whereas we included a few additional items (although additional analyses eliminating
the added items did not substantively change the results). Finally, there may be cultural
differences between Germany and the United States that account for the different patterns.
Procedural Justice
Consistent with work from organizational psychology, we found that procedural justice is
important and that women are more desirous of it. This difference in desire for procedural
justice is consistent with the more general literature on coping, which indicates that there is a
small, but significant effect that women are more likely than men to seek instrumental social
support, such as concrete help from friends and family (Tamres, Janicki, & Helgeson, 2002). In
the context of criminal justice, unless they become vigilantes, victims can achieve instrumental
goals only by working with officials in the criminal justice system. Thus, given the general
findings, we would expect women to want to have more input into criminal justice decision
making.
This conclusion does not completely answer the question, however, as multiple studies
indicate that for some stressors women are more likely than men to appraise the stressor as more
severe and it is this appraisal that drives sex differences rather than differences in coping style
(Tamres et al., 2002). As there is evidence that crimes against women are perceived as more
severe than the same crimes against men (Ruback et al., 1999), the differences in coping style

89
may be due in part to differences in appraisal. Moreover, it may be that rather than seeking
instrumental goals, women seek to talk with criminal justice officials for emotional social
support, a consistent finding in the literature (Tamres et al., 2002).
Policy Implications
Men and women did not differ in how important they believed Retaliation and Moral
Outrage were as goals of punishment, but men were significantly more likely to favor
punishment for Security, Rehabilitation, and Deterrence. Women were significantly more likely
than men to want to give input to decision makers and to say they would report crimes in the
future. This pattern suggests, as Sweeney and McFarlin, (1997) found with federal employees,
that men are more concerned with outcome justice whereas women are more concerned with
procedural justice. Although it would be important to replicate these findings, the pattern does
suggest that officials in the criminal justice system should be attentive to gender as a possible
explanation for any differences they observe regarding participation in the criminal justice
system (e.g., giving a victim impact statement at sentencing).
More generally, our findings here that victims perceive process and outcome differently
is consistent with a large literature indicating that both distributive and procedural justice are
important. Because victims‟ objective outcomes are likely to be low (e.g., offenders are often
not caught), the reforms enacted over recent decades are important if, as implemented, they
convince victims that the criminal justice system cares about procedural fairness.

90
Chapter 6: Offender Survey
Economic sanctions – fines, fees, costs, and restitution – have been criticized because
they are perceived to be unfair to poor defendants, to have no effect on wealthy defendants, and
to be unenforceable because offenders cannot be imprisoned for nonpayment of debt (Ruback &
Bergstrom, 2006). Nevertheless, for three reasons they are likely to be used more frequently in
the future. First, because the costs of criminal justice operations are so high, offenders are now
expected to pay at least part of those costs. Second, concern for victims has increased, so that
restitution is likely to be awarded more frequently (Office for Victims of Crime, 1998). Third,
although the number of prisoners has increased six-fold in the past 25 years, imprisonment is
now less likely than it was 10 years ago (Levin, Langan, & Brown, 2000). As a result, there are
increasing pressures for intermediate sanctions, both because of the high cost of incarceration
and because of questions regarding whether incarceration is effective in deterring future crime.
Despite these three pressures for increasing the number and amount of economic
sanctions imposed on offenders, the reality is that large proportions of these sanctions are not
paid. Collection rates for restitution are around 50% (Cohen, 1995). At the federal level, there is
more than $35 billion in unpaid fines (Mendoza & Sullivan, 2006). The usual assumption is that
nonpayment is the result of not having sufficient income or assets to pay the sanctions. Aside
from inability to pay, however, there are three alternative explanations relating to a lack of
motivation to pay: lack of understanding of the sanctions, disagreement with the rationale for the
sanctions, and belief that the sanctions are unfairly applied. To explore these four rationales, we
surveyed sentenced offenders in Blair and Westmoreland Counties.

91
The Use of Economic Sanctions
Nationally, fines are imposed in 25% of all felony convictions: 20% of all violent offense
convictions, 24% of all property offense convictions, and 27% of all drug offense convictions
(Durose & Langan, 2003). Restitution is imposed in 14% of all felony convictions: 13% of all
violent offense convictions, 26% of all property offense convictions, and 6% of all drug offense
convictions.
Offenders generally perceive economic sanctions to be severe, even if they think they can
pay them. McClelland and Alpert (1985) and Apospori and Alpert (1993) found that recent
arrestees believed that a $5,000 fine was about as severe as spending a year in jail, a $1,000 fine
was about half as severe, and a $500 fine was about one-quarter as severe. Similarly, Spelman
(1995) found that 128 offenders in Texas believed a $1,000 fine was about as severe as one year
of regular probation, and a $5,000 fine was about as severe as two years of regular probation.
Almost half (46%) of the sample believed a $5,000 fine was more severe than three months in
county jail, primarily because they had few legitimate sources of income. Spelman also found
that the perceived difficulty of paying economic sanctions depended on the type of offender and
the amount of the sanction, such that property offenders viewed large fines as very severe,
whereas drug and violent offenders did not.
Despite believing that economic sanctions are severe, offenders seem to believe that they
can pay the ordered amounts. Petersilia and Deschenes (1994) found that their sample of
Minnesota inmates believed that the chance of paying a $100 fine would be close to 80%, and
the chance of paying victim restitution or paying a $500 fine would be close to 70%.
Interestingly, for all three of these conditions correctional staff said the chances of completing
the condition was significantly lower (less than 50% for the last two conditions). For the

92
condition of paying a $20/week supervision fee, both inmates and correctional staff rated the
chances of completing this condition as being around 50%.
Nonpayment of Economic Sanctions
Even though many offenders believe they can pay their ordered economic sanctions, in
fact, only about half of economic sanctions are paid. Lack of resources is probably the most
important reason. For example, a survey of federal probationers found that about a third reported
that the sanction resulted in a significant hardship, and slightly more than a tenth said the
sanction resulted in a severe deprivation, although slightly more than half said that the economic
sanction did not present any specific hardship (Allen & Treger, 1994).
Aside from inability to pay, there are three possible explanations relating to a lack of
motivation to pay. That is, offenders may not want to pay the ordered amounts because they do
not understand the purpose of the sanctions, they disagree with the reasons given for paying the
sanctions, they believe the amounts ordered and the procedures used to determine those amounts
are unfair, or they do not believe there is any punishment for failing to pay the sanctions.
Lack of understanding. Supreme Court decisions since Miranda have indicated that
before offenders can be convicted of a crime, they must understand the nature of the proceedings
against them so that they can contribute to their defense. After being convicted, however,
offenders have fewer rights and understanding is less important. The notion is that offenders
will pay only if they understand what they are paying for. Moreover, understanding that their
payments go to victims has implications for rehabilitation, in that restitution is likely to be
effective only if offenders understand that they are taking responsibility and making reparations
for their wrongdoing (Outlaw & Ruback, 1999).
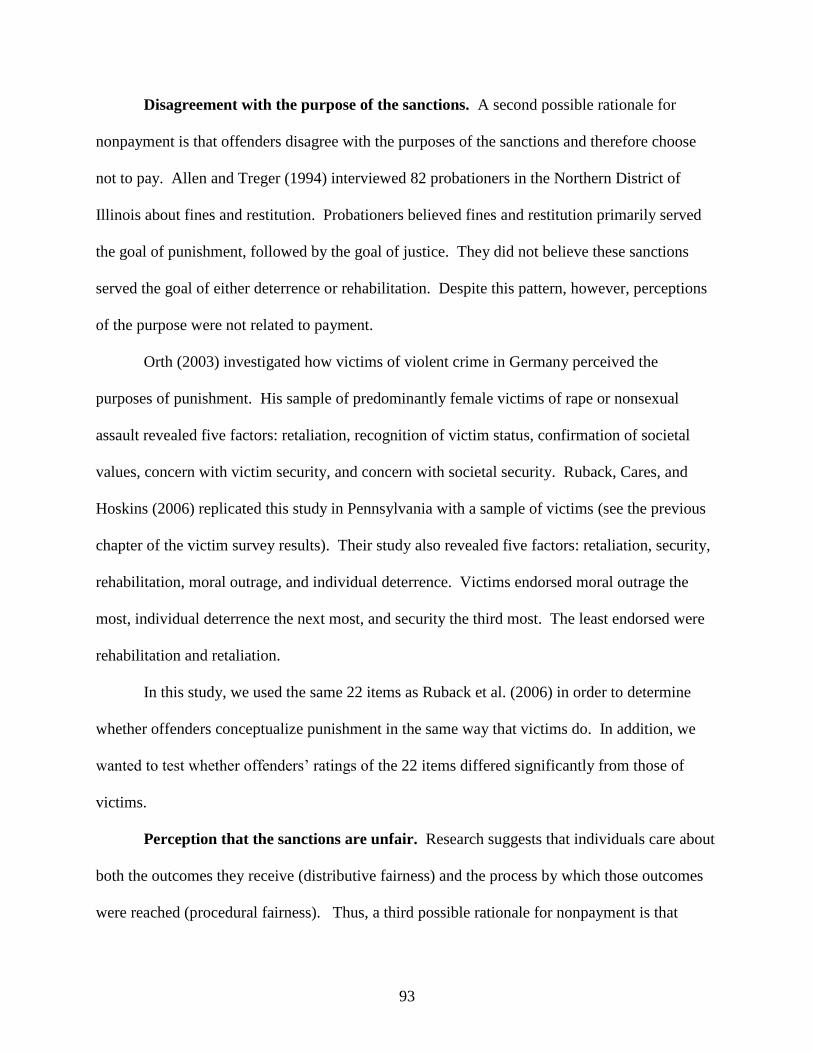
93
Disagreement with the purpose of the sanctions. A second possible rationale for
nonpayment is that offenders disagree with the purposes of the sanctions and therefore choose
not to pay. Allen and Treger (1994) interviewed 82 probationers in the Northern District of
Illinois about fines and restitution. Probationers believed fines and restitution primarily served
the goal of punishment, followed by the goal of justice. They did not believe these sanctions
served the goal of either deterrence or rehabilitation. Despite this pattern, however, perceptions
of the purpose were not related to payment.
Orth (2003) investigated how victims of violent crime in Germany perceived the
purposes of punishment. His sample of predominantly female victims of rape or nonsexual
assault revealed five factors: retaliation, recognition of victim status, confirmation of societal
values, concern with victim security, and concern with societal security. Ruback, Cares, and
Hoskins (2006) replicated this study in Pennsylvania with a sample of victims (see the previous
chapter of the victim survey results). Their study also revealed five factors: retaliation, security,
rehabilitation, moral outrage, and individual deterrence. Victims endorsed moral outrage the
most, individual deterrence the next most, and security the third most. The least endorsed were
rehabilitation and retaliation.
In this study, we used the same 22 items as Ruback et al. (2006) in order to determine
whether offenders conceptualize punishment in the same way that victims do. In addition, we
wanted to test whether offenders‟ ratings of the 22 items differed significantly from those of
victims.
Perception that the sanctions are unfair. Research suggests that individuals care about
both the outcomes they receive (distributive fairness) and the process by which those outcomes
were reached (procedural fairness). Thus, a third possible rationale for nonpayment is that
94
offenders believe that economic sanctions are unfair because the amounts are too high or the
procedures used to determine the amounts are unfair. There is some research to support this
notion. For example, probation officers typically have some flexibility in terms of payment
schedules for fines and restitution, and thus offenders may be treated inequitably (Alexander,
Montgomery, Hamilton, Dutton, Griswold, Russell, Salo, & Muse, 1998).
Our survey of victims in Pennsylvania indicated that victims were generally more
satisfied with procedural than outcome fairness in terms of their treatment by agents in the
criminal justice system, particularly with regard to restitution (Ruback et al., 2006). Results
indicated that victims‟ perceptions of both procedural and outcome fairness affected their
willingness to report crimes in the future. As with victims, we expected offenders‟ perceptions
of both distributive and procedural fairness to be related to their behavior, specifically their
payments toward their economic sanctions.
Individual Differences in Nonpayment
Individuals who have greater ties to the community (e.g., a job, a marriage) are more
likely to complete probation successfully (Landis, Merger, & Wolff, 1969; Petersilia, 1985; Sims
& Jones, 1997). Consistent with this general finding about probation success, there is research
suggesting that ties to the community also increase payment of economic sanctions. Outlaw and
Ruback (1999) found that offenders with greater ties to the community who paid their ordered
restitution were less likely to recidivate. Lurigio and Davis (1990) found that individuals who
were employed were likely to pay more of their ordered restitution in response to a letter
notifying them of their delinquency in payment. Rather than interpret this finding in terms of
attachment and commitment (Hirschi, 1969), Lurigio and Davis believed the finding indicated
that notification is effective for those who can pay because they have a job.

95
Aside from ties to the community, two demographic factors are related to the successful
completion of parole. Specifically, older and female probationers are more likely to succeed on
probation than are younger and male probationers (Morgan, 1994; Sims & Jones, 1997). We
were interested in testing whether these differences would appear in our sample of offenders.
Hypotheses
Based on prior research, we expected most offenders in our survey to express difficulty in
paying the economic sanctions they owe. We also expected nonpayment to be related to an
inability to make the payments (i.e., low income), as well as to four factors that would reduce
offenders‟ motivation to pay the sanctions: lack of understanding, disagreement with the
rationale for the sanctions, perception that the sanctions are unfairly applied, and belief that there
is no punishment for failing to pay the sanctions.
Method
We surveyed offenders in Blair and Westmoreland Counties in order to discover the
economic sanctions they were ordered to pay, their understanding and perceptions of the
sentencing process, especially with regard to economic sanctions, and their judgments about the
fairness and impact of economic sanctions.
Description of the Survey
The self-report survey was divided into four sections (see Appendix L). The first section
asked a series of questions about the offense and the punishment for the crime, in terms of
incarceration and probation. The second section asked offenders about the economic sanctions
in their case, including the amounts for costs, fees, fines, and restitution and the payments they
had made. This section also asked offenders how well they understood how the various
amounts of economic sanctions were set. The third section asked offenders about their case,

96
including their perceived responsibility for the crime, the judgments about the amounts and
procedures for economic sanctions in their case. Additionally, there was a 22-item scale
assessing offenders= understanding of different punishment goals as they applied to their case
(e.g., just deserts, revenge, recognition of victim status, deterrence of the offender, rehabilitation,
general deterrence, positive general prevention, victim security, and societal security). Offenders
were asked to read a series of statements beginning, AIt was important that I should be
punishedY@ and to indicate the importance of each statement for why they should be punished.
Statements included such items as Ato even out the wrong that I had done,@ Ato bring
satisfaction to the victim,@ Ato stop me from further offenses,@ and Ato show that crime does not
pay.@ Responses were coded Avery important,@ Asomewhat important,@ Anot very important,@
or Anot important.@ Of the 22 items on the scale, 18 came from the study by Orth (2003). We
added 4 more items in order to increase the number of goals assessed (moral outrage, treatment,
education, restitution to the victim). The fourth section asked for the offenders‟ opinions about
economic sanctions in general, including their perception of the burden that payment placed on
them and other offenders. The final section asked about the offender=s background. Included in
this section were questions about the offender=s gender, race, age, marital status, education, and
socioeconomic status. In all, the survey included 41 questions.
After designing the survey instrument, we obtained from the probation office in Centre
County the names of two offenders willing to participate in cognitive interviews. The cognitive
interviews proceeded in two stages. First, the offenders completed the self-report survey.
Second, we discussed each of the survey questions with the offenders. The purpose of the
cognitive interviews was to help us identify questions that were difficult to understand or that did
not accurately reflect what we intended. We then modified the survey to reflect any changes
97
suggested by the offenders. The offenders were paid $25 for their participation in the cognitive
interviews.
Sampling
We sampled offenders from two Pennsylvania counties (Blair and Westmoreland), which
were chosen because we had collected data there on the imposition and payment of economic
sanctions and because they agreed to cooperate with the research. Our sample of 405 adult
offenders sentenced in 2000 in Blair County was 78% male, 90% white, with an average age of
31.5 (Mdn = 29.1), and with 11.7 years of education (Mdn = 12.0). The offenses they were
convicted of were as follows: 27% property, 17% personal, 16% drugs, 24% traffic/DUI, and
16% other. In terms of sentence received, 4% were incarcerated in state prison, 21% were
incarcerated in county jail, and 51% received probation. Our sample of 394 adult offenders
sentenced in 2000 in Westmoreland County was 80% male, 88% white, with an average age of
33.2 (Mdn = 31.5), and with 12.0 years of education (Mdn = 12.0). The offenses they were
convicted of were as follows: 21% property, 17% personal, 15% drug, 39% traffic/DUI, and 8%
other. In terms of sentence received, 3% were incarcerated in state prison, 28% were
incarcerated in county prison, and 51% received probation.
In both counties, we worked with local probation personnel to obtain a list of all
offenders who were sentenced in 2003. We selected offenders convicted in calendar year 2003
because we wanted to ensure that they had had the opportunity to pay their economic sanctions
for at least a year. However, we also wanted to minimize the time in which they could have
moved or otherwise be hard to track down by mail and we wanted to choose a time period that
was not so long, so that the offenders could remember the details of the case we were asking

98
about. We conducted the survey in the summer of 2005, and calendar year 2003 met all of these
requirements.
After obtaining the two samples, we mailed offenders packets containing a cover letter
from the probation office, two consent forms, a survey, and a one-dollar incentive. Participants
were promised that their responses would remain completely confidential and would not be
shared with their probation officers or any other criminal justice personnel. After we received
the completed survey and a signed consent form, we paid the offender an additional 10 dollars
for his or her participation.
Results
Participants
We received 78 completed surveys from Blair County and 44 completed surveys from
Westmoreland County, for a final sample of 122 offenders. We mailed 508 surveys to offenders
in Westmoreland County. Of these, 110 were returned as undeliverable. Thus, the response rate
for Westmoreland County was 11% (44/398). We mailed 501 surveys to offenders in Blair
County. Of these, 64 were returned as undeliverable and we received letters from family
members that 2 additional offenders had died. Thus, the response rate for Blair County was
78/435 = 18%. After eliminating those surveys that were undeliverable, the overall response rate
was 15% (122/833). Two surveys were returned because the inmates were in prison and prison
rules prohibited them from completing the survey. The number of completed surveys in our
survey is low primarily because offenders, unless imprisoned, generally do not complete surveys.
Further, compared to the rest of the country, the response rate is lower in the northeast,
especially Pennsylvania (Groves, et al., 2004).
99
The sample consisted of 75 males and 47 females, who ranged in age from 20 to 67 (M =
34.1; Mdn = 33). Of the sample, 93% were white, 4% were black, and the remainder described
themselves as belonging to other racial groups. In terms of marital status, 39% had never been
married, 41% were married or living with someone, and 20% were divorced. In terms of
education, 25% had not completed high school, 28% had graduated from high school, and 38%
had at least some college or advanced technical training, 5% had a college degree, and 4% had
some graduate training. In terms of work, 30% were employed full time, 13% were employed
part time, 20% were unemployed, 21% were disabled, and the remainder included students,
retirees, homemakers, and occasional workers. In terms of income, 49% reported annual
incomes less than $10,000, 31% reported incomes between $10,000 and $20,000, 13% reported
incomes between $20,000 and $30,000, and the remaining 7% reported incomes greater than
$30,000.
The 122 respondents had been convicted of burglary (9), theft (25), robbery (2), assault
(10), drug possession (24), drug selling (15), DUI (44), traffic offenses (12), and other (26), most
of which were property (10) or drug offenses (5). The numbers total more than 122 because
individuals could be convicted of more than one offense (range = 1-4; M = 1.4; Mdn = 1, Mode =
1). We recoded the crimes respondents said they were convicted of into five categories: (a)
property (n = 29), (b) personal (n = 11), (c) drugs (n = 29), (d) DUI/traffic (n = 47), and (e) other
(which consisted of firearms violations, gambling, fleeing from police, and false ID; n =4). Two
individuals did not complete this item about their conviction offense. When a respondent listed
more than one conviction offense, we coded the most serious crime (e.g., personal more serious
than property). In subsequent analyses, we excluded other crimes, because there were so few
cases and because they did not form a cohesive category.

100
In terms of punishment, 6 had been sentenced to state prison, 46 had been sentenced to
county prison, and 87 had been sentenced to probation (multiple sentences were possible). The
most common of the 25 other sentences listed were house arrest (6), parole (7), and loss of
license (3).
Economic Sanctions Imposed
In terms of economic sanctions, 28 had been ordered to pay jail fees, 72 had been ordered
to pay court costs, 58 had been ordered to pay supervision fees, 34 had been ordered to pay other
costs and fees, 72 had been ordered to pay fines, and 29 had been ordered to pay restitution.
Overall, 79 respondents said they had been ordered to pay some type of economic sanction, with
the total amounts ranging from $101 to $25,000 (M = $2,848; Mdn = $1,400). An additional 42
respondents said they did not know the total amount they owed. A total of 87 respondents said
they were ordered to make monthly payments that ranged from $1 to $2,000 (M = $104; Mdn =
$68). An additional 27 respondents said they did not know what their ordered monthly payments
were.
Of the respondents, 88 said they had been shown a sheet that indicated the total costs and
fees they owed, and 61 said they had been given a sheet to keep that indicated the specific costs
and fees they owed. Of these individuals, most rated on a 7-point scale that having been given a
sheet was very important (M = 5.70; Mdn = 7). An additional 48 individuals who had not been
given a sheet indicated on a 7-point scale that they would have liked to have been given a sheet
listing the specific amounts they owed (M = 5.90; Mdn =7).
Understanding of Economic Sanctions
Respondents were asked to indicate on a 7-point scale how well they understood how the
amounts of five economic sanctions (court costs, supervision fees, other costs and fees, fines, and
101
restitution) were determined. In general, respondents indicated that they did not understand how
the amounts were determined, in that the means for all five items were below 4, the midpoint of
the scale.
These responses were analyzed using a 4 Between (Type of Crime) x 5 Within (Type of
Economic Sanction) repeated measures analysis of variance. This analysis revealed a significant
effect for type of economic sanction, F(4, 416) = 15.34, p < .001. A post-hoc Newman-Keuls
test of the means (p < .05) indicated that restitution (M = 4.03) was understood better than all of
the other economic sanctions, which did not differ significantly from each other (court costs: M =
2.83; supervision fees: M = 2.81; other costs and fees: M = 2.80; fines: M = 3.01). There was
also a significant Type of Crime x Type of Economic Sanction interaction, F(12, 416) = 2.19, p
< .05. A post-hoc test indicated that property offenders understood the determination of
restitution significantly more than the four other types of economic sanctions. Personal, drug,
and DUI/traffic offenders indicated that they understood the determination of all five economic
sanctions at a fairly low level.
The relatively low numbers for the understanding of the five specific sanctions can be
better understood in light of two other questions pertaining to the understanding of sentencing.
In response to a question asking how well they understood how criminal sentences are set in
Pennsylvania, offenders‟ responses were fairly uniform across the scale, and the average was at
the midpoint (M = 4.04; Mdn = 4). There were no differences in terms of crime committed (F <
1). Similarly, respondents were asked how well they understood where the money they pay
goes. The average response was well below the midpoint (M = 2.97; Mdn = 2), and there was no
significant difference as a function of crime committed (F < 1). Overall, then, offenders
indicated they somewhat understood sentencing in general and the setting of restitution amounts,
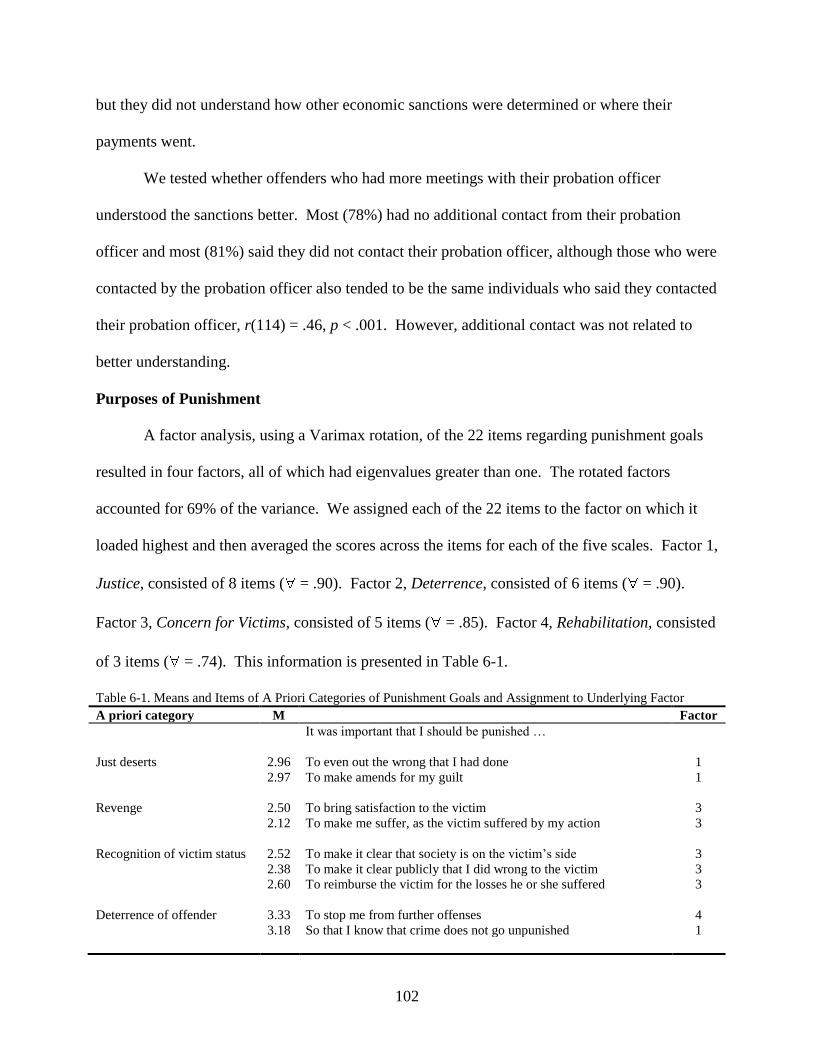
102
but they did not understand how other economic sanctions were determined or where their
payments went.
We tested whether offenders who had more meetings with their probation officer
understood the sanctions better. Most (78%) had no additional contact from their probation
officer and most (81%) said they did not contact their probation officer, although those who were
contacted by the probation officer also tended to be the same individuals who said they contacted
their probation officer, r(114) = .46, p < .001. However, additional contact was not related to
better understanding.
Purposes of Punishment
A factor analysis, using a Varimax rotation, of the 22 items regarding punishment goals
resulted in four factors, all of which had eigenvalues greater than one. The rotated factors
accounted for 69% of the variance. We assigned each of the 22 items to the factor on which it
loaded highest and then averaged the scores across the items for each of the five scales. Factor 1,
Justice, consisted of 8 items ( = .90). Factor 2, Deterrence, consisted of 6 items ( = .90).
Factor 3, Concern for Victims, consisted of 5 items ( = .85). Factor 4, Rehabilitation, consisted
of 3 items ( = .74). This information is presented in Table 6-1.
Table 6-1. Means and Items of A Priori Categories of Punishment Goals and Assignment to Underlying Factor
A priori category M Factor
It was important that I should be punished …
Just deserts 2.96 To even out the wrong that I had done 1
2.97 To make amends for my guilt 1
Revenge 2.50 To bring satisfaction to the victim 3
2.12 To make me suffer, as the victim suffered by my action 3
Recognition of victim status 2.52 To make it clear that society is on the victim‟s side 3
2.38 To make it clear publicly that I did wrong to the victim 3
2.60 To reimburse the victim for the losses he or she suffered 3
Deterrence of offender 3.33 To stop me from further offenses 4
3.18 So that I know that crime does not go unpunished 1

103
Rehabilitation 3.03 To allow for my rehabilitation 4
2.55 To help me understand our legal system 1
2.94 To treat my drug, alcohol, or mental health problems 4
2.58 To provide me with education or work skills 2
General deterrence 3.01 To show that crime does not pay 1
2.99 To stop others from committing similar offenses 1
Positive general prevention 3.08 To uphold the important values in society 1
3.64 So that people are not frustrated with the legal system 2
Victim security 2.59 So that the victim can live in safety 2
2.40 So that the victim does not have to fear me for now 2
Societal security 2.65 So that I am not a danger to others 2
2.48 So that society does not have to fear me for now 2
Moral outrage 3.17 To make it clear that my act was wrong 1
Note. Items are on a 4-point scale, ranging from 1 (Not Important) to 4 (Very Important). Factor 1 = Justice; Factor
2 = Deterrence; Factor 3 = Concern for Victims; Factor 4 = Rehabilitation.
Comparisons by gender indicated that females (M = 3.20) rated Justice significantly more
important than did males (M = 2.87), t(120) = 2.11, p < .05. Females (M = 2.67) also had
significantly more Concern for Victims than did males (M = 2.29), t(104) = 2.00, p < .05. All
four sentencing goals were significantly related to the perceived fairness of the amounts of and
procedures for the economic sanctions. The goals were unrelated to total economic sanctions
owed, total monthly payments, and household income.
A 4 Between (Type of Crime) x 4 Within (Punishment Goals) repeated measures analysis
of variance revealed a significant effect for punishment goals, F(3,288) = 26.30, p < .001.
Rehabilitation (M = 3.14) was endorsed more than Justice (M = 3.02), and Justice was endorsed
more than Deterrence (M = 2.55), according to a post-hoc Newman-Keuls test (p < .05). All
three of those goals were endorsed significantly more than Concern for Victims (M = 2.48).
There was also a significant Type of Crime x Punishment Goals interaction, F(9, 288) =
2.68, p < .01. Property and personal offenders were most concerned with Justice and least

104
concerned with Deterrence. In contrast, drug offenders and DUI/traffic offenders were most
concerned with Rehabilitation and showed the least Concern for Victims.
Comparison to victims. These same 22 items had been used in a study of victims by
Ruback et al. (2006). Table 6-2 presents a comparison of offenders‟ and victims‟ responses to
the 22 items. As can be seen in the table, there were significant differences on 20 of the 22
items; the only 2 nonsignificant items related to rehabilitation. Most of the differences were
between .40 and .70, which are quite large given that the scale was only four points. However,
there were four items on which the difference between offenders‟ and victims‟ responses were
greater than .80. Three of the items related to victim or societal safety, and the fourth item
concerned restitution to the victim.
Table 6-2. Comparison of Means of 22 Punishment Items for Offender (n = 122) and Victim (n = 238) Samples
Offender
Mean
Victim
Mean
Mean
Difference t
It was important to me that the offender should be punished …
To even out the wrong that the offender had done 2.95 3.41 .46 4.28***
To make amends for the offender‟s guilt 2.96 3.29 .33 2.93**
To bring satisfaction to me, the victim 2.49 3.10 .61 4.64***
To make the offender suffer, as I suffered by his/her action 2.11 2.52 .41 3.01**
To make it clear that society is on my side 2.52 2.82 .30 2.29*
To make it clear publicly that the offender did wrong to me 2.39 2.66 .27 2.01*
To reimburse me for the losses I suffered 2.62 3.41 .79 6.69***
To stop the offender from further offenses 3.33 3.90 .57 7.82***
So that the offender knows that crime does not go unpunished 3.17 3.86 .69 9.07***
To allow rehabilitation of the offender 3.02 3.25 .23 2.10*
To allow the offender to be understand our legal system 2.58 3.01 .43 3.55***
To treat the offender‟s drug, alcohol, or mental health problems 2.95 3.06 .11 .85
To provide the offender with education or work skills 2.59 2.73 .14 1.01
To show that crime does not pay 3.02 3.60 .58 5.83***
To stop others from committing similar offenses 3.01 3.53 .52 5.10***
To uphold the important values in society 3.10 3.55 .45 4.73***
So that people are not frustrated with the legal system 2.66 3.17 .51 4.27***
So that I can live in safety 2.60 3.56 .96 8.55***
So that I do not have to be afraid of the offender for now 2.42 2.92 .50 3.59***

105
So that the offender is not a danger to others 2.68 3.51 .83 7.53***
So that society does not have to fear the offender for now 2.50 3.32 .82 6.65***
To make it clear that the offender‟s act was wrong 3.17 3.71 .54 5.81***
Note. Wording for the questions is in terms of the survey that was given to victims. For offenders, the introductory
wording was “It was important that I should be punished … .” Items were answered on a 4-point scale, ranging
from 1 (Not Important) to 4 (Very Important).
We analyzed the continuous measures using a 2 x 3 (Gender x Type of Crime) analysis of
variance. On none of the variables was gender a significant predictor. There were significant
type of crime effects on the percentage of economic sanctions that were paid, F(1, 56) = 5.57, p
< .01, and perceived fairness of the amounts they had to pay for costs, fees, fines, and restitution,
F(3, 106) = 2.97.
Procedural and Outcome Fairness
Respondents rated the fairness of the amounts that they had to pay for each of the five
types of economic sanctions. They also rated the fairness of the procedures used to determine
each of the five types. These 10 ratings were analyzed using a 2 x 2 Between (Gender x
Incarceration) x 5 x 2 Within (Type of Economic Sanction x Type of Fairness) doubly repeated
measures analysis of variance. This analysis revealed one significant between-subjects effect,
the interaction between incarceration status and gender, F(1, 109) = 6.29, p < .05. Female
respondents believed the economic sanctions were significantly fairer if they had not been
incarcerated (M = 3.00) than if they had been incarcerated (M = 2.18), whereas male respondents
were somewhat more likely to believe the sanctions were fairer if they had been incarcerated (M
= 2.71) than if they had not (M = 2.46).
There was a significant effect in terms of overall fairness for the type of sanction, F(4,
436) = 4.30, p < .01. Restitution (M = 2.77) was judged to be the most fair economic sanction,
court costs were judged the next most fair sanction (M = 2.61), supervision fees (M = 2.59) and

106
fines (M = 2.57) were judged next most fair, and other costs and fees (M = 2.39) were judged to
be the least fair.
There were also three marginally significant within subject effects. Respondents
believed procedures were somewhat more fair than the amount of economic sanctions set, F(1,
436) = 3.19, p < .10. There was also a marginally significant interaction between type of
economic sanction and type of fairness, F(4, 436) = 2.33, p = .055. For court costs, supervision
fees, other costs and fees, and fines, respondents rated procedural fairness higher than outcome
fairness, but for restitution respondents showed no difference in how they rated procedural and
outcome fairness. Finally, there was a marginally significant interaction between type of
fairness, gender, and incarceration status, F(1, 436) = 3.31, p = .06. For respondents who had
been incarcerated, both males and females rated procedural fairness higher than outcome
fairness. For respondents who had not been incarcerated, males rated procedural fairness higher
than outcome fairness, whereas females rated outcome fairness higher than procedural fairness.
Economic Hardship
We used four measures of the extent to which the economic sanctions posed a hardship to
respondents: (a) their reported difficulty in making their monthly payments, (b) their responses to
two questions about whether paying economic sanctions interferes with offenders being able to
complete probation or parole successfully and to provide for their families, (c) their expectations
about paying off their ordered economic sanctions, and (d) two behavioral indicators of hardship,
whether they had missed any payments and whether they had had their monthly payments
reduced.
We asked respondents to indicate on a 7-point scale how difficult it is for them to make
their monthly payments. Most respondents indicated that it was difficult, with 66% of the
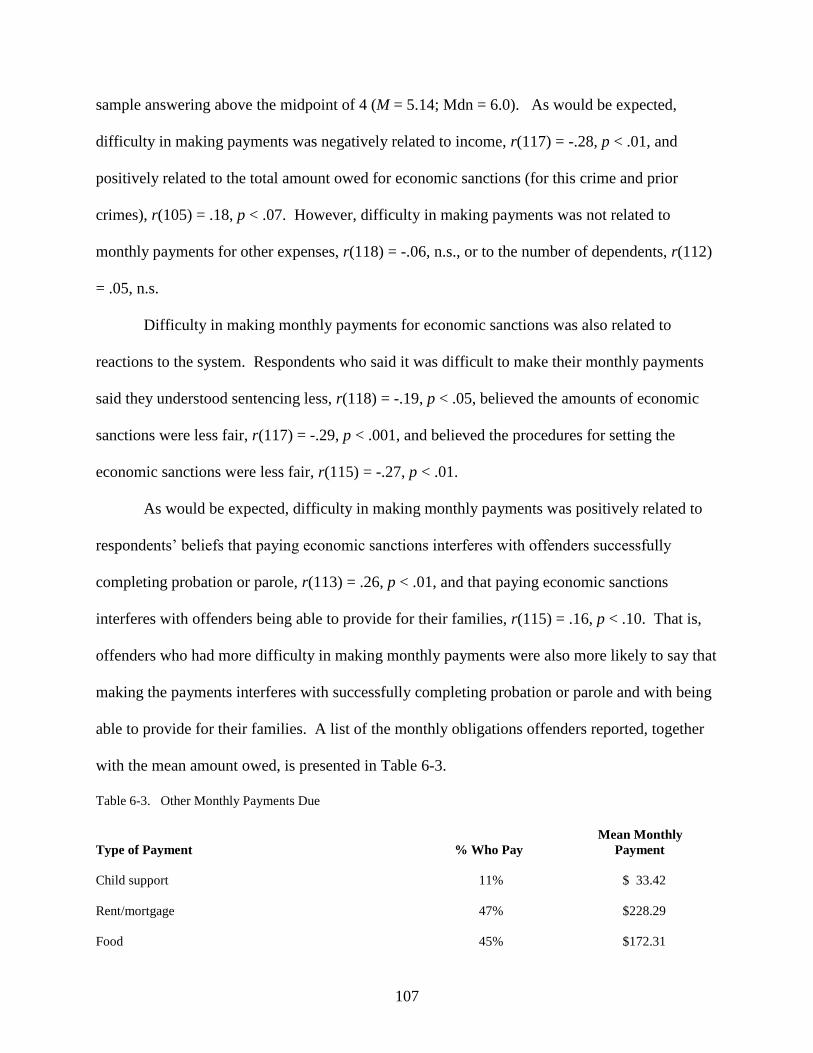
107
sample answering above the midpoint of 4 (M = 5.14; Mdn = 6.0). As would be expected,
difficulty in making payments was negatively related to income, r(117) = -.28, p < .01, and
positively related to the total amount owed for economic sanctions (for this crime and prior
crimes), r(105) = .18, p < .07. However, difficulty in making payments was not related to
monthly payments for other expenses, r(118) = -.06, n.s., or to the number of dependents, r(112)
= .05, n.s.
Difficulty in making monthly payments for economic sanctions was also related to
reactions to the system. Respondents who said it was difficult to make their monthly payments
said they understood sentencing less, r(118) = -.19, p < .05, believed the amounts of economic
sanctions were less fair, r(117) = -.29, p < .001, and believed the procedures for setting the
economic sanctions were less fair, r(115) = -.27, p < .01.
As would be expected, difficulty in making monthly payments was positively related to
respondents‟ beliefs that paying economic sanctions interferes with offenders successfully
completing probation or parole, r(113) = .26, p < .01, and that paying economic sanctions
interferes with offenders being able to provide for their families, r(115) = .16, p < .10. That is,
offenders who had more difficulty in making monthly payments were also more likely to say that
making the payments interferes with successfully completing probation or parole and with being
able to provide for their families. A list of the monthly obligations offenders reported, together
with the mean amount owed, is presented in Table 6-3.
Table 6-3. Other Monthly Payments Due
Mean Monthly
Type of Payment % Who Pay Payment
Child support 11% $ 33.42
Rent/mortgage 47% $228.29
Food 45% $172.31

108
Car payments 16% $ 51.00
Insurance 31% $112.48
Utilities 43% $113.06
Credit card bills 17% $200.20
Health care 12% $ 10.20
Other 17% $ 28.24
In terms of objective measures of difficulty in making payments, we found that 53
offenders said they had missed making any type of payment at least once, 13 offenders had had
their monthly payments reduced, and 2 offenders had been allowed by the court to stop
payments. However, consistent with Petersilia and Deschenes (1994), who found that about 70%
of their sample of offenders said that they would pay all of the restitution they owed, we found
that 103 of our respondents (80%) said they expected to pay all of the money they owed.
To determine how important the three explanations relating to motivation to pay
(understanding, agreement with the rationales, fairness) and the one explanation relating to
ability to pay are in actually making payments, we conducted logistic regressions in which we
tested various explanations. For example, in one model we used composite scores for the
understanding of economic sanctions, the perceived fairness of the amounts of economic
sanctions, the perceived fairness of the procedure used to determine economic sanctions, the
composite score for Justice as a goal for sentencing, and the offender‟s income to predict
whether or not the offender had ever missed a payment. The only significant predictor of
missing a payment was household income.
Individual Differences and Economic Sanctions
One of the things we were interested in is related to the fact that older offenders and
women are more likely than younger offenders and men to successfully complete probation.
109
Women (M = 3.20) were significantly more likely than men (M = 2.87) to rate Justice higher,
t(120) = 2.11, p < .05. Similarly, women (M = 2.67) were significantly more likely than men (M
= 2.29) to be more concerned about the victim, t(104) = 2.00, p < .05. Women (M = 3.09) were
slightly more likely than men (M = 2.64) to believe it is fair for offenders to pay supervision fees,
t(119) = 1.75, p < .09. Women were not more likely than men to be incarcerated, to owe more
money, or to have higher monthly payments.
We conducted a median split to determine whether there were age differences in
perceptions of economic sanctions. Offenders 33 and older (M = 2.80) were significantly more
likely to believe in deterrence (M = 2.37), t (114) = 2.27, p < .05. Similarly, offenders 33 and
older (M = 2.63) had significantly more concern for victims than did offenders under 33 (M =
2.25), t(102) = 2.07, p < .05.
Married individuals are more likely to succeed on probation, including paying their
economic sanctions, than are single individuals. This could be because they have more money or
because they care more about succeeding because they have more to lose if their probation is
revoked. A third possibility is that they care more about victims. Married and cohabiting
individuals (M = 2.67) had significantly more concern for victims than did unmarried individuals
(M = 2.28), t(104) = 2.08, p < .05. Similarly, married and cohabiting individuals (M = 3.32)
were significantly more concerned about their own rehabilitation than were single individuals (M
= 2.95), t(120) = 2.17, p < .05. However, married and cohabiting individuals (M = 2.33) were
significantly less likely than single individuals (M = 2.89) to believe it is fair to require offenders
to pay other costs and fees, t(119) = 2.34, p < .05. In the sample, there was no significant
difference in the proportion of men and women who were married.
110
Effect of Incarceration
People whose sentence included incarceration in state prison (n = 6) or county prison (n =
46) owed significantly more money (M = $4,114) than did respondents who had not been
incarcerated (M = $2,227), t(77) = 2.05, p < .05. They also owed more for other crimes (M’s =
$3,915 vs. $1,376), t(91) = 2.43, p < .05. They were less likely to say they understood court
costs (M’s = 2.32 vs. 3.18 for incarcerated and nonincarcerated samples, respectively). They
also differed in how they viewed the fairness of sentences imposed on most offenders, t(118) =
2.64, p < .01.
Discussion
We had hypothesized that offenders do not pay a higher percentage of their ordered
economic sanctions both because they are not motivated to do so and because they are unable to
do so. This survey of offenders found some support for all four reasons that we investigated,
both the three reasons pertaining to motivation to pay, and the one reason relating to ability to
pay.
Motivation to Pay
We hypothesized that offenders might not be motivated to pay their economic sanctions
because they do not understand them, they do not agree with them, and they do not believe the
sanctions were fairly applied. We found some support for all three rationales.
First, there was strong evidence that offenders did not understand how fines, fees, and
costs were imposed. Although offenders, and particularly property offenders, said they
understood how restitution decisions were imposed, the absolute number (a mean of 4 on a 7-
point scale) was in fact not very high.
111
Second, there was evidence that offenders did not agree with the rationale for economic
sanctions. Our results indicated that the offenders did not rate any of the goals of punishment
very highly. And, as compared to victims, they rated all of the goals as less important, especially
those related to concern for victims (including making restitution to them).
Third, there was evidence that offenders did not perceive the amounts of the economic
sanctions or the procedures used to determine them to be very fair. In general, there were no
significant differences between outcome and procedural fairness.
Inability to Pay
Although there was support for all three reasons pertaining to motivation to pay, the
strongest explanation related to inability to pay. Our multivariate analyses of an objective
indicator of nonpayment (having to miss payments) indicated that our indicators of motivation to
pay were not significantly related to missing a payment, whereas indicators of ability to pay
(e.g., total economic sanctions owed, total monthly payments) were significant indicators.
Alternative Explanation for Nonpayment
A rationale for nonpayment that we did not investigate is that there are no perceived
penalties for nonpayment. Many probationers do not comply with their court-ordered conditions,
and there are often no sanctions for failing to comply (Langan, 1994). For economic sanctions
in particular, research suggests that often no punishments are imposed for non-payment of court-
ordered fines and restitution (Petersilia & Turner, 1993). Offenders learn that threats (e.g.,
meetings, letters of reprimand, warnings) often have no repercussions, and probation revocation
for failure to pay is unlikely (Wheeler et al., 1990). Nonpayment of restitution is rarely the basis
for revocation of probation (Lurigio & Davis, 1990).

112
A study of probationers in Illinois illustrates these points (Allen & Treger, 1994). The
survey suggested that offenders start out believing that payment is required, but that they learned
this was not true. About half of the offenders believed their probation officer would report
nonpayment to the court but would not recommend incarceration. About a quarter believed their
probation officer expected them only to make a good faith effort at making full payment, and
more than a tenth believed their probation officer did not expect them to make full payment.
In our study, we did not find any support for this idea. In fact, open-ended responses to a
question about whether paying economic sanctions interferes with offenders being able to
complete probation or parole successfully indicated evidence that our respondents did fear
nonpayment. Open-ended responses to this question were coded (83% agreement; kappa = .78).
The most common response of the individuals who answered the question (14/52 = 27%) were
that failure to make the payments meant that they could not complete probation/parole. An
additional 6 individuals (12%) said that failure to pay resulted in going to jail.
A possible reason why we found that offenders feared the repercussions of nonpayment is
that our respondents were a self-selected sample of individuals who could be reached by mail,
who were not in prison, and who were probably more conscientious than those who did not
respond. The high rate of non-delivered questionnaires two years after conviction (17%)
suggests that our initial pool of individuals was highly transient. Those individuals who
responded not only were probably less transient (and therefore probably had more ties to the
community) but also were more concerned about earning money.
Implications
One of our key findings was that, with the possible exception of restitution, most
offenders did not understand how the amounts they owed were determined. Nor did they

113
understand where the money they paid went. Correctional scholars believe that by making
payments on a regular basis offenders can learn to take responsibility for their crimes. However,
particularly with regard to restitution, this belief is premised on the assumption that offenders
know where their payments go. Thus, future research might investigate how best to convey this
information to offenders and whether this information gives offenders a better understanding of
the penalties, makes them feel more responsible for their crimes, and reduces their likelihood of
committing a new offense.
It might also be that offenders not only do not understand how amounts were determined,
but also do not understand such logistical issues as where they are supposed to make their
payments. In some counties, different types of economic sanctions have to be paid in different
places. It might be that in those counties, probation is better at monitoring the economic
sanctions collected by them, versus the ones paid to the Clerk of Courts or to someone else. If
so, it may be that this would partially explain some of the findings in this research project about
differences in payment by type of economic sanction, as well as some of our prior research that
found payment rates were higher when probation officers were in charge of collection (Ruback,
Shaffer, & Logue, 2004).
114
Chapter 7
Summary, Discussion, and Implications
Summary of the Research Findings
Adult and juvenile cases. Our analysis of the adult and juvenile cases revealed that
counties vary significantly in their use of economic sanctions, especially in juvenile cases. The
variation in juvenile cases can be somewhat explained by the fact that juvenile courts are more
focused on rehabilitation than on punishment, and, compared to adult courts, there is more
emphasis on customizing treatment to the individual.
Aside from the variation between counties, we also found that case characteristics (e.g.,
the type and severity of the offense) are better predictors than offender characteristics (e.g., age,
race, or gender) of both the imposition and payment of economic sanctions. In adult cases, for
example, higher levels of economic sanctions were imposed for more severe crimes.
Furthermore, the total amount of fines and costs ordered was significantly higher for offenders
convicted of traffic offenses. This finding probably reflects the fact that most traffic offenses
were for DUI, and, because of mandated fines and costs, the amount of economic sanctions
imposed in these cases is generally high. There also appears to be less variation in the type of
sentence, length of sentence, and economic sanctions imposed in DUI cases than in other types
of cases. For example, in some counties, groups of DUI cases are processed at the same time
(especially those eligible for ARD) and all receive 12 or 24 months of probation and the same
package of services and economic sanctions (which, in one county, totals $525 when fines, the
ARD supervising fee, and the cost of a traffic safety course are included).
In terms of the payment of economic sanctions, we found that the percent of economic
sanctions paid was significantly lower for property offenders than for offenders convicted of

115
personal, drug, traffic, or other offenses, possibly because property offenders have fewer assets
than do other types of offenders. Furthermore, the percentage of economic sanctions paid was,
not surprisingly, significantly lower for incarcerated offenders (or, in juvenile cases, offenders
sentenced to a commitment). Even if offenders pay while they are incarcerated (which most do
not), the amount of payments most can make would be very minimal.18
In general, however,
case and offender characteristics explained little or no variation in the amount of economic
sanctions ordered or the percent of economic sanctions paid across counties.
The results showed that counties not only impose different costs and fees, but also that
they use restitution, a mandatory sanction, in different ways. For example, judges in one county
sometimes order restitution for police or other state agencies, which appears to be in conflict
with the restitution statute. Counties also varied in their imposition and payment of two other
mandatory state penalties: Crime Victim Compensation (CVC) and Crime Commission Cost
(CCC). In adult cases, the imposition of CVC and CCC was generally high (M = 91% and M =
90%, respectively). Across counties, CVC and CCC were less likely to be imposed for summary
offenses.
In juvenile cases, the imposition of these costs is mandatory only for consent decrees and
adjudications of delinquency. Largely because of that, across counties there is greater variation
in the imposition of CVC (M = 55%) and CCC (M = 67%) in juvenile cases than in adult cases.
The percentage of adult cases in which CVC and CCC were paid in full was modest (M =
56% and M = 55%, respectively). The percentage of cases in which CVC and CCC were paid in
full was significantly higher for offenders convicted of traffic offenses and significantly lower
18
During the period of our data collection, counties were awaiting a court decision regarding whether or not the
wages earned in prison could be garnished and put towards restitution/other economic sanctions. Some
counties/institutions were not withholding, and others were withholding, but not paying out the monies pending the
court‟s decision.

116
for offenders incarcerated in jail, paralleling the findings for economic sanctions overall. We
were also interested in the percentage of cases in which CVC and CCC were paid in full in
juvenile cases, but this information was generally unavailable.
DAVE cases. We examined DAVE cases in four counties to determine whether
restitution was being ordered to the state Crime Victims Compensation (CVC) Fund in those
cases where the CVC provided compensation to the victim. Consistent with our results from the
adult and juvenile cases, our examination of the DAVE cases revealed that some counties are
more effective than others at ordering restitution to the CVC. The percentage of cases in which
judges acknowledged CVC restitution was lowest in Delaware County (3%) and highest in
Cumberland County (56%). The average amount of CVC restitution ordered ranged from $741
in Centre County to $5,428 in Cumberland County.
Victim survey. We surveyed victims in two counties to test whether victims‟ satisfaction
with the criminal justice system was related to their perceptions of the fairness of their outcomes
and the procedures by which those outcomes were reached. The results show that victims are
generally more satisfied with procedural than outcome fairness. More specifically, victims were
somewhat more satisfied with the procedure for restitution than with the amount of restitution the
offender was ordered to pay. Furthermore, victims‟ satisfaction with the outcomes and
procedures in their cases increases their willingness to report crimes in the future. The results
also show that women want more input into criminal justice decisions.
Offender survey. In order to explain offenders‟ low rate of payment of economic
sanctions, we surveyed offenders in two counties. We also found that offenders generally do not
understand how the amounts of different economic sanctions (court costs, supervision fees, other
costs and fees, fines, and restitution) are determined. Restitution was understood better than all
117
of the other economic sanctions, but that understanding was still far from universal (M = 4.03 on
a scale of 1 to 7). Although most offenders indicated that they had been shown a sheet that
indicated the total costs and fees they owed, 39% of the offenders in this study did not remember
being given a sheet. These individuals indicated that they would have liked to have been given a
sheet with a breakdown of specific amounts they owed. In sum, then, we found that offenders
somewhat understood sentencing in general and the setting of restitution amounts, but they did
not understand how other economic sanctions were determined, where their payments went, or
exactly how much money the owed.
Understanding the Actual Workings in the Counties
Over the course of this project, our interactions with staff members revealed detailed
information about the actual workings in the counties. The following discussion describes for
the counties we studied the organization of collections and supervision, the order of payment,
and the procedures used in the event of nonpayment. Although all counties emphasized that
collections enforcement was a priority, no two counties handled the imposition and collection of
economic sanctions in exactly the same way.
Organization of collections and supervision. All of the counties took considerable
action to try to enforce payment. Typically, payment plans were established so that if offenders
stayed on schedule with their payments, they could complete them by the time their probation
was due to expire. Many counties require offenders to pay a minimum monthly payment (e.g.,
$60 in Cumberland County). Although offenders cannot be discharged from probation until their
economic sanctions are paid in full, they can go on inactive supervision or unsupervised
probation. In practice, however, offenders are sometimes discharged without completing
payment.

118
With the exception of Centre and Westmoreland Counties, all of the counties used
specialized collections units to monitor and/or collect economic sanctions. In some counties,
such as Cumberland and Lancaster, these units are part of the adult probation department, staffed
at least in part by probation officers. These specialized probation units are responsible for
monitoring and enforcing payments, but they do not collect the payments directly. In Lancaster
County, payments are made to the Treasurer and in Cumberland County, they are made to the
Clerk of Courts. In other counties, such as Blair and Delaware, the collections unit is separate
from the probation department. For example, Delaware County has a separate Court Financial
Services (CFS) office that is responsible for the collection of all economic sanctions. However,
CFS staff work closely with other departments, including probation. The collection of economic
sanctions is sometimes split between two offices. For example, in the year 2000 in Luzerne
County, the probation office collected restitution and supervision fees, while the Clerk of Courts
collected costs and fines. Additionally, offenders often have to pay for treatment that is required
as a condition of their probation. Some of the programs are paid for through the payments
calculated as a part of sentencing or intake to probation, but others are paid directly to the
treatment provider, which is typically a private organization.19
There are also differences across counties in how offenders make payments. For
example, a staff member in Centre County informed us that each time an offender comes to the
probation office to make a payment, he or she is asked about which case the money should be
applied to. Although offenders have payment contracts that require them to pay a specific
amount of money each month, they can pay whatever amount they choose when they come into
19
It is important to note that what we measured in our analyses of economic sanctions may not have been the total
amount an offender owed. In many cases, if an offender is required to get counseling, participate in a safe driver
program, etc., he or she must pay for that service directly to the service provider.

119
the probation office. In Luzerne County, restitution and supervision fees are handled by the
same office, but offenders have to make two separate payments (i.e., one payment for restitution
and one payment for supervision fees). Thus, if an offender is paying by check or money order,
he or she would have to have two checks or two money orders each time.
In the year 2000, some counties did not impose particular types of economic sanctions on
juvenile offenders, which may have affected the results in this study. For example, Cumberland
County seldom imposed fines, fees, or costs in juvenile cases. Furthermore, in Luzerne County
juveniles were not ordered to pay court costs. In contrast to the other counties, Luzerne County
required juveniles to attend school/job training or to find employment as a condition of their
probation, and if they were employed, to pay 75% of their wages toward restitution and fines.
The most common type of economic sanction imposed on juveniles was restitution. The
collection and distribution of restitution varied by county. In some counties, payments were
made to the probation officer during regular appointments. In other counties, restitution was
handled by the Victim Offender Reconciliation Program (VORP).
Order of payment. The counties were most similar in terms of the prioritized order in
which payments were applied. The law requires that each time an offender makes a payment,
50% goes toward restitution (until restitution is paid in full) and 50% goes toward the payment of
other fines, fees, and costs. However, there are exceptions to this general rule. In Centre
County, for example, offenders must pay 100% of restitution before paying any other economic
sanction. If the offender is in jail or on work release, however, 15% of each payment goes
toward jail/institutional maintenance fees and the remainder goes to restitution. In Lancaster
County, offenders first pay a $10 per month probation administration fee, followed by 100% of
restitution, costs and fees, and probation supervision fees. In Westmoreland County, each time a

120
juvenile offender makes a payment, the first $50 is paid to the Crime Victim Compensation
(CVC) fund, followed by restitution and state and county costs. Although restitution on older
cases is generally paid before restitution on recent cases, there are no formal guidelines about
how multiple cases with restitution should be handled. For example, a staff member in Blair
County informed us that judges sometimes issue court orders mandating that a particular victim
receive payment first. In other words, the victim who complains the most could be given priority
in payment. In other counties, we heard of other alternatives, including dividing the payments
proportionally across victims.
Procedures used in the event of nonpayment. The counties in this study employ a
range of strategies in dealing with the nonpayment of economic sanctions. One strategy that
many counties shared was a multi-step process characterized by a gradual increase in threatened
sanctions. In general, offenders who stop making their payments receive one or more warning
letters asking for payment. If the offender still fails to make payments or to respond to contact
by the probation department, he or she is charged with contempt of court, and a judge issues a
decision on the matter. While nonpayment of economic sanctions can be a violation of probation
or parole, judges also have the option of setting a new payment plan, reducing the amount owed,
extending probation, and/or substituting community service for costs and fees. For instance, in
Centre County, judges often reduce the total amount of economic sanctions the offender owes.
These reductions are often substantial because judges base their decision on the offender‟s ability
to pay. In another example, in Delaware County, defendants who do not have the ability to pay
(i.e., because of incarceration, unemployment, or disability) may perform community service in
return for a reduction in the amount of money they owe. Some counties, such as Delaware,
Lancaster, Luzerne, and Westmoreland Counties, occasionally use private collections agencies to
121
collect money owed on old cases. Because economic sanctions cannot be forgiven without a
judicial order, in order for government agencies to be able to recover all of the money owed, they
typically impose an additional fee to cover the cost of private collection. For example, in one
county the overall amount owed by the offender was increased by 25% if the case was sent to a
private collections agency.
The type of action taken also depends on the offender‟s supervision status. For example,
if an offender fails to make payments while on probation, his/her probation may be revoked or
extended. If an offender is no longer on probation but still owes money, he or she may be held in
contempt of court for nonpayment. A staff member in Cumberland County informed us that all
collections cases are sent through one judge. If offenders are not making payments, the judge
prefers that they appear in court before their probation expires so that he can extend their
probation. The judge only occasionally sends someone to prison for nonpayment, mainly to send
a message that it can happen. In Lancaster County, the number of cases going to court for
contempt for nonpayment was drastically reduced after the introduction of the Collections
Enforcement Unit (CEU).
Across counties, we found even greater variation in the types of action taken in juvenile
cases. In Cumberland County, for example, probation staff may revoke probation or have the
juvenile earn money through a community service program. At age 21, contempt of court
proceedings may begin and judgments may be filed against the individual. In Luzerne County,
juveniles who fail to pay their fines on time or who fail to make payments according to their
payment plan are sent to detention until someone pays their fines. Because most juvenile cases
are for nonpayment of fines, this outcome seems fairly common. However, it is at the judge‟s
discretion which juveniles are sent to detention for nonpayment of fines. In Delaware County,
122
the case can be sent to court, community service can be ordered to cover costs not mandated by
the state, or the individual can be referred to an outside collections agency. In most counties,
parents or guardians are allowed to pay on a juvenile case.
Implications for Future Research on Economic Sanctions20
Despite the pressure toward the increased use of economic sanctions and the evidence of
their effectiveness, the criminal justice system faces three problems: (a) setting the amounts of
the sanctions, (b) receiving payments from offenders who may not be able to pay, (c) setting
priorities among the different economic sanctions.
Problem of setting the amount of sanctions. Judges‟ single biggest complaint with
regard to setting economic sanctions is that at sentencing they lack complete information about
offenders‟ economic circumstances, including employment income (net of taxes), other sources
of income (e.g., welfare, unemployment), residence expenses, and number of dependents
(Hillsman & Greene, 1992). Judges lacked this information at sentencing (Olson & Ramker,
2001).
Judges do seem to consider whether offenders should pay multiple economic sanctions.
Thus, consistent with the idea that judges believe there is a total amount of economic sanctions
that is fair, an increase in one type of economic sanction seems to lower the amounts of other
types of economic sanctions. Recent studies in Pennsylvania, using both state-level data
(Ruback, et al., 2005) and county-level data (Ruback, 2004; Ruback, Shaffer, & Logue, 2004)
suggest that the imposition of restitution is negatively related to the imposition of fines.
Problem of payment. Staggering amounts of economic sanctions are unpaid. Because
most offenders have little money, they have difficulty paying these sanctions, especially if
multiple sanctions are imposed (Wheeler, Hissong, Slusher, & Macan, 1990). Economic
20
Some of this discussion comes from Ruback and Bergstrom (2006).

123
sanctions put additional burdens on offenders that make it even more difficult for them to try to
lead crime-free lives. Furthermore, their inability to pay these sanctions has implications for the
funding of government services dependent on offender-paid fees and costs and, in the case of
restitution, for the economic and psychological welfare of victims. Moreover, noncompliance
with orders to pay economic sanctions undermines the credibility of the criminal justice system
with both offenders and the public (Lurigio & Davis, 1990). Consistent with that notion, in the
counties we studied probation officers, prosecutors, and victim witness service providers told us
that ordering restitution can sometimes set up false hope for victims. And, these individuals said
that they must often help victims see the restitution order as a symbolic victory, because the
victim‟s chances of seeing any money are low.
Although large amounts of economic sanctions are imposed, payment levels are fairly
low. What is needed is a cost-benefit analysis, to determine whether the costs of encouraging
and tracking payments justify the amount of money that is brought in. Several counties that we
studied send out letters to stimulate payment. These letters serve not only to educate offenders
(see below) but also seem to encourage payment (Lurigio & Davis, 1990) and are much cheaper
than more active supervision.
Problem of priorities. The use of multiple monetary sanctions has implications in terms
of priority of payment (Olson & Ramker, 2001), both across types of economic sanctions and
within any one type of sanction. With multiple types of monetary sanctions, it is unclear how
monthly payments should be split among fines, fees, and restitution. The problem is
compounded when offenders have these multiple monetary obligations for multiple crimes.
Thus, for example, how should restitution payments for victims of three different crimes be
prioritized? Possible options include (1) payment in terms of chronological order (i.e., the
124
oldest first), (2) payment in reverse chronological order (i.e., the newest first, in the assumption
that earlier victims have already coped with the loss), (3) the largest restitution amount first, (4)
the most severely injured victim first (which will probably overlap with #3), (5) the most
proactive victim first, and (6) the victim who needs it the most first.
Implications for Practice
Our multimethod research program has two implications for practice: understanding and
consistency.
Understanding
One rationale behind some economic sanctions is that offenders understand that the
money they are paying is going for a specific purpose. In the case of restitution, the economic
sanction for which understanding is assumed to be most important, offenders learn that they have
caused specific harm to a specific victim and that their monthly payments are directed at
restoring the victim to his or her precrime state. Economic sanctions whose purpose is
punishment (e.g., fines) also assume that offenders understand the underlying purpose. Despite
the implicit assumption that offenders understand the economic sanctions, our survey of
offenders indicated that they had little understanding (a) of how the economic sanctions they
were ordered to pay were set and (b) of where their payments were directed. They also seemed
to have little understanding of how much they owed in total.
Best practice. Understanding could be increased if offenders were reminded of what
they owe for each type of economic sanction. In fact, what most of the units do is to go back
through old cases and try to keep up with current cases – simply seeing whether offenders are
paying and, if not, sending a reminder and a new payment plan. A lot of the work is done by the
computer system, which can be set to monitor payments and let the relevant person know when

125
action has to be taken in terms of sending out a letter (or a letter can even be generated
automatically). Cumberland County automatically sends an invoice every month to each
offender, which seems to be effective. Even if an offender loses the original sheet with the
breakdown of economic sanctions, in 30 days or less, he or she will know what is still owed and
where to send it.
Consistency
Across counties, and even within counties, there is a high level of variation in how
economic sanctions are handled. In conversations with different staff members, we received
different information about procedures and policies. As evident from our analyses in Chapters 2
and 3, there are clear differences among counties in terms of how economic sanctions are paid
and tracked.
Suggestion. Part of the reason offenders do not understand the economic sanctions they
are expected to pay is that in the counties there are few individuals who know everything that
needs to be known about economic sanctions. In our conversations with staff, we received
multiple answers regarding what a certain economic sanction was (especially for many of the
ones that were acronyms), and whether it was paid to the state, county, municipality, or private
agency. The incomplete and conflicting information we received suggests that offenders who
wanted to know what a payment was for would not be able to receive a correct answer. We think
it would be helpful if each county had a list explaining all of the possible economic sanctions
that could be imposed, as well as a clear description of the policies and procedures operating in
the county.
Future Analyses
In the next several months we plan to continue analyzing the adult and juvenile data we

126
collected from court records and probation files. In particular, we will be conducting additional
multivariate analyses, testing factors such as exposure time and specific county-level practices.
127
References
Administrative Office of the Courts. (no date). Bringing criminal debt into balance: Improving
fine and restitution collection. NCJ 168418. Washington, DC: Author.
Alexander, D., Montgomery, J., Hamilton, G., Dutton, D. W., Griswold, R. R., Russell, J. R.,
Salo, R. J., & Muse, M. K. (1998). Fines and restitution: Improvement needed in how
offenders‟ payment schedules are determined. Washington, DC: U.S. General
Accounting Office.
Allen, G. F., & Treger, H. (1994, June). Fines and restitution orders: Probationers‟ perceptions.
Federal Probation, 58, 34-40.
Apospori, E., & Alpert, G. (1993). The role of differential experience with the criminal justice
system in changes in perceptions of severity of legal sanctions over time. Crime and
Delinquency, 39, 184-194.
Barnes, P. G. (1996, June). Making criminals pay. ABA Journal, 82, 20-21.
Bearden v. Georgia, 461 U.S. 660 (1983).
Beck, A. J., & Harrison, P. M. (2001). Prisoners in 2000. Bulletin NCJ 188207. Washington,
DC: Bureau of Justice Statistics.
Bergstrom, M. H. (2002). Survey of costs and fees in Pennsylvania. Report to the
Pennsylvania Commission on Sentencing, April, 2002.
Biewen, J. (2002, April 27). Asset forfeiture from drug-related arrests and how some
law enforcement agencies use the funds. Weekend Edition, National Public Radio.
(Transcript).
Black, D. (1976). The behavior of law. New York: Academic Press.
Blumenson, E., & Nilsen, E. (1998). Policing for profit: The drug war‟s hidden economic

128
agenda. University of Chicago Law Review, 65, 35-114.
Blumstein, A., Cohen, J., Martin, S. E., & Tonry, M. (1983). Research on sentencing: The
search for reform (vol. 1). Washington, DC: National Academy Press.
Bonczar, T. P. (1997). Characteristics of adults on probation, 1995. Washington, DC: U.S.
Department of Justice.
Brennan, P. A., & Mednick, S. A. (1994). Learning theory approach to the deterrence of
criminal recidivism. Journal of Abnormal Psychology, 103, 430-440.
Brickman, P. (1977). Crime and punishment in sports and society. Journal of Social Issues, 33,
140-164.
Bureau of Justice Statistics. (1997). Criminal victimization in the United States, 1994.
Washington, DC: U.S. Department of Justice.
Bureau of Justice Statistics. (2005). Criminal victimization in the United States, 2004.
http://www.ojp.usdoj.gov/bjs/abstract/cv04.htm, accessed September 28, 2005.
Butterfield, F. (2004, August 13). Many local officials now make inmates pay their own way.
New York Times, A1, A17.
Campbell, A. W. (1991). Law of sentencing (2nd
ed.). Deerfield, IL: Clark Boardman.
Casale, S. S. G., & Hillsman, S. T. (1986). The enforcement of fines as criminal
sanctions: The English experience and its relevance to American practice. Executive
summary. Washington, DC: National Institute of Justice.
Cherry, T. L. (2001). Financial patterns as an alternative criminal sanction: Evidence from
panel data. Atlantic Economic Journal, 29, 450-458.
Civil Asset Forfeiture Reform Act of 2000, Pub. L. No. 106-185, 114 Stat. 202 (2000).
Cohen, R. (1995). Probation and parole violation in state prison, 1991. Bureau of Justice

129
Statistics. Washington, DC:
Cole, G. F. (1992). Monetary sanctions: The problem of compliance. In J. M. Byrne, A. J.
Lurigio, & J. Petersilia (Eds.), Smart sentencing: The emergence of intermediate
sanctions (pp. 142-151). Newbury Park, CA: Sage.
Cole, G. F., Mahoney, B., Thornton, M., & Hanson, R. A. (1987). The practices and attitudes of
trial court judges regarding fines as a criminal sanction. Washington, DC: National
Institute of Justice.
Davis, R. C., & Lurigio, A. J. (1992). Compliance with court-ordered restitution: Who pays?
Perspectives, 16, 25-31.
Davis, R. C., & Smith, B. E. (1994). Victim impact statements and victim satisfaction: An
unfulfilled promise? Journal of Criminal Justice, 22, 1-12.
Durose, M. R., & Langan, P. A. (2003). Felony sentences in state courts, 2003. Bureau of
Justice Statistics Bulletin NCJ 198821. Washington, DC: U.S. Department of Justice.
Ellsworth, T., & Weisheit, R. A. (1997). The supervision and treatment of offenders on
probation: Understanding rural and urban differences. The Prison Journal, 77, 209-228.
Finn, P., & Parent, D. (1992). Making the offender foot the bill: A Texas program.
Washington, DC: National Institute of Justice.
Erez, E., & Tontodonato, P. (1990). The effect of victim participation in sentencing on sentence
outcome. Criminology, 28, 451-474.
Foa, U. G. (1971). Interpersonal and economic resources. Science, 171, 345-351.
Galaway, B., & Hudson, J. (1975). Restitution and rehabilitation: Some central issues. In J.
Hudson & B. Galaway (Eds.), Considering the victim: Readings in restitution and victim
compensation. Springfield, IL: Charles C. Thomas.

130
General Accounting Office. (1999). Federal courts: Differences exist in ordering fines and
restitution. Report to the Chairman, Senate Committee on the Judiciary, and the
Chairman, Subcommittee on Crime, House Committee on the Judiciary. Washington,
DC: U.S. General Accounting Office.
Gillespie, R. W. (1981). Sanctioning traditional crimes with fines: A comparative analysis.
International Journal of Comparative and Applied Criminal Justice, 5, 197-204.
Gillespie, R. W. (1988-89). Criminal fines: Do they pay? Justice System Journal, 13, 365-378.
Glaze, L. E. (2003). Probation and parole in the United States, 2002. Bureau of Justice
Statistics Bulletin NCJ 201135. Washington, DC: U.S. Department of Justice.
Gordon, M. A., & Glaser, D. (1991). The use and effects of financial penalties in municipal
courts. Criminology, 29, 651-676.
Gottfredson, M., & Gottfredson, D. (1988). Victim decisions to report a crime. In M.
Gottfredson (Ed.), Decision making in criminal justice: Toward the rational exercise of
discretion (pp. 15-78). Cambridge, MA: Ballinger.
Gray, M. K., Fields, M., & Maxwell, S. R. (2001). Examining probation violations: Who, what,
and when. Crime & Delinquency, 47, 537-557.
Groves, R. M., Fowler, F. J., Couper, M. P., Lepkowski, J. M., Singer, E., & Tourangeau, R.
(2004). Survey methodology. Hoboken, NJ: Wiley.
Harland, A. (1980). Restitution in criminal law. Albany, NY: Criminal Justice Research
Center, University at Albany.
Harland, A. T. (1981). Restitution to victims of personal and household crimes. Washington,
DC: Bureau of Justice Statistics.
Hillsman, S. (1990). Fines and day fines. In M. Tonry & N. Morris (Eds.), Crime and justice: A

131
review of research (vol. 12, pp. 49-98). Chicago: University of Chicago Press.
Hillsman, S., & Greene, J. A. (1992). The use of fines an intermediate sanction. In J. M. Byrne,
A. J. Lurigio, & J. Petersilia (Eds.), Smart sentencing: The emergence of intermediate
sanctions (pp. 123-141). Newbury Park, CA: Sage.
Hillsman, S. T., Mahoney, B., Cole, G. F., & Auchter, B. (1987). Fines as criminal sanctions.
National Institute of Justice Research in Brief. Washington, DC: U.S. Department of
Justice.
Hillsman, S., Sichel, J., & Mahoney, B. (1984). Fines in sentencing: A study of the use of the
fine as a criminal sanction. Washington, DC: National Institute of Justice.
Hindelang, M. J., Gottfredson, M. R, Dunn, C. S., & Parisi, N. (1977). Sourcebook of criminal
justice statistics – 1976. Albany, NY: Criminal Justice Research Center.
Hudson, J., & Chesney, S. (1977). Research on restitution: A review and assessment. In B.
Galaway & J. Hudson (Eds.), Offender restitution in theory and action Toronto:
Lexington.
Klein, A. R. (1997). Alternative sentencing: Intermediate sanctions and probation (2nd ed.).
Cincinnati: Anderson.
Landis, J. R., Merger, J. D., & Wolff, C. E. (1969). Success and failure of adult probationers in
California. Crime and Delinquency, 6, 34-40.
Langan, P. (1994). Between prison and probation: Intermediate sanctions. Science, 264, 791-793.
Leventhal, G. S. (1980). What should be done with equity theory? New approaches to the study
of fairness in social relationships. In K. J. Gergen, M. S. Greenberg, & R. H. Willis
(Eds.), Social exchange: Advances in theory and research (pp. 27-55). New York:
Plenum.

132
Levin, D. J., Langan, P. A., & Brown, J. M. (2000). State court sentencing of convicted felons, 1996.
NCJ 175708. Washington, DC: Bureau of Justice Statistics.
Lind, E. A., & Tyler, T. R. (1988). The social psychology of procedural justice. New York:
Plenum.
Lurigio, A. (1984). The relationship between offender characteristics and fulfillment of financial
restitution. Chicago: Cook County Adult Probation Department.
Lurigio, A. J., & Davis, R. C. (1990). Does a threatening letter increase compliance with restitution
orders?: A field experiment. Crime and Delinquency, 36, 537-548.
Major, B. (1994). From social inequality to personal entitlement: The role of social
comparisons, legitimacy appraisals, and group membership. In M. Zanna (Ed.),
Advances in Experimental Social Psychology (vol. 26, pp. 293-355). San Diego:
Academic Press.
McClelland, K. A., & Alpert, G. P. (1985). Factor analysis applied to magnitude estimates of
punishment seriousness: Patterns of individual differences. Journal of Quantitative
Criminology, 1, 307-318.
McCord, J. (1985). Deterrence and the light touch of the law. In D. P. Farrington & J. Gunn
(Eds.), Reactions to crime: The public, the police, courts, and prisons (pp. 73-85). New
York: Wiley.
McGillis, D. (1986). Crime victim restitution: An analysis of approaches. Washington, DC:
National Institute of Justice.
Mendoza, M., & Sullivan, C. (2006, March 19). Unpaid federal penalties add up to a fine mess.
Centre Daily Times, pp. A1, A6.

133
Meyer, J., & Gray, T. (1997). Drunk drivers in the courts: Legal and extra-legal factors
affecting pleas and sentences. Journal of Criminal Justice, 25, 155-163.
Miller, T. (1981). Consequences of restitution. Law and Human Behavior, 5, 1-8.
Morgan, K. D. (1994). Factors associated with probation outcome. Journal of Criminal Justice,
22, 341-353.
Morgan, K. D. (1995). Officer attitudes about supervision fee collection in Alabama. Federal
Probation, 59(4), 62-65.
Morris, N., & Tonry, M. (1990). Between prison and probation: Intermediate punishments in a
rational sentencing system. New York: Oxford University Press.
National Advisory Commission on Criminal Justice Standards and Goals. Report on corrections.
Washington, DC: U.S. Government Printing Office.
Office for Victims of Crime. (1998). New directions from the field: Victims’ rights and services
for the 21st century. Washington, DC: U.S. Department of Justice.
Olson, D. E., & Ramker, G. F. (2001). Crime does not pay, but criminals may: Factors
influencing the imposition and collection of probation fees. Justice System Journal, 22,
29-46.
Olson, D. E., Weisheit, R. A., & Ellsworth, T. (2001). Getting down to business: A comparison of
rural and urban probationers, probation sentences, and probation outcomes. Journal of
Contemporary Criminal Justice, 17, 4-18.
Orth, U. (2003). Punishment goals of crime victims. Law and Human Behavior, 27, 173-186.
Outlaw, M. C., & Ruback, R. B. (1999). Predictors and outcomes of victim restitution orders.
Justice Quarterly, 16, 847-869.

134
Outlaw, M., Ruback, R. B., & Britt, C. (2002). Repeat and multiple victimizations: The role of
individual and contextual factors. Violence and Victims, 17, 187-204.
Percy, S. L. (1980). Response time and citizen evaluation of police. Journal of Police Science
and Administration, 8, 75-86.
Petersilia, J. (1985). Community supervision: Trends and critical issues. Crime and
Delinquency, 31, 339-347.
Petersilia, J. (1997). Probation in the United States. In M. Tonry (Ed.), Crime and justice: A
review of research (vol. 22, pp. 149-200). Chicago: University of Chicago Press.
Petersilia, J., & Deschenes, E. P. (1994). Perceptions of punishment: Inmates and staff rank the
severity of prison versus intermediate sanctions. The Prison Journal, 74, 306-328.
Petersilia, J., & Turner, S. (1993). Intensive probation and parole. In M. Tonry (Ed.), Crime and
justice: A review of research (vol. 17, pp. 281-335). Chicago: University of Chicago Press.
Poister, T. H., & McDavid, J. C. (1978). Victims‟ evaluation of police performance. Journal of
Criminal Justice, 6, 133-149.
President‟s Task Force on Victims of Crime. (1982). Final report. Washington, DC: Author.
Rothman, D. J. (1971). The discovery of the asylum: Social order and disorder the new republic.
Rothman, D. J. (1971). The discovery of the asylum: Social order and disorder the new republic.
Boston: Little, Brown.
Ruback, R. B. (2004, June). Economic sanctions in Philadelphia. Federal Probation, 21-26.
Ruback, R. B., & Bergstrom, M. (2006). Economic sanctions in criminal justice: Purposes, effects,
and implications. Criminal Justice and Behavior, 33, 242-273.
Ruback, R. B., Menard, K. S., Outlaw, M. S., & Shaffer, J. N. (1999). Normative advice to
campus crime victims: Effects of gender, age, and alcohol. Violence and Victims, 14,

135
381-396.
Ruback, R. B., Ruth, G. R., & Shaffer, J. R. (2005). Assessing the impact of statutory change:
A statewide multilevel analysis of restitution orders in Pennsylvania. Crime and
Delinquency, 51, 318-342.
Ruback, R. B., Shaffer, J. R., & Logue, M. A. (2004). The imposition and effects of restitution
in four Pennsylvania counties. Crime and Delinquency, 50, 168-188.
Ruback, R. B., & Shaffer, J. N. (200). The role of victim-related factors in victim restitution: A
multi-method analysis of restitution in Pennsylvania. Law and Human Behavior, 29,
657-681.
Ryan, J. P. (1980). Adjudication and sentencing in a misdemeanor court: The outcome is the
punishment. Law and Society Review, 15, 79-108.
Schonert-Reichl, K., & Muller, J. (1996). Correlates of help-seeking in adolescence. Journal of
Youth and Adolescence, 25, 705-731.
Shapiro, C. (1990). Is restitution legislation the chameleon of the victims‟ movement? In B. Galway
& J. Hudson (Eds.), Criminal justice, restitution, and reconciliation (pp. 73-80). Monsey, NY:
Willow Tree Press.
Shapland, J. (1983). Victim-witness services and the needs of the victim. Victimology, 8, 233-
237.
Sims, B., & Jones, M. (1997). Predicting success or failure on probation: Factors associated
with felony probation outcomes. Crime and Delinquency, 43, 314-327.
Skogan, W. G. (1984). Reporting crimes to the police: The status of world research. Journal of
Research in Crime and Delinquency, 21, 113-137.
Smith, B., Davis, R., & Hillenbrand, S. (1989). Improving enforcement of court-ordered

136
restitution. Chicago: American Bar Association.
Spaulding, K. R. (1989). „Hit them where it hurts‟: RICO criminal forfeitures and white-collar crime.
Journal of Criminal Law and Criminology, 80, 197-292.
Spelman, W. (1995). The severity of intermediate sanctions. Journal of Research in Crime and
Delinquency, 32, 107-135.
Sweeney, P. D., & McFarlin, D. B. (1997). Process and outcome: Gender differences in the
assessment of justice. Journal of Organizational Behavior, 18, 83-98.
Tamres, L. K., Janicki, D., & Helgeson, V. S. (2002). Sex differences in coping behavior: A
meta-analytic review and an examination of relative 6, 2-30.
Taylor v. Rhode Island, 101 F.3d 780 (1st Cir. 1996).
Tonry, M., & Lynch, M. (1996). Intermediate sanctions. In M. Tonry (Ed.), Crime and justice: A
review of research (vol. 20, pp. 99-144). Chicago: University of Chicago Press.
Tyler, T. R. (1988). What is procedural justice? Criteria used by citizens to assess the fairness
of legal procedures. Law and Society Review, 22, 103-136.
United States v. Bajakajian, 524 U.S. 321 (1998).
United States v. Ursery, 518 U.S. 267 (1996).
van den Bos, K, Lind, E. A., Vermunt, R., & Wilke, H. A. M. (1997). How do I judge my
outcome when I do not know the outcome of others? The psychology of the fair process
effect. Journal of Personality and Social Psychology, 72, 1034-1046.
van den Bos, K., Wilke, H. A. M., Lind, E. A., & Vermunt, R. A. (1998). Evaluating outcomes
by means of the fair process effect: Evidence for different processes in fairness and
satisfaction judgments. Journal of Personality and Social Psychology, 74, 1493-1503.
Van Voorhis, P. (1985). Restitution outcome and probationers‟ assessments of restitution: The
137
effects of moral development. Criminal Justice and Behavior, 12, 259-287.
Waldfogel, J. (1995). Are fines and prison terms used efficiently? Evidence on federal fraud offenders.
Journal of Law and Economics, 38, 107-139.
Walklate, S. (1997). Risk and criminal victimization: A modernist dilemma? British Journal of
Criminology, 37, 35-45.
Weisheit, R. A., Wells, L. E., & Falcone, D. N. (1995). Crime and policing in rural and small-
town America: An overview of the issues. Washington, D.C.: Bureau of Justice
Statistics.
Wheeler, G. R., Hissong, R. V., Slusher, M. P., & Macan, T. M. (1990). Economic sanctions in
criminal justice: Dilemma for human service? Justice System Journal, 14, 63-77.
Wheeler, G. R., & Rudolph, A. S. (1990). New strategies to improve probation officers‟ fee
collection rates: A field study in performance feedback. Justice System Journal, 14, 78-
94.
Williams, M. R. (2002). Civil asset forfeiture: Where does the money go? Criminal Justice
Review, 27, 321-329.
Young, W., & Brown, M. (1993). Cross-national comparisons of imprisonment. In M. Tonry (Ed.),
Crime and justice: A review of research (vol. 17, pp. 1-50). Chicago: University of Chicago
Press.
138
APPENDIX A
Adult Data Collection Forms
139
APPENDIX B
Juvenile Data Collection Forms

140
APPENDIX C
Complete List of Variables
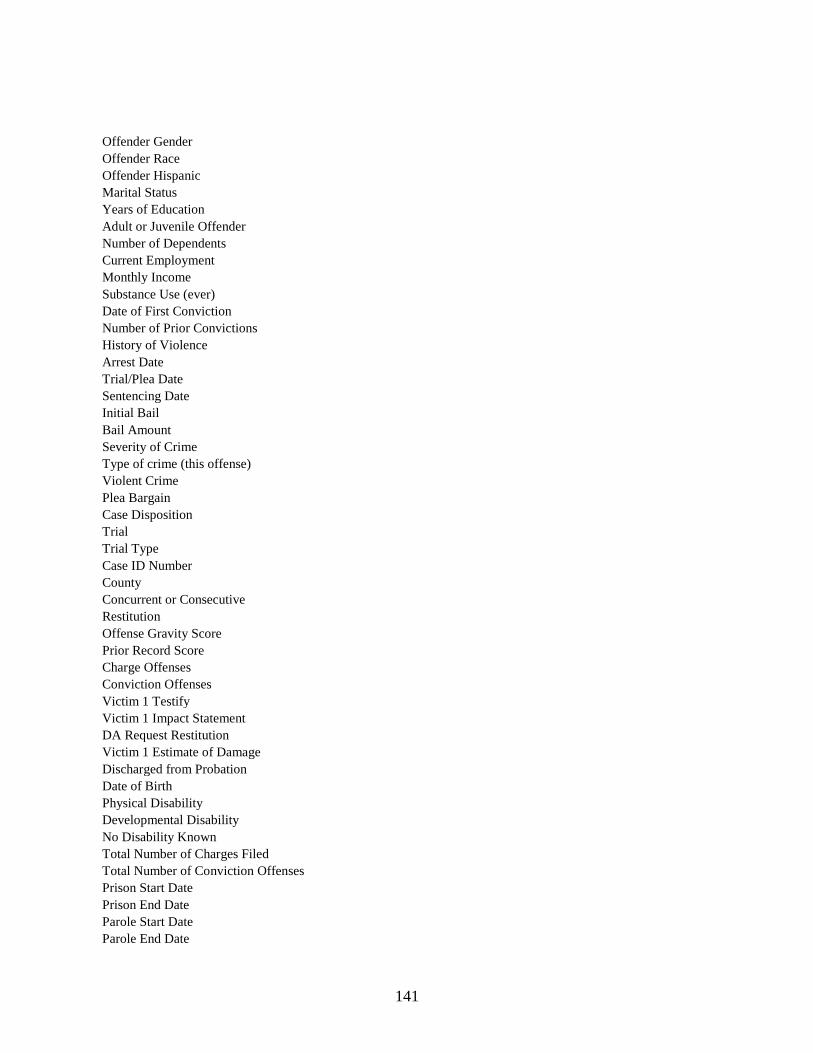
141
Offender Gender
Offender Race
Offender Hispanic
Marital Status
Years of Education
Adult or Juvenile Offender
Number of Dependents
Current Employment
Monthly Income
Substance Use (ever)
Date of First Conviction
Number of Prior Convictions
History of Violence
Arrest Date
Trial/Plea Date
Sentencing Date
Initial Bail
Bail Amount
Severity of Crime
Type of crime (this offense)
Violent Crime
Plea Bargain
Case Disposition
Trial
Trial Type
Case ID Number
County
Concurrent or Consecutive
Restitution
Offense Gravity Score
Prior Record Score
Charge Offenses
Conviction Offenses
Victim 1 Testify
Victim 1 Impact Statement
DA Request Restitution
Victim 1 Estimate of Damage
Discharged from Probation
Date of Birth
Physical Disability
Developmental Disability
No Disability Known
Total Number of Charges Filed
Total Number of Conviction Offenses
Prison Start Date
Prison End Date
Parole Start Date
Parole End Date

142
Probation Start Date
Probation End Date
SID #
SSN
Victim 1 Gender
Victim 1 Adult Status
Physical Injury Victim 1
Psychological Injury Victim 1
Property Injury Victim 1
Victim 2 Gender
Victim 2 Status
Victim 2 Testify
Victim 2 Impact Statement
DA Request Restitution
Physical Injury Victim 2
Psychological Injury Victim 2
Property Injury Victim 2
Victim 2 Estimate of Damage
Victim 3 Gender
Victim 3 Status
Victim 3 Testify
Victim 3 Impact Statement
DA Request Restitution
Physical Injury Victim 3
Psychological Injury Victim 3
Property Injury Victim 3
Victim 3 Estimate of Damage
Original Total Amount Ordered
Total Paid to Date
No. of Payments Made
Amount of Restitution Ordered
Amount of Restitution Paid
Number of Prior Victims Being Paid Restitution
Amount of County Fines Ordered
Amount of County Fines Paid
Date of 1st Warning Letter
Number of Warning Letters
Date Supervision Violated
Rearrest Date
Revocation Date
Rearrest
Revoked
Adult Probation File
Alcohol
Cocaine
Crack
Heroin
Marijuana
Meth
Other Drug

143
RIP Start Date
RIP End Date
Day Reporting w/Probation
Inpatient Drug/Alcohol Treatment
Electronic Monitoring/House Arrest
Intensive Supervision
Halfway/Rehab Center
Work Release
Other RIP Program
Community Service
Individualized Services/Counseling
Drug Testing
Outpatient Drug/Alcohol Treatment
Fines
Religion
Child Support
Monthly Amount of Child Suport
Additional Restitution Ordered?
Amount of additional restitution
Case Data Entry Complete
Offense Date
Payment Complete
Summary Appeal
Original Amount Reduced
Amount of Reduction One
Type of Reduction One
Amount of Reduction Two
Amount of Reduction Three
Type of Reduction Two
Type of Reduction Three
Number of Reductions
Summary Appeal Denied
Number of Kids
Accelerated Rehabilitative Disposition
Alcohol Safe Driv. Course/Act 122
Probation Extended
Sent to Prison/Jail
Imprisoned on Other Offense
Contempt for Nonpayment
Contempt Date
Years of State Minimum Sentence
Months of State Minimum Sentence
Days of State Minimum Sentence
Years of State Maximum Sentence
Months of State Maximum Sentence
Days of State Maximum Sentence
Years of County Minimum Sentence
Months of County Minimum Sentence
Days of County Minimum Sentence
Years of County Maximum Sentence

144
Months of County Maximum Sentence
Days of County Maximum Sentence
Years of RIP
Months of RIP
Days of RIP
Years of Probation
Months of Probation
Days of Probation
Years Probation Extended
Months Probation Extended
Days Probation Extended
Years of Credit Time
Months of Credit Time
Days of Credit Time
Computer
Amount of County Supervision Ordered
Amount of County Supervision Paid
Total Number of Victims (across cases to date)
Total Amount Ordered
Total Amount Paid Overall
Total Number of Cases being Paid
Docket File
Mental Health
Impaired Driver Program (IDP)
Hours of Community Service
Judicial Computer Program
CAT (Catastrophic Loss) Fund
EMS
Crime Comm. Cost (CCC)/VWS
Domes Violence Comp Act 44
Act 167 State Costs
Crime Lab User Fee
Firearm Education Cost FET (Act 158)
Witness Fee
Prior Law - State Cost (A)
Subpeona
Insurance Fee
Electronic Monitoring
Central Processing (CP) Cost
Amount of Court Costs Ordered
District Attorney (DA)
Sheriff (SH)
Amount of Other Fee 1
Amount of Other Fee 2
Amount of Other Fee 3
Batterers Intervention Prog
Total Number of Cases Ever Paid
Victim Witness File
Probation Case Number
Automation Fee

145
DA Administration Fee
Amount of State Supervision Ordered
Amount of State Supervision Paid
Impaired Driver/DUI School
Plea
DUI Prison Management
DUI Drug/Alcohol
State DUI
DUI Booking Fee
Prison Fee
Amount of State Fines Ordered
Amount of State Fines Paid
Annual Income
Total Amount Due
Weekly Income
Amount of Other Fee 4
Offender's age at time of sentencing
Percent of Case Paid to Date
Percent of Restitution Paid to Date
Restitution Payment Complete
Violated Probation or Parole
CVC Paid Restitution?
Total Amount of CVC Restitution Ordered
Total Amount of CVC Restitution Paid
Amount of Victim Compensation Ordered
Amount of Victim Compensation Paid to Date
CCC/VWS Amount Paid
Date Completed
Amount of Restitution Paid
Victim Req Notification
Victim Req Notification
Victim Req Notification
Bail Reduced
Type of Victim 1
Type of Victim 2
Type of Victim 3
Total Due to Date (this case)
Reduced To
Reduced To
Reduced To
Total Amount Reduced By
Total Amount Reduced To
Amount of Restitution Due
Total Amount of CVC Restitution Due
Amount of County Fines Due
Amount of State Fines Due
Amount of Fines Ordered
Amount of Fines Paid
Amount of Fines Due
Amount of County Supervision Fees Due
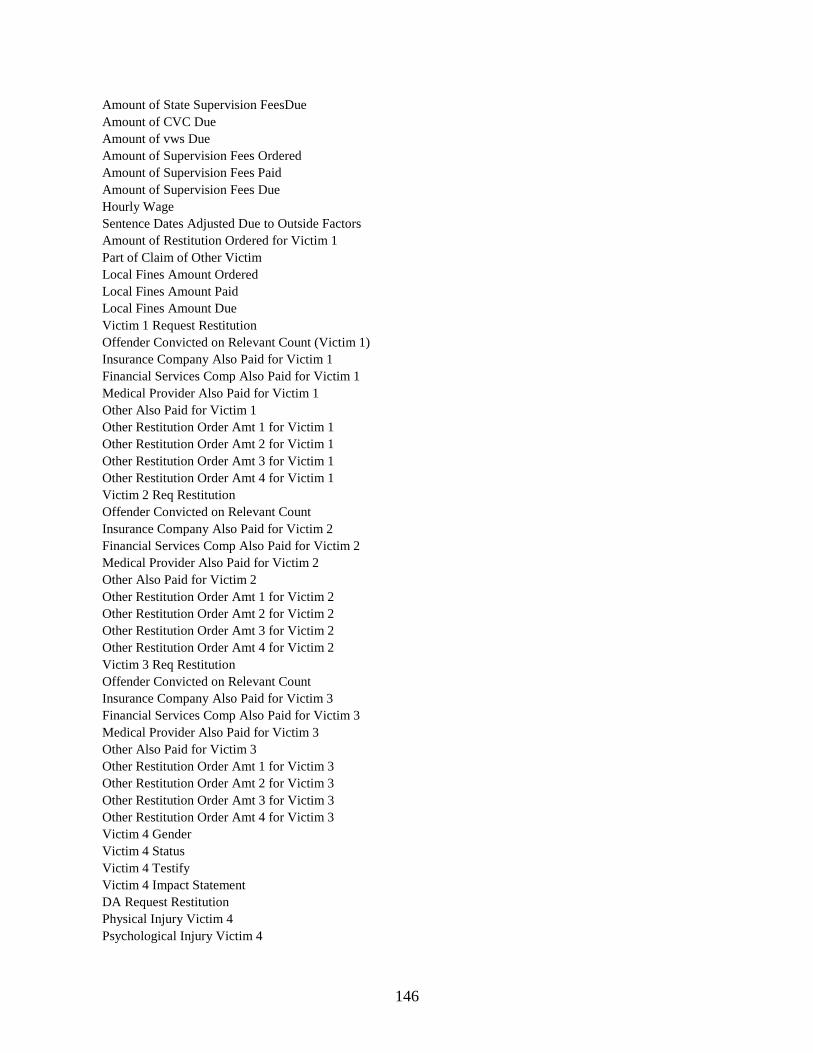
146
Amount of State Supervision FeesDue
Amount of CVC Due
Amount of vws Due
Amount of Supervision Fees Ordered
Amount of Supervision Fees Paid
Amount of Supervision Fees Due
Hourly Wage
Sentence Dates Adjusted Due to Outside Factors
Amount of Restitution Ordered for Victim 1
Part of Claim of Other Victim
Local Fines Amount Ordered
Local Fines Amount Paid
Local Fines Amount Due
Victim 1 Request Restitution
Offender Convicted on Relevant Count (Victim 1)
Insurance Company Also Paid for Victim 1
Financial Services Comp Also Paid for Victim 1
Medical Provider Also Paid for Victim 1
Other Also Paid for Victim 1
Other Restitution Order Amt 1 for Victim 1
Other Restitution Order Amt 2 for Victim 1
Other Restitution Order Amt 3 for Victim 1
Other Restitution Order Amt 4 for Victim 1
Victim 2 Req Restitution
Offender Convicted on Relevant Count
Insurance Company Also Paid for Victim 2
Financial Services Comp Also Paid for Victim 2
Medical Provider Also Paid for Victim 2
Other Also Paid for Victim 2
Other Restitution Order Amt 1 for Victim 2
Other Restitution Order Amt 2 for Victim 2
Other Restitution Order Amt 3 for Victim 2
Other Restitution Order Amt 4 for Victim 2
Victim 3 Req Restitution
Offender Convicted on Relevant Count
Insurance Company Also Paid for Victim 3
Financial Services Comp Also Paid for Victim 3
Medical Provider Also Paid for Victim 3
Other Also Paid for Victim 3
Other Restitution Order Amt 1 for Victim 3
Other Restitution Order Amt 2 for Victim 3
Other Restitution Order Amt 3 for Victim 3
Other Restitution Order Amt 4 for Victim 3
Victim 4 Gender
Victim 4 Status
Victim 4 Testify
Victim 4 Impact Statement
DA Request Restitution
Physical Injury Victim 4
Psychological Injury Victim 4

147
Property Injury Victim 4
Victim 4 Estimate of Damage
Victim Req Notification
Type of Victim 4
Victim 4 Req Restitution
Offender Convicted on Relevant Count
Insurance Company Also Paid for Victim 4
Financial Services Comp Also Paid for Victim 4
Medical Provider Also Paid for Victim 4
Other Also Paid for Victim 4
Other Restitution Order Amt 1 for Victim 4
Other Restitution Order Amt 2 for Victim 4
Other Restitution Order Amt 3 for Victim 4
Other Restitution Order Amt 4 for Victim 4
Victim 5 Gender
Victim 5 Status
Victim 5 Testify
Victim 5 Impact Statement
DA Request Restitution
Physical Injury Victim 5
Psychological Injury Victim 5
Property Injury Victim 5
Victim 5 Estimate of Damage
Victim 5 Req Notification
Type of Victim 5
Victim 5 Req Restitution
Offender Convicted on Relevant Count
Insurance Company Also Paid for Victim 5
Financial Services Comp Also Paid for Victim 5
Medical Provider Also Paid for Victim 5
Other Also Paid for Victim 5
Other Restitution Order Amt 1 for Victim 5
Other Restitution Order Amt 2 for Victim 5
Other Restitution Order Amt 3 for Victim 5
Other Restitution Order Amt 4 for Victim 5
Victim 6 Gender
Victim 6 Status
Victim 6 Testify
Victim 6 Impact Statement
DA Request Restitution
Physical Injury Victim 6
Psychological Injury Victim 6
Property Injury Victim 6
Victim 6 Estimate of Damage
Victim 6 Req Notification
Type of Victim 6
Victim 6 Req Restitution
Offender Convicted on Relevant Count
Insurance Company Also Paid for Victim 6
Financial Services Comp Also Paid for Victim 6
148
Medical Provider Also Paid for Victim 6
Other Also Paid for Victim 6
Other Restitution Order Amt 1 for Victim 6
Other Restitution Order Amt 2 for Victim 6
Other Restitution Order Amt 3 for Victim 6
Other Restitution Order Amt 4 for Victim 6
Victim 7 Gender
Victim 7 Status
Victim 7 Testify
Victim 7 Impact Statement
DA Request Restitution
Physical Injury Victim 7
Psychological Injury Victim 7
Property Injury Victim 7
Victim 7 Estimate of Damage
Victim 7 Req Notification
Type of Victim 7
Victim 7 Req Restitution
Offender Convicted on Relevant Count
Insurance Company Also Paid for Victim 7
Financial Services Comp Also Paid for Victim 7
Medical Provider Also Paid for Victim 7
Other Also Paid for Victim 7
Other Restitution Order Amt 1 for Victim 7
Other Restitution Order Amt 2 for Victim 7
Other Restitution Order Amt 3 for Victim 7
Other Restitution Order Amt 4 for Victim 7
Victim 8 Gender
Victim 8 Status
Victim 8 Testify
Victim 8 Impact Statement
DA Request Restitution
Physical Injury Victim 8
Psychological Injury Victim 8
Property Injury Victim 8
Victim 8 Estimate of Damage
Victim 8 Req Notification
Type of Victim 8
Victim 8 Req Restitution
Offender Convicted on Relevant Count
Insurance Company Also Paid for Victim 8
Financial Services Comp Also Paid for Victim 8
Medical Provider Also Paid for Victim 8
Other Also Paid for Victim 8
Other Restitution Order Amt 1 for Victim 8
Other Restitution Order Amt 2 for Victim 8
Other Restitution Order Amt 3 for Victim 8
Other Restitution Order Amt 4 for Victim 8
Victim 9 Gender
Victim 9 Status

149
Victim 9 Testify
Victim 9 Impact Statement
DA Request Restitution
Physical Injury Victim 9
Psychological Injury Victim 9
Property Injury Victim 9
Victim 9 Estimate of Damage
Victim 9 Req Notification
Type of Victim 9
Victim 9 Req Restitution
Offender Convicted on Relevant Count
Insurance Company Also Paid for Victim 9
Financial Services Comp Also Paid for Victim 9
Medical Provider Also Paid for Victim 9
Other Also Paid for Victim 9
Other Restitution Order Amt 1 for Victim 9
Other Restitution Order Amt 2 for Victim 9
Other Restitution Order Amt 3 for Victim 9
Other Restitution Order Amt 4 for Victim 9
Victim 10 Gender
Victim 10 Status
Victim 10 Testify
Victim 10 Impact Statement
DA Request Restitution
Physical Injury Victim 10
Psychological Injury Victim 10
Property Injury Victim 10
Victim 10 Estimate of Damage
Victim 10 Req Notification
Type of Victim 10
Victim 10 Req Restitution
Offender Convicted on Relevant Count
Insurance Company Also Paid for Victim 10
Financial Services Comp Also Paid for Victim 10
Medical Provider Also Paid for Victim 10
Other Also Paid for Victim 10
Other Restitution Order Amt 1 for Victim 10
Other Restitution Order Amt 2 for Victim 10
Other Restitution Order Amt 3 for Victim 10
Other Restitution Order Amt 4 for Victim 10
# of Victims Being Paid Restitution on Current Case

150
APPENDIX D
Blair County

151
Collection of Economic Sanctions
Adult Data
Organization of collections and supervision. Blair County has a separate Fines and
Costs Office that is responsible for the collection of all economic sanctions. After the Clerk of
Courts/Prothonotary‟s Office determines the amount of money defendants owe, the Fines and
Costs Office disburses the money. Although the Clerk of Courts receives bail payments, the
Fines and Costs Office collects all other payments directly. We did not collect information from
their files, but the Fines and Costs Office has records (organized by offender) dating back to
1968.
Validity of the data. The Clerk of Courts/Prothonotary‟s Office began keeping
computer records in January of 1989, but converted to a new computer system in 1997. In some
cases, fines and costs information did not transfer over to the new system. As a result, the
economic sanctions information we recorded is actually an underestimate. Information about
economic sanctions also may have been inaccurate because staff members entered payments into
the computer in groups, rather than as they were received. The Clerk of Courts/Prothonotary‟s
Office was very behind in terms of inputting data into the computer. For cases from the past 2-3
years (at the time of our data collection), information may be missing because it had not been
entered into the computer.
For all cases prior to 1997, only the economic sanctions information (e.g., fines, fees,
costs, and restitution) was correct. Thus, we could not accurately assess the offender‟s prior
convictions in these cases. Instead, we calculated the offender‟s prior convictions based on the
offender‟s convictions after 1997. In some cases, however, we were able to obtain complete
conviction information from the District Attorney‟s files.

152
Order of payment. Each time a defendant makes a payment, 50% goes toward
restitution and 50% goes toward the payment of other fines, fees, and costs. According to the
Fines and Costs Office, older cases are paid before recent ones and individual victims are paid
before businesses. However, staff members informed us that judges sometimes issued court
orders mandating that a particular victim receive payment first.
Procedures used in the event of nonpayment. In Blair County, the adult probation
office may discharge from active supervision offenders who still owe money to the Fines and
Costs Office. However, offenders who fail to complete their payments upon release are sent to
contempt court, where a judge then issues a decision on the matter. Private collections agencies
are never used in Blair County.
Method
Sampling. We began our data collection in the adult probation office in Blair County.
Probation files were organized by the offender‟s name, rather than by docket number or year, as
in the other counties. Because we could not check for missing cases without first knowing which
docket numbers would be included in our sample, we had to draw the sample first. Once we
knew which docket numbers would be included in our sample, we searched the Clerk of
Courts/Prothonotary‟s computer records to find the names of the offenders that corresponded to
those docket numbers. After completing this process, we could then check for missing cases.
Given the amount of time this procedure took, we did not check for missing cases. However,
once data collection began we found that there were rarely any missing cases.
Data collection. Data collection began in early September of 2003 and continued
through April of 2004. We collected data from paper and computer files in both the Adult
Probation Office and the Clerk of Courts/Prothonotary‟s Office.

153
Probation paper and computer files and Clerk of Courts/Prothonotary paper and computer
files provided only limited information about victims. As a result, we contacted the
Victim/Witness Office to obtain information about victims. However, the Victim/Witness Office
in Blair County did not exist until the year 2000. Because the office did not start keeping track
of restitution until after the year 2000, we collected data about victims from the District
Attorney‟s files. We recorded information about only those victims ordered restitution. When
available, we also recorded the total number of victims not ordered restitution (i.e., the number
of victims who were given the opportunity to request restitution but chose not to do so). The
District Attorney informed us that judges in Blair County typically do not order restitution to
insurance companies.
Results
Adult Data
Table D-1 describes the total amount of economic sanctions ordered and the percent paid
for both the current case and across all cases. Across both models, the total amount of economic
sanctions imposed was significantly higher for offenders incarcerated in prison. Furthermore,
the percent of economic sanctions paid was significantly higher for offenders convicted of
personal, drug, or traffic offenses and for non-incarcerated offenders.
Table D-1. Regression Analyses Predicting the Total Amount of Economic Sanctions Ordered and the Percent Paid
in Blair County
Total Current Case Total All Cases
Ordered % Paid Ordered % Paid
Mean 1304.93 56.59 4470.11 57.43
Mean n 405 405 409 409
Summary -325.54 3.84 -10.96 6.50
Felony 419.65 -4.54 850.67 -2.20
Personal -335.43 18.55** -2861.21** 21.12**
Drug -296.45 15.54* -2981.17** 16.47*
Traffic 266.48 46.08*** -4840.44*** 45.78***
Other Offense -89.66 23.58** -2467.60* 22.08**

154
Prison 2589.97* -33.36** 7435.85*** -37.10**
Jail -38.37 -27.71*** 2990.82** -27.65***
RIP -59.83 -9.08 3089.76* -9.61
No Sentence -459.95 -3.22 -497.36 -4.32
Non-White 1171.72* -8.27 -286.60 -5.56
Age 3.82 0.21 -45.1252 0.28
Male 43.69 6.34a 494.4561 5.04
Constant 1073.46 34.28*** 6876.5*** 33.39***
R2 0.06 0.22 0.16 0.24
n 372 371 374 374
*p<.05, **p<.01, ***p<.001 ap<.10
Table D-2 describes the total amount of fines, costs and fees, and restitution ordered. The
results show that the total amount of fines ordered was significantly higher for offenders
incarcerated in prison. The total amount of costs and fees ordered was significantly higher for
offenders convicted of a misdemeanor, for offenders incarcerated in jail or sentenced to RIP, and
for non-white offenders. The total amount of restitution ordered was significantly higher for
offenders convicted of a felony and significantly lower for offenders convicted of a drug offense.
Table D-2 also describes the percent of fines and restitution paid. The results show that the
percent of fines and restitution paid was significantly higher for offenders convicted of personal
or traffic offenses and significantly lower for offenders incarcerated in jail.
Table D-2. Regression Analyses Predicting the Total Amount of Fines, Costs and Fees, and Restitution Ordered and
the Percent Paid in Blair County
Fines Costs and Fees Restitution
Ordered % Paid Total
Ordered
State
Ordered
County
Ordered
Ordered % Paid
Mean 402.22 56.03 438.14 189.29 366.85 847.5 59.65
Mean n 371 368 404 400 405 195 191
Summary -34.93 -22.21 -19.19 -56.96 -18.94 -244.87 16.99
Felony -212.37 2.20 -351.95* 43.33 -264.54a 810.53* 1.17
Personal -185.85 31.16** 158.74 0.72 151.02 -304.50 25.67*
Drug 517.49 23.55a -94.19 1.87 -124.85 -666.92* 10.39
Traffic 214.49 52.52*** 80.61 281.19*** 0.45 -195.14 45.64***
Other Offense 144.51 48.28*** -177.79 35.85 -180.25 -24.75 19.30
Prison 3561.17*** -41.54a 411.06 -38.79 242.52 -835.68 -29.22
a
Jail 62.49 -28.90** 372.07** 101.58 241.10a -458.97
a -23.34*
RIP -125.07 -7.20 493.60* 33.40 331.95a -407.54 -7.22
No Sentence -42.64 19.39a -209.64 -56.56 -251.06
a -163.56 -13.54

155
Non-White 711.35 -13.65 489.59** -40.27 536.35** 31.59 -12.63
Age 2.59 0.41 -2.20 0.73 -2.10 4.46 0.26
Male 152.01 13.16 -33.76 27.17 -13.85 -116.75 9.77
Constant -112.01 11.86 465.60* 62.35 438.54* 629.32a 35.83**
R2 0.09 0.12 0.12 0.12 0.09 0.04 0.27
n 374 336 376 373 373 376 185
*p<.05, **p<.01, ***p<.001 ap<.10
Table D-3 describes the imposition of supervision fees, CVC, and CCC. The results
show that the total amount of supervision fees ordered was significantly higher for offenders
convicted of a traffic offense. CVC and CCC were less likely to be imposed when the offender
was convicted of a traffic offense and were more likely to be imposed when the offender was
incarcerated in jail. The results also show that although CVC and CCC were ordered in more
than 90% of all cases, offenders paid these economic sanctions only about half the time.
Table D-3. Regression Analyses Predicting the Total Amount of Supervision Fees, CVC, and CCC Ordered and the
Percent Paid in Blair County
Supervision Fees
Ordered
CVC CCC
If Ordered Paid in Full If Ordered Paid in Full
Mean 237.02 93% 51% 91% 49%
Mean n 214 407 378 406 369
Summary -46.03 0.28 0.23 -0.22 -0.27
Felony 136.74a -0.36 -0.68 0.62 -0.64
Personal -9.00 -0.15 1.03** -0.31 1.02**
Drug -7.42 -1.04 1.12* -1.30 0.80a
Traffic 198.06** -2.65** 2.69*** -1.97* 2.63***
Other Offense 39.84 -0.46 1.44*** -0.29 1.36**
Prison -206.46 0.41 -6.85 -0.52 -6.84
Jail -0.60 2.30* -1.64*** 2.37* -1.71***
RIP -88.36 7.69 -0.66 6.94 -0.74
No Sentence -105.65 -1.23 -0.22 -0.77 -0.09
Non-White -1.65 -1.61* -0.55 -1.31a -0.45
Age 0.55 0.02 0.01 5.36 0.01
Male 24.42 -1.45 0.31 0.03 0.40
Constant 56.64 5.22** -0.97* -1.06** -0.94*
R2 0.06 3.66
n 373 372 357 355 349
*p<.05, **p<.01, ***p<.001 ap<.10

156
APPENDIX E
Centre County
157
Collection of Economic Sanctions
Adult and Juvenile Data
Organization of collections and supervision. Centre County has a combined adult and
juvenile probation and parole department. The county does not have a specialized collections
unit and does not use specialized probation officers to collect economic sanctions. However,
they do have one full-time staff member in the probation department dedicated to the tracking of
economic sanctions. Probation staff members are very proud of their collections record and they
believe they take it more seriously than do most other counties. In 2002, they collected $2.3
million, $524,000 of which was restitution to victims.
Because we were also interested in the efficiency of the payment process, we observed
the amount of time it took to process a payment. According to one staff member, the time it
takes to process a payment depends on the offender (i.e., on where the offender wants the money
to go). Although offenders may make payments in person or through the mail, we were able to
observe only payments made in person. Each time an offender came to the probation office to
make a payment, a staff member asked him/her about which case to apply the money. A staff
member informed us that although offenders have payment contracts that require them to pay a
specific amount of money each month, they can pay whatever amount they choose when they
come into the probation office. Only three offenders came into the probation office on the day
we observed, but the amount of time it took to process a payment ranged from 40 seconds to
three minutes and six seconds. In the latter case, however, a staff member was filling in for
someone who was out to lunch.
Validity of the data. The adult probation computer files go back as far as 1985.
Although all cases after November of 2000 are in the computer system, cases prior to November

158
of 2000 are only in the computer if their balances were not paid in full. As a result, convictions
from cases that were paid in full and were prior to November of 2000 are not included in the
prior convictions variable. Regarding juvenile offenders, Centre County has very few informal
adjustments because the District Attorney‟s Office does not like to use that option.
Order of payment. Before paying any other economic sanctions, offenders must pay
100% of restitution. If an offender is in jail or on work release, however, 15% of each payment
goes toward jail/institutional maintenance fees and the remainder goes to restitution. The
probation staff also told us that individual and business victims are paid restitution before
insurance companies. We were able to record information about only those victims ordered
restitution. Beyond jail/institutional maintenance fees and restitution, the payment order is quite
complex. In general, it appears that economic sanctions paid to the county are made before those
owed to the state.
Procedures used in the event of nonpayment. When offenders fail to make payments,
Centre County uses a four-stage process to collect the money they owe. First, the probation
office sends a reminder letter asking for payment. Second, the office sends a more severe letter
asking for payment. Third, the office sends a letter informing the offender that he/she has to
meet with the Director of Probation. Fourth, the probation department files contempt of court
charges. In contempt cases, judges often reduce the amount owed. These reductions are often
substantial because judges base their decision on the offender‟s ability to pay.
Additionally, Centre County does not use private collection agencies to collect money
owed on old cases. Instead, in the fall of 2002, the probation department went back through their
records and sent new letters to those who had not paid to put them back under scrutiny.
159
Method
Data collection. The researchers collected data in Centre County from June to
September of 2003. We collected information on adult cases from the Clerk of Courts paper
files and the county computer system, which was used by both the probation and Clerk of Courts
offices. These sources provided detailed information about charge and conviction offenses, the
sentence imposed, and the economic sanctions ordered and collected for each case. However,
we were not able to access the adult probation case files because many had been removed from
the probation office. Retrieving information from these files would have required large
quantities of time and resources. As a result, we were not able to collect detailed information
about offenders‟ backgrounds. To overcome this limitation, we used Clerk of Courts paper files
to find limited offender demographics, such as race and gender.
We collected all juvenile data from the juvenile probation computer system because the
Clerk of Courts paper files were sealed and most of the juvenile probation paper files were in
storage and unavailable. As a result, we were unable to obtain detailed background information
on juvenile offenders. However, most of the information we were searching for was stored in the
juvenile computer system. Additionally, the probation computer system contained information
for juvenile cases that were handled formally and informally.
Results
Adult Data
Table E-1 describes the total amount of economic sanctions ordered and the percent paid.
The results show that the total amount of economic sanctions imposed was significantly higher
for offenders convicted of a felony and for offenders convicted of a traffic offense. The percent
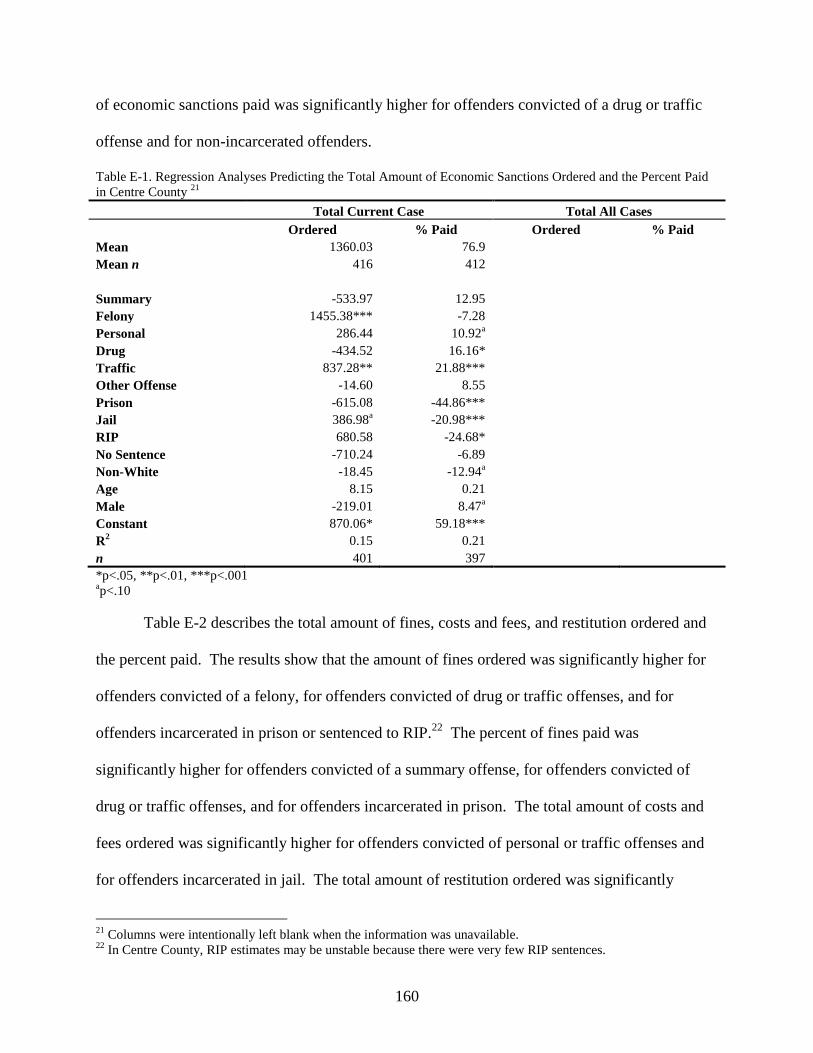
160
of economic sanctions paid was significantly higher for offenders convicted of a drug or traffic
offense and for non-incarcerated offenders.
Table E-1. Regression Analyses Predicting the Total Amount of Economic Sanctions Ordered and the Percent Paid
in Centre County 21
Total Current Case Total All Cases
Ordered % Paid Ordered % Paid
Mean 1360.03 76.9
Mean n 416 412
Summary -533.97 12.95
Felony 1455.38*** -7.28
Personal 286.44 10.92a
Drug -434.52 16.16*
Traffic 837.28** 21.88***
Other Offense -14.60 8.55
Prison -615.08 -44.86***
Jail 386.98a -20.98***
RIP 680.58 -24.68*
No Sentence -710.24 -6.89
Non-White -18.45 -12.94a
Age 8.15 0.21
Male -219.01 8.47a
Constant 870.06* 59.18***
R2 0.15 0.21
n 401 397
*p<.05, **p<.01, ***p<.001 ap<.10
Table E-2 describes the total amount of fines, costs and fees, and restitution ordered and
the percent paid. The results show that the amount of fines ordered was significantly higher for
offenders convicted of a felony, for offenders convicted of drug or traffic offenses, and for
offenders incarcerated in prison or sentenced to RIP.22
The percent of fines paid was
significantly higher for offenders convicted of a summary offense, for offenders convicted of
drug or traffic offenses, and for offenders incarcerated in prison. The total amount of costs and
fees ordered was significantly higher for offenders convicted of personal or traffic offenses and
for offenders incarcerated in jail. The total amount of restitution ordered was significantly
21
Columns were intentionally left blank when the information was unavailable. 22
In Centre County, RIP estimates may be unstable because there were very few RIP sentences.
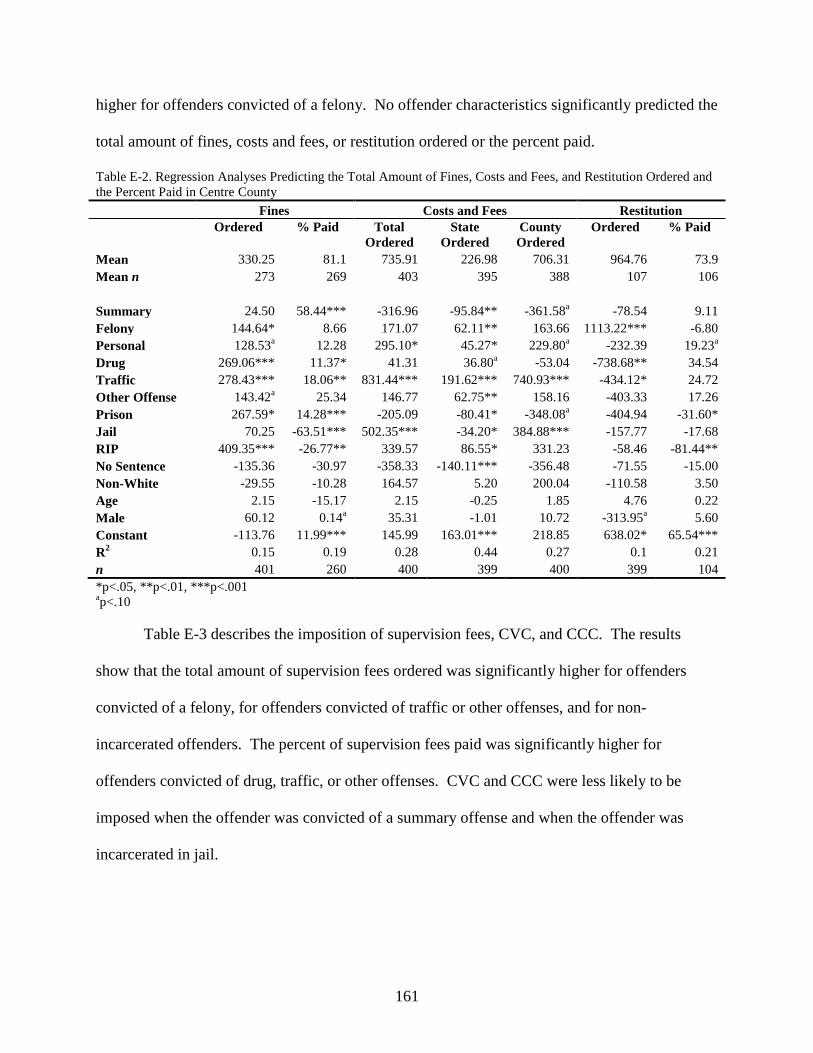
161
higher for offenders convicted of a felony. No offender characteristics significantly predicted the
total amount of fines, costs and fees, or restitution ordered or the percent paid.
Table E-2. Regression Analyses Predicting the Total Amount of Fines, Costs and Fees, and Restitution Ordered and
the Percent Paid in Centre County
Fines Costs and Fees Restitution
Ordered % Paid Total
Ordered
State
Ordered
County
Ordered
Ordered % Paid
Mean 330.25 81.1 735.91 226.98 706.31 964.76 73.9
Mean n 273 269 403 395 388 107 106
Summary 24.50 58.44*** -316.96 -95.84** -361.58a -78.54 9.11
Felony 144.64* 8.66 171.07 62.11** 163.66 1113.22*** -6.80
Personal 128.53a 12.28 295.10* 45.27* 229.80
a -232.39 19.23
a
Drug 269.06*** 11.37* 41.31 36.80a -53.04 -738.68** 34.54
Traffic 278.43*** 18.06** 831.44*** 191.62*** 740.93*** -434.12* 24.72
Other Offense 143.42a 25.34 146.77 62.75** 158.16 -403.33 17.26
Prison 267.59* 14.28*** -205.09 -80.41* -348.08a -404.94 -31.60*
Jail 70.25 -63.51*** 502.35*** -34.20* 384.88*** -157.77 -17.68
RIP 409.35*** -26.77** 339.57 86.55* 331.23 -58.46 -81.44**
No Sentence -135.36 -30.97 -358.33 -140.11*** -356.48 -71.55 -15.00
Non-White -29.55 -10.28 164.57 5.20 200.04 -110.58 3.50
Age 2.15 -15.17 2.15 -0.25 1.85 4.76 0.22
Male 60.12 0.14a 35.31 -1.01 10.72 -313.95
a 5.60
Constant -113.76 11.99*** 145.99 163.01*** 218.85 638.02* 65.54***
R2 0.15 0.19 0.28 0.44 0.27 0.1 0.21
n 401 260 400 399 400 399 104
*p<.05, **p<.01, ***p<.001 ap<.10
Table E-3 describes the imposition of supervision fees, CVC, and CCC. The results
show that the total amount of supervision fees ordered was significantly higher for offenders
convicted of a felony, for offenders convicted of traffic or other offenses, and for non-
incarcerated offenders. The percent of supervision fees paid was significantly higher for
offenders convicted of drug, traffic, or other offenses. CVC and CCC were less likely to be
imposed when the offender was convicted of a summary offense and when the offender was
incarcerated in jail.
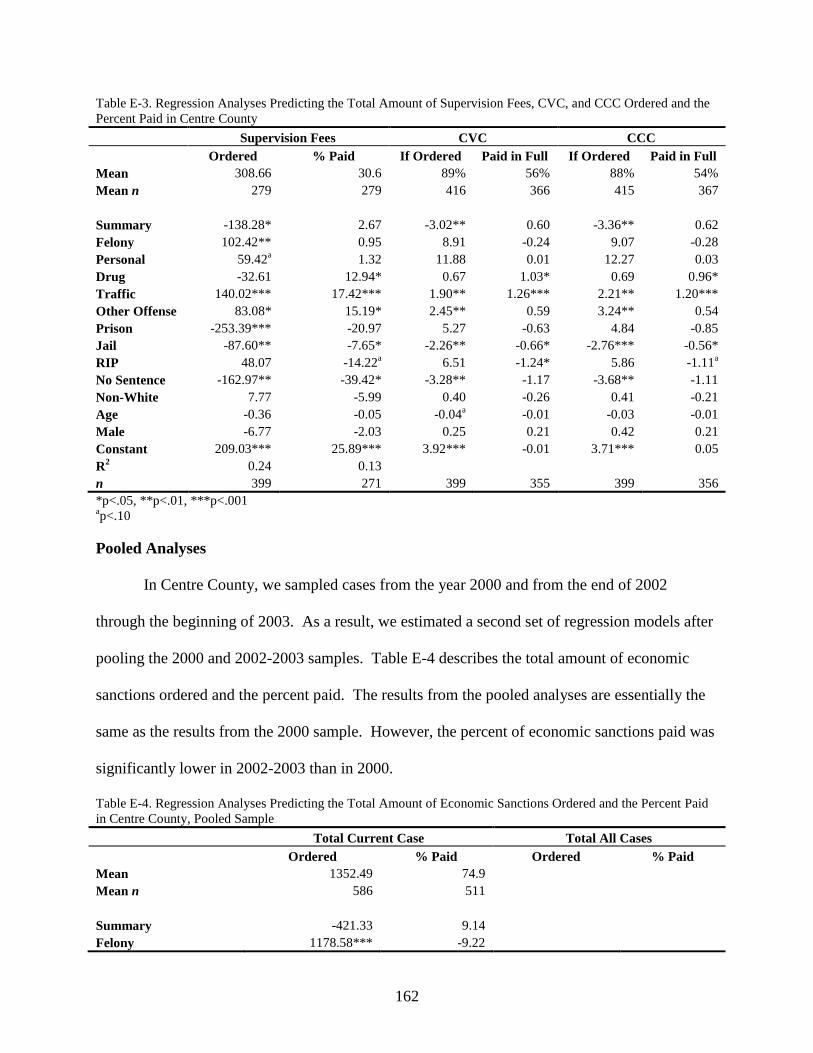
162
Table E-3. Regression Analyses Predicting the Total Amount of Supervision Fees, CVC, and CCC Ordered and the
Percent Paid in Centre County
Supervision Fees CVC CCC
Ordered % Paid If Ordered Paid in Full If Ordered Paid in Full
Mean 308.66 30.6 89% 56% 88% 54%
Mean n 279 279 416 366 415 367
Summary -138.28* 2.67 -3.02** 0.60 -3.36** 0.62
Felony 102.42** 0.95 8.91 -0.24 9.07 -0.28
Personal 59.42a 1.32 11.88 0.01 12.27 0.03
Drug -32.61 12.94* 0.67 1.03* 0.69 0.96*
Traffic 140.02*** 17.42*** 1.90** 1.26*** 2.21** 1.20***
Other Offense 83.08* 15.19* 2.45** 0.59 3.24** 0.54
Prison -253.39*** -20.97 5.27 -0.63 4.84 -0.85
Jail -87.60** -7.65* -2.26** -0.66* -2.76*** -0.56*
RIP 48.07 -14.22a 6.51 -1.24* 5.86 -1.11
a
No Sentence -162.97** -39.42* -3.28** -1.17 -3.68** -1.11
Non-White 7.77 -5.99 0.40 -0.26 0.41 -0.21
Age -0.36 -0.05 -0.04a -0.01 -0.03 -0.01
Male -6.77 -2.03 0.25 0.21 0.42 0.21
Constant 209.03*** 25.89*** 3.92*** -0.01 3.71*** 0.05
R2 0.24 0.13
n 399 271 399 355 399 356
*p<.05, **p<.01, ***p<.001 ap<.10
Pooled Analyses
In Centre County, we sampled cases from the year 2000 and from the end of 2002
through the beginning of 2003. As a result, we estimated a second set of regression models after
pooling the 2000 and 2002-2003 samples. Table E-4 describes the total amount of economic
sanctions ordered and the percent paid. The results from the pooled analyses are essentially the
same as the results from the 2000 sample. However, the percent of economic sanctions paid was
significantly lower in 2002-2003 than in 2000.
Table E-4. Regression Analyses Predicting the Total Amount of Economic Sanctions Ordered and the Percent Paid
in Centre County, Pooled Sample
Total Current Case Total All Cases
Ordered % Paid Ordered % Paid
Mean 1352.49 74.9
Mean n 586 511
Summary -421.33 9.14
Felony 1178.58*** -9.22

163
Personal 152.98 10.74a
Drug -163.99 18.74**
Traffic 757.23*** 23.24***
Other Offense -46.97 9.10
Prison 324.19 -46.67***
Jail 377.27* -22.19***
RIP 542.42 -23.49*
No Sentence -643.98 -5.51
Non-White -191.02 -11.14a
Age 7.26 0.16
Male -108.38 5.71
Year -26.73 -7.60***
Constant 853.45* 70.65***
R2 0.13 0.23
n 553 486
*p<.05, **p<.01, ***p<.001 ap<.10
The results presented in Table E-5 describe the total amount of fines, costs and fees, and
restitution ordered and the percent paid. The findings regarding fines and restitution are
essentially the same as the results from the 2000 sample. However, the total amount of costs and
fees ordered was significantly lower in 2002-2003 than in 2000.
Table E-5. Regression Analyses Predicting the Total Amount of Fines, Costs and Fees, and Restitution Ordered and
the Percent Paid in Centre County, Pooled Sample
Fines Costs and Fees Restitution
Ordered % Paid Total
Ordered
State
Ordered
County
Ordered
Ordered % Paid
Mean 362.73 73.63 704.97 241.96 646.14 906.09 67.34
Mean n 385 339 556 472 464 146 126
Summary 78.17 3.17 -287.62 -74.84* -309.47a -36.24 8.053
Felony 177.34 7.14 87.78 49.95* 105.90 861.02*** -10.326
Personal 137.54 9.07 233.30* 58.62** 186.31a -330.95
a 19.503
a
Drug 456.03*** 19.27* 70.06 49.32* -63.43 -715.26*** 32.999
Traffic 248.04 21.94** 729.17*** 165.16*** 530.62*** -453.78** 20.231
Other Offense 116.83 11.98 138.50 64.57** 105.30 -426.54* 19.037
Prison 931.10*** -60.03*** -59.00 -21.42 -272.50a -216.85 -28.279
a
Jail 146.79a -24.77*** 427.69*** -30.54
a 316.47*** -138.81 -9.055
RIP 410.02* -22.15a 396.88* 102.89** 356.40* -132.86 -57.455*
No Sentence -109.37 -2.52 -282.31 -123.97** -262.93 -69.98 -18.462
Non-White -133.24 -13.60 128.27 -8.39 131.46 -168.99 4.537
Age 1.36 0.06 1.88 0.06 3.04 5.08 0.047
Male 101.14 5.57 27.81 1.98 26.71 -200.27 1.084
Year 66.24a -20.16 -78.19* -41.76*** -255.93*** -53.95 -18.654
Constant -248.97a 87.54*** 295.81* 193.51*** 527.34*** 633.07* 91.020***

164
R2 0.11 0.24 0.26 0.3 0.27 0.09 0.29
n 549 322 552 533 536 538 123
*p<.05, **p<.01, ***p<.001 ap<.10
The results presented in Table E-6 describe the imposition of supervision fees, CVC, and
CCC. Although the total amount of supervision fees ordered was significantly lower during
2002-2003, the percent of supervision fees paid was significantly higher during 2002-2003.
CVC and CCC were less likely to be imposed in 2002-2003 than in 2000.
Table E-6. Regression Analyses Predicting the Total Amount of Supervision Fees, CVC, and CCC Ordered and the
Percent Paid in Centre County, Pooled Sample
Supervision Fees CVC CCC
Ordered % Paid If Ordered Paid in Full If Ordered Paid in Full
Mean 311.72 36.25 78% 56% 78% 54%
Mean n 331 330 564 175 563 439
Summary -116.16* 4.47 -1.38a 0.43 -1.46* 0.45
Felony 82.88** -1.70 0.59 -0.26 0.59 -0.30
Personal 72.00* 4.21 1.94*** 0.00 1.97*** 0.02
Drug -29.49 18.16** 0.63 1.08** 0.63 1.03**
Traffic 109.70*** 20.97*** 0.66a 1.18*** 0.68
a 1.14***
Other Offense 80.21* 17.84** 1.48** 0.64 1.73** 0.59
Prison -231.47*** -18.62 7.51 -1.00a 7.49 -1.20*
Jail -86.46*** -8.25* -0.56 -0.72 -0.62a -0.64*
RIP 36.75 -11.55 7.26 -0.81 7.24 -0.70
No Sentence -154.12** -40.09* -2.05** -0.81 -2.13** -0.76
Non-White 0.81 -5.06 0.06 -0.16 0.06 -0.11
Age -0.09 -0.09 -0.02 -0.01 -0.01 -0.02
Male 8.26 -5.08 -0.03 0.08 -0.02 0.08
Year -61.40*** 16.76*** -1.46*** -0.10 -1.49*** -0.06
Constant 257.81*** 10.20 4.16*** 0.35 4.12*** 0.36
R2 0.22 0.28
n 532 320 533 419 533 420
*p<.05, **p<.01, ***p<.001 ap<.10
Juvenile Data
The results presented in Table E-7 describe the total amount of economic sanctions
ordered and the percent paid in Centre County. The total amount of economic sanctions ordered
was significantly higher for offenders who were adjudicated delinquent. No other case or
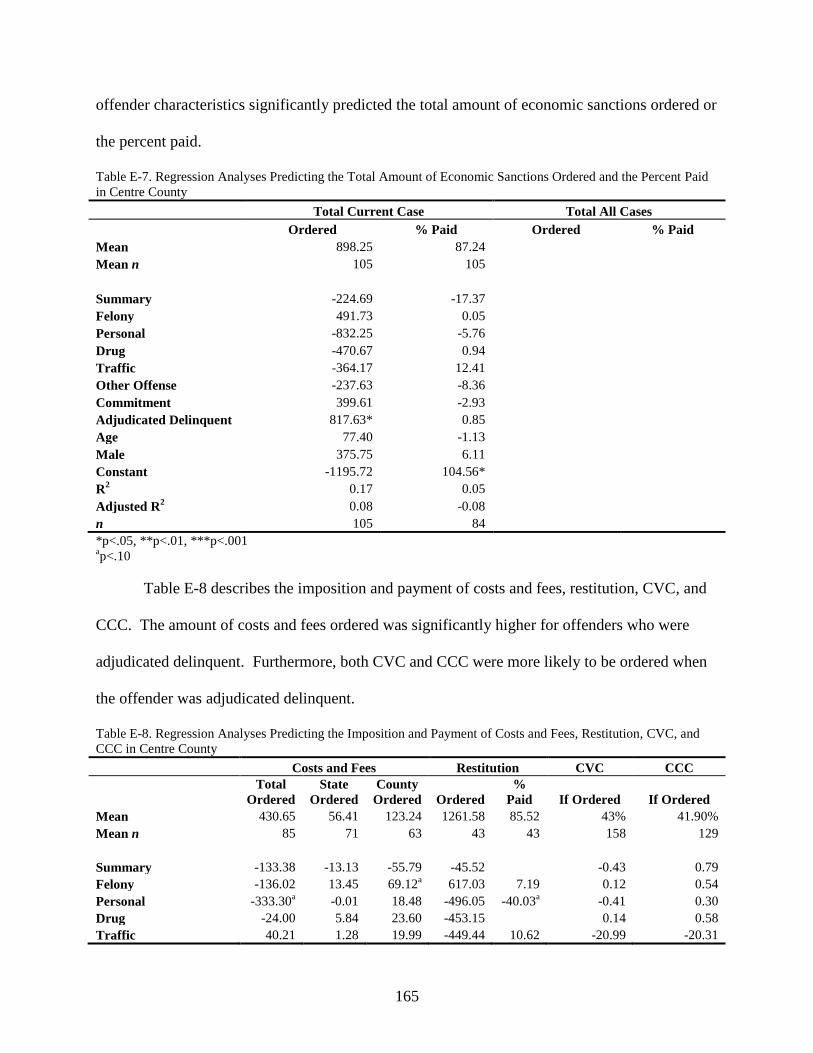
165
offender characteristics significantly predicted the total amount of economic sanctions ordered or
the percent paid.
Table E-7. Regression Analyses Predicting the Total Amount of Economic Sanctions Ordered and the Percent Paid
in Centre County
Total Current Case Total All Cases
Ordered % Paid Ordered % Paid
Mean 898.25 87.24
Mean n 105 105
Summary -224.69 -17.37
Felony 491.73 0.05
Personal -832.25 -5.76
Drug -470.67 0.94
Traffic -364.17 12.41
Other Offense -237.63 -8.36
Commitment 399.61 -2.93
Adjudicated Delinquent 817.63* 0.85
Age 77.40 -1.13
Male 375.75 6.11
Constant -1195.72 104.56*
R2 0.17 0.05
Adjusted R2 0.08 -0.08
n 105 84
*p<.05, **p<.01, ***p<.001 ap<.10
Table E-8 describes the imposition and payment of costs and fees, restitution, CVC, and
CCC. The amount of costs and fees ordered was significantly higher for offenders who were
adjudicated delinquent. Furthermore, both CVC and CCC were more likely to be ordered when
the offender was adjudicated delinquent.
Table E-8. Regression Analyses Predicting the Imposition and Payment of Costs and Fees, Restitution, CVC, and
CCC in Centre County
Costs and Fees Restitution CVC CCC
Total
Ordered
State
Ordered
County
Ordered Ordered
%
Paid If Ordered If Ordered
Mean 430.65 56.41 123.24 1261.58 85.52 43% 41.90%
Mean n 85 71 63 43 43 158 129
Summary -133.38 -13.13 -55.79 -45.52 -0.43 0.79
Felony -136.02 13.45 69.12a 617.03 7.19 0.12 0.54
Personal -333.30a -0.01 18.48 -496.05 -40.03
a -0.41 0.30
Drug -24.00 5.84 23.60 -453.15 0.14 0.58
Traffic 40.21 1.28 19.99 -449.44 10.62 -20.99 -20.31

166
Other Offense -178.38 32.88 73.01 -172.79 -13.80 -1.18 -0.53
Commitment 172.18 -9.18 -56.94 257.66 -36.11 0.19 0.33
Adjudicated Delinquent 268.25* 33.54* 73.15* 527.67 -1.28 1.36** 3.20***
Age -9.86 0.74 3.94 80.40 -1.49 -0.08 -0.12
Male 59.07 -4.54 5.64 295.73 0.31 0.08 -1.53*
Constant 350.62 -1.34 -73.93 -1417.35 114.20a 0.46 0.75
R2 0.11 0.09 0.11 0.15 0.20
Adjusted R2 0.02 0.00 0.01 0.055 -0.031
n 105 105 105 105 37 130 105
*p<.05, **p<.01, ***p<.001 ap<.10

167
APPENDIX F
Cumberland County

168
Collection of Economic Sanctions
Adult Data
Organization of collections and supervision. Cumberland County has a specialized
collections unit within the adult probation department that is responsible for enforcing
collections of economic sanctions ordered on adult criminal cases. The collections unit has one
supervisor and three staff members who are responsible for monitoring payments, sending out
dunning letters, and scheduling court appearances for revocations. Probation also sets and
adjusts offenders‟ payment plans. The minimum payment is $60 a month. Beyond that,
however, probation officers set up a payment plan so that offenders will finish paying by the
time their probation expires. The only exception to this rule is if the offender owes more than
could reasonably be paid off during his/her probation period.
Validity of the data. In November of 2003, during the course of our data collection,
Cumberland County switched over from the AS400 computer system to the new statewide
AOPC computer system. Although the AS400 system was still accessible, it was no longer
being updated. Because of glitches in the new system, payments and other information were not
being entered by the time we finished our data collection and therefore we used only the AS400
system. As a result, our data regarding amounts paid are actually underestimates. Problems with
the AOPC system also made it difficult for the probation office to track payments and produce
proper documentation and therefore they were unable to send bills and payment letters to
offenders. As a result, collections likely dropped.
Order of payment. In Cumberland County, by order of the court, payments made by
offenders are applied in the following: (1) payment of course instructors‟ fees in DUI cases (i.e.,
DUI School), (2) payment of county and state probation supervision fees, (3) payment of
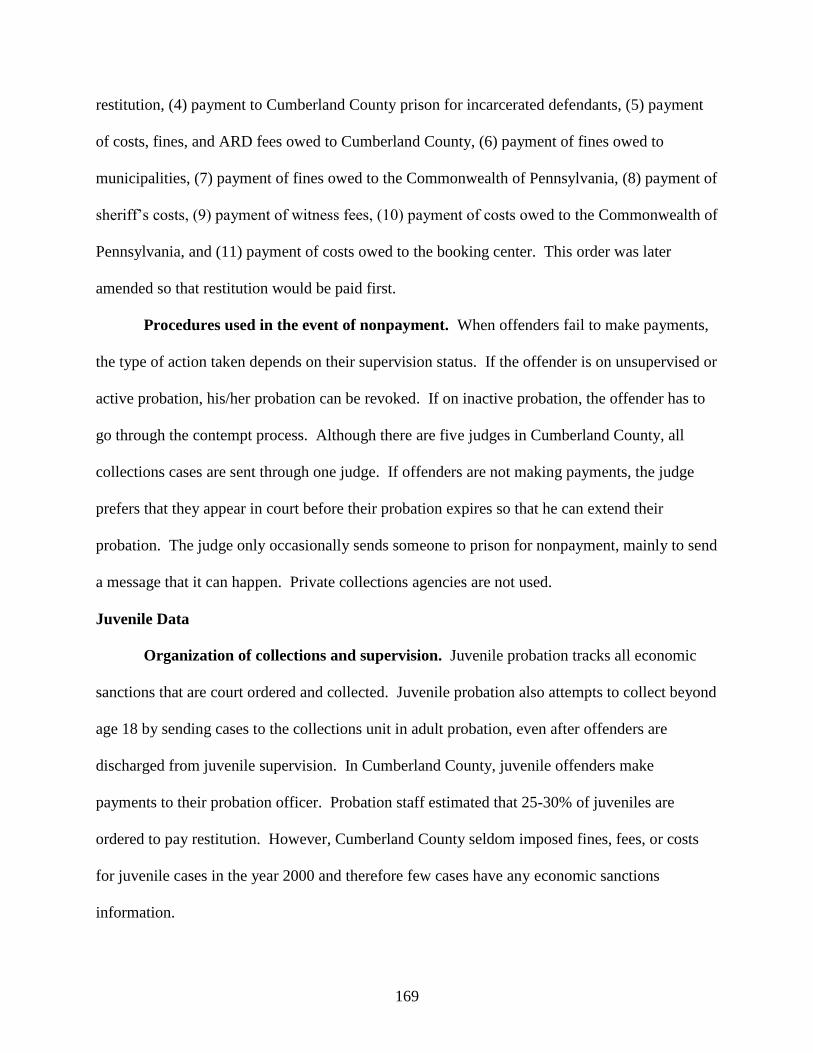
169
restitution, (4) payment to Cumberland County prison for incarcerated defendants, (5) payment
of costs, fines, and ARD fees owed to Cumberland County, (6) payment of fines owed to
municipalities, (7) payment of fines owed to the Commonwealth of Pennsylvania, (8) payment of
sheriff‟s costs, (9) payment of witness fees, (10) payment of costs owed to the Commonwealth of
Pennsylvania, and (11) payment of costs owed to the booking center. This order was later
amended so that restitution would be paid first.
Procedures used in the event of nonpayment. When offenders fail to make payments,
the type of action taken depends on their supervision status. If the offender is on unsupervised or
active probation, his/her probation can be revoked. If on inactive probation, the offender has to
go through the contempt process. Although there are five judges in Cumberland County, all
collections cases are sent through one judge. If offenders are not making payments, the judge
prefers that they appear in court before their probation expires so that he can extend their
probation. The judge only occasionally sends someone to prison for nonpayment, mainly to send
a message that it can happen. Private collections agencies are not used.
Juvenile Data
Organization of collections and supervision. Juvenile probation tracks all economic
sanctions that are court ordered and collected. Juvenile probation also attempts to collect beyond
age 18 by sending cases to the collections unit in adult probation, even after offenders are
discharged from juvenile supervision. In Cumberland County, juvenile offenders make
payments to their probation officer. Probation staff estimated that 25-30% of juveniles are
ordered to pay restitution. However, Cumberland County seldom imposed fines, fees, or costs
for juvenile cases in the year 2000 and therefore few cases have any economic sanctions
information.

170
Validity of the data. Compared to the other counties, Cumberland County has slightly
different juvenile dispositions. Deferred Adjudication and Disposition is similar to an in-court
consent decree. In other words, at a later date there is a follow-up petition dismissing the
charges. Deferred Hearings are similar to out-of-court consent decrees. Cumberland County
uses few actual consent decrees. If a juvenile sentenced to a consent decree does not pay after 12
months, he/she can be adjudicated delinquent. Predelinquent is similar to an informal
adjustment. A low proportion of their cases are adjudicated delinquent. For the most part, only
the President Judge handles juvenile cases.
Order of payment. For adjudicated cases, how a payment is applied depends on the
priority assigned in the computer. In general, 50% of all payments are applied to restitution until
the restitution is paid in full. Restitution on older cases is supposed to be paid before restitution
on newer cases and individual and business victims are supposed to be paid before insurance
companies. After restitution, the order of payment should be CVC, DUI, fines, and DNA fees.
Juveniles make payments by mailing them to the Clerk of Courts, by making payments to the
Clerk of Courts in person, or by making payments to the probation officer who then takes the
payment to the Clerk of Court‟s Office. Juveniles who were not petitioned to court (i.e., were
handled out of court) make payments directly to their probation officer and the money is handled
in house. Restitution is paid first, but the juvenile may also have to pay fines or other fees for
service, but not things like CVC.
Procedures used in the event of nonpayment. In Cumberland County, the type of
action taken in the event of nonpayment is decided on a case-by-case basis. The probation staff
may revoke probation or have the juvenile earn money through a Community Service Program.

171
At age 21, contempt of court proceedings may begin and judgments may be filed against the
individual.
Method
Data collection. Data collection was undertaken from late September to mid November
of 2003, and again from early February through late April of 2004. Although we did not have
access to Clerk of Courts paper files for logistical reasons, we obtained detailed information
from probation paper files, from the computer system, and from Victim/Witness Services files.
The probation files were a particularly rich source of data for two reasons. First, one-half of
each file in adult and juvenile probation duplicated the information in the Clerk of Courts paper
file. Second, probation files were historic, meaning offenders had only one file starting from
their first adult offense (or juvenile offense, in the case of juveniles), no matter how many
subsequent offenses they had.
For adults, the county computer records included sentencing orders, prior offenses,
sentence start and end dates, and economic sanctions information. Detailed economic sanctions
information was available for each case. For juveniles, there was far less data in the computer.
Only formally handled cases (i.e., petitions to court that resulted in adjudications of delinquency)
were entered into the computer and only if there were economic sanctions ordered for that case.
The only information entered was the name and address of the defendant and economic sanctions
details.
Victim/Witness Services files were examined in Cumberland County for both adults and
juveniles. Not all cases with a victim were included, because not all victims chose to receive
services through the Victim/Witness Services office. For adult cases, Victim/Witness files
provided data on victims not otherwise known, in that victims not receiving restitution orders

172
could also be included in Victim/Witness files. For juvenile cases, however, not as many
additional victims were uncovered because victims were often included in juvenile probation
files whether they received orders of restitution or not. In general, the files provided information
about the type of victim (individual, business, insurance company, state agency), the gender of
the victim (when applicable), the status of the victim (adult or child), whether the victim
submitted a victim impact statement, the type of injury (physical, property, psychological), the
victim‟s estimate of loss, and whether the victim enrolled in the state‟s victim notification
program.
Results
Adult Data
Table F-1 describes the total amount of economic sanctions ordered and the percent paid
for both the current case and across all cases. Across both models, the total amount of economic
sanctions imposed was significantly higher for offenders convicted of a felony and significantly
lower for offenders convicted of a drug offense. Furthermore, the percent of economic sanctions
paid was significantly higher for offenders convicted of a personal, drug, traffic, or other offense.
The percent of economic sanctions paid was significantly lower for incarcerated offenders,
especially those incarcerated in prison.
Table F-1. Regression Analyses Predicting the Total Amount of Economic Sanctions Ordered and the Percent Paid
in Cumberland County
Total Current Case Total All Cases
Ordered % Paid Ordered % Paid
Mean 1861.26 65.06 4043.15 55.11
Mean n 443 443 441 441
Summary -832.69 -9.76 -1020.33 -2.36
Felony 3325.99*** -10.79a 6167.28*** -10.18
Personal -652.48 15.50* -2295.26a 24.02**
Drug -2265.58** 18.89** -5670.64*** 26.59**
Traffic -65.16 24.17** -3439.48** 35.23***
Other Offense -1070.76 17.43* -3863.35** 27.08**

173
Prison 1882.91 -49.27*** 1322.18 -51.71***
Jail -807.98 -16.27* 610.21 -15.36*
RIP 865.95 -3.38 1281.64 -1.62
No Sentence 482.93 6.62 2885.90a -13.41
Non-White -938.42 -12.13* -1877.63* -6.12
Age 69.90** 0.34a 56.68 0.49*
Male 413.96 -0.35 2255.35* -4.52
Constant -411.65 57.31*** 1482.11 36.54**
R2 0.12 0.19 0.21 0.17
n 387 387 387 387
*p<.05, **p<.01, ***p<.001 ap<.10
Table F-2 describes the total amount of fines, costs and fees, and restitution ordered and
the percent paid. The total amount of fines ordered was significantly higher for offenders
convicted of drug or traffic offenses and for offenders incarcerated in prison. None of the
variables significantly predicted the percent of fines paid. The total amount of costs and fees
ordered was significantly higher for offenders convicted of personal, traffic, or other offenses
and for offenders incarcerated in prison. The total amount of restitution ordered was
significantly higher for offenders convicted of a felony. Furthermore, the total amount of
restitution ordered and the percent paid was significantly higher for older offenders.
Table F-2. Regression Analyses Predicting the Total Amount of Fines, Costs and Fees, and Restitution Ordered and
the Percent Paid in Cumberland County
Fines Costs and Fees Restitution
Ordered % Paid Total
Ordered
State
Ordered
County
Ordered
Ordered % Paid
Mean 444.31 60.83 566.19 173.3 493.35 3111.9 59.87
Mean n 237 237 443 433 443 136 136
Summary 239.11 -12.76 -452.94*** -120.50*** -428.77*** -490.36 -20.71
Felony 74.87 18.94 -16.58 61.73** 29.25 3168.54*** -26.59**
Personal 59.72 -13.59 129.41** 15.12 86.84* -802.71 17.02
Drug 722.97*** -15.79 22.11 17.02 -69.64a -2944.04*** 39.34**
Traffic 410.78* -14.34 454.32*** 202.12*** 298.98*** -990.46 -17.72
Other Offense 145.08 -13.16 81.13* 11.58 14.42 -1256.12 12.89
Prison 717.81* -97.35 290.42*** 18.61 133.91a 1028.17 -18.72
Jail -3.42 -35.76 27.97 1.09 4.41 -815.16 1.70
RIP -105.98 -1.36 8.66 32.76 20.26 903.71 -1.28
No Sentence -365.33 10.13 -6.82 1.20 1.24 804.48 29.00
Non-White 75.05 -23.46 -11.47 -25.73 -13.55 -977.57 -3.21
Age 1.22 0.18 0.86 1.16a 1.28 66.28** 1.13*
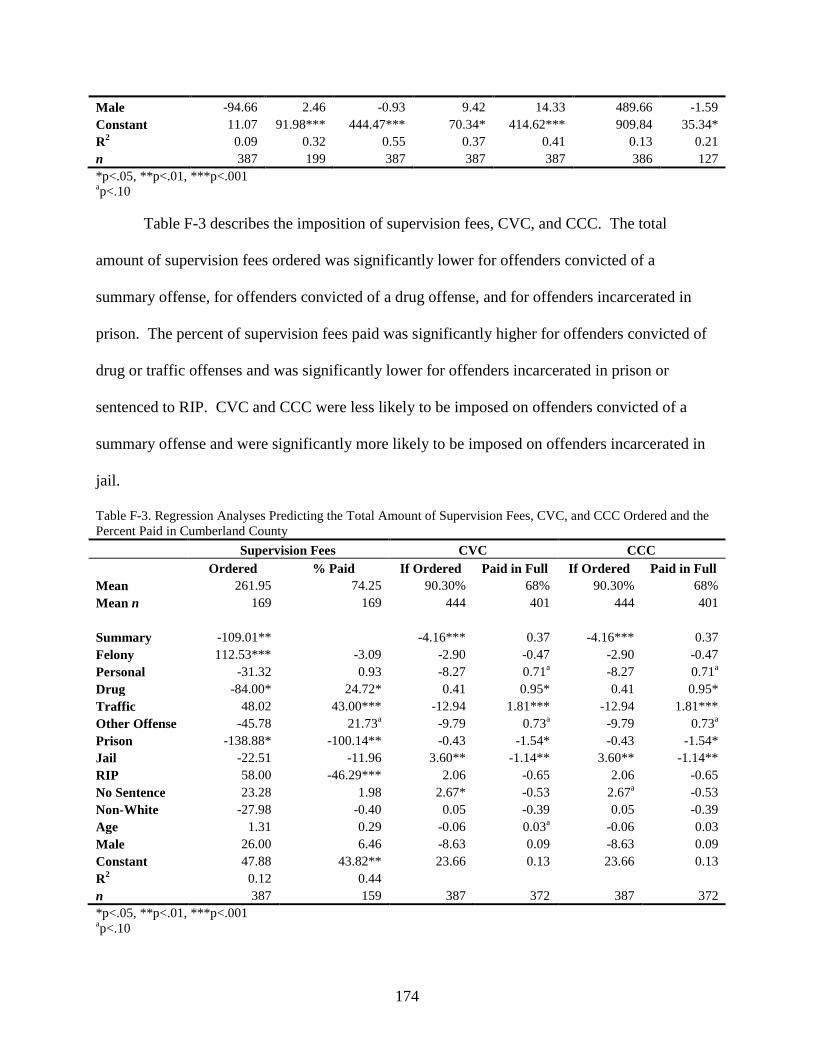
174
Male -94.66 2.46 -0.93 9.42 14.33 489.66 -1.59
Constant 11.07 91.98*** 444.47*** 70.34* 414.62*** 909.84 35.34*
R2 0.09 0.32 0.55 0.37 0.41 0.13 0.21
n 387 199 387 387 387 386 127
*p<.05, **p<.01, ***p<.001 ap<.10
Table F-3 describes the imposition of supervision fees, CVC, and CCC. The total
amount of supervision fees ordered was significantly lower for offenders convicted of a
summary offense, for offenders convicted of a drug offense, and for offenders incarcerated in
prison. The percent of supervision fees paid was significantly higher for offenders convicted of
drug or traffic offenses and was significantly lower for offenders incarcerated in prison or
sentenced to RIP. CVC and CCC were less likely to be imposed on offenders convicted of a
summary offense and were significantly more likely to be imposed on offenders incarcerated in
jail.
Table F-3. Regression Analyses Predicting the Total Amount of Supervision Fees, CVC, and CCC Ordered and the
Percent Paid in Cumberland County
Supervision Fees CVC CCC
Ordered % Paid If Ordered Paid in Full If Ordered Paid in Full
Mean 261.95 74.25 90.30% 68% 90.30% 68%
Mean n 169 169 444 401 444 401
Summary -109.01** -4.16*** 0.37 -4.16*** 0.37
Felony 112.53*** -3.09 -2.90 -0.47 -2.90 -0.47
Personal -31.32 0.93 -8.27 0.71a -8.27 0.71
a
Drug -84.00* 24.72* 0.41 0.95* 0.41 0.95*
Traffic 48.02 43.00*** -12.94 1.81*** -12.94 1.81***
Other Offense -45.78 21.73a -9.79 0.73
a -9.79 0.73
a
Prison -138.88* -100.14** -0.43 -1.54* -0.43 -1.54*
Jail -22.51 -11.96 3.60** -1.14** 3.60** -1.14**
RIP 58.00 -46.29*** 2.06 -0.65 2.06 -0.65
No Sentence 23.28 1.98 2.67* -0.53 2.67a -0.53
Non-White -27.98 -0.40 0.05 -0.39 0.05 -0.39
Age 1.31 0.29 -0.06 0.03a -0.06 0.03
Male 26.00 6.46 -8.63 0.09 -8.63 0.09
Constant 47.88 43.82** 23.66 0.13 23.66 0.13
R2 0.12 0.44
n 387 159 387 372 387 372
*p<.05, **p<.01, ***p<.001 ap<.10
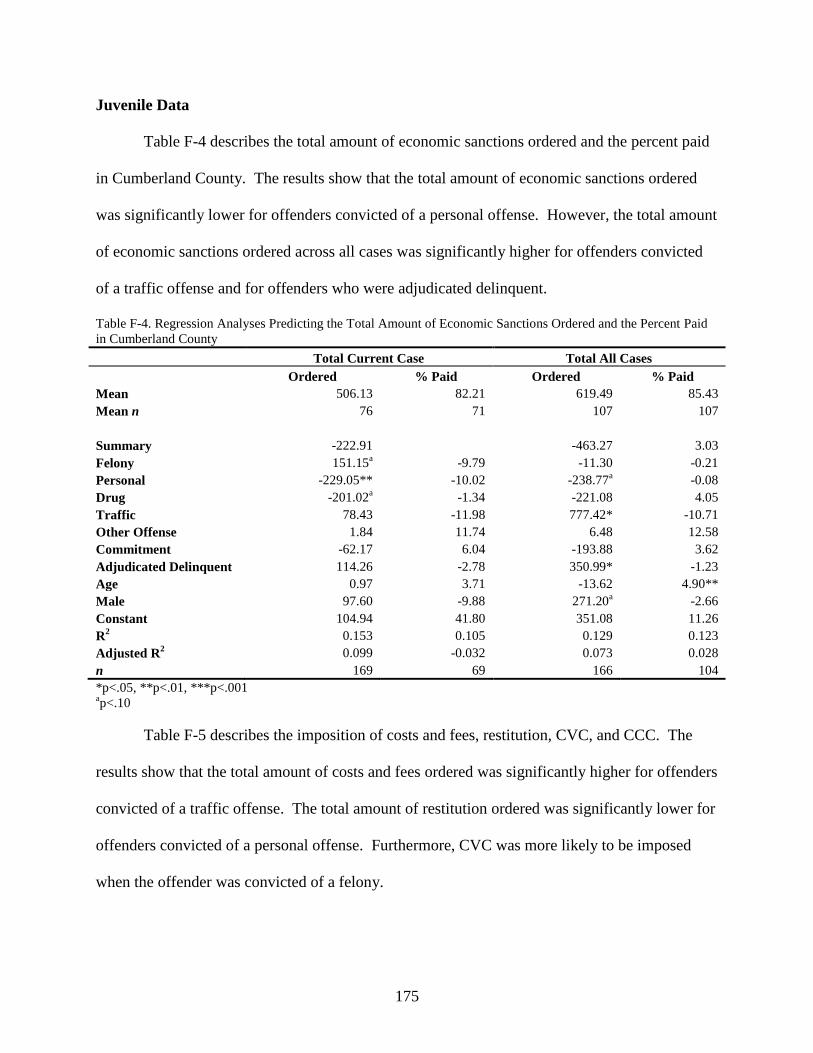
175
Juvenile Data
Table F-4 describes the total amount of economic sanctions ordered and the percent paid
in Cumberland County. The results show that the total amount of economic sanctions ordered
was significantly lower for offenders convicted of a personal offense. However, the total amount
of economic sanctions ordered across all cases was significantly higher for offenders convicted
of a traffic offense and for offenders who were adjudicated delinquent.
Table F-4. Regression Analyses Predicting the Total Amount of Economic Sanctions Ordered and the Percent Paid
in Cumberland County
Total Current Case Total All Cases
Ordered % Paid Ordered % Paid
Mean 506.13 82.21 619.49 85.43
Mean n 76 71 107 107
Summary -222.91 -463.27 3.03
Felony 151.15a -9.79 -11.30 -0.21
Personal -229.05** -10.02 -238.77a -0.08
Drug -201.02a -1.34 -221.08 4.05
Traffic 78.43 -11.98 777.42* -10.71
Other Offense 1.84 11.74 6.48 12.58
Commitment -62.17 6.04 -193.88 3.62
Adjudicated Delinquent 114.26 -2.78 350.99* -1.23
Age 0.97 3.71 -13.62 4.90**
Male 97.60 -9.88 271.20a -2.66
Constant 104.94 41.80 351.08 11.26
R2 0.153 0.105 0.129 0.123
Adjusted R2 0.099 -0.032 0.073 0.028
n 169 69 166 104
*p<.05, **p<.01, ***p<.001 ap<.10
Table F-5 describes the imposition of costs and fees, restitution, CVC, and CCC. The
results show that the total amount of costs and fees ordered was significantly higher for offenders
convicted of a traffic offense. The total amount of restitution ordered was significantly lower for
offenders convicted of a personal offense. Furthermore, CVC was more likely to be imposed
when the offender was convicted of a felony.
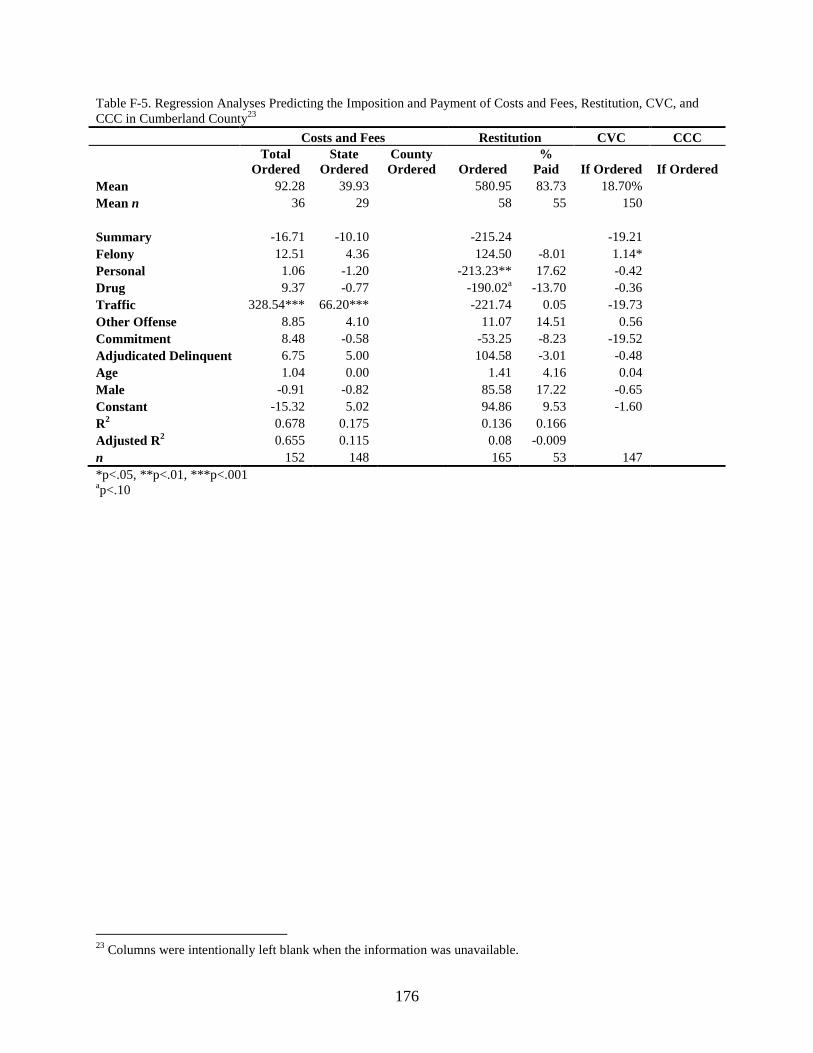
176
Table F-5. Regression Analyses Predicting the Imposition and Payment of Costs and Fees, Restitution, CVC, and
CCC in Cumberland County23
Costs and Fees Restitution CVC CCC
Total
Ordered
State
Ordered
County
Ordered Ordered
%
Paid If Ordered If Ordered
Mean 92.28 39.93 580.95 83.73 18.70%
Mean n 36 29 58 55 150
Summary -16.71 -10.10 -215.24 -19.21
Felony 12.51 4.36 124.50 -8.01 1.14*
Personal 1.06 -1.20 -213.23** 17.62 -0.42
Drug 9.37 -0.77 -190.02a -13.70 -0.36
Traffic 328.54*** 66.20*** -221.74 0.05 -19.73
Other Offense 8.85 4.10 11.07 14.51 0.56
Commitment 8.48 -0.58 -53.25 -8.23 -19.52
Adjudicated Delinquent 6.75 5.00 104.58 -3.01 -0.48
Age 1.04 0.00 1.41 4.16 0.04
Male -0.91 -0.82 85.58 17.22 -0.65
Constant -15.32 5.02 94.86 9.53 -1.60
R2 0.678 0.175 0.136 0.166
Adjusted R2 0.655 0.115 0.08 -0.009
n 152 148 165 53 147
*p<.05, **p<.01, ***p<.001 ap<.10
23
Columns were intentionally left blank when the information was unavailable.

177
APPENDIX G
Delaware County
178
Collection of Economic Sanctions
Adult Data
Organization of collections and supervision. Delaware County has a separate Court
Financial Services (CFS) office that is responsible for the collection of all economic sanctions
ordered by the Court of Common Pleas. CFS staff work closely with other court and county
departments (e.g., Adult Probation and Parole, Diagnostic Services, Children and Youth
Services, Juvenile Court, Community Services, Domestic Relations, and the prison) to collect all
fines, fees, costs, and restitution. To maximize collections, the staff specializes in specific job
functions. For example, one person coordinates efforts with the District Attorney‟s Office and
Adult Probation and Parole, another person sends restitution checks to victims, and yet another
person handles cases with large arrearages.
A case cannot close if an offender still owes restitution. However, a case can close if an
offender owes only court costs, unless it is an ARD case. Judges in Delaware County never
order restitution for insurance companies. However, judges sometimes order restitution for the
police or other state agencies.
Validity of the data. We encountered two problems in Delaware County. First, the
probation department began using a new computer system at the end of 1978 and the beginning
of 1979. As a result, any information we collected about offenders‟ prior convictions goes back
only as far as 1978-1979.
Second, restitution was often described as being “joint and several,” which means that the
amount of restitution owed was split between/among co-defendants. For example, if a judge
ordered two offenders to pay a total of $3,000 in restitution, each offender owed $1,500 in
restitution. Although each offender is required to pay his/her portion of the restitution, it rarely
179
happens. Instead, one offender usually pays more than the other(s) because he/she wants to be
released from probation.
Order of payment. In Delaware County, each time an offender makes a payment 50%
goes toward restitution and 50% goes toward supervision fees, costs, etc. Occasionally,
however, probation officers will request a court order from the sentencing judge ordering that
restitution be paid first.
Procedures used in the event of nonpayment. If an offender fails to make payments,
the court begins by extending probation and then files a civil judgment against the offender.
Cases dating back to February of 1991 have judgments filed against them that will remain on the
defendant‟s record until satisfied. Defendants who do not have the ability to pay (i.e., because of
incarceration, lack of employment, or disability), however, may perform community service in
return for a reduction in the amount of money they owe.
Juvenile Data
Organization of collections and supervision. Delaware County handles all juvenile
cases in the same way. There are no informally handled cases. The District Attorney reviews all
cases and those that are accepted are sent to court, where the juvenile either makes an admission
or not and is then either adjudicated delinquent or not. The juvenile probation office has no
record of those cases that are rejected (only the offender‟s name and the date the case was
rejected). Economic sanctions may be assessed to the juvenile, to the parents, or to the county.
Validity of the data. Economic sanctions can be assessed to the juvenile, to the parents,
or to the county. We collected information about the amount of economic sanctions assessed to
the county from the computer files. If economic sanctions information was included in the
probation paper file, we could record the total amount of economic sanctions ordered. However,

180
Juvenile Court implemented a new computer system prior to the year 2000, and anything paid
prior to the conversion did not convert to the new system. As a result, if no economic sanctions
information was available in the probation paper file, the amount we recorded from the computer
file was actually an underestimate.
Order of payment. In Delaware County, payments are applied per court order. In
general, restitution is paid first. Regarding other fines, fees, and costs, older cases are paid
before more recent ones.
Procedures used in the event of nonpayment. If the offender fails to make payments,
several options are available: the case can be sent to court, community service can be ordered to
cover costs not mandated by the state, or the individual can be referred to an outside collections
agency.
Method
Data collection. We collected data from July to August of 2004. Data for adult cases
was collected from adult probation paper and computer files, as well as Clerk of Courts computer
files. Although we did not have access to Clerk of Courts paper files, these sources provided
detailed information about offenders, charge and conviction offenses, sentences imposed, and
economic sanctions ordered in each case. Data for juvenile cases was collected from juvenile
probation paper and computer files. Because the juvenile probation office tracks juveniles from
the time they enter the criminal justice system until the age of 21, these sources provided detailed
information about juvenile cases.

181
Results
Adult Data
Table G-1 describes the total amount of economic sanctions ordered and the percent paid
for both the current case and across all cases. Across both models, the total amount of economic
sanctions ordered was significantly higher for offenders convicted of a felony. Furthermore, the
percent of economic sanctions paid was significantly lower for incarcerated offenders and for
non-white offenders.
Table G-1. Regression Analyses Predicting the Total Amount of Economic Sanctions Ordered and the Percent Paid
in Delaware County
Total Current Case Total All Cases
Ordered % Paid Ordered % Paid
Mean 1427.46 45.79 3307.38 63.37
Mean n 222 221 225 130
Summary
Felony 1193.99** 6.08 1377.75* 8.49
Personal -724.99a 10.26 -389.95 14.79
Drug -1061.69** 5.00 -593.46 2.90
Traffic -171.56 36.63*** -1566.28* 38.76***
Other Offense -427.48 22.24a -1211.00 17.37
Prison -1220.60a -26.93
a -649.36 -43.96*
Jail -206.96 -32.54*** 1608.86** -33.44***
RIP 222.49 -14.10 1167.39 -27.50*
No Sentence -1493.64 11.13 225.31 -2.77
Non-White 580.67* -19.36** -237.61 -18.63*
Age 16.78a 0.02 18.33 -0.17
Male -15.64 -1.76 500.84 7.92
Constant 1014.23* 53.36*** 2307.67* 62.00***
R2 0.14 0.35 0.14 0.39
n 211 207 211 121
*p<.05, **p<.01, ***p<.001 ap<.10
The results presented in Table G-2 describe the total amount of fines, costs and fees, and
restitution ordered and the percent paid. The total amount of fines and state costs and fees
ordered was significantly higher for offenders incarcerated in jail or sentenced to RIP. The total

182
amount of restitution ordered was significantly higher for offenders convicted of a felony and for
non-white offenders. No factors significantly predicted the percent of fines or restitution paid.
Table G-2. Regression Analyses Predicting the Total Amount of Fines, Costs and Fees, and Restitution Ordered and
the Percent Paid in Delaware County
Fines Costs and Fees Restitution
Ordered % Paid Total
Ordered
State
Ordered
County
Ordered
Ordered % Paid
Mean 314.34 45.32 792.98 240.67 827.92 1309.77 53.76
Mean n 56 56 223 221 223 43 43
Summary
Felony 5.33 20.34 -135.15 115.47** -13.27 835.54** 21.67
Personal 17.52 -55.83 73.41 19.33 61.39 -702.58* -14.88
Drug 30.46 -13.51 -252.13a -15.59 -258.64a -812.14** 28.32
Traffic 168.98*** 40.78 47.67 -81.73 -438.54 42.99a
Other Offense 23.91 69.18 -161.59 -10.01 -178.42 -621.13 -4.42
Prison 94.13a -64.80 -174.02 -164.43** -362.35 -801.55
a -23.84
Jail 111.48*** -43.27 -165.98a 93.95*** -113.39 -349.84
a -3.99
RIP 120.69** -25.94 -144.83 135.42** -72.14 -327.58 -68.52
No Sentence -45.58 -617.75 -110.96 -643.45 -655.67
Non-White -18.60 -25.07 53.61 -27.60 27.69 437.28* -28.90a
Age 1.35a -0.38 -1.55 1.38 -1.31 8.18 0.22
Male 22.76 42.78a 173.27 11.43 187.95 -211.82 -17.59
Constant -108.04** 65.27 821.90*** 113.44* 857.97*** 533.97 61.49*
R2 0.44 0.24 0.07 0.25 0.06 0.15 0.45
n 211 55 214 212 212 211 40
*p<.05, **p<.01, ***p<.001 ap<.10
The results presented in Table G-3 describe the imposition of supervision fees, CVC, and
CCC. The total amount of supervision fees ordered was significantly higher for offenders
convicted of a felony and for offenders incarcerated in jail or sentenced to RIP. No factors
significantly predicted the imposition of CVC and CCC.

183
Table G-3. Regression Analyses Predicting the Total Amount of Supervision Fees, CVC, and CCC Ordered and the
Percent Paid in Delaware County
Supervision Fees CVC CCC
Ordered % Paid If Ordered Paid in Full If Ordered Paid in Full
Mean 554.78 30.47 97.30% 43.60% 97.30% 43.60%
Mean n 116 116 226 220 226 220
Summary
Felony 252.39*** -1.33 11.66 0.75 11.66 0.53
Personal 10.14 7.78 10.76 -0.03 10.76 -0.05
Drug -46.78 9.95 -0.95 -0.09 -0.95 -0.24
Traffic -47.30 40.92** 39.36 1.85** 39.36 1.81**
Other Offense -33.36 33.82** 12.58 0.80 12.58 1.20
Prison -388.46** 10.72 -1.16 10.72 -0.97
Jail 161.78*** -8.93 -2.82 -2.00*** -2.82 -2.10***
RIP 201.07* 17.16 0.03 -1.24a 0.03 -1.70*
No Sentence -160.78 47.71 -40.65 3.35 -40.65 3.20
Non-White -57.55 3.25 0.01 -0.53 0.01 -0.67a
Age 1.65 0.44 0.56 -0.01 0.56 -0.01
Male 27.82 -7.62 -11.90 -0.13 -11.90 -0.08
Constant 150.04a 3.30 3.48 0.47 3.48 0.60
R2 0.22 0.2
n 211 108 212 208 212 208
*p<.05, **p<.01, ***p<.001 ap<.10
Juvenile Data
The results presented in Table G-4 describe the total amount of economic sanctions
ordered and the percent paid in Delaware County. For the current case, the total amount of
economic sanctions ordered was significantly lower for offenders convicted of a personal, drug,
or other offense. The percent of economic sanctions paid was significantly lower for offenders
convicted of a summary offense and significantly higher for older offenders.
Table G-4. Regression Analyses Predicting the Total Amount of Economic Sanctions Ordered and the Percent Paid
in Delaware County
Total Current Case Total All Cases
Ordered % Paid Ordered % Paid
Mean 294.14 48.03 1303.49 50.32
Mean n 162 150 177 83
Summary -34.92 -60.96** 508.38 -40.39
Felony -28.56 -2.26 -110.18 0.81
Personal -171.56** -3.94 -330.13 -5.68
Drug -150.22** -16.16 59.98 7.87

184
Traffic -104.62 28.63 -342.02 38.07
Other Offense -155.41* 16.02 -100.04 14.19
Commitment 12.08 -19.08a 180.11 -0.23
Adjudicated Delinquent -26.36 2.79 523.94 -1.13
Age -15.55 5.88* -82.56 5.58a
Male 42.43 9.79 889.05** -11.67
Constant 639.54** -44.46 1505.72 -26.70
R2 0.13 0.143 0.105 0.177
Adjusted R2 0.06 0.071 0.041 0.04
n 144 130 152 71
*p<.05, **p<.01, ***p<.001 ap<.10
Table G-5 describes the imposition of costs and fees, restitution, CVC, and CCC. The
results show that the total amount of restitution ordered was significantly lower for offenders
convicted of a personal or drug offense and for older offenders.
Table G-5. Regression Analyses Predicting the Imposition and Payment of Costs and Fees, Restitution, CVC, and
CCC in Delaware County24
Costs and Fees Restitution CVC CCC
Total
Ordered
State
Ordered
County
Ordered Ordered
%
Paid If Ordered If Ordered
Mean 139.8 2.7 221.38 470.97
Mean n 133 106 81 24
Summary -69.99 -1.82 -80.55 10.77
Felony -5.04 1.70* -16.69 -42.22
Personal 20.16 -0.74 13.65 -240.93***
Drug 13.23 -0.54 12.14 -185.45**
Traffic 100.49 -1.26 98.47 -157.45
Other Offense 6.12 0.48 0.15 -154.65a
Commitment -5.34 0.70 -2.83 4.08
Adjudicated Delinquent -30.54 -7.06** -31.44 20.37
Age 0.29 0.18 0.33 -40.65**
Male 4.05 1.04 0.50 27.29
Constant 118.38 5.56 122.85 833.00**
R2 0.037 0.172 0.046 0.222
Adjusted R2 -0.03 0.079 -0.02 0.149
n 156 100 156 118
*p<.05, **p<.01, ***p<.001 ap<.10
24
Columns were intentionally left blank when the information was unavailable.
185
APPENDIX H
Lancaster County

186
Collection of Economic Sanctions
Adult Data
Organization of collections and supervision. Lancaster County launched the
Collections Enforcement Unit (CEU) in January of 2001, following the recommendations of a
task force created when the President Judge took office in 1999. The task force felt it was
important for collections enforcement to have the power of probation officers (i.e., to modify
payment plans and enforcement). The CEU, which is part of the adult probation department, is
currently working on collections enforcement of cases on active probation. If an adult offender
still owes money on a juvenile case, the unit will attempt to collect what remains on the juvenile
case. It is the responsibility of probation officers to decide probationers‟ payment plans, but
probationers make payments to the treasurer‟s office. Each of the four probation officers who
work in the CEU have a caseload of about 2500 probationers, while supervisors have caseloads
of about 700 probationers.
On July 1, 2001, Victim Witness started handling restitution orders for victims. Prior to
that, restitution orders were handled by adult probation after the hearing.
Validity of the data. In January of 2001, the courts converted to a new computer system
and all existing computerized data on economic sanctions was assigned to one of the following
categories: state costs and fines, county costs and fines, local costs and fines, supervision fees,
and restitution. This was the case for most docket year 2000 cases. We recorded information
about specific economic sanctions from the costs and fines accounting sheets in the Clerk of
Courts paper files. Because these forms were completed at sentencing, supervision fees
estimates were usually low. Data on supervision fees was taken from computer records. Any
post-conviction economic sanctions (e.g., charged incurred for probation or parole violations)

187
assessed were recorded separately in the computer and Clerk of Courts paper files. These
economic sanctions were included in the total amount ordered on a case. Some cases, if the
offender paid in full at the time of sentencing, did not have their economic sanctions information
entered into the computer system and therefore all information was gathered from the costs and
fines accounting sheets.
Date of first conviction was relatively unreliable. Although we could usually see what
year a conviction occurred, we rarely found a specific date of conviction. Also, we could only
find in the computer convictions starting in 1980. As a result, our data regarding date of first
conviction may be underestimates. Number of prior convictions was recorded from the PCS
sentencing guideline forms, but was amended if the number of prior convictions in the computer
was higher.
Order of payment. By order of the President Judge, offenders first pay a $10/month
probation administration fee, followed by 100% of restitution, costs and fees, and probation
supervision fees. Lancaster County started collecting administrative fees in January of 2001 to
help fund the CEU. Regarding restitution, individual victims are paid first, followed by
businesses, government agencies, and insurance companies. Within each victim category,
payments of restitution are split evenly across victims. Regarding court costs, payments are
applied evenly across costs, once probation administration fees and restitution are paid in full.
Procedures used in the event of nonpayment. If probationers fail to make payments,
the CEU has a four-stage process to collect the money they owe. First, the probationer receives a
past due notice. If there is no response to the past due notice and the probationer is on active
probation, a CEU staff member will “drop in” on the next regularly scheduled probation meeting,
but only for probationers supervised in the city of Lancaster. Offenders supervised in satellite

188
offices have to come in to meet with CEU officers. Third, CEU sends a delinquency letter, at
which point probationers have to meet with a CEU probation officer. The fourth step depends on
whether the case is active or inactive. If the case is inactive, CEU files contempt charges. If the
case is active, CEU schedules a violation hearing. In the past, there were over 100 violation
hearings a month. However, cases rarely reach this stage now (i.e., only about 12 cases a
month).
CEU computer records date back to 1980. All cases from the 1980s with money owed,
which amounts to approximately $2.4 million, have been turned over to a private collections
agency. If the collections agency is unsuccessful, however, Lancaster County will not pursue
these cases further. On September 22, 2003, the CEU turned over an additional 6,000 cases from
1990-2001 to a private collections agency. These cases were chosen because they were not
actively supervised, no payment had been made for 90 days, and/or they had no payment plan in
place. Some of the cases sent to a private collections agency were for incarcerated offenders.
Juvenile Data
Organization of collections and supervision. Lancaster County has about 1,500
juvenile cases per year, 600 of which are handled informally. In informally handled cases,
juveniles receive six months of informal probation, but may also be sentenced to community
service, counseling, or restitution, which is usually handled through the Victim-Offender
Reconciliation Program (VORP) office. Informally handled cases are not included in court
docket files. A case is moved to non-supervised probation if all terms of the sentence are
fulfilled except payment of economic sanctions. Technically, all juveniles who complete their
supervision are on non-supervised probation until the age of 21.
189
Most other cases are petitioned to court. If the juvenile commits a serious offense, the
probation officer conducts a background investigation and then goes to court with a
recommendation. In most cases, the offender is adjudicated delinquent and, at minimum,
receives a sentence of probation. Offenders may also be adjudicated dependent instead of or in
addition to being adjudicated delinquent. Lancaster County does not use consent decrees. As a
last resort, a juvenile may be certified to adult court. In these cases, juvenile probation goes to
the judge and asks that a case be moved to the adult system. If a case is decertified from adult
court, juvenile probation does not become involved until the case is decertified, which is
typically seven to nine months after the offense.
In informally handled cases, no economic sanctions are ordered except for restitution (if
applicable). Juveniles pay economic sanctions per petition number, not per conviction offense.
According to juvenile probation, juveniles are sentenced to approximately $130 per petition
number. Although the Clerk of Courts office compiles the bill for court costs, payments are
made to the treasurer. Juveniles are not fined at the Court of Common Pleas level, but fines can
be assessed at the District Justice level.
Validity of the data. The juvenile data gathered depended on whether the case was
handled informally or was petitioned to the court. For informally handled cases, all data was
collected from the juvenile probation files. For cases petitioned to the court, data was gathered
from the Clerk of Courts paper files and computer records, although the information available in
the computer was very limited.
Order of payment. Although the economic sanctions are handled through different
systems, juveniles are supposed to pay 100% of restitution before paying any other economic
sanction. Restitution orders and payments for juveniles are not in the computer system.

190
Procedures used in the event of nonpayment. Lancaster County does not pursue
payment from the parents if the juvenile does not pay. For both informal adjustments and
adjudications of delinquency, juvenile probation takes over payment of restitution if the VORP
process is not successful at resolving restitution issues. Juvenile probation contacts victims to
determine the amount of restitution owed and then collects it from the juvenile. Although
parents are not responsible for paying a juvenile‟s restitution, they can pay it if they want.
Method
Sampling. In addition to the 530 adult cases from calendar year 2000, we also collected
an additional sample of 2001 adult criminal cases in Lancaster County. We collected data on
cases from the second half of 2001 in order to evaluate the effectiveness of the Collections
Enforcement Unit that was created within probation and started enforcing collections in January
of 2001. Sampling followed the same procedures used for year 2000 cases. The six-month
sample from year 2001 has 170 cases.
Data collection. Data collection was undertaken from July to September of 2003. Data
for adult cases was gathered from Clerk of Courts paper files and from the county computer
system. Unfortunately, a new computer system was implemented in January of 2001, and in the
conversion from the old system, existing economic sanctions were combined. What remained
were five general categories: state fees/costs/fines, county fees/costs/fines, local fees/costs/fines,
supervision fees, and restitution. We recorded information about specific economic sanctions
from the costs and fines accounting forms in the Clerk of Courts paper files.
Data collection for juvenile cases depended on how the case was handled. For formally
handled cases, data was available in Clerk of Court paper files and in the county computer
system. For informally handled cases, data was available only in juvenile probation records.

191
Results
Adult Data
Table H-1 describes the total amount of economic sanctions ordered and the percent paid
for both the current case and across all cases. The total amount of economic sanctions ordered
was significantly higher for offenders incarcerated in prison. The percent of economic sanctions
paid was significantly lower for incarcerated offenders.
Table H-1. Regression Analyses Predicting the Total Amount of Economic Sanctions Ordered and the Percent Paid
in Lancaster County
Total Current Case Total All Cases
Ordered % Paid Ordered % Paid
Mean 1864.41 42.81 5783.52 46.45
Mean n 475 475 483 483
Summary -956.13 -12.57 -150.25 -8.00
Felony -306.03 -1.84 1273.56 -10.22a
Personal -1021.39 19.20* -5567.84** 20.17**
Drug -802.83 6.01 -4329.15* 1.56
Traffic -535.06 41.55*** -6305.13*** 27.50***
Other Offense -1135.06 14.55 -3554.49 9.65
Prison 5292.24*** -28.19* 10653.29** -22.99*
Jail -611.93 -25.35*** 554.53 -15.63***
RIP -612.05 -15.33 485.09 -0.39
No Sentence -1294.40 21.44a -2774.98 11.78
Non-White -87.26 -13.58* -1562.32 -14.33**
Age 11.93 0.28 40.68 0.55**
Male 662.14 -1.41 2079.17 4.21
Constant 1617.00 32.29** 5967.61* 27.03***
R2 0.06 0.21 0.11 0.28
n 373 363 373 367
*p<.05, **p<.01, ***p<.001 ap<.10
The results presented in Table H-2 describe the total amount of fines, costs and fees, and
restitution ordered and the percent paid. The total amount of fines ordered was significantly
higher for offenders convicted of a drug offense and for offenders incarcerated in prison.
Overall, the total amount of costs and fees ordered was significantly higher for offenders

192
convicted of a felony and for offenders convicted of a traffic offense. The percent of costs and
fees and restitution paid was significantly lower for incarcerated offenders.
Table H-2. Regression Analyses Predicting the Total Amount of Fines, Costs and Fees, and Restitution Ordered and
the Percent Paid in Lancaster County25
Fines Costs and Fees Restitution
Ordered % Paid Total
Ordered
State
Ordered
County
Ordered
Ordered % Paid
Mean 506.59 413.25 233.81 469.7 2523.91 33.64
Mean n 355 466 474 477 114 114
Summary 105.99 -225.65* -145.97* -388.99** -562.97 52.52
Felony 70.21 102.28** 34.14 114.61* -467.96 -14.61
Personal -104.27 20.75 88.63** 77.97 -915.05 11.98
Drug 728.28** -10.68 7.23 -49.26 -1571.74a 27.89
Traffic 349.02 527.23*** 194.67*** 576.89*** -1607.41* -5.05
Other Offense 198.68 61.63 45.21 90.59 -1421.57 1.15
Prison 3119.19*** 5.66 -103.22* -136.75 2108.87 -43.50*
Jail 125.19 -136.15*** -38.35a -208.59*** -519.63 -22.60
a
RIP 215.62 -173.89* -103.84a -367.66** -442.56
No Sentence -296.85 -186.57*** -73.33* -261.74*** -421.80 -56.86
Non-White 322.20 -20.08 -44.20* -83.32a -344.89 6.95
Age -5.70 0.36 -0.04 -0.22 19.78 0.54
Male 50.79 17.78 -16.14 -12.42 589.83 -2.45
Constant 22.45 274.21*** 195.36*** 414.05*** 784.02 35.05a
R2 0.21 0.52 0.25 0.42 0.03 0.23
n 372 373 373 373 373 92
*p<.05, **p<.01, ***p<.001 ap<.10
The results presented in Table H-3 describe the imposition of supervision fees, CVC, and
CCC. The total amount of supervision fees ordered was significantly higher for offenders
convicted of personal or traffic offenses, for non-incarcerated offenders, and for white offenders.
The percent of supervision fees paid was significantly higher for offenders convicted of personal
or traffic offenses. CVC and CCC were less likely to be imposed when the offender was
convicted of a drug offense.
25
Columns were intentionally left blank when the information was unavailable.
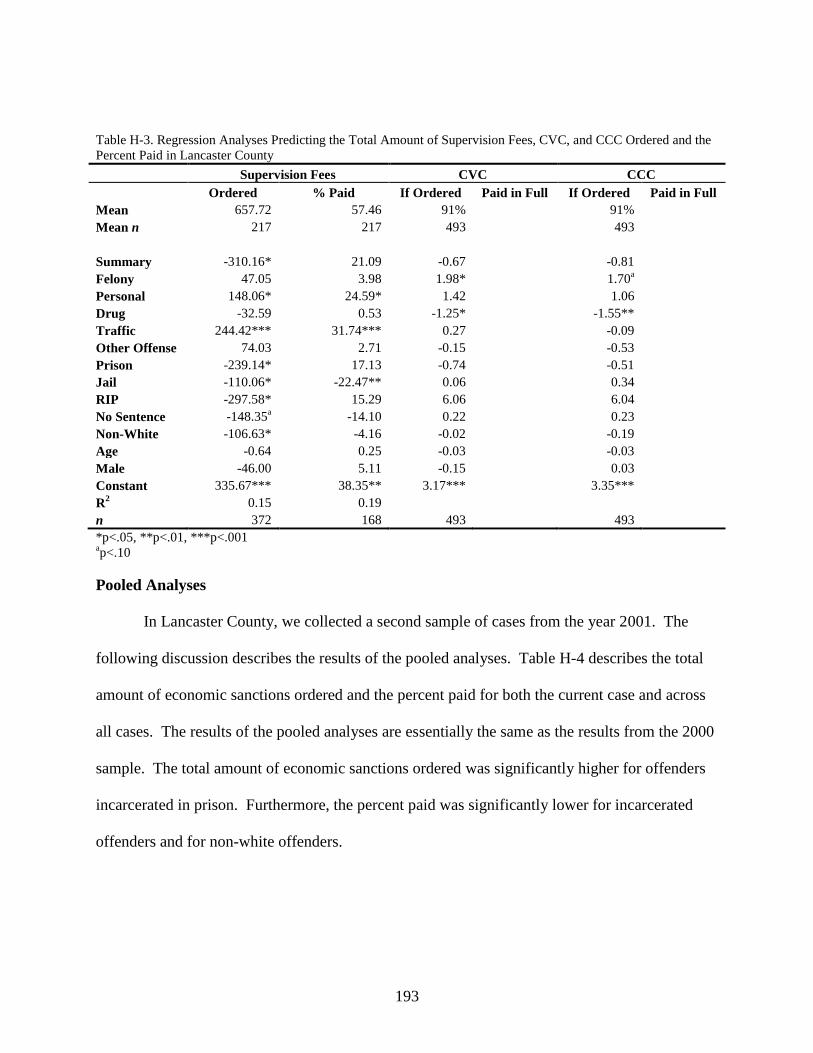
193
Table H-3. Regression Analyses Predicting the Total Amount of Supervision Fees, CVC, and CCC Ordered and the
Percent Paid in Lancaster County
Supervision Fees CVC CCC
Ordered % Paid If Ordered Paid in Full If Ordered Paid in Full
Mean 657.72 57.46 91% 91%
Mean n 217 217 493 493
Summary -310.16* 21.09 -0.67 -0.81
Felony 47.05 3.98 1.98* 1.70a
Personal 148.06* 24.59* 1.42 1.06
Drug -32.59 0.53 -1.25* -1.55**
Traffic 244.42*** 31.74*** 0.27 -0.09
Other Offense 74.03 2.71 -0.15 -0.53
Prison -239.14* 17.13 -0.74 -0.51
Jail -110.06* -22.47** 0.06 0.34
RIP -297.58* 15.29 6.06 6.04
No Sentence -148.35a -14.10 0.22 0.23
Non-White -106.63* -4.16 -0.02 -0.19
Age -0.64 0.25 -0.03 -0.03
Male -46.00 5.11 -0.15 0.03
Constant 335.67*** 38.35** 3.17*** 3.35***
R2 0.15 0.19
n 372 168 493 493
*p<.05, **p<.01, ***p<.001 ap<.10
Pooled Analyses
In Lancaster County, we collected a second sample of cases from the year 2001. The
following discussion describes the results of the pooled analyses. Table H-4 describes the total
amount of economic sanctions ordered and the percent paid for both the current case and across
all cases. The results of the pooled analyses are essentially the same as the results from the 2000
sample. The total amount of economic sanctions ordered was significantly higher for offenders
incarcerated in prison. Furthermore, the percent paid was significantly lower for incarcerated
offenders and for non-white offenders.
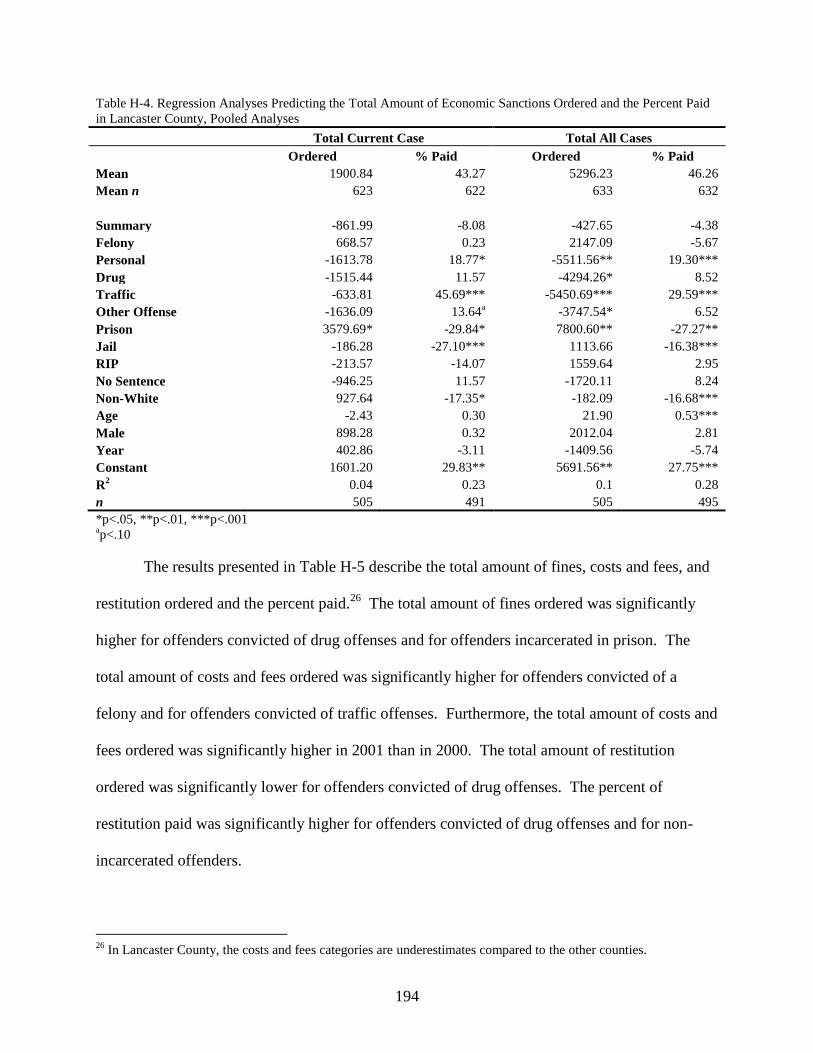
194
Table H-4. Regression Analyses Predicting the Total Amount of Economic Sanctions Ordered and the Percent Paid
in Lancaster County, Pooled Analyses
Total Current Case Total All Cases
Ordered % Paid Ordered % Paid
Mean 1900.84 43.27 5296.23 46.26
Mean n 623 622 633 632
Summary -861.99 -8.08 -427.65 -4.38
Felony 668.57 0.23 2147.09 -5.67
Personal -1613.78 18.77* -5511.56** 19.30***
Drug -1515.44 11.57 -4294.26* 8.52
Traffic -633.81 45.69*** -5450.69*** 29.59***
Other Offense -1636.09 13.64a -3747.54* 6.52
Prison 3579.69* -29.84* 7800.60** -27.27**
Jail -186.28 -27.10*** 1113.66 -16.38***
RIP -213.57 -14.07 1559.64 2.95
No Sentence -946.25 11.57 -1720.11 8.24
Non-White 927.64 -17.35* -182.09 -16.68***
Age -2.43 0.30 21.90 0.53***
Male 898.28 0.32 2012.04 2.81
Year 402.86 -3.11 -1409.56 -5.74
Constant 1601.20 29.83** 5691.56** 27.75***
R2 0.04 0.23 0.1 0.28
n 505 491 505 495
*p<.05, **p<.01, ***p<.001 ap<.10
The results presented in Table H-5 describe the total amount of fines, costs and fees, and
restitution ordered and the percent paid.26
The total amount of fines ordered was significantly
higher for offenders convicted of drug offenses and for offenders incarcerated in prison. The
total amount of costs and fees ordered was significantly higher for offenders convicted of a
felony and for offenders convicted of traffic offenses. Furthermore, the total amount of costs and
fees ordered was significantly higher in 2001 than in 2000. The total amount of restitution
ordered was significantly lower for offenders convicted of drug offenses. The percent of
restitution paid was significantly higher for offenders convicted of drug offenses and for non-
incarcerated offenders.
26
In Lancaster County, the costs and fees categories are underestimates compared to the other counties.

195
Table H-5. Regression Analyses Predicting the Total Amount of Fines, Costs and Fees, and Restitution Ordered and
the Percent Paid in Lancaster County, Pooled Sample
Fines Costs and Fees Restitution
Ordered % Paid Total
Ordered
State
Ordered
County
Ordered
Ordered % Paid
Mean 457.34 433.82 242.32 493.74 2731.88 31.46
Mean n 458 613 619 624 153 150
Summary 108.53 -167.66* -126.65* -306.27** -626.27 68.23
Felony 37.82 120.07*** 33.77 137.89** 530.82 -3.50
Personal -164.30 5.40 66.29* 52.54 -1370.29 19.52
Drug 635.62** -13.25 16.45 -40.47 -2121.49* 41.01*
Traffic 286.48 566.06*** 185.57*** 618.40*** -1627.21a -2.88
Other Offense 172.73 40.27 45.22 61.10 -1806.33a -7.88
Prison 2855.15*** 19.45 -112.35** -161.28a 814.05 -47.59**
Jail 148.78 -162.26*** -45.77* -237.73*** -67.92 -25.83**
RIP 288.64 -187.63** -45.18 -295.99*** -209.27
No Sentence -293.02 -182.47*** -99.19** -262.51*** -92.30 -55.18
Non-White 276.02a -28.50 -53.89** -88.52* 753.19 -1.71
Age -6.79 -0.19 -0.38 -0.83 7.47 0.48
Male 60.59 23.49 -15.66 2.76 819.13 6.58
Year 0.00 66.37** 36.45* 75.22* 478.82 -5.70
Constant 111.25 284.60*** 215.73*** 417.42*** 586.41 26.89
R2 0.19 0.57 0.26 0.48 0.03 0.18
n 459 500 500 501 499 122
*p<.05, **p<.01, ***p<.001 ap<.10
The results presented in Table H-6 describe the imposition of supervision fees, CVC, and
CCC. The total amount of supervision fees ordered was significantly higher for offenders
convicted of a personal or traffic offense, for non-incarcerated offenders, and for white
offenders. Furthermore, the total amount of supervision fees ordered was significantly higher in
2001 than in 2000.27
Table H-6. Regression Analyses Predicting the Total Amount of Supervision Fees, CVC, and CCC Ordered and the
Percent Paid in Lancaster County, Pooled Sample
Supervision Fees CVC CCC
Ordered % Paid If Ordered Paid in Full If Ordered Paid in Full
Mean 620.35 62.11 93% 93%
Mean n 311 257 632 607
Summary -302.78* 22.05 -0.67 -0.81
Felony 59.31 1.26 1.98* 1.70a
27
The amount of supervision fees ordered is significantly higher in 2001 than in 2000 because, starting in January of
2001, the President Judge added a $10 a month administration fee.

196
Personal 136.82* 21.60* 1.42 1.06
Drug -15.80 0.77 -1.25* -1.55**
Traffic 231.27*** 28.12*** 0.27 -0.09
Other Offense 65.63 -1.88 -0.15 -0.53
Prison -240.77* 20.60 -0.74 -0.51
Jail -89.00* -21.05** 0.06 0.34
RIP -205.37* -0.26 7.11 7.08
No Sentence -146.06* -8.67 0.22 0.23
Non-White -128.85** -9.03 -0.02 -0.19
Age -1.11 0.14 -0.03 -0.03
Male -40.45 5.78 -0.15 0.03
Year 179.42*** 23.03** 7.75 7.51
Constant 342.83*** 44.29*** 3.17*** 3.35***
R2 0.19 0.24
n 462 205 496 476
*p<.05, **p<.01, ***p<.001 ap<.10
Juvenile Data
The results presented in Table H-7 describe the total amount of economic sanctions
ordered and the percent paid in Lancaster County. The total amount of economic sanctions
ordered was significantly higher for offenders who were adjudicated delinquent. For the current
case, the percent of economic sanctions paid was significantly higher for offenders convicted of
personal or drug offenses and significantly lower for committed offenders.
Table H-7. Regression Analyses Predicting the Total Amount of Economic Sanctions Ordered and the Percent Paid
in Lancaster County
Total Current Case Total All Cases
Ordered % Paid Ordered % Paid
Mean 868.23 55.23 1749.16 54.32
Mean n 139 132 133 133
Summary -1033.68 -9.89 -2833.07 -6.78
Felony -276.87 -10.12 520.75 -10.17
Personal -1383.60 38.07** -1409.21 29.98
Drug -1549.59 23.71* 187.98 10.90
Traffic -1809.06 33.99 -2502.89 50.95
Other Offense -361.95 19.81 1730.96 8.88
Commitment -204.81 -21.87* -183.64 -12.94
Adjudicated Delinquent -5269.46** -5.28 -11436.45*** -0.51
Age 401.47 4.68a 719.43
a 3.14
Male 1457.20 14.48 1683.94 5.56
Constant -1130.84 -38.63 -28.26 -8.12
R2 0.092 0.2 0.138 0.135
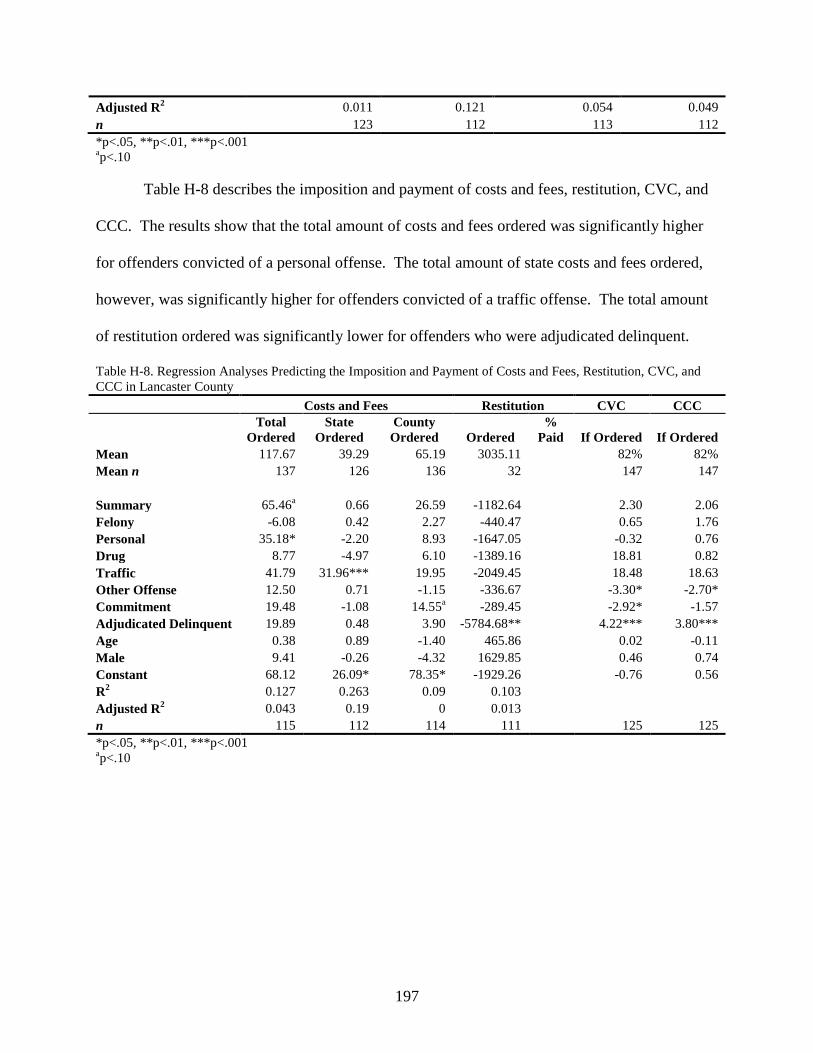
197
Adjusted R2 0.011 0.121 0.054 0.049
n 123 112 113 112
*p<.05, **p<.01, ***p<.001 ap<.10
Table H-8 describes the imposition and payment of costs and fees, restitution, CVC, and
CCC. The results show that the total amount of costs and fees ordered was significantly higher
for offenders convicted of a personal offense. The total amount of state costs and fees ordered,
however, was significantly higher for offenders convicted of a traffic offense. The total amount
of restitution ordered was significantly lower for offenders who were adjudicated delinquent.
Table H-8. Regression Analyses Predicting the Imposition and Payment of Costs and Fees, Restitution, CVC, and
CCC in Lancaster County
Costs and Fees Restitution CVC CCC
Total
Ordered
State
Ordered
County
Ordered Ordered
%
Paid If Ordered If Ordered
Mean 117.67 39.29 65.19 3035.11 82% 82%
Mean n 137 126 136 32 147 147
Summary 65.46a 0.66 26.59 -1182.64 2.30 2.06
Felony -6.08 0.42 2.27 -440.47 0.65 1.76
Personal 35.18* -2.20 8.93 -1647.05 -0.32 0.76
Drug 8.77 -4.97 6.10 -1389.16 18.81 0.82
Traffic 41.79 31.96*** 19.95 -2049.45 18.48 18.63
Other Offense 12.50 0.71 -1.15 -336.67 -3.30* -2.70*
Commitment 19.48 -1.08 14.55a -289.45 -2.92* -1.57
Adjudicated Delinquent 19.89 0.48 3.90 -5784.68** 4.22*** 3.80***
Age 0.38 0.89 -1.40 465.86 0.02 -0.11
Male 9.41 -0.26 -4.32 1629.85 0.46 0.74
Constant 68.12 26.09* 78.35* -1929.26 -0.76 0.56
R2 0.127 0.263 0.09 0.103
Adjusted R2 0.043 0.19 0 0.013
n 115 112 114 111 125 125
*p<.05, **p<.01, ***p<.001 ap<.10

198
APPENDIX I
Luzerne County

199
Collection of Economic Sanctions
Adult and Juvenile Data
Organization of collections and supervision. Luzerne County has a special restitution
enforcement office that collects restitution and supervision fees for both adults and juveniles.
However, costs and fines are handled elsewhere. Although this specialized unit operates
independently, it usually works closely with the adult probation department to improve the
collection of economic sanctions. After sentencing, offenders go to the probation office and
meet with a probation officer and a restitution officer. During this meeting, the officers establish
a payment plan based on the offender‟s financial situation. Although restitution and supervision
fees are handled by the same office, adult offenders have to make two separate payments (i.e.,
one payment for restitution and one payment for supervision fees). In contrast, juvenile
offenders make only one payment, which is then dispersed to the appropriate places. A staff
member informed us that restitution receives priority when dispersing these payments.
In the year 2000, Luzerne County did not order juveniles to pay court costs. However,
most juveniles were ordered to pay fines, which were to be paid immediately (or at least within
two months). When only fines were imposed, most juveniles did not receive a monthly payment
plan. If a juvenile was on probation, however, he/she was required to have a payment plan for
fines, fees, and restitution. As a condition of probation, all juveniles must either attend
school/job training or find employment. If a juvenile is employed, 75% of his/her wages goes
toward restitution and fines. Furthermore, any money earned while in a placement facility (e.g.,
boot camp) goes toward what the juvenile owes. Juveniles are responsible for paying restitution,
fines, costs, and supervision fees, while parents are responsible for placement costs, detention,
electronic monitoring, and psychological evaluations.

200
Validity of the data. For both adults and juveniles, cases were often combined. As a
result, sentencing information and economic sanctions information were combined across cases.
Offense dates, arrest dates, and incarceration dates were also combined across cases. By
comparing information across different databases, we were usually able to separate out the
sentencing information for each case. However, information about supervision fees, restitution
amounts, and some dates may be inaccurate.
Order of payment. In the year 2000, the collection of economic sanctions was split
between the Clerk of Courts Office and the Probation Office. The Probation Office collected
supervision fees and restitution and the Clerk of Courts Office collected costs and fines. Each
time an offender made a payment to the Probation Office, 50% of the payment was applied to
restitution and 50% of the payment was applied to supervision fees.
Procedures used in the event of nonpayment. The Clerk of Courts sends each offender
a bill for all court costs and fines. If the offender is unable to pay, he/she must contact the Clerk
of Courts to negotiate a payment plan. If offenders miss payments while on probation, they may
have their probation or parole revoked. If the offender is no longer on probation but still owes
money, he/she may be held in contempt of court for nonpayment. A staff member informed us
that the restitution office has an 86% collection rate for fees and restitution. They also informed
us that they occasionally use outside collection agencies for people who are no longer on
probation but still owe money for fees and restitution.
A staff member informed us that juveniles who failed to pay their fines on time or who
failed to make payments according to their payment plan were sent to detention until someone
paid their fines. Because most juvenile cases were for nonpayment of fines, this outcome seems
201
fairly common. However, it is at the judge‟s discretion which juveniles are sent to detention for
nonpayment of fines.
Method
Data collection. We collected data in Luzerne County from July to September of 2003.
For adult cases, we collected data from Clerk of Courts paper and computer files, probation
computer files, and the restitution collection unit‟s computer files. These sources allowed us to
collect detailed information about offenders, charge and conviction offenses, sentences, and
economic sanctions for each adult case. However, three problems limited data collection for
adults. First, Victim/Witness Services did not have any case-specific information from the year
2000. As a result, we were unable to collect detailed victim information. Second, adult cases
were frequently combined in the Clerk of Courts and adult probation computer systems, meaning
that sentencing information and data on economic sanctions were combined from multiple cases.
In these cases, we were unable to collect complete information about a particular case. Third,
PCS sentencing guideline forms were rarely available in Clerk of Courts paper files. As a result,
we were unable to collect several types of information, including the Prior Record Score (PRS)
and the Offense Gravity Score (OGS). To compensate for this limitation, we recorded the
number of prior convictions listed in the Clerk of Courts computer system. However, these
records likely underestimate the true number of prior convictions for each offender.
In general, we were able to collect only limited amounts of juvenile data in Luzerne
County. The juvenile probation computer system and the juvenile probation paper files offered
detailed information about the offenders‟ backgrounds, charges, and sentences. However,
juvenile probation files were missing for 100 (40%) of the cases.

202
Two other data sources in Luzerne County had important information about juvenile
cases. The juvenile book records contain complete information on the charges, convictions,
disposition, and sentence given for each juvenile case. Additionally, the Restitution Collection
Unit‟s computer system contains almost all of the information on economic sanctions imposed
and collected for juvenile cases because outstanding juvenile balances are frequently turned over
to this unit. However, we were unable to collect information from these data sources due to time
and resource constraints. As a result, we collected only limited information on economic
sanctions imposed and collected for juvenile cases. Additionally, our sentencing data may be
incomplete for some juvenile cases.

203
APPENDIX J
Westmoreland County

204
Collection of Economic Sanctions
Adult Data
Organization of collections and supervision. In Westmoreland County, the Clerk of
Courts Office is responsible for the collection of all court-ordered economic sanctions.
However, the Adult Probation Office is responsible for enforcing the collection of all court-
ordered economic sanctions. Offenders are ordered to pay restitution, fines, fees, and costs as
part of their sentencing order. After offenders are processed through intake in the Adult
Probation Office, a payment plan is established. Offenders are required, as a condition of their
probation, to pay off all economic sanctions owed.
Validity of the data. Data for adult cases was collected from probation paper files and
Clerk of Courts computer files. We did not collect data from probation computer files because
they provided less information than probation paper files and were therefore unnecessary. We
did not have access to Clerk of Courts paper files.
Order of payment. In Westmoreland County, payments made by offenders are applied
in the following order: (a) restitution, (b) electronic monitoring fees, then (c) supervision fees,
fines, costs.
Procedures used in the event of nonpayment. When offenders fail to make payments,
Westmoreland County uses a four-stage process to collect the money they owe. First, the
offender receives a warning letter asking for payment. Second, the offender has a technical
violation hearing before a hearing officer in Adult Probation. Third, the offender has a
revocation hearing before a judge. Fourth, the offender is turned over to a private collections
agency.

205
Juvenile Data
Organization of collections and supervision. In Westmoreland County, the Clerk of
Courts Office is responsible for the collection of restitution, fines and costs. After the juvenile
has completed his/her court hearing and restitution, fines, and costs have been ordered, the Clerk
of Courts Office sends an invoice to the juvenile. The Juvenile Probation Office is responsible
for charging supervision fees for all juveniles on electronic monitoring.
Validity of the data. In Westmoreland County, the Juvenile Probation Office was
located in a separate building across town, rather than in the courthouse. Because of time
constraints, we collected information about juvenile cases from only Clerk of Courts paper files.
The Clerk of Courts Office assigns each juvenile one file number for his/her entire juvenile
history. Within each file, however, different cases have different referral numbers.
Juvenile docket files in the Clerk of Courts Office go back as far as 1999. Because Clerk
of Courts paper files were organized by time (i.e., by when the juvenile entered the system), we
could not obtain a list of all cases for the year 2000. Instead, we sampled every other case.
Then, for each juvenile, we selected his/her first case from the year 2000. Although Clerk of
Courts paper files included information about both delinquent and dependent children, we
excluded dependency cases from our sample.
Order of payment. Each time an offender makes a payment, the first $50 is paid to the
Crime Victim Compensation fund. Restitution is paid next, followed by state and county costs.
Procedures used in the event of nonpayment. If an offender fails to complete his/her
payments, the type of action taken depends on the case (i.e., on whether the juvenile has the
means to pay, is old enough to work, etc.). The Juvenile Probation Office either violates the
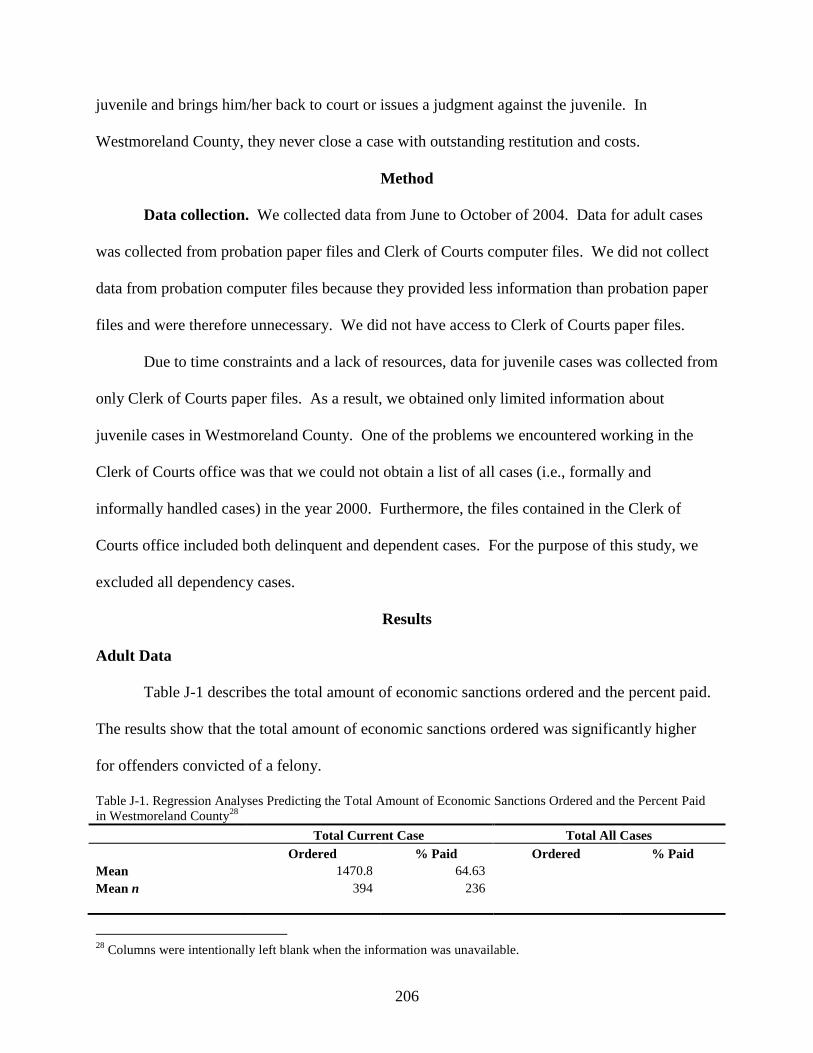
206
juvenile and brings him/her back to court or issues a judgment against the juvenile. In
Westmoreland County, they never close a case with outstanding restitution and costs.
Method
Data collection. We collected data from June to October of 2004. Data for adult cases
was collected from probation paper files and Clerk of Courts computer files. We did not collect
data from probation computer files because they provided less information than probation paper
files and were therefore unnecessary. We did not have access to Clerk of Courts paper files.
Due to time constraints and a lack of resources, data for juvenile cases was collected from
only Clerk of Courts paper files. As a result, we obtained only limited information about
juvenile cases in Westmoreland County. One of the problems we encountered working in the
Clerk of Courts office was that we could not obtain a list of all cases (i.e., formally and
informally handled cases) in the year 2000. Furthermore, the files contained in the Clerk of
Courts office included both delinquent and dependent cases. For the purpose of this study, we
excluded all dependency cases.
Results
Adult Data
Table J-1 describes the total amount of economic sanctions ordered and the percent paid.
The results show that the total amount of economic sanctions ordered was significantly higher
for offenders convicted of a felony.
Table J-1. Regression Analyses Predicting the Total Amount of Economic Sanctions Ordered and the Percent Paid
in Westmoreland County28
Total Current Case Total All Cases
Ordered % Paid Ordered % Paid
Mean 1470.8 64.63
Mean n 394 236
28
Columns were intentionally left blank when the information was unavailable.
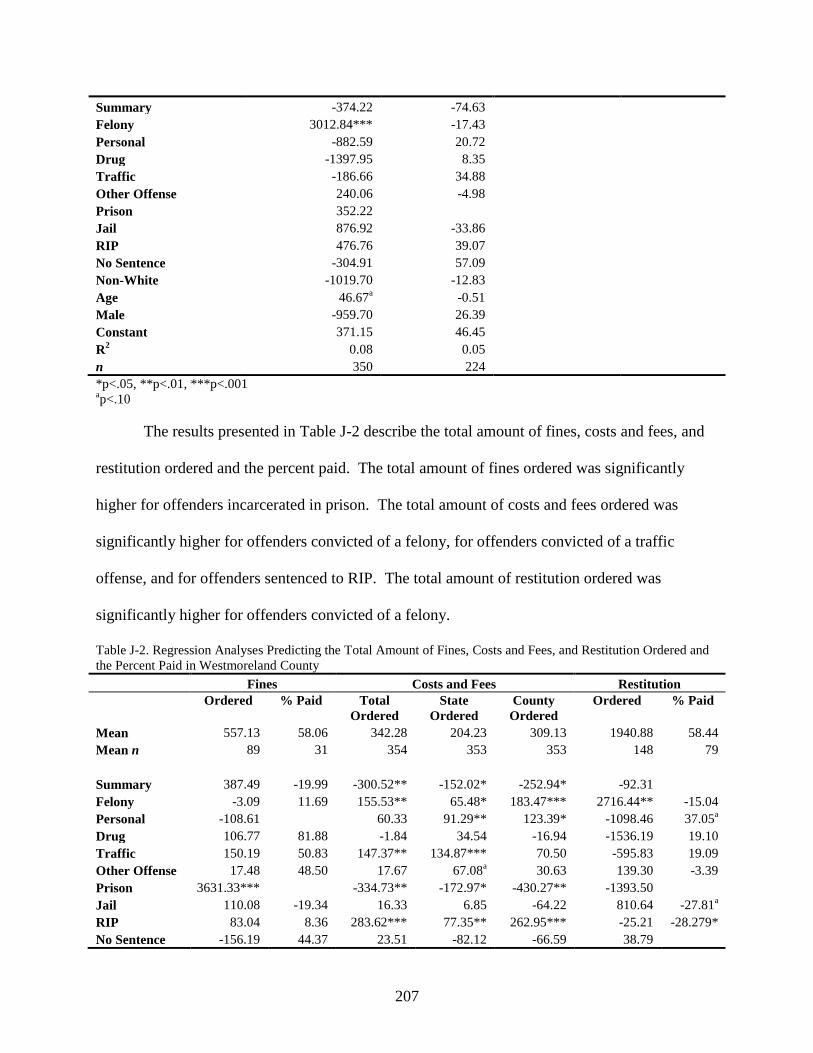
207
Summary -374.22 -74.63
Felony 3012.84*** -17.43
Personal -882.59 20.72
Drug -1397.95 8.35
Traffic -186.66 34.88
Other Offense 240.06 -4.98
Prison 352.22
Jail 876.92 -33.86
RIP 476.76 39.07
No Sentence -304.91 57.09
Non-White -1019.70 -12.83
Age 46.67a -0.51
Male -959.70 26.39
Constant 371.15 46.45
R2 0.08 0.05
n 350 224
*p<.05, **p<.01, ***p<.001 ap<.10
The results presented in Table J-2 describe the total amount of fines, costs and fees, and
restitution ordered and the percent paid. The total amount of fines ordered was significantly
higher for offenders incarcerated in prison. The total amount of costs and fees ordered was
significantly higher for offenders convicted of a felony, for offenders convicted of a traffic
offense, and for offenders sentenced to RIP. The total amount of restitution ordered was
significantly higher for offenders convicted of a felony.
Table J-2. Regression Analyses Predicting the Total Amount of Fines, Costs and Fees, and Restitution Ordered and
the Percent Paid in Westmoreland County
Fines Costs and Fees Restitution
Ordered % Paid Total
Ordered
State
Ordered
County
Ordered
Ordered % Paid
Mean 557.13 58.06 342.28 204.23 309.13 1940.88 58.44
Mean n 89 31 354 353 353 148 79
Summary 387.49 -19.99 -300.52** -152.02* -252.94* -92.31
Felony -3.09 11.69 155.53** 65.48* 183.47*** 2716.44** -15.04
Personal -108.61 60.33 91.29** 123.39* -1098.46 37.05a
Drug 106.77 81.88 -1.84 34.54 -16.94 -1536.19 19.10
Traffic 150.19 50.83 147.37** 134.87*** 70.50 -595.83 19.09
Other Offense 17.48 48.50 17.67 67.08a 30.63 139.30 -3.39
Prison 3631.33*** -334.73** -172.97* -430.27** -1393.50
Jail 110.08 -19.34 16.33 6.85 -64.22 810.64 -27.81a
RIP 83.04 8.36 283.62*** 77.35** 262.95*** -25.21 -28.279*
No Sentence -156.19 44.37 23.51 -82.12 -66.59 38.79
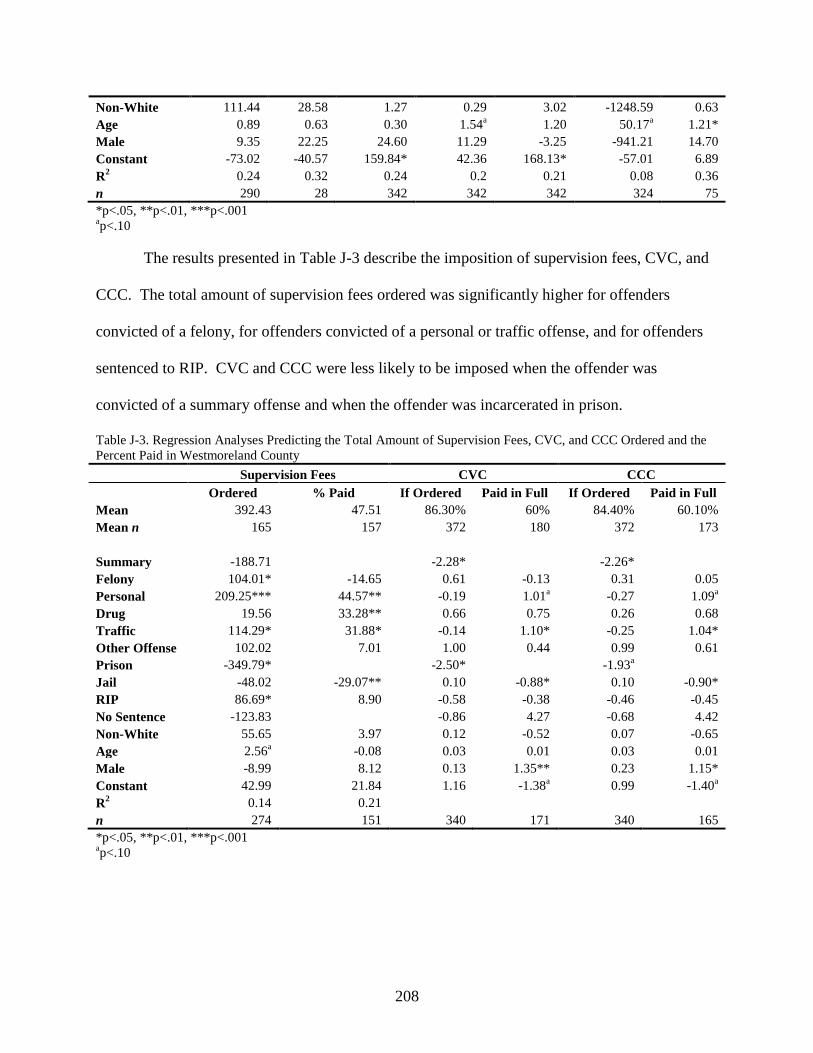
208
Non-White 111.44 28.58 1.27 0.29 3.02 -1248.59 0.63
Age 0.89 0.63 0.30 1.54a 1.20 50.17
a 1.21*
Male 9.35 22.25 24.60 11.29 -3.25 -941.21 14.70
Constant -73.02 -40.57 159.84* 42.36 168.13* -57.01 6.89
R2 0.24 0.32 0.24 0.2 0.21 0.08 0.36
n 290 28 342 342 342 324 75
*p<.05, **p<.01, ***p<.001 ap<.10
The results presented in Table J-3 describe the imposition of supervision fees, CVC, and
CCC. The total amount of supervision fees ordered was significantly higher for offenders
convicted of a felony, for offenders convicted of a personal or traffic offense, and for offenders
sentenced to RIP. CVC and CCC were less likely to be imposed when the offender was
convicted of a summary offense and when the offender was incarcerated in prison.
Table J-3. Regression Analyses Predicting the Total Amount of Supervision Fees, CVC, and CCC Ordered and the
Percent Paid in Westmoreland County
Supervision Fees CVC CCC
Ordered % Paid If Ordered Paid in Full If Ordered Paid in Full
Mean 392.43 47.51 86.30% 60% 84.40% 60.10%
Mean n 165 157 372 180 372 173
Summary -188.71 -2.28* -2.26*
Felony 104.01* -14.65 0.61 -0.13 0.31 0.05
Personal 209.25*** 44.57** -0.19 1.01a -0.27 1.09
a
Drug 19.56 33.28** 0.66 0.75 0.26 0.68
Traffic 114.29* 31.88* -0.14 1.10* -0.25 1.04*
Other Offense 102.02 7.01 1.00 0.44 0.99 0.61
Prison -349.79* -2.50* -1.93a
Jail -48.02 -29.07** 0.10 -0.88* 0.10 -0.90*
RIP 86.69* 8.90 -0.58 -0.38 -0.46 -0.45
No Sentence -123.83 -0.86 4.27 -0.68 4.42
Non-White 55.65 3.97 0.12 -0.52 0.07 -0.65
Age 2.56a -0.08 0.03 0.01 0.03 0.01
Male -8.99 8.12 0.13 1.35** 0.23 1.15*
Constant 42.99 21.84 1.16 -1.38a 0.99 -1.40
a
R2 0.14 0.21
n 274 151 340 171 340 165
*p<.05, **p<.01, ***p<.001 ap<.10

209
Juvenile Data
The results presented in Table J-4 describe the total amount of economic sanctions
ordered and the percent paid in Westmoreland County. The total amount of economic sanctions
ordered was significantly higher for offenders convicted of a felony and for older offenders. The
percent of economic sanctions paid was significantly higher for older offenders and for offenders
who were adjudicated delinquent. The percent of economic sanctions paid was significantly
lower for committed offenders.
Table J-4. Regression Analyses Predicting the Total Amount of Economic Sanctions Ordered and the Percent Paid
in Westmoreland County
Total Current Case Total All Cases
Ordered % Paid Ordered % Paid
Mean 314.16 93.01
Mean n 127 45
Summary
Felony 471.86* -15.86
Personal -9.74 -1.92
Drug -349.88a 18.18
Traffic -331.50 2.76
Other Offense -96.12 6.40
Commitment -393.72 -31.07*
Adjudicated Delinquent 119.45 21.57*
Age 121.93** 4.96*
Male -97.29 -8.97
Constant -1544.64* 15.16
R2 0.196 0.334
Adjusted R2 0.119 0.141
n 104 41
*p<.05, **p<.01, ***p<.001 ap<.10
Table J-5 describes the imposition of costs and fees, restitution, CVC, and CCC. The
results show that the total amount of costs and fees ordered was significantly higher for offenders
convicted of a traffic offense and for committed offenders. The total amount of restitution
ordered was significantly higher for offenders convicted of a felony. The results also show that
CVC and CCC were imposed in three-quarters of all cases.

210
Table J-5. Regression Analyses Predicting the Imposition and Payment of Costs and Fees, Restitution, CVC, and
CCC in Westmoreland County
Costs and Fees Restitution CVC CCC
Total
Ordered
State
Ordered
County
Ordered Ordered
%
Paid If Ordered If Ordered
Mean 84.85 47.65 31.99 703.72 76.50% 75.80%
Mean n 125 103 121 41 132 132
Summary
Felony 5.82 3.75 -7.25a 920.29* 0.18 0.11
Personal 10.20 -3.18 -0.32 664.05 0.04 -0.26
Drug -7.63 -1.31 -1.56 -723.85 1.65 1.61
Traffic 76.49** 18.37*** -5.71 18.89 19.07
Other Offense -2.62 -1.43 9.35 730.47 1.18 1.08
Commitment 56.23** 3.97 5.92 -834.32 -3.12*** -3.04**
Adjudicated Delinquent 6.39 -0.92 3.65 92.67 -0.60 -0.27
Age -0.28 0.93a 1.08 190.23
a 0.08 0.05
Male 0.06 -0.55 1.07 -83.85 0.62 0.40
Constant 78.41 32.05** 10.97 -2768.41 0.39 0.86
R2 0.205 0.292 0.122 0.283
Adjusted R2 0.125 0.21 0.029 0.109
n 99 88 95 42 104 104
*p<.05, **p<.01, ***p<.001 ap<.10
211
Appendix K
Victim Survey Questionnaire
Table K-1. Frequencies for Criminal Justice System Variables
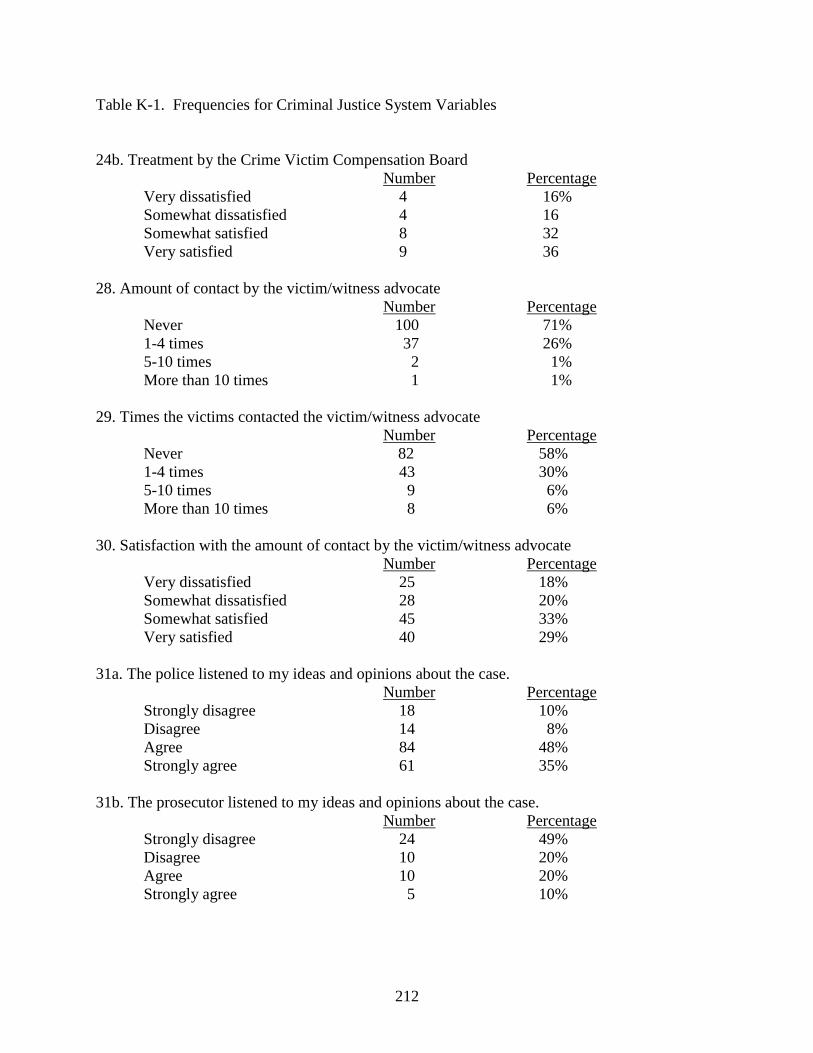
212
Table K-1. Frequencies for Criminal Justice System Variables
24b. Treatment by the Crime Victim Compensation Board
Number Percentage
Very dissatisfied 4 16%
Somewhat dissatisfied 4 16
Somewhat satisfied 8 32
Very satisfied 9 36
28. Amount of contact by the victim/witness advocate
Number Percentage
Never 100 71%
1-4 times 37 26%
5-10 times 2 1%
More than 10 times 1 1%
29. Times the victims contacted the victim/witness advocate
Number Percentage
Never 82 58%
1-4 times 43 30%
5-10 times 9 6%
More than 10 times 8 6%
30. Satisfaction with the amount of contact by the victim/witness advocate
Number Percentage
Very dissatisfied 25 18%
Somewhat dissatisfied 28 20%
Somewhat satisfied 45 33%
Very satisfied 40 29%
31a. The police listened to my ideas and opinions about the case.
Number Percentage
Strongly disagree 18 10%
Disagree 14 8%
Agree 84 48%
Strongly agree 61 35%
31b. The prosecutor listened to my ideas and opinions about the case.
Number Percentage
Strongly disagree 24 49%
Disagree 10 20%
Agree 10 20%
Strongly agree 5 10%
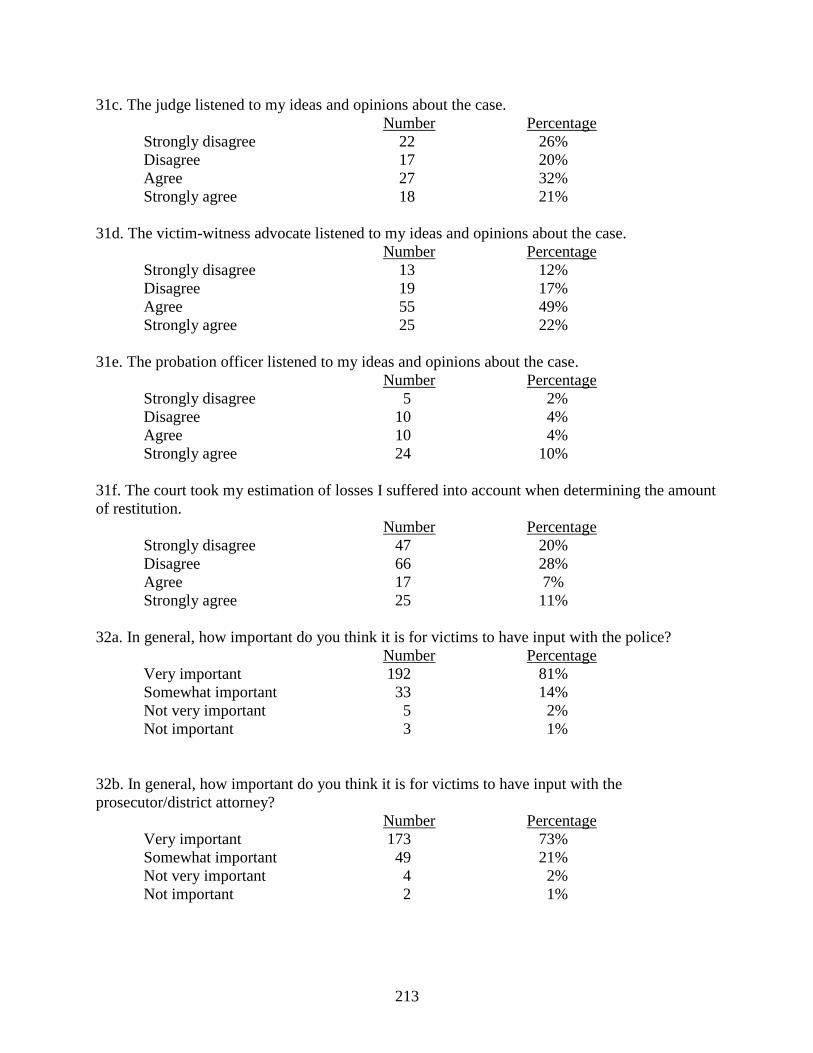
213
31c. The judge listened to my ideas and opinions about the case.
Number Percentage
Strongly disagree 22 26%
Disagree 17 20%
Agree 27 32%
Strongly agree 18 21%
31d. The victim-witness advocate listened to my ideas and opinions about the case.
Number Percentage
Strongly disagree 13 12%
Disagree 19 17%
Agree 55 49%
Strongly agree 25 22%
31e. The probation officer listened to my ideas and opinions about the case.
Number Percentage
Strongly disagree 5 2%
Disagree 10 4%
Agree 10 4%
Strongly agree 24 10%
31f. The court took my estimation of losses I suffered into account when determining the amount
of restitution.
Number Percentage
Strongly disagree 47 20%
Disagree 66 28%
Agree 17 7%
Strongly agree 25 11%
32a. In general, how important do you think it is for victims to have input with the police?
Number Percentage
Very important 192 81%
Somewhat important 33 14%
Not very important 5 2%
Not important 3 1%
32b. In general, how important do you think it is for victims to have input with the
prosecutor/district attorney?
Number Percentage
Very important 173 73%
Somewhat important 49 21%
Not very important 4 2%
Not important 2 1%

214
32c. In general, how important do you think it is for victims to have input with the judge?
Number Percentage
Very important 146 61%
Somewhat important 55 23%
Not very important 18 8%
Not important 8 3%
32d. In general, how important do you think it is for victims to have input with the probation
officer?
Number Percentage
Very important 131 55%
Somewhat important 46 19%
Not very important 34 14%
Not important 14 6%
32e. In general, how important do you think it is for victims to have input with the victim-
witness advocate?
Number Percentage
Very important 158 66%
Somewhat important 51 21%
Not very important 10 4%
Not important 7 3%
33a. Overall, how satisfied were you about the OUTCOME of your contact with the police?
Number Percentage
Very dissatisfied 15 7%
Somewhat dissatisfied 18 8%
Somewhat satisfied 55 25%
Very satisfied 130 60%
33b. Overall, how satisfied were you about the OUTCOME of your contact with the
prosecutor/district attorney?
Number Percentage
Very dissatisfied 26 16%
Somewhat dissatisfied 16 10%
Somewhat satisfied 57 35%
Very satisfied 63 39%
33c. Overall, how satisfied were you about the OUTCOME of your contact with the judge?
Number Percentage
Very dissatisfied 19 20%
Somewhat dissatisfied 11 12%
Somewhat satisfied 23 25%
Very satisfied 40 43%

215
33d. Overall, how satisfied were you about the OUTCOME of your contact with the probation
officer?
Number Percentage
Very dissatisfied 21 38%
Somewhat dissatisfied 7 13%
Somewhat satisfied 10 18%
Very satisfied 18 32%
33e. Overall, how satisfied were you about the OUTCOME of your contact with the victim-
witness advocate?
Number Percentage
Very dissatisfied 22 16%
Somewhat dissatisfied 14 10%
Somewhat satisfied 46 33%
Very satisfied 58 41%
34a. Overall, how satisfied were you about the WAY YOU WERE TREATED of your contact
with the police?
Number Percentage
Very dissatisfied 14 6%
Somewhat dissatisfied 12 5%
Somewhat satisfied 57 26%
Very satisfied 140 63%
34b. Overall, how satisfied were you about the WAY YOU WERE TREATED of your contact
with the prosecutor/district attorney?
Number Percentage
Very dissatisfied 18 12%
Somewhat dissatisfied 14 9%
Somewhat satisfied 43 29%
Very satisfied 76 50%
34c. Overall, how satisfied were you about the WAY YOU WERE TREATED of your contact
with the judge?
Number Percentage
Very dissatisfied 13 16%
Somewhat dissatisfied 7 9%
Somewhat satisfied 17 21%
Very satisfied 45 55%

216
34d. Overall, how satisfied were you about the WAY YOU WERE TREATED of your contact
with the probation officer?
Number Percentage
Very dissatisfied 15 31%
Somewhat dissatisfied 9 18%
Somewhat satisfied 4 8%
Very satisfied 21 43%
34e. Overall, how satisfied were you about the WAY YOU WERE TREATED of your contact
with the victim-witness advocate?
Number Percentage
Very dissatisfied 13 10%
Somewhat dissatisfied 19 14%
Somewhat satisfied 42 31%
Very satisfied 62 46%
35a. The court or probation officer keeps me up-to-date on the status of the restitution owed to
me.
Number Percentage
Strongly disagree 117 64%
Disagree 27 15%
Agree 27 15%
Strongly agree 13 7%
35b. To keep up-to-date on the status of the restitution order, I have to contact the court myself.
Number Percentage
Strongly disagree 19 13%
Disagree 16 11%
Agree 34 23%
Strongly agree 77 53%
36. In your opinion, how fair were the PROCEDURES used to determine the amount of
restitution in your case?
Number Percentage
Very unfair 26 12%
Somewhat unfair 35 16%
Somewhat fair 62 29%
Very fair 90 42%
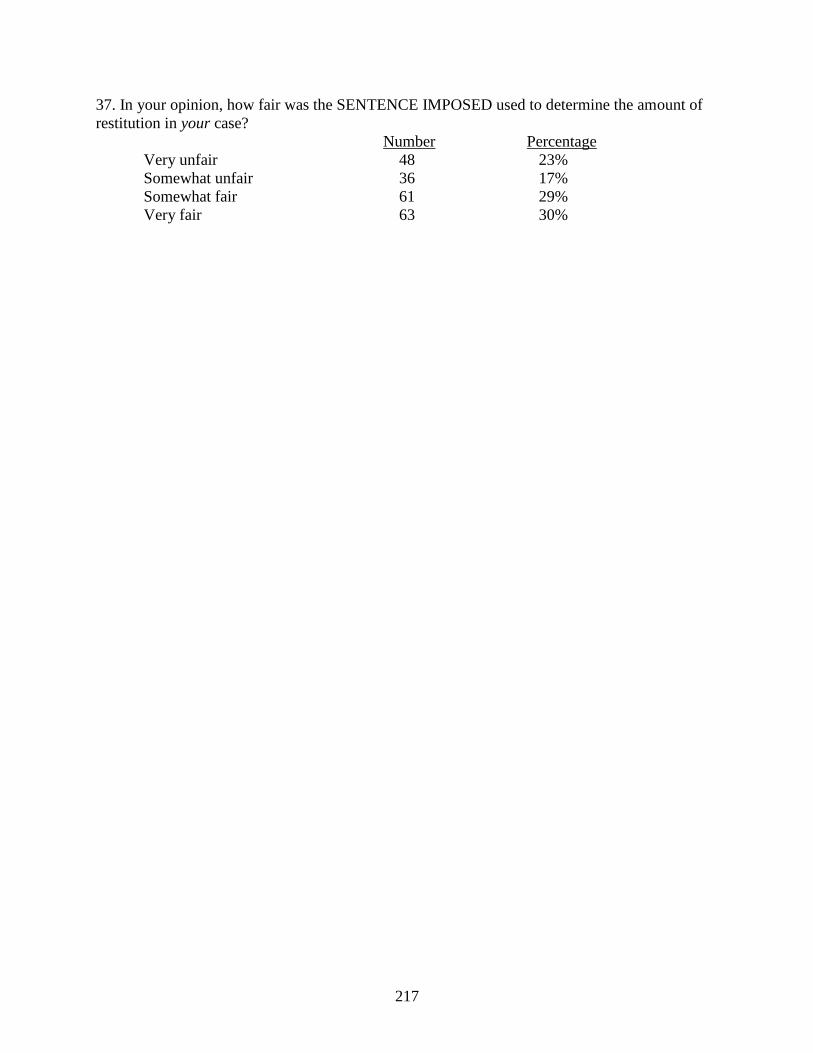
217
37. In your opinion, how fair was the SENTENCE IMPOSED used to determine the amount of
restitution in your case?
Number Percentage
Very unfair 48 23%
Somewhat unfair 36 17%
Somewhat fair 61 29%
Very fair 63 30%

218
Appendix L
Offender Survey Questionnaire
Table L-1. Frequencies for Criminal Justice System Variables

219
Table L-1. Frequencies for Criminal Justice System Variables
17a. How well do you understand how criminal sentences are set in Pennsylvania?
Number Percentage
Not at all 1 23 19%
2 10 8%
3 18 15%
4 18 15%
5 17 14%
6 10 8%
Very well 7 25 21%
17b. How well do you understand how the amount of court costs you owe was determined?
Number Percentage
Not at all 1 51 42%
2 17 14%
3 16 13%
4 13 11%
5 5 4%
6 3 3%
Very well 7 16 13%
17c. How well do you understand how the amount of supervision fees you owe was determined?
Number Percentage
Not at all 1 52 43%
2 16 13%
3 11 9%
4 13 11%
5 7 6%
6 5 4%
Very well 7 16 13%
17d. How well do you understand how the amount of other costs and fees you owe was
determined?
Number Percentage
Not at all 1 56 46%
2 10 8%
3 16 13%
4 14 12%
5 9 7%
6 3 3%
Very well 7 13 11%
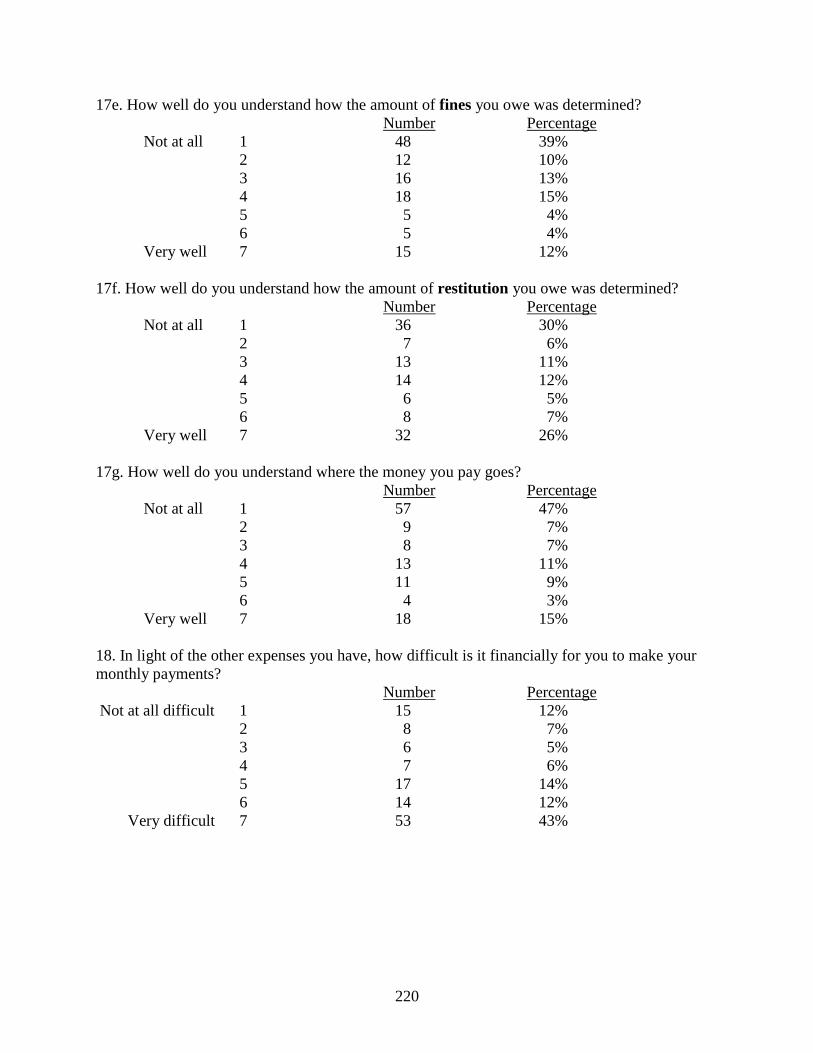
220
17e. How well do you understand how the amount of fines you owe was determined?
Number Percentage
Not at all 1 48 39%
2 12 10%
3 16 13%
4 18 15%
5 5 4%
6 5 4%
Very well 7 15 12%
17f. How well do you understand how the amount of restitution you owe was determined?
Number Percentage
Not at all 1 36 30%
2 7 6%
3 13 11%
4 14 12%
5 6 5%
6 8 7%
Very well 7 32 26%
17g. How well do you understand where the money you pay goes?
Number Percentage
Not at all 1 57 47%
2 9 7%
3 8 7%
4 13 11%
5 11 9%
6 4 3%
Very well 7 18 15%
18. In light of the other expenses you have, how difficult is it financially for you to make your
monthly payments?
Number Percentage
Not at all difficult 1 15 12%
2 8 7%
3 6 5%
4 7 6%
5 17 14%
6 14 12%
Very difficult 7 53 43%

221
19. How responsible do you feel for causing the victim harm?
Number Percentage
Not at all responsible 1 42 34%
2 5 4%
3 4 3%
4 10 8%
5 8 7%
6 14 12%
Very responsible 7 24 20%
20. How responsible do you feel for restoring the victim to where he or she was before the
crime?
Number Percentage
Not at all responsible 1 43 35%
2 1 1%
3 7 6%
4 11 9%
5 6 5%
6 13 11%
Very responsible 7 22 18%
21a. In this case, how fair do you think the amounts were that you had to pay for court costs?
Number Percentage
Very unfair 1 29 24%
Somewhat unfair 2 27 22%
Neutral 3 39 32%
Somewhat fair 4 15 12%
Very fair 5 12 10%
21b. In this case, how fair do you think the amounts were that you had to pay for supervision
fees?
Number Percentage
Very unfair 1 36 30%
Somewhat unfair 2 21 17%
Neutral 3 45 37%
Somewhat fair 4 7 6%
Very fair 5 12 10%
21c. In this case, how fair do you think the amounts were that you had to pay for other costs and
fees?
Number Percentage
Very unfair 1 35 29%
Somewhat unfair 2 30 25%
Neutral 3 40 33%
Somewhat fair 4 8 7%
Very fair 5 7 6%

222
21d. In this case, how fair do you think the amounts were that you had to pay for fines?
Number Percentage
Very unfair 1 32 26%
Somewhat unfair 2 25 21%
Neutral 3 38 31%
Somewhat fair 4 14 12%
Very fair 5 13 11%
21e. In this case, how fair do you think the amounts were that you had to pay for restitution?
Number Percentage
Very unfair 1 30 25%
Somewhat unfair 2 17 14%
Neutral 3 33 27%
Somewhat fair 4 10 8%
Very fair 5 26 21%
22a. In this case, how fair do you think the procedures for the court costs you were ordered to
pay?
Number Percentage
Very unfair 1 24 20%
Somewhat unfair 2 25 21%
Neutral 3 44 36%
Somewhat fair 4 16 13%
Very fair 5 11 9%
22b. In this case, how fair do you think the procedures for the supervision fees you were ordered
to pay?
Number Percentage
Very unfair 1 25 21%
Somewhat unfair 2 22 18%
Neutral 3 52 44%
Somewhat fair 4 9 8%
Very fair 5 11 9%
22c. In this case, how fair do you think the procedures for the other costs and fees you were
ordered to pay?
Number Percentage
Very unfair 1 28 23%
Somewhat unfair 2 27 22%
Neutral 3 45 37%
Somewhat fair 4 10 8%
Very fair 5 8 7%
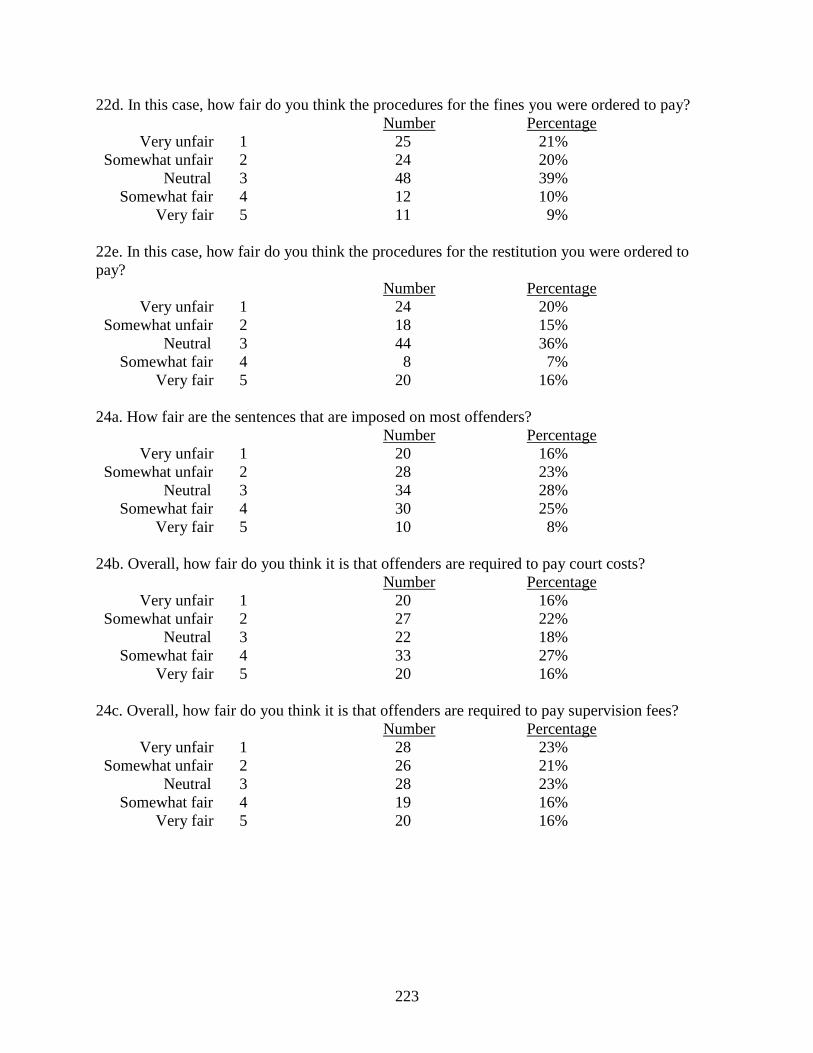
223
22d. In this case, how fair do you think the procedures for the fines you were ordered to pay?
Number Percentage
Very unfair 1 25 21%
Somewhat unfair 2 24 20%
Neutral 3 48 39%
Somewhat fair 4 12 10%
Very fair 5 11 9%
22e. In this case, how fair do you think the procedures for the restitution you were ordered to
pay?
Number Percentage
Very unfair 1 24 20%
Somewhat unfair 2 18 15%
Neutral 3 44 36%
Somewhat fair 4 8 7%
Very fair 5 20 16%
24a. How fair are the sentences that are imposed on most offenders?
Number Percentage
Very unfair 1 20 16%
Somewhat unfair 2 28 23%
Neutral 3 34 28%
Somewhat fair 4 30 25%
Very fair 5 10 8%
24b. Overall, how fair do you think it is that offenders are required to pay court costs?
Number Percentage
Very unfair 1 20 16%
Somewhat unfair 2 27 22%
Neutral 3 22 18%
Somewhat fair 4 33 27%
Very fair 5 20 16%
24c. Overall, how fair do you think it is that offenders are required to pay supervision fees?
Number Percentage
Very unfair 1 28 23%
Somewhat unfair 2 26 21%
Neutral 3 28 23%
Somewhat fair 4 19 16%
Very fair 5 20 16%
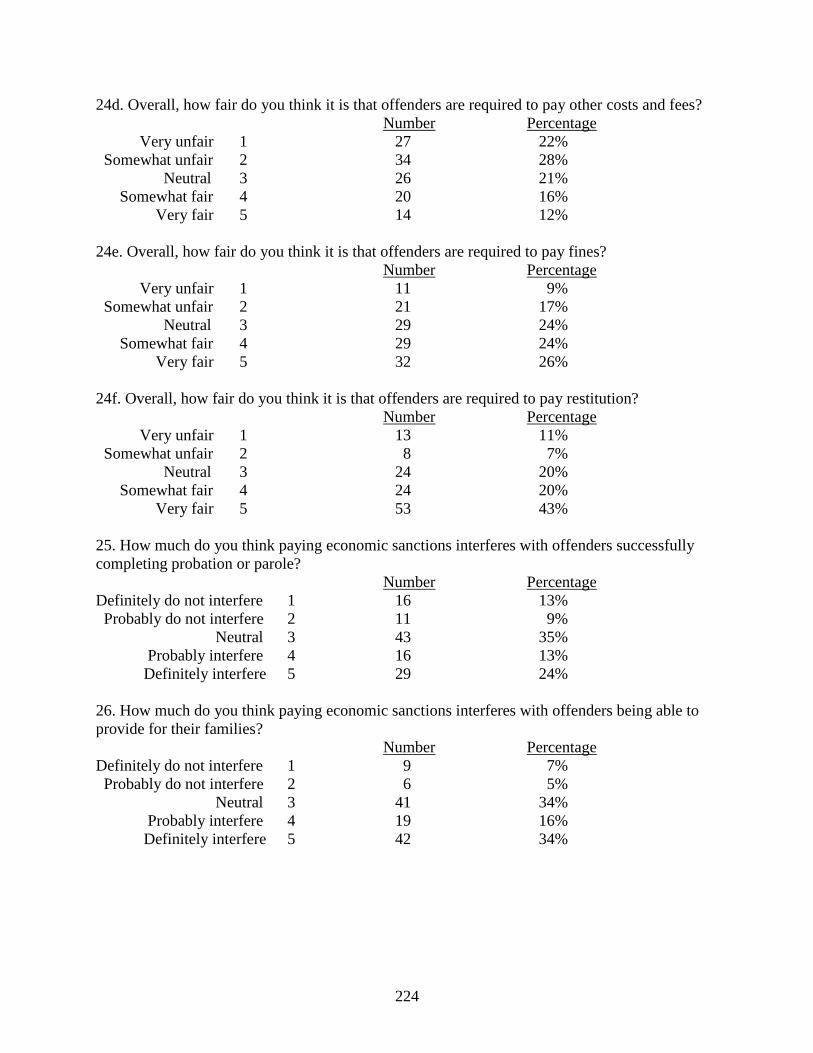
224
24d. Overall, how fair do you think it is that offenders are required to pay other costs and fees?
Number Percentage
Very unfair 1 27 22%
Somewhat unfair 2 34 28%
Neutral 3 26 21%
Somewhat fair 4 20 16%
Very fair 5 14 12%
24e. Overall, how fair do you think it is that offenders are required to pay fines?
Number Percentage
Very unfair 1 11 9%
Somewhat unfair 2 21 17%
Neutral 3 29 24%
Somewhat fair 4 29 24%
Very fair 5 32 26%
24f. Overall, how fair do you think it is that offenders are required to pay restitution?
Number Percentage
Very unfair 1 13 11%
Somewhat unfair 2 8 7%
Neutral 3 24 20%
Somewhat fair 4 24 20%
Very fair 5 53 43%
25. How much do you think paying economic sanctions interferes with offenders successfully
completing probation or parole?
Number Percentage
Definitely do not interfere 1 16 13%
Probably do not interfere 2 11 9%
Neutral 3 43 35%
Probably interfere 4 16 13%
Definitely interfere 5 29 24%
26. How much do you think paying economic sanctions interferes with offenders being able to
provide for their families?
Number Percentage
Definitely do not interfere 1 9 7%
Probably do not interfere 2 6 5%
Neutral 3 41 34%
Probably interfere 4 19 16%
Definitely interfere 5 42 34%


