
EVALUATING THE IMPORTANT BIRD AREAS NETWORK IN INDIA FROM A
BIOGEOGRAPHIC AND CONSERVATION PERSPECTIVE
THESIS
Presented to the Graduate Council of Texas State University–San Marcos
in Partial Fulfillment of the Requirements
for the Degree
Masters of SCIENCE Population and Conservation Biology Program
by
Bindu Viswanathan, M.S., Ph.D.
San Marcos, Texas December 2010

EVALUATING THE IMPORTANT BIRD AREAS NETWORK IN INDIA FROM A BIOGEOGRAPHIC AND CONSERVATION PERSPECTIVE
Approved: J. Michael Willoughby, Ed.D. Dean of the Graduate College
Committee Members Approved:
Dr. Joseph A. Veech, Chair Dr. James R. Ott Dr. Chris C. Nice
FAIR USE AND AUTHOR’S PERMISSION STATEMENT
Fair Use
This work is protected by the Copyright Laws of the United States (Public Law 94-553,
section 107). Consistent with fair use as defined in the Copyright Laws, brief quotations
from this material are allowed with proper acknowledgment. Use of this material for
financial gain without the author’s express written permission is not allowed.
Duplication Permission
As the copyright holder of this work I, Bindu Viswanathan, authorize duplication of this
work, in whole or in part, for educational or scholarly purposes only.

iv
ACKNOWLEDGEMENTS
I am grateful to my advisor Dr. Joseph A. Veech for his guidance and support
throughout this research. I would also like to thank my committee members Dr. James R.
Ott and Dr. Chris C. Nice for their comments and suggestions.
This manuscript was submitted on November 9, 2010.
v
TABLE OF CONTENTS
Page
ACKNOWLEDGEMENTS ............................................................................................... iv
LIST OF TABLES ............................................................................................................. vi
LIST OF FIGURES ........................................................................................................... vii
ABSTRACT ..................................................................................................................... viii
CHAPTER ONE
Introduction ................................................................................................................ 1
Materials and Methods ............................................................................................... 4
Results ........................................................................................................................ 8
Discussion ................................................................................................................ 12
Conclusion ............................................................................................................... 20
APPENDIX I: Endemic Birds of India ............................................................................. 27
REFERENCES .................................................................................................................. 29

vi
LIST OF TABLES
Table Page
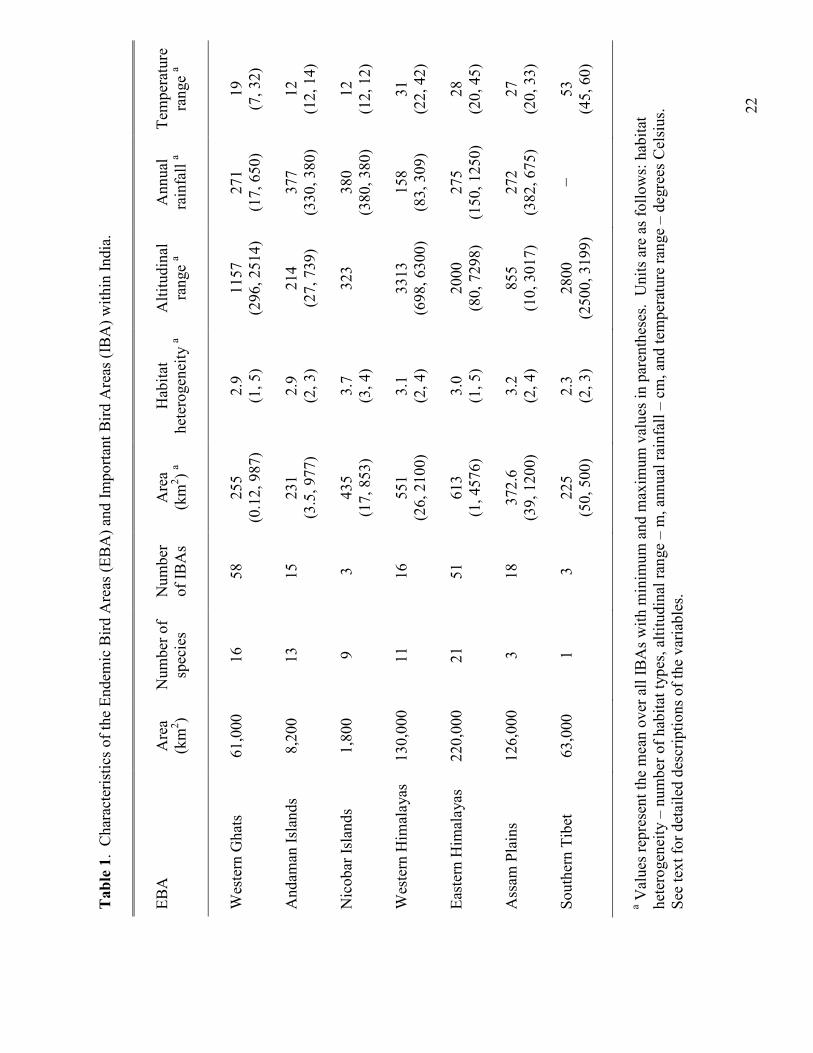
1. Characteristics of the Endemic Bird Areas (EBA) and
Important Bird Areas (IBA) within India ................................................................ 22
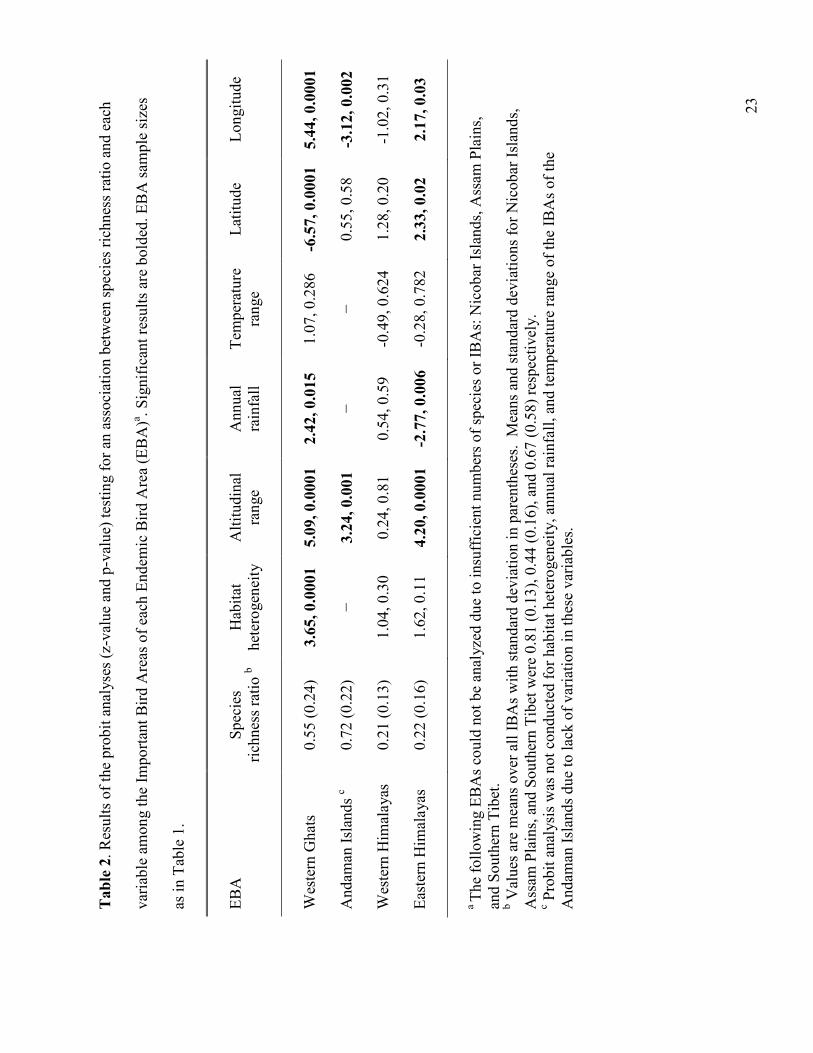
2. Results of the probit analyses (z-value and p-value) testing for an
association between species richness ratio and each variable among
the Important Bird Areas of each Endemic Bird Area (EBA) ................................. 23

vii
LIST OF FIGURES
Figure Page
1. The seven Endemic Bird Areas of India ....................................................................... 24
2. Percent of IBAs with a given land use .......................................................................... 25
3. Percent of IBAs with a given threat .............................................................................. 26

viii
ABSTRACT
EVALUATING THE IMPORTANT BIRD AREAS NETWORK IN INDIA FROM A
BIOGEOGRAPHIC AND CONSERVATION PERSPECTIVE
by
Bindu Viswanathan, M.S., Ph.D.
Texas State University-San Marcos
December, 2010
SUPERVISING PROFESSOR: JOSEPH A. VEECH
The Important Bird Areas network comprises several hundred localities that
contain high levels of bird diversity. Many of the Important Bird Areas (IBAs) exist
within larger regions known as Endemic Bird Areas (EBAs). Given the rapid
industrialization and population growth of India, it is imperative to preserve the natural
areas and unique biodiversity of the nation. We undertook a study to evaluate whether
IBAs in each of seven EBAs adequately represented the regional endemic bird faunas.
We examined statistical associations between endemic bird diversity and factors such as

ix
IBA land area, habitat variety, local climate, land use practices, and geographic location.
Well-known principles and patterns from biogeography suggest that these factors should
influence endemic bird diversity. Linear regression and probit regression models were
used for data analysis. Although area and habitat variety positively influenced IBA
endemic bird diversity, no single factor had a consistent and dominant effect in every
EBA. Rather, several factors were jointly associated with diversity, and they varied for
each EBA. Because no single factor is strongly associated with diversity, we recommend
that a holistic approach be taken during the planning process wherein new IBAs are
located or designated based on multiple factors.
KEYWORDS
biodiversity, conservation biogeography, endemic avifauna, endemic bird areas,
important bird areas, Indian avifauna

1
CHAPTER ONE
INTRODUCTION∗
Conservation biogeography is an emerging discipline wherein principles from
biogeography are applied to address problems and create solutions for conserving
biodiversity on a large scale (Whittaker et al., 2005). For example, the effectiveness of
reserve networks in preserving wildlife species and biodiversity in general can be
evaluated by examining the extent to which the reserves capture biogeographic and
ecological patterns. One such pattern, widely studied and documented, is the species-
area relationship (Williams, 1943; Preston, 1962; Brown, 1971; Simberloff, 1976;
Connor and McCoy, 1979; Hanski and Gyllenberg, 1997; Lomolino, 2000; Losos and
Schluter, 2000; Whittaker et al. 2005). This relationship describes the increase in the
number of species as the area of reserves increase; larger reserves contain more species
than do smaller reserves. Various explanations have been proposed for this pattern
(Rosenzweig, 1995; Losos and Schluter, 2000; Whittaker et al., 2001; Drakare et al.,
2006; Kallimanis et al., 2008); most notably, increasing area typically entails an increase
in habitat variety (Ricklefs and Lovette, 1999; Storch et al., 2003) that leads to a greater
∗ This thesis was prepared as a manuscript to be submitted to the peer-reviewed journal
Ambio (http://www.springer.com/environment/journal/13280). It follows all of the
formatting guidelines of the journal.
2
number of species given that species are often adapted to one or a few particular habitats.
Therefore, in any network of reserves, we would expect a greater number of species to
occur in the larger reserves than in the smaller ones; any serious departure from this
pattern might indicate that the reserves are not functioning as planned. The latitudinal
diversity gradient is another well-documented pattern in biogeography; it describes an
increase in species diversity from temperate latitudes to tropical latitudes (Pianka, 1966;
Gaston, 2000; Arita and Vazquez-Dominguez, 2008). This pattern suggests that
geographically extensive networks should strive to create and/or plan new reserves with a
bias toward locating them at lower latitudes.
Reserve network planning is important everywhere, but particularly in India. The
country is among the top ten nations in total biodiversity (Islam and Rahmani, 2005) and
India continues in the middle stages of demographic transition (Lee, 2003; Veron, 2008).
The biodiversity of India faces increasing pressure from growth of human population and
associated land development and natural resource extraction. These processes lead to
loss and/or alteration of natural habitat. In particular, the unique bird fauna of India may
be most threatened. The Indian subcontinent has 1,225 of the world’s 9,000 bird species
and represents 48 of the 75 bird families (Grimmett, et al., 1998). India has 74 endemic
or restricted-range bird species (38 entirely within India), ranking it 14th among all 150
countries having at least one restricted-range species (Stattersfield et al., 1998).
Restricted-range bird species have breeding ranges covering less than 50,000 km2
(Stattersfield et al., 1998). Of the 74 species, 27 are globally threatened as defined by
Birdlife International and other conservation organizations.
3
As a major step toward conserving global bird diversity, Birdlife International
identified 218 geographical regions as Endemic Bird Areas (EBAs) around the world.
By definition, an EBA encompasses the breeding ranges of two or more restricted-range
bird species. Birdlife International has also recognized specific protected areas (e.g.,
nature preserves, wildlife refuges, and national parks) and designated these as Important
Bird Areas (IBAs) given their substantial or unique bird diversity. Within India, there are
466 IBAs and 201 of these are within seven EBAs (Table 1, Fig. 1) (Stattersfield et al.,
1998). The various protected areas designated as IBAs were not originally created for
the sole purpose of preserving bird diversity. Nonetheless, we can evaluate the
effectiveness of the Indian IBA network in accomplishing this purpose, particularly with
regard to obtaining knowledge that might inform the creation of new IBAs if and when
that becomes possible.
Most previous research on Indian avifauna has focused on specific regions of the
country or particular species (Ripley and Beehler, 1989; Adler, 1994; Rahmani and Soni,
1997; Sankaran, 1997; Sankaran, 1998; Zacharias and Gaston, 1999; Vijayan, et al.,
2000; Bhagwat, et al., 2005; Scharlemann, et al., 2005; Jathar and Rahmani, 2006; Pande
et al., 2007). To date, no study has been published on the conservation biogeography of
endemic avifauna in India. As a consequence, no research has collectively examined the
characteristics of all the IBAs and tested for associations between bird diversity and land
area, habitat variety, local climate, land use practices, and geographic locations of the
IBAs. The present study addressed the following questions within each EBA: (1) Does
endemic bird diversity within an IBA increase with increasing area? (2) Is diversity
within IBAs affected by the number and variety of habitats and hence, potential

4
ecological niches within IBAs? (3) Is diversity potentially affected by anthropogenic
factors related to land use? (4) Is diversity affected by geographic location of an IBA?
(5) To what extent are IBAs within an EBA redundant or complementary with respect to
the endemic bird species that they contain? Answers to these questions will assist policy-
makers, government officials, and conservationists in planning for the future protection
of endemic birds and their habitats in India.
MATERIALS AND METHODS
Data – EBAs and IBAs of India
The data for this study were compiled from Islam and Rahmani (2005). Of the 201 IBAs
that occur within the seven EBAs in India, 45 were deemed “data-deficient” by Islam and
Rahmani (2005) and were excluded, leaving 156 IBAs in the analyses. Among the seven
EBAs, there are 69 endemic bird species representing 29 families (Appendix 1). Twenty
of the species are in the family Timaliidae (Old World babblers) and seven are in
Phasianidae (quails, partridges, pheasants). None of the remaining families are
represented by more than four species; therefore, overall the 69 endemic species include
substantial taxonomic diversity. Of most importance, 26 of the species are on the
International Union for Conservation of Nature (IUCN) “Red List”, being categorized as
“critically endangered”, “endangered”, or “vulnerable”. An additional 20 species are
categorized as “near threatened” (Birdlife International 2003) (Appendix 1). Most of the
EBAs contain between 9 and 21 endemic species (Table 1).
The EBAs vary substantially in area and in number of IBAs (Table 1); in general
the IBAs of an EBA are dispersed throughout the EBA (Fig. 1). Area of IBAs varies
5
from being very small (< 1 km2) to very large (> 4,500 km2), although the mean IBA area
is typically several hundred km2 (Table 1). Ownership of IBAs includes large national
parks and tiger preserves administered by the government of India as well as small
privately-owned nature preserves (Islam and Rahmani 2005).
We used several IBA-level variables that directly and indirectly quantify the
number of potential ecological niches within an IBA. Habitat heterogeneity was
quantified by the total number of habitat types found in an IBA. We categorized habitat
types following Islam and Rahmani (2005), using the Champion and Seth (1968)
classification of forest types and climatic zones in India. For the tropical zone, seven
habitat types were defined: (1) wet evergreen forest, (2) semi-evergreen forest, (3) moist
deciduous forest, (4) littoral and swamp forest, (5) dry deciduous forest, (6) thorn forest,
and (7) dry evergreen forest. For the sub-tropical zone, three habitat types were defined:
(8) broadleaf hill, (9) pine forest, and (10) dry evergreen. In the temperate zone, habitat
types were (11) montane wet forest, (12) Himalayan moist forest, and (13) Himalayan
dry forest. Habitat types in the alpine zone were (14) sub-alpine forest, (15) moist scrub,
and (16) dry scrub. We included two additional categories for (17) lakes and (18)
grasslands. The vast majority of IBAs (146/156) had 2 – 4 of these broad habitat types;
no IBA had more than five (Table 1). For each IBA we also determined altitudinal range
(the difference between the highest and lowest elevations within the IBA), historical
average annual rainfall, and seasonal temperature range (the difference between the
highest and lowest annual temperature). Again, there is some variation in these variables
among EBAs and variation among IBAs within most EBAs (Table 1). Altitudinal range
is an indirect measure of habitat variety given that vegetation and plant associations

6
change substantially along altitudinal gradients. Annual rainfall and seasonal
temperature range may also indirectly measure habitat and niche variety in that both of
these climatic factors can affect net primary productivity and the amount of energy
entering into an ecosystem assuming greater productivity leads to more resources
(Wright, 1983; Currie, 1991; Hawkins et al., 2003; but also see Rohde, 1992; Rahbek et
al., 2007). In addition, these two climate variables are annual means and hence more
likely to be measured accurately for each IBA compared to variables representing
climatic extremes.
For each IBA, we obtained a list of land uses (e.g. agriculture, energy production,
tourism) and anthropogenic threats (e.g., habitat destruction, pollution) as reported by
Islam and Rahmani (2005). We also recorded latitude and longitude of each IBA for use
in subsequent analyses.
Species-area relationship
To test whether the diversity of endemic birds within IBAs increases with increasing
area, the species-area relationship (among the IBAs) within each EBA was assessed
using linear regression of the log10 values of both number of species and area, as is
standard practice. This analysis was applied only to the Western Ghats, Andaman
Islands, Western Himalayas, and Eastern Himalayas EBAs. The other three EBAs did
not have a sufficient number of species or IBAs for a meaningful analysis.
Niche and habitat variety
7
To assess niche and habitat variety we expressed the number of endemic bird species
within an IBA as a ratio of the total number of endemic species in the EBA, hereafter
referred to as the species richness ratio. The ratio allows for a more meaningful
comparison among EBAs given that these differed in total number of endemic species
(Table 1). Because the ratio is a proportion, its relationship with explanatory variables is
expected to be sigmoidal rather than linear. Thus, a probit model with a log-normal
transformation of the response variable (Bliss, 1935; McCullagh and Nelder, 1989) was
used for all regression analyses. Maximum likelihood was used to estimate parameters of
the regression models. For each EBA, we tested the effect of habitat and niche variety on
endemic bird diversity of IBAs by fitting probit regression models with habitat
heterogeneity, altitudinal range, average annual rainfall and seasonal temperature range
as predictors. Each variable, along with IBA area was first fit individually in a probit
model. Multiple probit regression models were then constructed but only for the Western
Ghats and Eastern Himalayas EBAs, due to sample size constraints. In all models, IBA
area was included as an independent variable, in order to adjust for its association with
species richness ratio.
Anthropogenic factors
The association of species richness ratio of endemic birds with anthropogenic factors was
examined by summarizing the threats and land uses in each IBA, and observing the
patterns of anthropogenic activity in them. Each threat was coded as a binary variable
(present = 1, absent = 0) and entered individually as the predictor, along with IBA area,
into a probit regression model.

8
Geographic locations of IBAs
Within each EBA, the association between species richness ratio per IBA and geographic
location was examined using separate probit models with each IBA’s latitude and
longitude as predictors of species richness ratio, adjusting for IBA area.
Similarity of species composition within IBAs
To assess similarity in species composition of IBAs within EBAs, a pair-wise Sorensen’s
similarity coefficient (Sorensen, 1948; Pielou, 1977; Krebs, 1998) was calculated for all
pairs of IBAs within each EBA. The index is widely used to quantify the similarity in
species composition among samples and is similar to other pairwise similarity metrics,
e.g., Jaccard index (Krebs, 1998). The index is S = 2a/(2a + b + c) where a = number of
shared species in IBA1 and IBA2 (joint occurrences), b = number of species in IBA2 but
not in IBA1, c = number of species in IBA1 but not in IBA2, and d = number of species
absent in both IBA1 and IBA2 (zero-zero matches). The index = 1 when two samples
(e.g., IBAs) are identical in species composition and zero when two samples do not share
any species. The mean similarity coefficient and standard deviations for each EBA,
averaging across all pairs of IBAs was calculated.
All analyses except the similarity assessment were conducted on SPSS 17.0
software. Splus 8.0 software was used to calculate Sorensen’s similarity index.
RESULTS
Species richness ratio
Species richness ratios varied from 0.21 (Western Ghats) to 0.81 (Nicobar Islands) across
EBAs. The Eastern and Western Himalayas EBAs had low mean species richness ratios

9
and low variation in richness in IBAs as well (Table 2), indicating that most IBAs in
these EBAs had lower levels of species richness. The Western Ghats EBA had
comparatively greater variation (Table 2), indicating that some IBAs in this EBA had
higher richness while others did not. The Andaman Islands had the highest mean species
richness ratio and moderately high variance, indicating good species representation in
some IBAs but not others.
Species-area relationship A statistically significant positive linear species-area relationship was observed among
IBAs in the Andaman Islands EBA (t = 3.35, ß = 0.26, p = 0.01) and Eastern Himalayas
EBA (t = 2.29, ß = 0.13, p = 0.026), indicating that larger IBAs had a greater number of
endemic species than smaller IBAs. A marginally significant positive linear species-area
relationship was observed in the Western Himalayas EBA (t = 1.91, ß = 0.19, p = 0.076).
No statistically significant species-area relationship was observed in the IBAs in the
Western Ghats EBA (t = 0.58, ß = 0.02, p = 0.566) including when a statistical outlier
IBA having only one endemic species was removed.
Niche and habitat variety
Probit analysis revealed a significant (p < 0.0001) positive association between habitat
heterogeneity and species richness ratio among the IBAs of the Western Ghats EBA only
(Table 2). However, altitudinal range was significantly and positively associated with
IBA species richness ratio in the Western Ghats (p < 0.0001), Andaman Islands (p =
0.001) and the Eastern Himalayas EBAs (p < 0.0001) (Table 2). Average annual rainfall
was significantly (p < 0.05) and positively associated with IBA species richness ratio in

10
the Western Ghats EBA, but was negatively associated with IBA richness in the Eastern
Himalayas (Table 2). Temperature range was not associated with IBA species richness
ratio in any of the EBAs. Western Himalayas was the only EBA where none of the
variables was significantly associated with IBA species richness ratio (Table 2).
Multiple probit regression analysis in the Western Ghats EBA indicated that
habitat heterogeneity and altitude range were significantly associated with species
richness ratio, while adjusting for the effect of IBA area. Controlling for habitat
heterogeneity, larger altitude ranges were associated with a higher species richness ratio
(Z = 4.73, ß = 0.001, p < 0.0001). Reciprocally, controlling for altitude range, higher
habitat heterogeneity was associated with a higher species richness ratio (Z = 2.94, ß =
0.159, p = 0.003). In the Eastern Himalayas EBA, habitat heterogeneity and annual
rainfall were found to be significantly associated with the species richness ratio.
Controlling for habitat heterogeneity, higher annual rainfall was associated with a lower
species richness ratio (Z = -2.79, ß = -0.0001, p = 0.005). Controlling for annual rainfall,
higher habitat heterogeneity was associated with a higher species richness ratio (Z = 2.5,
ß = 0.135, p = 0.013).
Geographic locations of IBAs
In the Western Ghats EBA, a significant change in species richness ratio was observed
along both latitudinal (p < 0.0001) and longitudinal (p < 0.0001) gradients after adjusting
for IBA area (Table 2). On average, species richness ratio decreased significantly moving
north away from the equator, and increased significantly moving east or inland. In the
Andaman Islands EBA, there was a longitudinal effect (p < 0.01, Table 2), but no

11
latitudinal effect. In the Eastern Himalayas EBA, a significant latitudinal effect was
observed (p < 0.05), indicating higher species richness ratios moving north within this
EBA. A significant longitudinal effect in this EBA (p < 0.05), indicated higher species
richness ratio going east (Table 2). No significant latitudinal or longitudinal effects were
seen in the Western Himalayas EBA.
Anthropogenic factors
Most IBAs in each EBA had multiple varied types of land uses (Fig. 2). Across all the
EBAs, tourism and recreation, nature conservation and research, and forest resource
utilization were the most common land uses. Habitat destruction and poaching were the
most common anthropogenic threats to bird diversity within the IBAs; within most
EBAs, 50% or more of the IBAs faced these threats (Fig. 3). Overgrazing by livestock
and the collection of fuel wood were common threats in all EBAs except for the island
EBAs (Andaman Islands and Nicobar Islands). Development of land for commercial and
industrial use were particular threats within the Andaman Islands and Nicobar Islands
EBAs. Pollution and pesticide use was not a major threat except in the Southern Tibet
EBA. Agriculture was not a major threat in any of the EBAs (Fig. 3).
A more thorough evaluation of the threats to the IBAs was provided by the probit
analyses testing for a difference in the species richness ratios of IBAs facing a particular
threat and those not facing the threat. After a Bonferroni adjustment of the significance
level within each EBA, we found only five instances of a significant difference out of 27
total comparisons. In the Western Ghats EBA, IBAs having the threat of habitat
destruction had a lower mean ratio (0.50, sd = 0.23, n = 43) than those without this threat

12
(0.71, sd = 0.24, n = 13). In this EBA, IBAs with tourism/traffic as a threat had a lower
ratio (0.44, sd = 0.26, n = 16) than did IBAs without this threat (0.59, sd = 0.22, n = 40).
In the Andaman Islands EBA, IBAs with the threat of industrial/commercial development
actually had a higher ratio (0.82, sd = 0.06, n = 8) than those without the threat (0.61, sd
= 0.30, n = 7). Lastly, in the Eastern Himalayas EBA, IBAs with overgrazing had a
lower ratio (0.14, sd = 0.12, n = 16) than those without this threat (0.26, sd = 0.16, n =
35); a nearly identical result was obtained with fuel wood and non-timber forest produce
collection as a threat given that the same IBAs tended to have both of these threats.
Similarity of IBAs within an EBA
In the Western Ghats EBA, IBAs were moderately similar (mean S = 0.54, sd = 0.24, n =
1653) in species composition, with half of all pairs of IBAs having S > 0.57. IBAs
within the Andaman Islands EBA had the greatest similarity (mean S = 0.77, sd = 0.32, n
= 105), with half of all pairs of IBAs having S > 0.9. Similarity among IBAs in the
Western Himalayas and Eastern Himalayas EBAs was relatively low (mean S = 0.31 and
0.22, sd = 0.32 and 0.24, n = 120 and 1275, respectively), with half of all pairs of IBAs
having S < 0.29 in the Western Himalayas, and S < 0.18 in the Eastern Himalayas EBA.
Because the Assam Plains EBA had just 3 species, and there were only 3 IBAs each in
the Nicobar Islands and Southern Tibet EBAs, similarity indices were not calculated.
DISCUSSION
Our evaluation of the Important Bird Areas network of India uncovered general
patterns that can assist policy-makers, government officials, and conservationists in
13
planning for the future protection of endemic birds and their habitats. We examined
associations between endemic bird diversity and the biogeographic factors that in theory
should affect local diversity within individual IBAs, and thus also inform the planning of
future reserves. For example, the species-area relationship may have practical use in
conservation such as enabling prediction of species loss due to future loss of habitat or
area and possible species gain by increasing the size of reserves (Doak and Mills, 1994;
Brooks et al., 1997; Ney-Nifle and Mangel, 2000; Smith, 2010). In the present study, we
used the species-area relationship to determine if the area of an IBA had the expected
positive effect on endemic bird diversity.
Of the four EBAs analyzed, three (Eastern Himalayas, Andaman Islands, and
Western Himalayas) showed a positive species-area relationship and one (Western Ghats)
did not show a significant relationship. In the Eastern Himalayas, this is a particularly
critical observation, since some of the project sites of hydroelectric dams being
constructed on the Teesta River are located within the boundaries of IBAs within this
EBA (Islam and Rahmani, 2005). Development projects undertaken within this EBA
should be planned with caution, since a reduction in viable IBA area is correlated with a
reduction in species richness of endemic birds. This caution is also warranted for the
IBAs in the Andaman Islands and Western Himalayas EBAs; that is, any future increase
in habitat destruction or loss of reserve area could potentially lead to a loss of endemic
bird species. In spite of having IBAs of variable size, a species-area relationship was not
detected in the Western Ghats EBA. In this EBA, endemic species richness is not well
correlated with IBA area, as many of the larger IBAs have relatively low species richness
and smaller ones have relatively high richness. Thus, any new IBAs would not
14
necessarily need to be large in order to be useful for preserving endemic bird species.
Therefore, in this EBA, designation of new IBAs should not be based on size alone. On
the other hand, the positive species-area relationship for the Andaman Islands, Western
Himalayas, and Eastern Himalayas EBAs suggests that larger IBAs are more likely to
preserve more endemic species than are smaller IBAs.
In addition to area, the geographic isolation of an IBA (distance between it and
another IBA or source of endemic birds) could potentially affect the number of endemic
species within the IBA. In the context of island biogeography theory (MacArthur and
Wilson 1967), area and isolation affect the number of species on “islands” (true islands as
well as habitat fragments). “Islands” further from the source have fewer species.
Although isolation of IBAs was not examined in the present study, within each EBA
none of the IBAs appears to be substantially distant from others (Fig. 1).
We tested for an association between endemic bird diversity and the habitat
heterogeneity of IBAs. As with most organisms, habitat matters to birds. That is, species
have distinct habitat preferences and requirements such that a greater habitat
heterogeneity (or number of distinct types) results in greater species diversity. Habitat
restrictions may be particularly important for endemic species and in part a reason for
their endemism. Thus preservation of multiple endemic bird species might require
reserves with substantial habitat heterogeneity. Our study revealed a significant positive
association between habitat heterogeneity and species richness ratio for the IBAs in the
Western Ghats EBA. Therefore, it would be preferable for new IBAs in the Western
Ghats to contain a wide variety of habitat types. Because no association was found in the
Western Himalayas or the Eastern Himalayas EBAs, habitat heterogeneity here does not

15
correlate well with species richness ratio. In these two EBAs, new IBAs with multiple
habitat types (2, 3, 4, or 5) would be equally effective in preserving endemic bird species.
In this study we also considered mean annual rainfall and seasonal temperature
range of an IBA to be indirect indicators of habitat variety and niche availability. Both
variables positively affect the amount of vegetation and hence the amount of biomass or
energy base of a food chain (Currie, 1991; Hawkins et al., 2003). Greater amounts of
energy at the base (lower trophic levels of a food chain) then allow for a greater number
of niches at the higher levels occupied by birds. There was a significant positive
association between average rainfall and species richness ratio in the Western Ghats
EBA. In contrast, a negative association between average rainfall and species richness
ratio was found in the Eastern Himalayas EBA. No significant association was found in
the Western Himalayas. Temperature range was not associated with IBA species
richness ratio in any of the EBAs, even though the IBAs (within an EBA) varied
substantially in this variable. These mixed results indicate that endemic bird diversity
does not necessarily increase with niche availability even assuming that rainfall and
temperature indirectly produce more niches (food resources) through an effect on
vegetation. Therefore, new IBAs need not be located with regard to local climatic
variations; other factors likely supercede climate as a factor in determining local diversity
of endemic birds.
Altitudinal range can also be regarded as a composite measure for the number of
habitat types, as well as climatic gradients (precipitation and temperature) that might
affect vegetation and hence habitat at a relatively fine scale. Thus, IBAs with large
altitudinal ranges were expected to have more endemic bird species. Significant positive

16
relationships of IBA species richness ratio increasing with increasing altitudinal range of
the IBA were observed in the Western Ghats and Eastern Himalayas EBAs. Therefore,
new IBAs in these EBAs will be more effective in preserving endemic bird species if
they span a wide altitudinal range. No such relationship was observed in the Andaman
Islands or the Western Himalayas EBAs, so that conservationists need not consider
altitudinal range as a factor in locating or designating new IBAs.
Only the Western Ghats and Eastern Himalayas allowed testing with multiple
probit regression to isolate individual effects of habitat heterogeneity, altitude range,
average rainfall, and temperature range (while adjusting for IBA area) on endemic bird
diversity. In the Western Ghats EBA, habitat heterogeneity and altitude range had
significant positive associations with species richness ratio. Therefore in this EBA, new
IBAs should preferably have substantial altitudinal range along with multiple habitat
types. In the Eastern Himalayas EBA, habitat heterogeneity and annual rainfall were
significant factors. As with the univariate analysis, rainfall had a negative association
with species richness ratio. After accounting for this negative association (by including
rainfall in the model), greater habitat heterogeneity was associated with greater diversity
of endemic birds. Overall, habitat heterogeneity appears to be a key variable since it
provides a mix of different niches that possibly accommodate various species.
The latitudinal diversity gradient is another well-known and widely studied
biogeographic pattern (Pianka, 1966; Rohde, 1992; Rosenzweig, 1992, 1995; Gaston,
2000; Hawkins, 2001; Willig et al., 2003; Arita and Vazquez-Dominguez, 2008). It
describes an increase in species richness from temperate (high) latitudes to tropical (low)
latitudes and is typically found for gradients of hundreds to thousands of kilometers. The

17
causes of the pattern are vigorously debated; most explanations invoke either long-term
evolutionary processes or shorter duration ecological processes (Gaston, 2000).
Regardless, the pattern is important to conservation planning because it suggests that the
latitudinal (and perhaps longitudinal) location of a current or planned preserve might
influence its species richness. Ideally, large-scale networks of protected areas (e.g., IBAs
within EBAs) will capture any latitudinal (or longitudinal) richness gradient that may
exist.
More specifically, our analysis of geographic location addressed whether new
IBAs should be intentionally located within an EBA on the basis of geographic location
alone. A significant negative association was found between latitude and species
richness ratio in the Western Ghats. Since this EBA has its greatest extension in the
north-south direction, this indicates that IBAs in the southern states of the EBA have
greater species richness than those in the northern states. A more detailed analysis of the
qualitative differences between the IBAs in the northern region and southern region of
this EBA could provide guidance on how the northern IBAs could better protect endemic
birds. In addition, since the southern IBAs have greater species richness ratios, new
IBAs could be more useful in the northern region for better representation of regional
fauna. There was also a significant positive association of longitude with species richness
ratio in the Western Ghats EBA. In the Western Ghats this indicates increasing species
richness moving away from the coast.
In the Eastern Himalayas EBA, a significant positive association was found with
latitude. This EBA extends over most of northeast India, and so this finding indicates that
the northern states such as Sikkim and Arunachal Pradesh have greater species richness

18
ratio compared to the southern states in the region such as Mizoram and Manipur. By
itself, this result suggests that new IBAs should be located in the northern states given
that higher latitude preserves are more likely to contain more of the endemic species of
the EBA. However, IBAs in all four states face serious threats. The greatest threats in
Mizoram and Manipur are poaching, jhum or shifting cultivation, and lack of public
awareness (Islam and Rahmani, 2005). In Sikkim and Arunachal Pradesh, major
hydroelectric dam projects threaten to disturb the relatively pristine habitat that exists in
these states. It would be certainly preferable to bring in more areas under protection in
the form of reserves in these northern states. The IBAs within the Eastern Himalayas
EBA also exhibited a significant association of species richness ratio with latitude. In the
Eastern Himalayas, protection of the pristine forests of the easternmost states could be
prioritized so as to preserve the higher levels of species richness within the region.
The analysis of the anthropogenic factors associated with each IBA was intended
to determine whether high richness IBAs face different threats than do low richness
IBAs. The most common threats across all EBAs were habitat destruction, poaching,
grazing, firewood/NTFP collection, and industry/development. However, statistical
analyses of these threats failed to reveal any strong patterns with regard to the
consistency and importance (i.e., IBAs with the threat having lower diversity than IBAs
without) of any one threat across all EBAs or any one EBA having all threats being
significant. Nonetheless, endemic bird diversity (and that of other wildlife) in India is
likely threatened by factors such as habitat destruction and overexploitation. More
specifically, human activities such as livestock grazing and firewood extraction have
steadily increased over the past two decades, leading to erosion of habitat quality

19
(Sharma, et al., 2000; Chettri, et al., 2002). At a broader level, the current development
strategy in India favors rapid growth and widespread industrialization, with particular
emphasis on greater natural resource extraction and an increase in water-and-chemical
intensive agriculture. The development is fueled by foreign investment that also
indirectly leads to a more affluent populace with greater buying power and a need for
more space and resources (Vyas et al, 1998). The resource extraction necessary to meet
these needs leads to a steady erosion of the quality and extent of forest area in the country
(Barve et al., 2005). In order to facilitate the economic development, the environmental
impact assessment process in India is undergoing changes resulting in compromises to
the quality of protection for the environment (Saldanha et al., 2007) further exacerbating
the effects of habitat destruction.
With under-regulated economic development and weak environmental protection
(Saldanha et al, 2007) the endemic bird diversity of individual IBAs could be adversely
affected by habitat destruction, pollution, and other threats. However, one desired
outcome of a network of reserves is that collectively the reserves protect diversity so that
harm to any one reserve does not adversely affect regional diversity. In such a scenario it
is desirable to have reserves that are both similar in species composition and highly
representative of the regional fauna. Similarity in species composition also needs to be
assessed in the planning process as it can inform us as to whether new reserves are
needed due to low similarity among current reserves. Our similarity analysis evaluated
the need for new IBAs; we examined how well the current ones (as a group within each
EBA) represent the endemic bird fauna. Of all the EBAs analyzed, IBAs within the
Andaman Islands were the most similar in species composition (mean S > 0.7). The IBAs
20
all have very similar habitat composition, altitudinal ranges, temperature and rainfall
patterns. It is therefore not surprising that they should also have similar species
compositions. The mean species richness ratio in these islands is also quite high,
indicating that the endemic birds of this EBA are being well protected. New reserves are
probably not necessary from the perspective of representing the regional fauna. In
contrast, IBAs in the Eastern and Western Himalayas EBAs are relatively dissimilar
(mean S = 0.22 and 0.31 respectively). Their average species richness ratios are also
lower than the other EBAs. This could be due to insufficient monitoring studies (and
incomplete species lists) in some of the remote IBAs in these regions. However, it is still
advisable to undertake studies to identify which species of birds in these EBAs are the
rarest, and improve current IBAs or create new ones to provide the conditions that would
sustain them. In the Western Ghats EBA, the IBAs are moderately similar (mean S =
0.54) such that new reserves could be created or designated so as to collectively increase
representation of the regional endemic bird diversity and to lessen the consequences of
harm to any one IBA.
CONCLUSION
Our study of the conservation biogeography of endemic bird areas in India enabled an
assessment of factors that could affect endemic avian species richness at a regional level.
Our findings indicate that various biogeographic and anthropogenic factors often act
together in determining how well an individual IBA represents the regional endemic bird
fauna. Consequently, a holistic approach taking multiple factors into consideration is
advisable in order to create and maintain effective reserves. The factors that are most

21
influential vary across EBAs, so that reserve network planning might proceed in a
slightly different way in each EBA. Long, et al. (1996) have noted that EBAs can be used
to identify centers of overall endemism; and Thirgood and Heath (1994) suggest that
centers of endemism for birds will also be centers of endemism for other taxa. Thus it is
critical to preserve and protect IBAs not only for the protection of endemic bird species,
but for the protection of biodiversity in general. India is currently undergoing rapid
economic growth, increasing the consuming power of more people each year. At this
juncture it is vital to ensure that the quality of the country’s biodiversity is not
compromised to facilitate development. The findings of this study could assist in
formulating conservation planning for reserve networks in India, so that the country’s
unique and abundant biodiversity, particularly its endemic avifauna, is effectively
protected.
22
Table 1
. C
hara
cter
istic
s of
the
End
emic
Bir
d A
reas
(EB
A) a
nd Im
port
ant B
ird
Are
as (
IBA
) with
in In
dia.
E
BA
Are
a (k
m2 )
N
umbe
r of
spec
ies
N
umbe
r of
IBA
s
A
rea
(km
2 ) a
H
abita
t he
tero
gene
ity a
A
ltitu
dina
l ra
nge
a
A
nnua
l
rain
fall
a
T
empe
ratu
re
rang
e a
W
este
rn G
hats
61,0
00
16
58
25
5 (0
.12,
987
)
2.
9 (1
, 5)
11
57
(296
, 251
4)
27
1 (1
7, 6
50)
19
(7, 3
2)
A
ndam
an Is
land
s
8,20
0 13
15
23
1 (3
.5, 9
77)
2.9
(2, 3
) 21
4 (2
7, 7
39)
377
(330
, 380
) 12
(1
2, 1
4)
N
icob
ar Is
land
s
1,80
0 9
3 43
5 (1
7, 8
53)
3.7
(3, 4
) 32
3 38
0 (3
80, 3
80)
12
(12,
12)
Wes
tern
Him
alay
as
130,
000
11
16
551
(26,
210
0)
3.1
(2, 4
) 33
13
(698
, 630
0)
158
(83,
309
) 31
(2
2, 4
2)
E
aste
rn H
imal
ayas
22
0,00
0 21
51
61
3 (1
, 457
6)
3.0
(1, 5
) 20
00
(80,
729
8)
275
(150
, 125
0)
28
(20,
45)
Ass
am P
lain
s
126,
000
3 18
37
2.6
(39,
120
0)
3.2
(2, 4
) 85
5 (1
0, 3
017)
27
2 (3
82, 6
75)
27
(20,
33)
Sout
hern
Tib
et
63,0
00
1 3
225
(50,
500
) 2.
3 (2
, 3)
2800
(2
500,
319
9)
− 53
(4
5, 6
0)
a V
alue
s re
pres
ent t
he m
ean
over
all
IBA
s w
ith m
inim
um a
nd m
axim
um v
alue
s in
par
enth
eses
. U
nits
are
as
follo
ws:
hab
itat
hete
roge
neity
– n
umbe
r of h
abita
t typ
es, a
ltitu
dina
l ran
ge –
m, a
nnua
l rai
nfal
l – c
m, a
nd te
mpe
ratu
re ra
nge
– de
gree
s C
elsi
us.
See
text
for d
etai
led
desc
ript
ions
of t
he v
aria
bles
.
23
Table 2
. Res
ults
of t
he p
robi
t ana
lyse
s (z
-val
ue a
nd p
-val
ue) t
estin
g fo
r an
asso
ciat
ion
betw
een
spec
ies
rich
ness
ratio
and
eac
h
vari
able
am
ong
the
Impo
rtan
t Bir
d A
reas
of e
ach
End
emic
Bir
d A
rea
(EB
A)a . S
igni
fica
nt re
sults
are
bol
ded.
EB
A s
ampl
e si
zes
as in
Tab
le 1
.
EB
A
Sp
ecie
s ri
chne
ss ra
tio b
H
abita
t he
tero
gene
ity
A
ltitu
dina
l ra
nge
A
nnua
l
rain
fall
T
empe
ratu
re
rang
e
L
atitu
de
L
ongi
tude
Wes
tern
Gha
ts
0.
55 (0
.24)
3.65, 0.0001
5.09, 0.0001
2.42, 0.015
1.
07, 0
.286
-6.57, 0.0001
5.44, 0.0001
A
ndam
an Is
land
s c
0.72
(0.2
2)
− 3.24, 0.001
− −
0.55
, 0.5
8 -3.12, 0.002
W
este
rn H
imal
ayas
0.
21 (0
.13)
1.
04, 0
.30
0.24
, 0.8
1 0.
54, 0
.59
-0.4
9, 0
.624
1.
28, 0
.20
-1.0
2, 0
.31
E
aste
rn H
imal
ayas
0.
22 (0
.16)
1.
62, 0
.11
4.20, 0.0001 -2.77, 0.006
-0.2
8, 0
.782
2.33, 0.02
2.17, 0.03
a T
he fo
llow
ing
EB
As
coul
d no
t be
anal
yzed
due
to in
suff
icie
nt n
umbe
rs o
f spe
cies
or I
BA
s: N
icob
ar Is
land
s, A
ssam
Pla
ins,
an
d So
uthe
rn T
ibet
.
b Val
ues
are
mea
ns o
ver a
ll IB
As
with
sta
ndar
d de
viat
ion
in p
aren
thes
es.
Mea
ns a
nd s
tand
ard
devi
atio
ns fo
r Nic
obar
Isla
nds,
A
ssam
Pla
ins,
and
Sou
ther
n T
ibet
wer
e 0.
81 (0
.13)
, 0.4
4 (0
.16)
, and
0.6
7 (0
.58)
resp
ectiv
ely.
c P
robi
t ana
lysi
s w
as n
ot c
ondu
cted
for h
abita
t het
erog
enei
ty, a
nnua
l rai
nfal
l, an
d te
mpe
ratu
re ra
nge
of th
e IB
As
of th
e A
ndam
an Is
land
s du
e to
lack
of v
aria
tion
in th
ese
vari
able
s.

24
Figure 1. The seven Endemic Bird Areas of India with Important Bird Areas shown as
colored dots. Map was adapted from Islam and Rahmani (2005).

25
Figure 2. Percent of IBAs with a given land use. Land use indicated as follows: A -
Tourism & Recreation, B - Nature Conservation, C - Tribal Reserve, D -
Agriculture/Plantation, E - Water Supply, F - Dam/Power Supply, G - Forest Resources,
and H – Fisheries.
Land uses within an IBA
Perc
enta
ge o
f IB
As
Western Ghats
0
50
100
Andaman Islands
0
50
100
Nicobar Islands
0
50
100
Western Himalayas
0
50
100
Eastern Himalayas
0
50
100
Assam Plains
0
50
100
Southern Tibet
0
50
100
A B C D E F G H

26
Figure 3. Percent of IBAs with a given threat. Threat indicated as follows: A - Habitat
destruction, B - Poaching, C - Unsustainable exploitation, D - Grazing, E -
Firewood/NTFP collection, F - Tourism/Traffic, G - Agriculture/Plantation, H -
Pollution/Pesticides, and I - Industry/Development.
Threats within an IBA
Perc
enta
ge o
f IB
As
Western Ghats
0
50
100
Andaman Islands
0
50
100
Nicobar Islands
0
50
100
Western Himalayas
0
50
100
Eastern Himalayas
0
50
100
Assam Plains
0
50
100
Southern Tibet
0
50
100
A B C D E F G H I

27
Appendix 1: Endemic Birds of India
# Scientific Name Common Name Family IUCN Category*
EBA
1 Spilornis klossi Nicobar Serpent Eagle Accipitridae NT 126 2 Spilornis elgini Andaman Serpernt Eagle Accipitridae NT 125 3 Accipiter butleri Nicobar Sparrowhawk Accipitridae VU 126 4 Megapodius nicobariensis Nicobar Megapode/Scrubfowl Megapodiidae VU 125, 126 5 Perdicula manipurensis Manipur Bush Quail Phasianidae VU 131 6 Arborophila mandellii Red-breasted Hill/Chestnut-
breasted Partridge Phasianidae VU 130
7 Ophrysia superciliosa Himalayan Quail Phasianidae CR 128 8 Tragopan melanocephalus Western Tragopan Phasianidae VU 128 9 Tragopan blythii Blyth's Tragopan Phasianidae VU 130 10 Lophophorus sclateri Sclater's Monal Phasianidae VU 130 11 Catreus wallichii Cheer Pheasant Phasianidae VU 128 12 Rallina canningi Andaman Crake Rallidae DD 125 13 Columba elphinstonii Nilgiri Wood Pigeon Columbidae VU 123 14 Columba palumboides Andaman Wood Pigeon Columbidae NT 125, 126 15 Macropygia rufipennis Andaman Cuckoo Dove Columbidae NT 125, 126 16 Psittacula columboides Blue-winged Parakeet Psittacidae LC 123 17 Psittacula caniceps Nicobar Parakeet Psittacidae NT 126 18 Centropus andamanensis Andaman Coucal Cuculidae LC 125 19 Otus balli Andaman Scops Owl Strigidae NT 125 20 Ninox affinis Andaman Hawk Owl Strigidae NT 125, 126 21 Apus acuticauda Dark-rumped Swift Apodidae VU 130 22 Harpactes wardi Ward's Trogon Trogonidae NT 130 23 Ocyceros griseus Malabar Grey Hornbill Bucerotidae LC 123 24 Aceros narcondami Narcondam Hornbill Bucerotidae EN 125 25 Dryocopus hodgei Andaman Black Woodpecker Picidae NT 125 26 Anthus nilghiriensis Nilgiri Pipit Motacillidae NT 123 27 Pycnonotus priocephalus Grey Headed Bulbul Pycnonotidae LC 123 28 Hypsipetes nicobariensis Nicobar Bulbul Pycnonotidae VU 126 29 Brachypteryx hyperythra Rusty-bellied Shortwing Turdidae VU 130 30 Brachypteryx major White-bellied Shortwing Turdidae VU 123 31 Garrulax delesserti Wynaad Laughingthrush Timaliidae LC 123 32 Garrulax cachinnans Nilgiri Laughingthrush Timaliidae EN 123 33 Garrulax jerdoni Grey-breasted Laughingthrush Timaliidae NT 123 34 Garrulax virgatus Striped Laughingthrush Timaliidae LC 130 35 Garrulax austeni Brown-capped Laughingthrush Timaliidae LC 130 36 Pellorneum palustre Marsh Babbler Timaliidae VU 131 37 Spelaeornis caudatus Rufous-throated Wren Babbler Timaliidae NT 130 38 Spelaeornis badeigularis Rusty-throated Wren Babbler Timaliidae VU 130 39 Spelaeornis longicaudatus Tawny-breasted Wren Babbler Timaliidae VU 130 40 Sphenocichla humei Wedge-billed Wren Babbler Timaliidae NT 130 41 Stachyris oglei Austen's/Snowy-throated
Babbler Timaliidae VU 130
42 Turdoides subrufa Indian Rufous Babbler Timaliidae LC 123 43 Babax waddelli Giant Babax Timaliidae NT 133 44 Actinodura nipalensis Hoary-throated Barwing Timaliidae LC 130 45 Actinodura waldeni Austen's/Streak-throated
Barwing Timaliidae LC 130
46 Alcippe ludlowi Brown-throated Tit-babbler/Ludlow's Fulvetta
Timaliidae LC 130
47 Heterophasia gracilis Grey Sibia Timaliidae LC 130 48 Heterophasia pulchella Beautiful Sibia Timaliidae LC 130 49 Yuhina bakeri White-naped Yuhina Timaliidae LC 130 50 Paradoxornis flavirostris Black-breasted Parrotbill Sylviidae VU 131

28
Appendix 1 (contd.): Endemic Birds of India # Scientific Name Common Name Family IUCN
Category* EBA
51 Phylloscopus subviridis Brooke's Leaf Warbler Sylviidae LC 128 52 Phylloscopus tytleri Tytler's Leaf Warbler Phylloscopidae NT 128 53 Phylloscopus cantator Black-browed Leaf / Yellow-vented
Warbler Phylloscopidae
LC 130 54 Tickellia hodgsoni Broad-billed Flycatcher/Warbler Cettiidae LC 130 55 Schoenicola platyura Broad-tailed Grassbird Sylviidae VU 123 56 Ficedula subrubra Kashmir Flycatcher Muscicapidae VU 128 57 Ficedula nigrorufa Black-and-Orange Flycatcher Muscicapidae NT 123 58 Eumyias albicaudata Nilgiri Flycatcher Muscicapidae NT 123 59 Cyornis pallipes White-bellied Blue Flycatcher Muscicapidae LC 123 60 Aegithalos leucogenys White-cheeked Tit Aegithalidae LC 128 61 Aegithalos niveogularis White-throated Tit Aegithalidae LC 128 62 Sitta cashmirensis Kashmir Nuthatch Sittidae LC 128 63 Nectarinia minima Small/Crimson-backed Sunbird Nectariniidae LC 123 64 Callacanthis burtoni Spectacled Finch Fringillidae LC 128 65 Pyrrhula aurantiaca Orange Bullfinch Fringillidae LC 128 66 Sturnus erythropygius White-headed Starling Sturnidae LC 125, 126 67 Dicrurus andamanensis Andaman Drongo Dicruridae NT 125 68 Dendrocitta leucogastra White-bellied Treepie Corvidae LC 123 69 Dendrocitta bayleyi Andaman Treepie Corvidae NT 125 70 Rhinoptilus bitorquatus Jerdon’s Courser Glareolidae CR SA** 71 Heteroglaux blewitti Forest Owlet Strigidae CR SA** 72 Pycnonotus xantholaemus Yellow-throated bulbul Pycnonotidae VU SA** 73 Garrulax nuchalis Chestnut-backed Laughingthrush Timaliidae NT SA** 74 Passer pyrrhonotus Sind Sparrow Passeridae LC SA** *IUCN Category: CR: Critically Endangered, EN: Endangered, VU: Vulnerable, NT: Near Threatened,
LC: Least Concern, DD: Data Deficient **SA: Secondary Areas are those that have only one restricted range species. This research project includes only
Endemic Bird Areas (which hold at least two endemic species of birds), and does not include Secondary Areas.
29
REFERENCES
Adler, G. H. 1994. Avifaunal diversity and endemism on tropical Indian Ocean islands.
Journal of Biogeography 21:85-95.
Arita, H. T. and E. Vazquez-Dominguez. 2008. The tropics: cradle, museum or casino? A
dynamic null model for latitudinal gradients of species diversity. Ecology Letters 11:653-
663.
Barve N., M. C. Kiran, G. Vanaraj, N. A. Aravind, D. Rao, R. Uma Shaanker, K. N.
Ganeshaiah, and J. G. Poulsen. 2005. Measuring and mapping threats to a wildlife
sanctuary in southern India. Conservation Biology 19:122-130.
Bhagwat, S. A., C. G. Kushalappa, P. H. Williams, and N. D. Brown. 2005. The Role of
Informal Protected Areas in Maintaining Biodiversity in the Western Ghats of India.
Ecology and Society 10(1):8.
BirdLife International 2003. BirdLife's online World Bird Database: the site for bird
conservation. Version 2.0. Cambridge, UK: BirdLife International.
http://www.birdlife.org.

30
Bliss, C. I. 1935. The calculation of the dosage-mortality curve. Annals of Applied
Biology 22:134–167.
Brown, J. H. 1971. Mammals on mountaintops: nonequilibrium insular biogeography.
American Naturalist 105:467-478.
Brooks, T. M., S. L. Pimm, and N. J. Collar. 1997. Deforestation predicts the number of
threatened birds in insular Southeast Asia. Conservation Biology 11:382-394.
Champion, H. G., and S. K. Seth. 1968. A revised survey of the forest types of India.
Publication Division, Government of India Press, New Delhi.
Chettri, N., E. Sharma, D. C. Deb, and R. C. Sundriyal. 2002. Effect of firewood
extraction on tree structure, regeneration, and woody biomass productivity in a trekking
corridor of the Sikkim Himalaya. Mountain Research and Development 22:150–158.
Connor, E. F. and E. D. McCoy. 1979. The statistics and biology of the species-area
relationship. American Naturalist 113:791-833.
Currie, D. J. 1991. Energy and large-scale patterns of animal- and plant- species richness.
American Naturalist 137: 27-49.

31
Doak, D. F. and L. S. Mills. 1994. A useful role for theory in conservation. Ecology
75:615-626.
Drakare, S., J. J. Lennon, and H. Hillebrand. 2006. The imprint of the geographical,
evolutionary and ecological context on species-area relationships. Ecology Letters 9:215-
227.
Gaston, K. J. 2000. Global patterns in biodiversity. Nature 405:220-227.
Grimmet, R., C. Inskipp, and T. Inskipp. 1998. Birds of the Indian Subcontinent.
Christopher Helm, London.
Hanski, I. and M. Gyllenberg. 1997. Uniting two general patterns in the distribution of
species. Science 275:397-400.
Hawkins, B. A. 2001. Ecology’s oldest pattern? Trends in Ecology and Evolution 16:470.
Hawkins, B. A., R. Field, H. V. Cornell, D. J. Currie, J-F. Geugan, D. M. Kaufman, J. T.
Kerr, G. G. Mittelbach, et al. 2003. Energy, water, and broad-scale geographic patterns
of species richness. Ecology 84:3105-3117.
Islam, M. Z. and A. R. Rahmani. 2005. Important Bird Areas in India: Priority Sites for
Conservation. Oxford University Press, India.

32
Jathar, G. A. and A. R. Rahmani. 2006. Endemic birds of India. Buceros 11(2&3):1-53.
Kallimanis, A., A. D. Mazaris, J. Tzanopoulos, J. M. Halley, J. D. Pantis, and S. P.
Sgardelis. 2008. How does habitat diversity affect the species-area relationship? Global
Ecology and Biogeography 17:532-538.
Krebs, C. J. 1998. Ecological Methodology. New York, NY, USA: Harper Collins
Publishers, Inc.
Lee, R. 2003. The demographic transition: Three centuries of fundamental change. The
Journal of Economic Perspectives 17:167-190.
Lomolino, M. V. 2000. Ecology’s most general, yet protean pattern: the species-area
relationship. Journal of Biogeography 27:17-26.
Long, A. J., M. J. Crosby, and A. J. Stattersfield. 1996. Towards a Global Map of
Biodiversity: Patterns in the Distribution of Restricted-Range Birds. Global Ecology and
Biogeography Letters 5:281-304.
Losos, J. B. and D. Schluter. 2000. Analysis of an evolutionary species-area relationship.
Nature 408:847-850.

33
MacArthur, R. H. and Wilson, E. O. 1967. The Theory of Island Biogeography.
Princeton, N.J.: Princeton University Press.
McCullagh, P., and J. A. Nelder. 1989. Generalized Linear Models. Chapman and Hall,
London.
Ney-Nifle, M. and M. Mangel. 2000. Habitat loss and changes in the species-area
relationship. Conservation Biology 14:893-898.
Pande, S., N. Sant, S. Ranade, S. Pednekar, P. Mestry, P. Deshpande, S. Kharat, and V.
Deshmukh. 2007. Avifaunal survey of Andaman and Nicobar Islands. Indian Birds
3(5):162–180.
Pianka, E. R. 1966. Latitudinal gradients in species diversity: a review of concepts.
American Naturalist 100:33-46.
Pielou, E. C. 1977. Mathematical Ecology. Wiley-Interscience, New York.
Preston, F. W. 1962. The canonical distribution of commonness and rarity. Ecology
43:185-215.
34
Rahbek, C., N. J. Gotelli, R. K. Colwell, G. L. Entsminger, T. F. L. V. B. Rangel, and G.
R. Graves. 2007. Predicting continental-scale patterns of bird species richness with
spatially explicit models. Proceedings of the Royal Society of Biological Sciences 274:
165-174.
Rahmani, A. R. and R. G. Soni. 1997. Avifaunal changes in the Indian Thar desert.
Journal of Arid Environments 36(4):687-703.
Ripley, S.D. and B. M. Beehler. 1989. Ornithogeographic affinities of the Andaman and
Nicobar Islands. Journal of Biogeography 16(4):323-332.
Rohde, K. 1992. Latitudinal gradients in species diversity: the search for the primary
cause. Oikos 65:514-527.
Rosenzweig, M. L. 1995. Species diversity in space and time. Cambridge University
Press, New York.
Rosenzweig, M. L. 1992. Species diversity gradients: we know more and less than we
thought. Journal of Mammalogy 73:715-730.
Ricklefs, R. E. and I. J. Lovette. 1999. The roles of island area per se and habitat diversity
in the species-area relationships of four lesser Antillean faunal groups. Journal of Animal
Ecology 68: 1142-1160.
35
Saldanha, L. F., A. Naik, A. Joshi, and S. Sastry. 2007. Green Tapism: A Review of the
Environmental Impact Assessment Notification – 2006. Environmental Support Group,
Bangalore, India.
Sankaran, R. 1997. Developing a protected area network in the Nicobar islands: the
perspective of endemic avifauna. Biodiversity and Conservation 6:797-815.
Sankaran, R. 1998. An annotated list of the endemic avifauna of the Nicobar Islands.
Forktail 13:17-22.
Scharlemann, J. P. W., A. Balmford, and R. E. Green. 2005. The Level of threat to
restricted-range bird species can be predicted from mapped data on land use and human
population. Biological Conservation 123:317-326.
Sharma, E., N. Jain, S. C. Rai, and R. Lepcha. 2000. Ecotourism in Sikkim: Contribution
toward conservation of biodiversity resources. Institutionalizing Common Pool
Resources. Concept Publishing Company, New Delhi, India.
Simberloff, D. S. 1976. Experimental zoogeography of islands: effects of island size.
Ecology 57:629-648.
Smith, A. B. 2010. Caution with curves: caveats for using the species-area relationship in
conservation. Biological Conservation 143:555-564.

36
Sorensen, T. 1948. A method of establishing groups of equal amplitude in plant
sociology based on similarity of species content and its application to analyses of the
vegetation on Danish commons. Kong. Danish Vidensk. Selsk. Biol. Skr., Copenhagen
5:1-34.
Stattersfield, A. J., M. J. Crosby, A. J. Long, and D. C. Wege. 1998. Endemic Bird Areas
of the World: Priorities for Biodiversity Conservation. BirdLife International,
Cambridge, United Kingdom.
Storch, D., A. L. Sizling, and K. J. Gaston. 2003. Geometry of the species-area
relationship in central European birds: Testing the mechanism. Journal of Animal
Ecology 72:509-519.
Thirgood, S.J. and M. F. Heath. 1994. Global patterns of endemism and the conservation
of biodiversity. Pp. 207-227 in P.L. Forey, C.J.Humphries & R.I. Vane-Wright (eds)
Systematics and conservation evaluation. Systematics Association Special Volume no.
50. Clarendon Press, Oxford, England.
Veron, J. 2008. The demography of South Asia from the 1950's to the 2000's, a summary
of changes and a statistical assessment. Population 63:9-90.

37
Vijayan, L., R. Sankaran, K. Sivakumar, and V. Murugan. 2000. A study on the ecology,
status and conservation perspectives of certain rare endemic avifauna of the Andaman &
Nicobar Islands: Final Report. Salim Ali Centre for Ornithology & Natural History,
Coimbatore, India.
Vyas, V. S., and V. R. Reddy. 1998. Assessment of environmental policies and policy
implementation in India. Economic and Political Weekly 33:48-54.
Whittaker, R. J., M. B. Araujo, P. Jepson, R. J. Ladle, J. E. M. Watson, and K. J. Willis.
2005. Conservation Biogeography: assessment and prospect. Diversity and Distributions
11:3-23.
Whittaker, R. J., K. J. Willis, and R. Field. 2001. Scale and species richness: towards a
general, hierarchical theory of species diversity. Journal of Biogeography 28:453-470.
Williams, C. B. 1943. Area and the number of species. Nature 152:264-267.
Willig, M. R., D. M. Kaufman, and R. D. Stevens. 2003. Latitudinal gradients of
biodiversity: pattern, process, scale, and synthesis. Annual Review of Ecology, Evolution,
and Systematics 34:273-309.
Wright, D. H. 1983. Species-energy theory: An extension of species-area theory. Oikos,
Island Ecology 41:496-506.

38
Zacharias V. J, and A. J. Gaston. 1999. The recent distribution of endemic, disjunct and
globally uncommon birds in the forests of Kerala State, south-west India. Bird
Conservation International 9(3):191
VITA
Bindu Viswanathan holds a Ph.D. in Biostatistics (Emory University, 1999). She
has worked as a biostatistician at Merck & Co. and Novartis Inc., and as research faculty
at Emory University, where she taught biostatistics and served as the primary statistician
on numerous research grants. She has been involved in supporting grassroots, sustainable
development projects in India for over ten years, coordinating projects in environmental
activism, rural development, and tiger conservation with Indian NGOs. She enrolled in
the Population and Conservation Biology program at Texas State University – San
Marcos in 2007 to better understand conservation-related issues.
Permanent Email Address: [email protected]
This thesis was typed by Bindu Viswanathan.


