RESEARCH ARTICLE Open Access
Evaluating risk factor assumptions: a simulation-based approachCarolyn M Rutter1,2*, Diana L Miglioretti1,2 and James E Savarino1
Abstract
Background: Microsimulation models are an important tool for estimating the comparative effectiveness ofinterventions through prediction of individual-level disease outcomes for a hypothetical population. To estimatethe effectiveness of interventions targeted toward high risk groups, the mechanism by which risk factors influencethe natural history of disease must be specified. We propose a method for evaluating these risk factor assumptionsas part of model-building.
Methods: We used simulation studies to examine the impact of risk factor assumptions on the relative rate (RR) ofcolorectal cancer (CRC) incidence and mortality for a cohort with a risk factor compared to a cohort without therisk factor using an extension of the CRC-SPIN model for colorectal cancer. We also compared the impact ofchanging age at initiation of screening colonoscopy for different risk mechanisms.
Results: Across CRC-specific risk factor mechanisms, the RR of CRC incidence and mortality decreased (towardsone) with increasing age. The rate of change in RRs across age groups depended on both the risk factormechanism and the strength of the risk factor effect. Increased non-CRC mortality attenuated the effect of CRC-specific risk factors on the RR of CRC when both were present. For each risk factor mechanism, earlier initiation ofscreening resulted in more life years gained, though the magnitude of life years gained varied across riskmechanisms.
Conclusions: Simulation studies can provide insight into both the effect of risk factor assumptions on modelpredictions and the type of data needed to calibrate risk factor models.
Keywords: microsimulation, colorectal cancer, comparative effectiveness, screening
1.0 BackgroundMicrosimulation models describe events and outcomesat the person-level and provide policy-relevant informa-tion by predicting the population-level impact of differ-ent interventions [1]. For example, microsimulationmodels can be used to predict trends in disease inci-dence and mortality under alternative health policyscenarios [2,3] or to compare the clinical effectivenessand cost-effectiveness of treatments [4]. Several riskfactors play a role in colorectal cancer, including bothnon-modifiable factors such as age, sex, race, and familyhistory and modifiable risk factors related to lifestyleincluding diet, activity level, and medication use [5,6].Microsimulation models can be used to examine the
impact of patient-centered interventions that are focusedon risk reduction and interventions targeted to high riskindividuals, such as more intensive colorectal cancer(CRC) screening for individuals at higher risk, withinitiation at earlier ages and/or shorter screening inter-vals [7]. Models that include risk factors must makeassumptions about how risk factors affect specific dis-ease processes and the magnitude of these effects [7-9].For example, two microsimulation models for CRCinclude detailed risk factor components including factorsrelated to increased risk (body mass index, smoking sta-tus, red meat consumption) and factors related reducedrisk (physical activity, fruit and vegetable consumption,multivitamin use, aspirin use, hormone replacementtherapy). One model allows these factors to affect onlyadenoma occurrence [2,10], the other allows risk factorsto affect both adenoma occurrence and progression to
* Correspondence: [email protected] Unit, Group Health Research Institute, Seattle, WA, USAFull list of author information is available at the end of the article
Rutter et al. BMC Medical Informatics and Decision Making 2011, 11:55http://www.biomedcentral.com/1472-6947/11/55
© 2011 Rutter et al; licensee BioMed Central Ltd. This is an Open Access article distributed under the terms of the Creative CommonsAttribution License (http://creativecommons.org/licenses/by/2.0), which permits unrestricted use, distribution, and reproduction inany medium, provided the original work is properly cited.

preclinical CRC [11]. These risk factor models are com-plex, requiring description of changes in modifiable riskfactors over time, yet basic work to inform risk factormodeling is lacking and little is known about the rela-tionship between different assumptions and conclusionsabout the effectiveness of interventions. This is espe-cially important because data available to distinguishbetween different risk mechanisms is sparse.Race is an example of a relatively simple risk factor that
we wish to include in natural history models for colorec-tal cancer [7,11]. Race is an imperfect proxy measure ofgenetic and lifestyle factors [12] associated with increasedrisk of CRC. There are demonstrated racial disparities inCRC outcomes. African Americans have higher CRCincidence and mortality than non-Hispanic whites, parti-cularly at younger ages, and are more likely to be diag-nosed with late stage disease [13]. The overall CRCincidence rate ratio for African American versus non-Hispanic white groups is 1.21 among men and 1.26among women [14]. In addition, African Americans tendto be diagnosed with later stage CRC than whites[13,15,16] and at a younger age [17]. There is scant directinformation about the reasons for these disparities [18].Some studies suggest that African American and non-Hispanic white groups have similar adenoma prevalence[18,19]. Colonoscopy studies have found that AfricanAmericans are more likely to have large adenomas thannon-Hispanic whites [20]. Therefore, race could plausiblybe modeled as a risk factor that is related to adenomaincidence, growth, or progression to colorectal cancer.We describe a method for exploring the impact of theserisk factor assumptions on model results, which providesinsight into the data required to build a model thatincludes a risk factors.
2.0 MethodsWe consider the impact of risk factors in the context ofthe Colorectal Cancer Simulated Population model forIncidence and Natural history (CRC-SPIN) [21]. CRC-SPIN simulates the natural history of colorectal cancerarising from adenomas (Table 1). For each simulatedindividual, the CRC-SPIN model generates a time ofbirth and a time of non-CRC (other-cause) death.Within this lifetime, adenoma occurrence is simulatedusing a non-homogeneous Poisson process with riskthat systematically varies as a function of gender andage. Each initiated adenoma is stochastically assigned alocation in the large intestine and a time to reach 10mm (which may exceed the individual’s lifetime). Ade-noma growth depends on adenoma location (colon orrectum) and is modeled using a continuous process withan asymmetric growth curve that specifies exponentialgrowth early that slows as adenomas reach a maximumof 50 mm. The probability of adenoma transition to
preclinical cancer is a function of adenoma size, ade-noma location (colon or rectum), gender, and age atadenoma initiation. The time of transition from preclini-cal cancer to clinical detection due to the onset ofsymptoms in the absence of screening, sojourn time,depends on the location of the preclinical cancer (colonor rectum). Once a cancer becomes clinically detectable,the size, stage at clinical detection, and survival aresimulated based on SEER data. Details about the modelstructure and calibration are provided elsewhere, [21,22]below we focus on incorporation of risk factors into thisbasic model.
2.1 Risk factorsFor simplicity, we consider a single binary risk factorindicated by xi(t) for the ith individual at time t wherexi(t) = 1 if the risk factor is present at time t and xi(t) =0 otherwise. We allow this risk factor to affect adenomaincidence, adenoma growth, transition to clinicallydetectable cancer, sojourn time, and other cause mortal-ity. We do not allow risk factors to affect CRC survivalgiven stage at detection.Adenoma riskLet ΨI (t) be the ith individual’s risk of developing anadenoma at time t in the absence of any risk factor.This model has a proportional hazards structure, so thatadenoma risk can be written as exp[δ1 x I (t)]ΨI (t). Thenumber of adenomas an individual develops by time thas a Poisson distribution, and the expected number ofadenomas for an individual with a fixed risk factor isexp[δ1] times greater than the expected number for anindividual of the same age and gender without the riskfactor.Adenoma growthLet d(t) be adenoma size at time t in the absence of anyrisk factor. We incorporate risk factors into the ade-noma growth model by assuming that the effect of riskfactors is to either expand or contract the time scale, t,so that given risk factor information, adenoma size is afunction of t’ (xi (t)) = exp (δ2xi(t)) t. Under this model,adenomas in an individual with a fixed risk factor reacha given size (e.g., 10 mm) in exp(-δ2) the time it takesadenomas to reach the same size in similar individualswithout the risk factor.Transition from adenoma to cancerThe probability of transition from adenoma to cancer isa function of gender, the location of the adenoma, theage at adenoma initiation, and the size of the adenomawith the probability of transition to cancer increasingwith increasing adenoma size. We incorporate risk fac-tors into the adenoma transition model by assumingthat the effect of risk factors is to either expand orcontract the size scale. Given risk factor information,the probability of transition is a function of
Rutter et al. BMC Medical Informatics and Decision Making 2011, 11:55http://www.biomedcentral.com/1472-6947/11/55
Page 2 of 9
s′ij(xi(t)) =
s∫
0
exp(δ3xi(u)
)du. Let P(s | age, location,
gender) be the probability that an adenoma of size s inan individual without the risk factor transitions to can-cer given their gender, the location of the adenoma andthe age at adenoma initiation. Under this model, if aperson with the same characteristics also had the riskfactor, then the probability that an adenoma of size stransitions to cancer is equal to exp(δ3)P(s | age, loca-tion, gender). For an individual with a fixed adenomatransition risk factor, the increase in risk is Ф((ln(g1exp(δ3)s) + g2(a-50))/g3) - Ф((ln(g1s) + g2(a-50))/g3) where ais age at adenoma initiation in years, g1 and g2 are loca-tion- and gender-specific transition parameters (seeTable 1), and Ф(.) is the standard Normal cumulativedistribution function.Sojourn time (time to clinical detection)In contrast to adenoma growth and transition to pre-clinical cancer, which may take a decade or more tooccur, transition from preclinical cancer to clinicallydetectable cancer is believed to occur within about 5years [23-25]. We assume that only those risk factorspresent at the time of transition to preclinical cancer
affect sojourn time, and assume that they have a multi-plicative effect on sojourn time. Let STij be sojourntime for the ith individual’s jth preclinical cancer inthe absence of risk factor information. If xi indicates arisk factor present at the time of transition to preclini-cal cancer, then sojourn time is given by ST’ij(xi) = exp[δ4 xi]ST ij.Other-cause mortalityRisk factors that increase risk for CRC such as highbody mass index and smoking [10] may also increaserisk of death from other causes. The CRC-SPIN modelstochastically assigns age at other-cause (non-CRC)death based on data from the National Center forHealth Statistics with survival that depends on genderand birth cohort [26]. Let a i be the age at other-causedeath for the ith individual in the absence of risk factorinformation. For a dichotomous risk factor, we allowthe change in age at other cause death to be propor-tional to the time the risk factor is present, so that
a′i(xi(t)) =
a∫
0
exp(δ5xi(u)
)du. Under this model, the age
at other-cause death given a fixed risk factor xi is a’j(xi)= exp[δ5 xi]a j.
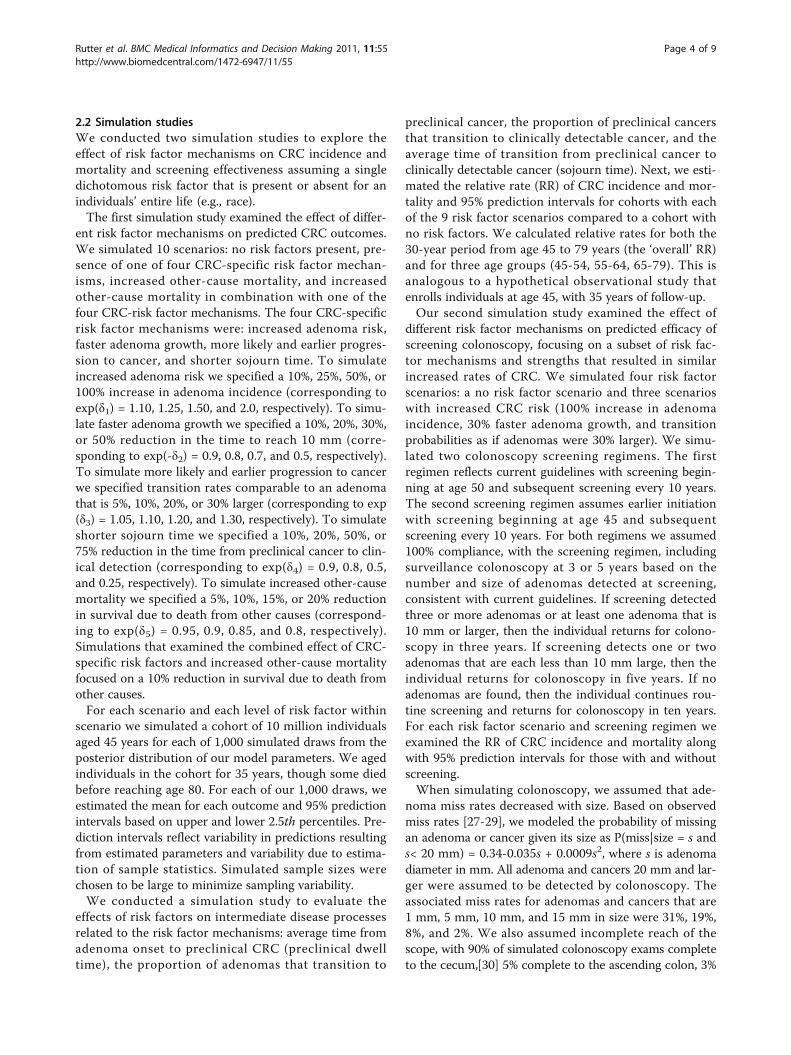
Table 1 Basic structure of the CRC-SPIN Model
Model component
Adenoma incidence: non-homogeneous Poisson process
Log-risk for the ith individual at time t, ℓn(Ψi(t)) =
α0i + α1sexi +4∑
k=1
δ(Ak < agei(t) ≤ Ak+1)
⎧⎨⎩agei(t)α2k +
k∑j=2
Aj(α2,j−1 − α2j)
⎫⎬⎭
• Baseline log-risk, a0i, is Normally distributed, mean Λ, standard deviation s• δ(.) is an indicator function with δ(x) = 1 when the condition x is true and δ(x) = 0 otherwise• agei(t) is the ith individual’s age at time t• A1 = 20, A2 = 50, A3 = 60, A4 = 70, A5=∞ (effectively 100 years old)
Adenoma location probabilities: cecum: 0.08; ascending colon: 0.23; transverse colon: 24; descending colon: 0.12; sigmoid colon: 0.24; rectum:0.09.
Adenoma growth: Janoshek growth curve
dij(t) = d∞ - (d∞ - d0) exp (-lijt)• dij(t) is the maximum diameter of the jth adenoma in the ith individual at time t after initiation.• d0 = 1 mm, minimal detectable adenoma size• d∞ = 50 mm, maximum adenoma size• time to reach 10 mm: -In((d∞ - 10)/(d∞ - d0))/l.
Time to reach 10 mm: type 2 extreme value distribution
Adenomas in the colon: distribution parameterized by b1c and b2cAdenomas in the rectum: distribution parameterized by b1r and b2r
Transition to preclinical cancer: normal cumulative distribution
Probability of transition, male colon Ф({In (g1 cm size) + g2 cm (a-50)}/g3Probability of transition, male rectum Ф({In (g1 rm size) + g2 rm (a-50)}/g3Probability of transition, female colon Ф({In (g1 cf size) + g2 cf (a-50)}/g3Probability of transition, female rectum Ф({In (g1 rf size) + g2 rf (a-50)}/g3Where Ф(.) is the standard Normal cumulative distribution function, size is adenoma size in mm, and a is age at adenoma initiation.
Sojourn time: lognormal distribution
Preclinical colon cancer, lognormal with mean μc, standard deviation τcμcPreclinical rectal cancer, lognormal with mean μr, standard deviation τrμr
Rutter et al. BMC Medical Informatics and Decision Making 2011, 11:55http://www.biomedcentral.com/1472-6947/11/55
Page 3 of 9
2.2 Simulation studiesWe conducted two simulation studies to explore theeffect of risk factor mechanisms on CRC incidence andmortality and screening effectiveness assuming a singledichotomous risk factor that is present or absent for anindividuals’ entire life (e.g., race).The first simulation study examined the effect of differ-
ent risk factor mechanisms on predicted CRC outcomes.We simulated 10 scenarios: no risk factors present, pre-sence of one of four CRC-specific risk factor mechan-isms, increased other-cause mortality, and increasedother-cause mortality in combination with one of thefour CRC-risk factor mechanisms. The four CRC-specificrisk factor mechanisms were: increased adenoma risk,faster adenoma growth, more likely and earlier progres-sion to cancer, and shorter sojourn time. To simulateincreased adenoma risk we specified a 10%, 25%, 50%, or100% increase in adenoma incidence (corresponding toexp(δ1) = 1.10, 1.25, 1.50, and 2.0, respectively). To simu-late faster adenoma growth we specified a 10%, 20%, 30%,or 50% reduction in the time to reach 10 mm (corre-sponding to exp(-δ2) = 0.9, 0.8, 0.7, and 0.5, respectively).To simulate more likely and earlier progression to cancerwe specified transition rates comparable to an adenomathat is 5%, 10%, 20%, or 30% larger (corresponding to exp(δ3) = 1.05, 1.10, 1.20, and 1.30, respectively). To simulateshorter sojourn time we specified a 10%, 20%, 50%, or75% reduction in the time from preclinical cancer to clin-ical detection (corresponding to exp(δ4) = 0.9, 0.8, 0.5,and 0.25, respectively). To simulate increased other-causemortality we specified a 5%, 10%, 15%, or 20% reductionin survival due to death from other causes (correspond-ing to exp(δ5) = 0.95, 0.9, 0.85, and 0.8, respectively).Simulations that examined the combined effect of CRC-specific risk factors and increased other-cause mortalityfocused on a 10% reduction in survival due to death fromother causes.For each scenario and each level of risk factor within
scenario we simulated a cohort of 10 million individualsaged 45 years for each of 1,000 simulated draws from theposterior distribution of our model parameters. We agedindividuals in the cohort for 35 years, though some diedbefore reaching age 80. For each of our 1,000 draws, weestimated the mean for each outcome and 95% predictionintervals based on upper and lower 2.5th percentiles. Pre-diction intervals reflect variability in predictions resultingfrom estimated parameters and variability due to estima-tion of sample statistics. Simulated sample sizes werechosen to be large to minimize sampling variability.We conducted a simulation study to evaluate the
effects of risk factors on intermediate disease processesrelated to the risk factor mechanisms: average time fromadenoma onset to preclinical CRC (preclinical dwelltime), the proportion of adenomas that transition to
preclinical cancer, the proportion of preclinical cancersthat transition to clinically detectable cancer, and theaverage time of transition from preclinical cancer toclinically detectable cancer (sojourn time). Next, we esti-mated the relative rate (RR) of CRC incidence and mor-tality and 95% prediction intervals for cohorts with eachof the 9 risk factor scenarios compared to a cohort withno risk factors. We calculated relative rates for both the30-year period from age 45 to 79 years (the ‘overall’ RR)and for three age groups (45-54, 55-64, 65-79). This isanalogous to a hypothetical observational study thatenrolls individuals at age 45, with 35 years of follow-up.Our second simulation study examined the effect of
different risk factor mechanisms on predicted efficacy ofscreening colonoscopy, focusing on a subset of risk fac-tor mechanisms and strengths that resulted in similarincreased rates of CRC. We simulated four risk factorscenarios: a no risk factor scenario and three scenarioswith increased CRC risk (100% increase in adenomaincidence, 30% faster adenoma growth, and transitionprobabilities as if adenomas were 30% larger). We simu-lated two colonoscopy screening regimens. The firstregimen reflects current guidelines with screening begin-ning at age 50 and subsequent screening every 10 years.The second screening regimen assumes earlier initiationwith screening beginning at age 45 and subsequentscreening every 10 years. For both regimens we assumed100% compliance, with the screening regimen, includingsurveillance colonoscopy at 3 or 5 years based on thenumber and size of adenomas detected at screening,consistent with current guidelines. If screening detectedthree or more adenomas or at least one adenoma that is10 mm or larger, then the individual returns for colono-scopy in three years. If screening detects one or twoadenomas that are each less than 10 mm large, then theindividual returns for colonoscopy in five years. If noadenomas are found, then the individual continues rou-tine screening and returns for colonoscopy in ten years.For each risk factor scenario and screening regimen weexamined the RR of CRC incidence and mortality alongwith 95% prediction intervals for those with and withoutscreening.When simulating colonoscopy, we assumed that ade-
noma miss rates decreased with size. Based on observedmiss rates [27-29], we modeled the probability of missingan adenoma or cancer given its size as P(miss|size = s ands< 20 mm) = 0.34-0.035s + 0.0009s2, where s is adenomadiameter in mm. All adenoma and cancers 20 mm and lar-ger were assumed to be detected by colonoscopy. Theassociated miss rates for adenomas and cancers that are1 mm, 5 mm, 10 mm, and 15 mm in size were 31%, 19%,8%, and 2%. We also assumed incomplete reach of thescope, with 90% of simulated colonoscopy exams completeto the cecum,[30] 5% complete to the ascending colon, 3%
Rutter et al. BMC Medical Informatics and Decision Making 2011, 11:55http://www.biomedcentral.com/1472-6947/11/55
Page 4 of 9
complete to the transverse colon, and 2% complete to thedescending colon.For each risk factor scenario and level, and each of
1,000 model parameter values, we simulated a cohort of10 million 45 year old individuals. For each risk factorcohort, we calculated the mortality reduction (MR) andlife years gained (LYG) per 1000 individuals attributableto screening by comparing screened to unscreenedcohorts up the each individual’s 80th birthday. MRrepresents the proportional reduction in colorectal can-cer deaths and LYG representing the difference in survi-val following the age at screening initiation. Finally, wecompared the predicted impact of different screeningregimens across risk factor cohorts. We estimated pos-terior means, based on the average predictions across1,000 simulated parameter values; 95% prediction inter-vals, based on 2.5th and 97.5th percentiles of predictionsacross 1,000 simulated parameter values; and the poster-ior probability of differential effectiveness of differentscreening regimens for different risk cohorts, based onthe percentage of times screening was more effective inone cohort compared to another across 1,0000 simu-lated parameter values [31].
3.0 ResultsSimulated intermediate (and not directly observable) out-comes were consistent with risk factor assumptions, withCRC-specific risk factors affecting only their associatedmechanisms (data not shown). Increased adenoma inci-dence resulted in greater adenoma prevalence anddecreased sojourn time resulted in a higher probability oftransition from preclinical to clinical CRC and shortermean sojourn time. Increased adenoma growth andincreased probability of transition from adenoma to pre-clinical cancer had similar effects with both resulting in ahigher probability of transition to preclinical cancer andshorter mean preclinical dwell time. The similarity ofthese effects is consistent with the structure of the CRC-SPIN model, which assumes that the probability of tran-sition to preclinical CRC increases with adenoma size.Increased risk of other-cause death resulted in a lowerprobability of transition to preclinical CRC, slightlyshorter preclinical dwell time, a slightly lower probabilityof transition from preclinical to clinical CRC, and a slightshortening of sojourn time. This occurs because indivi-duals with longer preclinical dwell and sojourn times aremore likely to die before transition to the next diseasestate.For a given risk factor mechanism and strength of
effect, the RR of CRC incidence with versus without therisk factor was nearly identical to the RR of CRC moralitywith versus without the risk factor. For example, whenadenomas grew 30% faster, the mean RR of CRC inci-dence versus CRC mortality was: 1.84 versus 1.85 for
ages 45-79; 2.34 versus 2.37 for ages 45-54; 2.00 versus2.03 for ages 55-64; and 1.72 versus 1.73 for ages 65-79.Across the range of scenarios explored, differences inRRs for CRC mortality and incidence ranged from -0.04to 0.14, with 77% of the scenarios showing a 0.01 orsmaller difference in RRs. Given this similarity, theremainder of our paper focuses exclusively on CRCmortality.The RR of CRC mortality associated with presence of a
CRC-specific risk factor decreased towards one withincreasing age, and the rate of change across age groupsdepended on the risk factor mechanism (Table 2). Forexample, there was a greater change in RR across agegroups for faster adenoma growth than for increased ade-noma incidence, even when the risk factors were set tolevels that produced similar overall increases in CRCmortality. The rate of change increased with the strengthof the risk factor. A 100% increase in adenoma incidenceresulted in a 1.89 RR of CRC mortality from age 45 to 79,and the RR ranged from 1.98 for ages 45-54 down to 1.86for ages 65-79. Similarly, 30% faster adenoma growthresulted in a 1.85 RR of CRC mortality from age 45 to 79,but for this mechanism the RR ranged from 2.37 for ages45-54 down to 1.73 for ages 65-79. The effects of fasteradenoma growth and transition to preclinical cancer atsmaller adenoma sizes on the RR were similar. Reducedsojourn time had little impact on the RR of CRC inci-dence or mortality.Increased other-cause mortality reduced the risk of
CRC mortality (RR < 1, Table 2), a result of competingrisks. The reduction in risk increased with both increas-ing other-cause mortality and increasing age. Collapsingacross age groups results in greater estimated risk reduc-tion (across the 45-79 year age range) than age-specificRRs, demonstrating Simpson’s paradox [32,33]. Weobserved similar patterns when we modeled co-occur-rence of CRC-specific risk factors and increased mortal-ity. In the presence of increased risk for other-causemortality, age specific RRs associated with colorectal can-cer were slightly attenuated, with greater degrees ofobserved attenuation for RR across the whole 45-79 yearold age range (data not shown). For example, a 10%reduction in other-cause survival reduced the RR asso-ciated with a 100% increase in adenoma incidence from1.89 down to 1.64 (95% prediction interval (PI)(1.57,1.71)) overall and from 1.86 down to 1.76 (95% PI(1.66,1.85)) in the 65-79 year old age group, with no evi-dence of attenuation of the RR in the 45-54 and 55-64year old age groups.We explored the potential for different risk factor
mechanisms to impact predicted screening effectivenessacross three types of risk factors associated with a similarincreased risk of CRC mortality (compared to the no riskfactor group: 1.89 RR for increased adenoma risk, 1.85
Rutter et al. BMC Medical Informatics and Decision Making 2011, 11:55http://www.biomedcentral.com/1472-6947/11/55
Page 5 of 9
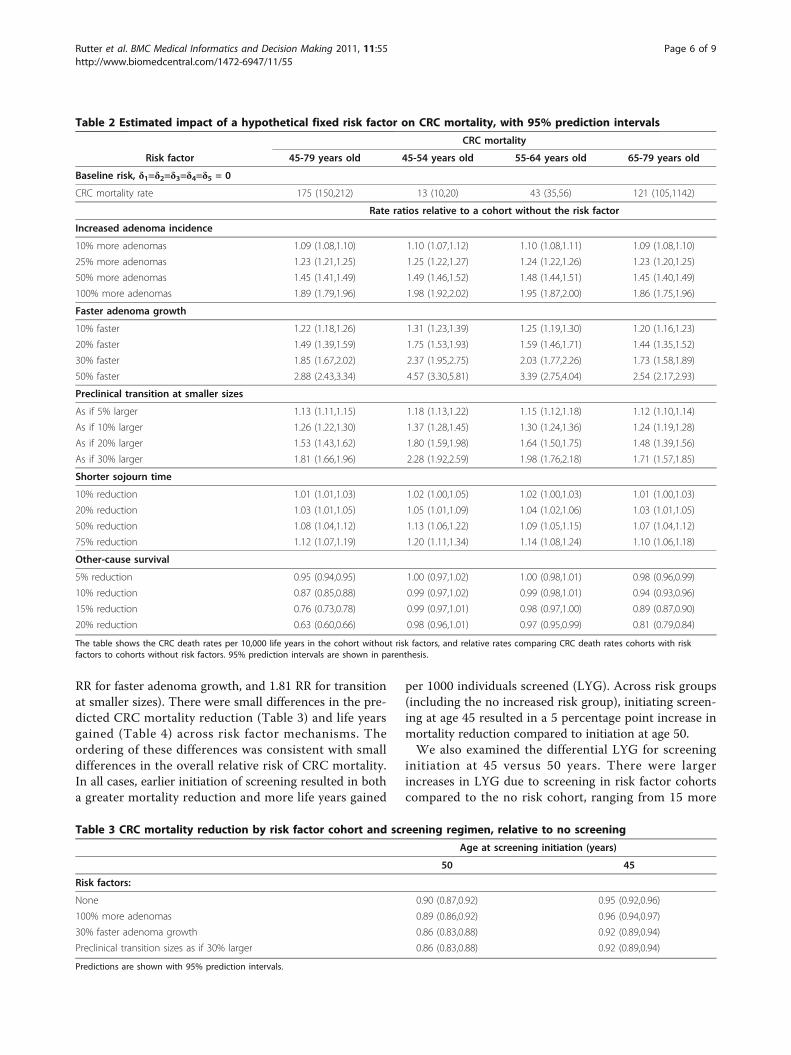
RR for faster adenoma growth, and 1.81 RR for transitionat smaller sizes). There were small differences in the pre-dicted CRC mortality reduction (Table 3) and life yearsgained (Table 4) across risk factor mechanisms. Theordering of these differences was consistent with smalldifferences in the overall relative risk of CRC mortality.In all cases, earlier initiation of screening resulted in botha greater mortality reduction and more life years gained
per 1000 individuals screened (LYG). Across risk groups(including the no increased risk group), initiating screen-ing at age 45 resulted in a 5 percentage point increase inmortality reduction compared to initiation at age 50.We also examined the differential LYG for screening
initiation at 45 versus 50 years. There were largerincreases in LYG due to screening in risk factor cohortscompared to the no risk cohort, ranging from 15 more
Table 2 Estimated impact of a hypothetical fixed risk factor on CRC mortality, with 95% prediction intervals
CRC mortality
Risk factor 45-79 years old 45-54 years old 55-64 years old 65-79 years old
Baseline risk, δ1=δ2=δ3=δ4=δ5 = 0
CRC mortality rate 175 (150,212) 13 (10,20) 43 (35,56) 121 (105,1142)
Rate ratios relative to a cohort without the risk factor
Increased adenoma incidence
10% more adenomas 1.09 (1.08,1.10) 1.10 (1.07,1.12) 1.10 (1.08,1.11) 1.09 (1.08,1.10)
25% more adenomas 1.23 (1.21,1.25) 1.25 (1.22,1.27) 1.24 (1.22,1.26) 1.23 (1.20,1.25)
50% more adenomas 1.45 (1.41,1.49) 1.49 (1.46,1.52) 1.48 (1.44,1.51) 1.45 (1.40,1.49)
100% more adenomas 1.89 (1.79,1.96) 1.98 (1.92,2.02) 1.95 (1.87,2.00) 1.86 (1.75,1.96)
Faster adenoma growth
10% faster 1.22 (1.18,1.26) 1.31 (1.23,1.39) 1.25 (1.19,1.30) 1.20 (1.16,1.23)
20% faster 1.49 (1.39,1.59) 1.75 (1.53,1.93) 1.59 (1.46,1.71) 1.44 (1.35,1.52)
30% faster 1.85 (1.67,2.02) 2.37 (1.95,2.75) 2.03 (1.77,2.26) 1.73 (1.58,1.89)
50% faster 2.88 (2.43,3.34) 4.57 (3.30,5.81) 3.39 (2.75,4.04) 2.54 (2.17,2.93)
Preclinical transition at smaller sizes
As if 5% larger 1.13 (1.11,1.15) 1.18 (1.13,1.22) 1.15 (1.12,1.18) 1.12 (1.10,1.14)
As if 10% larger 1.26 (1.22,1.30) 1.37 (1.28,1.45) 1.30 (1.24,1.36) 1.24 (1.19,1.28)
As if 20% larger 1.53 (1.43,1.62) 1.80 (1.59,1.98) 1.64 (1.50,1.75) 1.48 (1.39,1.56)
As if 30% larger 1.81 (1.66,1.96) 2.28 (1.92,2.59) 1.98 (1.76,2.18) 1.71 (1.57,1.85)
Shorter sojourn time
10% reduction 1.01 (1.01,1.03) 1.02 (1.00,1.05) 1.02 (1.00,1.03) 1.01 (1.00,1.03)
20% reduction 1.03 (1.01,1.05) 1.05 (1.01,1.09) 1.04 (1.02,1.06) 1.03 (1.01,1.05)
50% reduction 1.08 (1.04,1.12) 1.13 (1.06,1.22) 1.09 (1.05,1.15) 1.07 (1.04,1.12)
75% reduction 1.12 (1.07,1.19) 1.20 (1.11,1.34) 1.14 (1.08,1.24) 1.10 (1.06,1.18)
Other-cause survival
5% reduction 0.95 (0.94,0.95) 1.00 (0.97,1.02) 1.00 (0.98,1.01) 0.98 (0.96,0.99)
10% reduction 0.87 (0.85,0.88) 0.99 (0.97,1.02) 0.99 (0.98,1.01) 0.94 (0.93,0.96)
15% reduction 0.76 (0.73,0.78) 0.99 (0.97,1.01) 0.98 (0.97,1.00) 0.89 (0.87,0.90)
20% reduction 0.63 (0.60,0.66) 0.98 (0.96,1.01) 0.97 (0.95,0.99) 0.81 (0.79,0.84)
The table shows the CRC death rates per 10,000 life years in the cohort without risk factors, and relative rates comparing CRC death rates cohorts with riskfactors to cohorts without risk factors. 95% prediction intervals are shown in parenthesis.
Table 3 CRC mortality reduction by risk factor cohort and screening regimen, relative to no screening
Age at screening initiation (years)
50 45
Risk factors:
None 0.90 (0.87,0.92) 0.95 (0.92,0.96)
100% more adenomas 0.89 (0.86,0.92) 0.96 (0.94,0.97)
30% faster adenoma growth 0.86 (0.83,0.88) 0.92 (0.89,0.94)
Preclinical transition sizes as if 30% larger 0.86 (0.83,0.88) 0.92 (0.89,0.94)
Predictions are shown with 95% prediction intervals.
Rutter et al. BMC Medical Informatics and Decision Making 2011, 11:55http://www.biomedcentral.com/1472-6947/11/55
Page 6 of 9
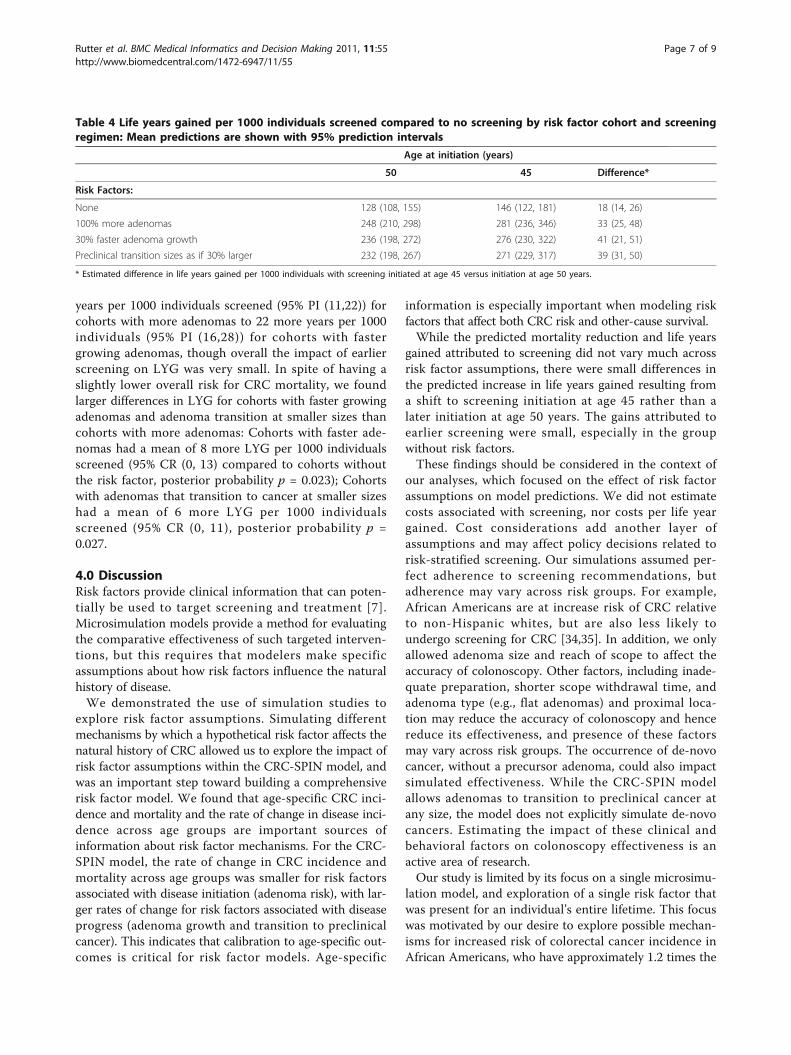
years per 1000 individuals screened (95% PI (11,22)) forcohorts with more adenomas to 22 more years per 1000individuals (95% PI (16,28)) for cohorts with fastergrowing adenomas, though overall the impact of earlierscreening on LYG was very small. In spite of having aslightly lower overall risk for CRC mortality, we foundlarger differences in LYG for cohorts with faster growingadenomas and adenoma transition at smaller sizes thancohorts with more adenomas: Cohorts with faster ade-nomas had a mean of 8 more LYG per 1000 individualsscreened (95% CR (0, 13) compared to cohorts withoutthe risk factor, posterior probability p = 0.023); Cohortswith adenomas that transition to cancer at smaller sizeshad a mean of 6 more LYG per 1000 individualsscreened (95% CR (0, 11), posterior probability p =0.027.
4.0 DiscussionRisk factors provide clinical information that can poten-tially be used to target screening and treatment [7].Microsimulation models provide a method for evaluatingthe comparative effectiveness of such targeted interven-tions, but this requires that modelers make specificassumptions about how risk factors influence the naturalhistory of disease.We demonstrated the use of simulation studies to
explore risk factor assumptions. Simulating differentmechanisms by which a hypothetical risk factor affects thenatural history of CRC allowed us to explore the impact ofrisk factor assumptions within the CRC-SPIN model, andwas an important step toward building a comprehensiverisk factor model. We found that age-specific CRC inci-dence and mortality and the rate of change in disease inci-dence across age groups are important sources ofinformation about risk factor mechanisms. For the CRC-SPIN model, the rate of change in CRC incidence andmortality across age groups was smaller for risk factorsassociated with disease initiation (adenoma risk), with lar-ger rates of change for risk factors associated with diseaseprogress (adenoma growth and transition to preclinicalcancer). This indicates that calibration to age-specific out-comes is critical for risk factor models. Age-specific
information is especially important when modeling riskfactors that affect both CRC risk and other-cause survival.While the predicted mortality reduction and life years
gained attributed to screening did not vary much acrossrisk factor assumptions, there were small differences inthe predicted increase in life years gained resulting froma shift to screening initiation at age 45 rather than alater initiation at age 50 years. The gains attributed toearlier screening were small, especially in the groupwithout risk factors.These findings should be considered in the context of
our analyses, which focused on the effect of risk factorassumptions on model predictions. We did not estimatecosts associated with screening, nor costs per life yeargained. Cost considerations add another layer ofassumptions and may affect policy decisions related torisk-stratified screening. Our simulations assumed per-fect adherence to screening recommendations, butadherence may vary across risk groups. For example,African Americans are at increase risk of CRC relativeto non-Hispanic whites, but are also less likely toundergo screening for CRC [34,35]. In addition, we onlyallowed adenoma size and reach of scope to affect theaccuracy of colonoscopy. Other factors, including inade-quate preparation, shorter scope withdrawal time, andadenoma type (e.g., flat adenomas) and proximal loca-tion may reduce the accuracy of colonoscopy and hencereduce its effectiveness, and presence of these factorsmay vary across risk groups. The occurrence of de-novocancer, without a precursor adenoma, could also impactsimulated effectiveness. While the CRC-SPIN modelallows adenomas to transition to preclinical cancer atany size, the model does not explicitly simulate de-novocancers. Estimating the impact of these clinical andbehavioral factors on colonoscopy effectiveness is anactive area of research.Our study is limited by its focus on a single microsimu-
lation model, and exploration of a single risk factor thatwas present for an individual’s entire lifetime. This focuswas motivated by our desire to explore possible mechan-isms for increased risk of colorectal cancer incidence inAfrican Americans, who have approximately 1.2 times the
Table 4 Life years gained per 1000 individuals screened compared to no screening by risk factor cohort and screeningregimen: Mean predictions are shown with 95% prediction intervals
Age at initiation (years)
50 45 Difference*
Risk Factors:
None 128 (108, 155) 146 (122, 181) 18 (14, 26)
100% more adenomas 248 (210, 298) 281 (236, 346) 33 (25, 48)
30% faster adenoma growth 236 (198, 272) 276 (230, 322) 41 (21, 51)
Preclinical transition sizes as if 30% larger 232 (198, 267) 271 (229, 317) 39 (31, 50)
* Estimated difference in life years gained per 1000 individuals with screening initiated at age 45 versus initiation at age 50 years.
Rutter et al. BMC Medical Informatics and Decision Making 2011, 11:55http://www.biomedcentral.com/1472-6947/11/55
Page 7 of 9
risk of CRC relative to non-Hispanic whites, near the lowend of the range we explored in our simulations. Whilethis type of non-modifiable risk factor is of interest, modi-fiable risk factors such as smoking and body mass indexare also important and incorporating these modifiablerisks into models requires additional assumptions abouthow changes in risk factors over an individual’s lifetimeinfluence the natural history of disease. For example, thetime lag between changes in risk factor status andobserved changes in risk may be related to the assumedrisk factor mechanism. Simulations that inform modelchoices may be even more important when consideringthese more complex risk factor structures. We restrictedour attention to a risk factor that affects one componentof the process leading to diagnosis with colorectal cancerand possibly other-cause (non-colorectal cancer) survival.Our approach to modeling other-cause survival was alsofairly simplistic. We suggested this approach primarily forpurposes of exploring the possible interaction betweenrisk factors that affect both other-cause survival and CRCnatural history processes. We did not allow risk factors toalso affect survival after diagnosis with colorectal cancer,an assumption that is consistent with current modelingapproaches [2,11], but likely drove the similarity of ourfindings for colorectal cancer incidence and mortality. Ourestimates of screening benefit would change if a risk factorwas allowed affect both CRC incidence and survival fromCRC. For example, there is some evidence that AfricanAmericans have poorer stage-specific CRC survival thannon-Hispanic whites [36].
5.0 ConclusionsOur study demonstrates the importance of careful eva-luation of risk factor assumptions, and the ability to usesimulation studies to carry out exploratory analyses. Inaddition to providing information about the effect ofrisk factor assumptions on model results, simulationstudies can provide insight into the type of data neededto calibrate risk factor models. Gaining clarity about thedata needed to calibrate risk factor models is an impor-tant first step toward collaborations between modelersand clinician researchers to develop data-driven risk fac-tor models. Finally, these results demonstrate the impor-tance of including a clear description of assumed riskfactor mechanisms in studies using microsimulationmodels, along with sensitivity analyses showing howthese assumptions influence results.
Acknowledgements and FundingThis work was supported by NCI U01-CA-097427 and NCI U01-CA-52959
Author details1Biostatistics Unit, Group Health Research Institute, Seattle, WA, USA.2Department of Biostatistics, University of Washington, Seattle, WA, USA.
Authors’ contributionsCMR developed the microsimulation model used to demonstrate risk factorassumptions, designed the simulation study used to assess risk factor effects,and drafted the manuscript. DLM assisted in development of the CRC-SPINmodel, design of the simulation study, and manuscript development. JESwas the programming architect for the CRC-SPIN algorithm, developed andimplemented all of the programs used to generate and summarize results.All authors read and approved the final manuscript.
Competing interestsThe authors declare that they have no competing interests.
Received: 13 December 2010 Accepted: 7 September 2011Published: 7 September 2011
References1. Rutter CM, Zaslavsky AM, Feuer EJ: Dynamic microsimulation models for
health outcomes: A review. Med Decis Making 2010.2. Vogelaar I, Van Ballegooijen M, Schrag D, Boer R, Winawer SJ, Habbema JD,
Zauber AG: How much can current interventions reduce colorectalcancer mortality in the U.S.? Cancer 2006, 107:1623-1633.
3. Colorectal Cancer Mortality Projections. [http://www.cisnet.cancer.gov/projections/colorectal/index.php].
4. Zauber AG, Lansdorp-Vogelaar I, Knudsen AB, Wilschut J, vanBallegooijen M, Kuntz KM: Evaluating test strategies for colorectal cancerscreening: a decision analysis for the U.S. Preventive Services Task Force.Ann Intern Med 2008, 149(9):659-669.
5. Lieberman DA, Prindiville S, Weiss DG, Willett W: Risk factors for advancedcolonic neoplasia and hyperplastic polyps in asymptomatic individuals.JAMA 2003, 290(22):2959-2967.
6. Heavey PM, McKenna D, Rowland IR: Colorectal cancer and therelationship between genes and the environment. Nutr Cancer 2004,48(2):124-141.
7. Lansdorp-Vogelaar I, van Ballegooijen M, Zauber AG, Boer R, Wilschut J,Winawer SJ, Habbema JD: Individualizing colonoscopy screening by sexand race. Gastrointest Endosc 2009, 70(1):96-108, 108 e101-124.
8. U.S. Department of Health and Human Services: Healthy People 2010. 2edition. Washington, DC: U.S. Government Printing Office; 2000, WithUnderstanding and Improving Health and Objectives for Improving Health.2 vols. edn.
9. IOM (Institute of Medicine): Initial National Priorities for ComparativeEffectiveness Research. Washington, DC:: The National Academies Press;2009.
10. Edwards BK, Ward E, Kohler BA, Eheman C, Zauber AG, Anderson RN,Jemal A, Schymura MJ, Lansdorp-Vogelaar I, Seeff LC, et al: Annual reportto the nation on the status of cancer, 1975-2006, featuring colorectalcancer trends and impact of interventions (risk factors, screening, andtreatment) to reduce future rates. Cancer 2009, 116(3):544-573.
11. Knudsen AB: Explaining secular trends in colorectal cancer incidence andmortality with an empirically-calibrated microsimulation model.Cambridge, MA: Harvard University; 2005.
12. Simon MS, Thomson CA, Pettijohn E, Kato I, Rodabough RJ, Lane D,Hubbell FA, O’Sullivan MJ, Adams-Campbell L, Mouton CP, et al: RacialDifferences in Colorectal Cancer Incidence and Mortality in the Women’sHealth Initiative. Cancer Epidemiol Biomarkers Prev 2011, 20(7):1368-1378.
13. Polite BN, Dignam JJ, Olopade OI: Colorectal cancer model of healthdisparities: understanding mortality differences in minority populations.J Clin Oncol 2006, 24:2179-2187.
14. Cancer Facts & Figures 2008. [http://www.cancer.org/acs/groups/content/@nho/documents/document/2008cafffinalsecuredpdf.pdf].
15. Cheng X, Chen VW, Steele B, Ruiz B, Fulton J, Liu L, Carozza SE, Greenlee R:Subsite-specific incidence rate and stage of disease in colorectal cancerby race, gender, and age group in the United States, 1992-1997. Cancer2001, 92(10):2547-2554.
16. Doubeni CA, Field TS, Buist DS, Korner EJ, Bigelow C, Lamerato L,Herrinton L, Quinn VP, Hart G, Hornbrook MC, et al: Racial differences intumor stage and survival for colorectal cancer in an insured population.Cancer 2007, 109(3):612-620.
17. Jessup JM, McGinnis LS, Steele GD, Menck HR, Winchester DP: TheNational Cancer Data Base. Report on colon cancer. Cancer 1996,78(4):918-926.
Rutter et al. BMC Medical Informatics and Decision Making 2011, 11:55http://www.biomedcentral.com/1472-6947/11/55
Page 8 of 9
18. Penn E, Garrow D, Romagnuolo J: Influence of race and sex onprevalence and recurrence of colon polyps. Arch Intern Med 2010,170(13):1127-1132.
19. Francois F, Park J, Bini EJ: Colon pathology detected after a positivescreening flexible sigmoidoscopy: a prospective study in an ethnicallydiverse cohort. Am J Gastroenterol 2006, 101(4):823-830.
20. Lieberman DA, Holub JL, Moravec MD, Eisen GM, Peters D, Morris CD:Prevalence of colon polyps detected by colonoscopy screening inasymptomatic black and white patients. JAMA 2008, 300(12):1417-1422.
21. Rutter CM, Savarino JE: An evidence-based microsimulation model forcolorectal cancer. Cancer Epidemiol Biomarkers Prev 2010, 19(August,2010):1992-2002.
22. Rutter CM, Miglioretti DL, Savarino JE: Bayesian calibration ofmicrosimulation models. J Am Stat Assoc 2009, 104(488):1338-1350.
23. Chen TH, Yen MF, Lai MS, Koong SL, Wang CY, Wong JM, Prevost TC,Duffy SW: Evaluation of a selective screening for colorectal carcinoma:the Taiwan Multicenter Cancer Screening (TAMCAS) project. Cancer 1999,86(7):1116-1128.
24. Launoy G, Smith TC, Duffy SW, Bouvier V: Colorectal cancer mass-screening: estimation of faecal occult blood test sensitivity, taking intoaccount cancer mean sojourn time. Int J Cancer 1997, 73(2):220-224.
25. Prevost TC, Launoy G, Duffy SW, Chen HH: Estimating sensitivity andsojourn time in screening for colorectal cancer: a comparison ofstatistical approaches. Am J Epidemiol 1998, 148(6):609-619.
26. US Life Tables. [http://www.cdc.gov/nchs/products/pubs/pubd/lftbls/life/1966.htm].
27. Hixson LJ, Fennerty MB, Sampliner RE, McGee D, Garewal H: Prospectivestudy of the frequency and size distribution of polyps missed bycolonoscopy. J Natl Cancer Inst 1990, 82(22):1769-1772.
28. Rex DK, Cutler CS, Lemmel GT, Rahmani EY, Clark DW, Helper DJ,Lehman GA, Mark DG: Colonoscopic miss rates of adenomas determinedby back-to-back colonoscopies. Gastroenterology 1997, 112(1):24-28.
29. van Rijn JC, Reitsma JB, Stoker J, Bossuyt PM, van Deventer SJ, Dekker E:Polyp miss rate determined by tandem colonoscopy: a systematicreview. Am J Gastroenterol 2006, 101(2):343-350.
30. Wilkins T, LeClaire B, Smolkin M, Davies K, Thomas A, Taylor ML, Stayer S:Screening colonoscopies by primary care physicians: A meta-analysis.Ann Fam Med 2009, 7:56-62.
31. Berger JO: Statistical decision theory and Bayesian analysis. New York:Springer-Verlag;, 2 1985.
32. Simpson EH: The Interpretation of Interaction in Contingency Tables.Journal of the Royal Statistical Society Series B - Methodological 1951,13(2):238-241.
33. Greenland S, Robins JM, Pearl J: Confounding and Collapsibility in CausalInference. Stat Sci 1999, 14(1):29-46.
34. Doubeni CA, Laiyemo AO, Reed G, Field TS, Fletcher RH: Socioeconomicand racial patterns of colorectal cancer screening among Medicareenrollees in 2000 to 2005. Cancer Epidemiol Biomarkers Prev 2009,18(8):2170-2175.
35. Jerant AF, Fenton JJ, Franks P: Determinants of racial/ethnic colorectalcancer screening disparities. Arch Intern Med 2008, 168(12):1317-1324.
36. Soneji S, Iyer SS, Armstrong K, Asch DA: Racial disparities in stage-specificcolorectal cancer mortality: 1960-2005. Am J Public Health 2010,100(10):1912-1916.
Pre-publication historyThe pre-publication history for this paper can be accessed here:http://www.biomedcentral.com/1472-6947/11/55/prepub
doi:10.1186/1472-6947-11-55Cite this article as: Rutter et al.: Evaluating risk factor assumptions: asimulation-based approach. BMC Medical Informatics and Decision Making2011 11:55.
Submit your next manuscript to BioMed Centraland take full advantage of:
• Convenient online submission
• Thorough peer review
• No space constraints or color figure charges
• Immediate publication on acceptance
• Inclusion in PubMed, CAS, Scopus and Google Scholar
• Research which is freely available for redistribution
Submit your manuscript at www.biomedcentral.com/submit
Rutter et al. BMC Medical Informatics and Decision Making 2011, 11:55http://www.biomedcentral.com/1472-6947/11/55
Page 9 of 9


