
European Small Business Finance Outlook
June 2015
Helmut Kraemer-Eis
Frank Lang
Salome Gvetadze
Working Paper 2015/28
EIF Research & Market Analysis
Helmut Kraemer-Eis heads EIF’s Research & Market Analysis.
Contact: [email protected]
Tel.: +352 248581 394
Frank Lang is Senior Manager in EIF’s Research & Market Analysis team.
Contact: [email protected]
Tel.: +352 248581 278
Salome Gvetadze is consultant to EIF’s Research & Market Analysis team.
Contact: [email protected]
Tel.: +352 248581 360
Editor
Helmut Kraemer-Eis, Head of EIF’s Research & Market Analysis
Contact:
European Investment Fund
37B, avenue J.F. Kennedy, L-2968 Luxembourg
Tel.: +352 248581 394
http://www.eif.org/news_centre/research/index.htm
Luxembourg, June 2015

Disclaimer:
This Working Paper should not be referred to as representing the views of the European Investment Fund
(EIF) or of the European Investment Bank Group (EIB Group). Any views expressed herein, including
interpretation(s) of regulations, reflect the current views of the author(s), which do not necessarily correspond
to the views of EIF or of the EIB Group. Views expressed herein may differ from views set out in other
documents, including similar research papers, published by EIF or by the EIB Group. Contents of this
Working Paper, including views expressed, are current at the date of publication set out above, and may
change without notice. No representation or warranty, express or implied, is or will be made and no liability
or responsibility is or will be accepted by EIF or by the EIB Group in respect of the accuracy or completeness
of the information contained herein and any such liability is expressly disclaimed. Nothing in this Working
Paper constitutes investment, legal, or tax advice, nor shall be relied upon as such advice. Specific
professional advice should always be sought separately before taking any action based on this Working
Paper. Reproduction, publication and reprint are subject to prior written authorisation of the authors.

4
Executive summary1
This European Small Business Finance Outlook (ESBFO) provides an overview of the main
markets relevant to EIF (equity2
, guarantees/securitisation, microfinance). It is an update of the
ESBFO December 2014.
We start by discussing the general market environment, then look at the main aspects of equity
finance and the guarantees/SME Securitisation (SMESec) market. Finally, before we conclude, we
briefly highlight important aspects of microfinance in Europe.
Market Environment:
Europe continues with an uneven and gradual recovery. GDP growth remains sluggish
and the labour market is still expected to register a double-digit unemployment rate.
Many of the business/climate indicators have started improving in 2014 and confidence
has increased. Bankruptcies decreased in Europe in 2014.
The ECB Bank Lending Survey shows that, on balance, the reporting euro area banks
have continued to ease their credit standards for SMEs.
According to the European Commission’s and the ECB’s latest ”Survey on the Access to
Finance of Enterprises” (SAFE), difficulties in accessing finance moved down from being
the fifth to the sixth most pressing problems for euro area SMEs compared to the previous
survey round.
Significant disparities in access to finance by country persist. In distressed countries, such
as Greece and Ireland but also in the Netherlands, access to finance is a very pressing
problem for SMEs, while in Germany or Austria only 7% of SMEs reported access to
finance as the most pressing problem.
The trend in lending to non-financial corporations (NFCs) in Europe has declined again. It
is not exactly measurable to what extent current weaknesses in bank lending to SMEs are
driven by demand- or by supply-side factors. However, even in countries where weak bank
lending is driven by the demand side, it is uncertain whether banks are able and/or willing
to provide the necessary lending once the demand increases. In an increasingly risk-
averse environment, the tendency not to lend to small and young firms is also increasing
further, as these are by nature more risky than their larger peers.
1
This paper benefited from comments and inputs by many EIF colleagues, for which we are very grateful;
we would like to express particular thanks to Juho Aminoff, Laurent Braun, Alicia Boudeau, Rémi Charrier,
Jacques Darcy, Nick Dunster, Per-Erik Eriksson, David González Martín, Ulrich Grabenwarter, Carsten
Just, Nicolas Koch, Eirini Koutra, Marco Natoli, George Passaris, Dario Prencipe, Simone Signore,
Alessandro Tappi, Aglaé Touchard-Le Drian, Piyush Unalkat, Arnaud Vanbellingen, and Thierry Wolff. We
would also like to thank colleagues from AECM, AFME, Bureau van Dijk Zephus, Coller Capital, EBAN,
the ECB, EMN, Euler Hermes, Eurochambres, the EVCA research team, Go4Venture Advisers, the IMF,
Leaseurope, the OECD, and the UEAPME study unit for their support. All errors are of the authors.
2
We are using the term “equity finance” to combine semantically the areas of Venture Capital and Private
Equity. However, if we refer here to equity activities, we only consider those of EIF’s investment focus,
which includes neither Leveraged Buyouts (LBOs) nor Public Equity. The reader is also referred to the
Private Equity glossary in Annex 1.
5
Private equity:
Following the severe crash of European private equity (PE) investment in 2008/2009, PE
had partially rebounded over 2010-2011. However, the recovery then suffered a setback
in 2012, but stayed well above the 2009 crisis trough.
Some of the gap left by the slump in VC investment after 2008 has been filled in by
business angel activity in recent years; their proximity to the market has been beneficial
during this difficult period.
In 2014, PE investment increased by 9%, compared to the year before, to EUR 41.6bn.
Strong positive growth rates of investments were recorded in the growth capital (+42.4%
to EUR 5.2bn) and the buyout segments (+6.7% to EUR 31.7bn) of the PE market.
Venture Capital (VC) investments increased by 4.2% to EUR 3.6bn. Within the VC market
segment, investments with a focus on the start-up (+4.1% to EUR 1.86bn) and later stage
(+5.9% to EUR 1.62bn) picked up, while seed investments (–16.5% to EUR 99.6m)
continued to decrease.
The considerable recovery of total European PE fundraising in 2013 has suffered a
setback in 2014; however, it still recorded the second largest amount since 2009. VC
fundraising also decreased in 2014. In general, its recovery has by far not been that
strong than what has been observed in the overall PE market over the last years.
The exit markets have remained remarkably robust in 2014. The strong increase in total
PE divestment activity in 2013 was followed by another record year in 2014; however,
divestments in the VC segment decreased.
Despite the recent positive developments, as mentioned above, PE and VC investment and
fundraising activity as well as the number of PE and VC funds are not much higher than
half the levels that were reached in the pre-crisis years. According to the EVCA figures,
government agencies accounted for 35% of total VC fundraising in 2014, thereby
continuing to support the market counter-cyclically in the current crisis.
EIF market insight shows a number of VC-backed companies in the early-stage segment
that show increasing revenues and are now achieving profitability, positioning them well
for sustained organic growth and ultimate strong returns for investors.
SME Guarantees / Securitisation:
Credit guarantees continue to be “the most widely used policy instrument […] to ease SME
access to finance” and to alleviate related market failures (OECD, 2015).
According to AECM statistics, Italy and France exhibit the largest volume and number of
outstanding SME guarantees. Related to GDP, Italy and Portugal have the largest markets.
For 2014, AECM data reports a strong increase in the number of guarantees outstanding
(incl. counter-guarantees) and a smaller increase in the total guarantee volume. Hence,
the average guarantee size, which had increased during the years 2009-2011, has
continued to follow a downward trend, probably due to a rise in guarantees with smaller
amounts, as well as of short-term guarantees (i.e. working capital loan and bridge
financing guarantees).

6
Lower guarantee amounts are, inter alia, caused by weak economic activity and public
budget cuts in some countries. Support from the European level can help to improve the
situation at least on the supply side. In this respect, several new initiatives have been
implemented, and others are under preparation.
SME securitisation (SMESec) can form an important element in the efforts to enhance
access to finance for SMEs in Europe.
The SMESec market is still suffering from the crisis, however, the overall issued volume of
SME deals in 2014 (EUR 33.3bn) was already significantly higher than in 2013 (+64%).
Despite the financial and sovereign crisis, the European securitisation market has
performed relatively well so far, with the SME segment showing low default rates.
The reputation of the SME securitisation market segment is continuously improving; a de-
stigmatisation is happening, and the general perception is shifting from one of “toxic
waste” to a means that could help overcome the negative effects of the crisis.
With regard to future /potential regulatory treatments of SMESec, a holistic view should be
taken and the impact of the “regulatory wave” duly analysed. The regulatory framework
should reflect the actual risks of SMESec. Strong but smart regulation is needed.
Transparency is a prerequisite for any structured transaction; the introduction of a properly
defined concept of “high quality securitisation” could add substantial information, and
such a definition should include SMESec transactions, as well as simple and transparent
synthetic structures.
The ECB’s support of the ABS market in general, and the SMESec market in particular, is
important. The ECB started its new Asset Backed Purchase Programme (ABSPP) in
November 2014. So far, the achieved volumes are not yet significant (i.e. compared to
the Covered Bond purchase programme).
Microfinance:
Microfinance is generally associated with social and economic objectives, and it is an
important financing channel for financial inclusion and job creation. However, the
European microfinance market is still young and heterogeneous, especially with regard to
the diversity of lending approaches. In a still risk-averse environment for credit allocation,
lending is expected to be allocated away from small and young firms, as they are more
risky than other SMEs.
According to the data from the latest ECB survey on the access to finance of SMEs in the
euro area, microenterprises have perceived an increase in the external financing gap
indicator. Moreover, the share of enterprises which see access to finance as their most
pressing problem remained bigger among microenterprises than among their larger
peers.
The latest EMN survey reports a remarkable growth both in the overall total value and the
number of microloans provided by the surveyed MFIs. With regard to future trends, MFIs
expect less public support in the coming years, due to public budget restrictions.

7
Table of contents
Executive summary ................................................................................................................................ 4
Table of contents .................................................................................................................................. 8
1 Introduction ................................................................................................................................... 8
2 Economic environment and insolvencies ............................................................................................ 9
3 Small business environment ........................................................................................................... 12
3.1 Importance of SMEs .................................................................................................................... 12
3.2 SME business climate .................................................................................................................. 14
3.3 Bank lending activity .................................................................................................................... 16
3.4 ECB interest rate statistics ............................................................................................................. 19
3.5 SMEs’ Access to finance ............................................................................................................... 20
4 Private equity ............................................................................................................................... 26
4.1 Investment activity ....................................................................................................................... 26
4.2 Fundraising activity ...................................................................................................................... 30
4.3 Divestment activity ....................................................................................................................... 34
4.4 Prospects .................................................................................................................................... 35
5 SME guarantees and SME Securitisation in Europe ............................................................................ 45
5.1 SME guarantees .......................................................................................................................... 45
5.2 SME Securitisation ....................................................................................................................... 55
5.2.1 Market activity .............................................................................................................. 56
5.2.2 SMESec performance trends .......................................................................................... 61
5.2.3 Prospects ..................................................................................................................... 64
6 Microfinance market ..................................................................................................................... 68
6.1 Microfinance business environment ............................................................................................... 68
6.2 Overall situation and demand-side perspectives ............................................................................. 69
6.2.1 Business environment and access to finance of microenterprises ....................................... 69
6.2.2 Necessity-driven business creation ................................................................................. 72
6.3 Supply side ................................................................................................................................. 76
6.4 Microfinance prospects ................................................................................................................ 77
7 Concluding remarks ..................................................................................................................... 80
ANNEX .............................................................................................................................................. 84
Annex 1: Private Equity Glossary .................................................................................................................. 84
Annex 2: Securitisation Glossary .................................................................................................................. 87
Annex 3: List of acronyms ............................................................................................................................ 88
References ......................................................................................................................................... 91
About … ............................................................................................................................................ 97
… the European Investment Fund .......................................................................................................... 97
… EIF’s Research & Market Analysis ...................................................................................................... 97
… this Working Paper series ................................................................................................................. 97
EIF Working Papers ............................................................................................................................. 98

8
1 Introduction
The European Investment Fund (EIF) is the European Investment Bank (EIB) Group’s specialist
provider of risk financing for entrepreneurship and innovation across Europe, delivering a full
spectrum of financing solutions through financial intermediaries (i.e. equity instruments, guarantee
and credit enhancement instruments, as well as microfinance). The following Figure 1 shows the
range of EIF’s activities:
Figure 1: EIF tool kit for SMEs
Source: EIF
The EIF focuses on the whole range of micro to medium-sized enterprises, starting from the pre-
seed, seed-, and start-up-phase (technology transfer, business angel financing, microfinance,
early stage VC) to the growth and development segment (formal VC funds, mezzanine funds,
portfolio guarantees/credit enhancement).
Against this background, the European Small Business Finance Outlook (ESBFO) provides an
overview of the main markets relevant to EIF (equity3
, guarantees/securitisation, microfinance).
The present edition is an update of the ESBFO December 2014.
We start by discussing the general market environment, then look at the main aspects of equity
finance and the SME guarantees, specifically the SME Securitisation (SMESec) markets. Finally, we
briefly highlight the important aspects of microfinance in Europe.
3
Please see footnote 2 concerning the term “equity finance”.
9
2 Economic environment and insolvencies
Since the publication of the previous ESBFO in December 2014, the global economic outlook has
remained broadly unchanged. The International Monetary Fund (IMF) has recently estimated 3.4%
as global growth for 2014 (like for 2013). For 2015 and 2016, the IMF expects slight increases
in global growth rates to 3.5% and 3.8% respectively. Compared to IMF’s previous projections
(October, 2014), the estimated growth rate has been increased by 0.1 percentage point for both
2013 and 2014 (IMF, 2015b).
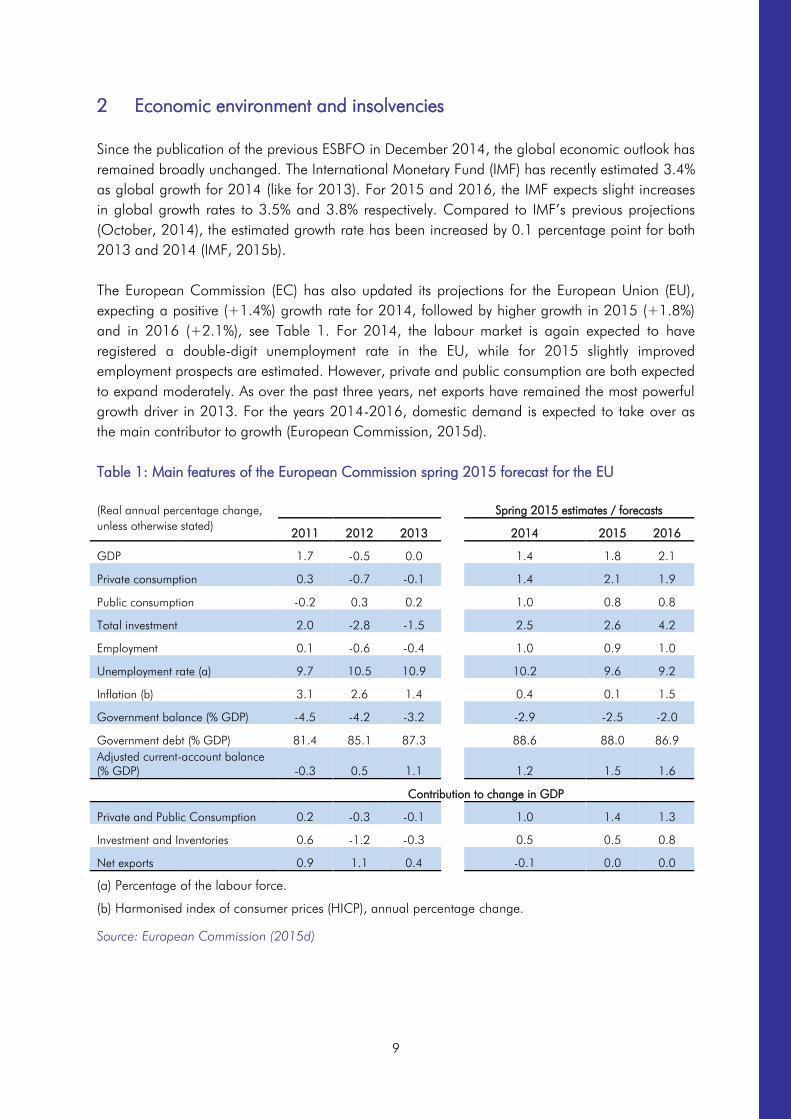
The European Commission (EC) has also updated its projections for the European Union (EU),
expecting a positive (+1.4%) growth rate for 2014, followed by higher growth in 2015 (+1.8%)
and in 2016 (+2.1%), see Table 1. For 2014, the labour market is again expected to have
registered a double-digit unemployment rate in the EU, while for 2015 slightly improved
employment prospects are estimated. However, private and public consumption are both expected
to expand moderately. As over the past three years, net exports have remained the most powerful
growth driver in 2013. For the years 2014-2016, domestic demand is expected to take over as
the main contributor to growth (European Commission, 2015d).
Table 1: Main features of the European Commission spring 2015 forecast for the EU
Source: European Commission (2015d)
(Real annual percentage change, Spring 2015 estimates / forecasts
unless otherwise stated)
2011 2012 2013 2014 2015 2016
GDP 1.7 -0.5 0.0 1.4 1.8 2.1
Private consumption 0.3 -0.7 -0.1 1.4 2.1 1.9
Public consumption -0.2 0.3 0.2 1.0 0.8 0.8
Total investment 2.0 -2.8 -1.5 2.5 2.6 4.2
Employment 0.1 -0.6 -0.4 1.0 0.9 1.0
Unemployment rate (a) 9.7 10.5 10.9 10.2 9.6 9.2
Inflation (b) 3.1 2.6 1.4 0.4 0.1 1.5
Government balance (% GDP) -4.5 -4.2 -3.2 -2.9 -2.5 -2.0
Government debt (% GDP) 81.4 85.1 87.3 88.6 88.0 86.9
Adjusted current-account balance
(% GDP) -0.3 0.5 1.1 1.2 1.5 1.6
Contribution to change in GDP
Private and Public Consumption 0.2 -0.3 -0.1 1.0 1.4 1.3
Investment and Inventories 0.6 -1.2 -0.3 0.5 0.5 0.8
Net exports 0.9 1.1 0.4 -0.1 0.0 0.0
(a) Percentage of the labour force.
(b) Harmonised index of consumer prices (HICP), annual percentage change.
10
The recent results of the European Commission economic sentiment indicator (ESI) remained
broadly stable for both, the EU and the euro area. The Business Climate Indicator (BCI) for the
euro area has slightly decreased (European Commission, 2015b and 2015c).
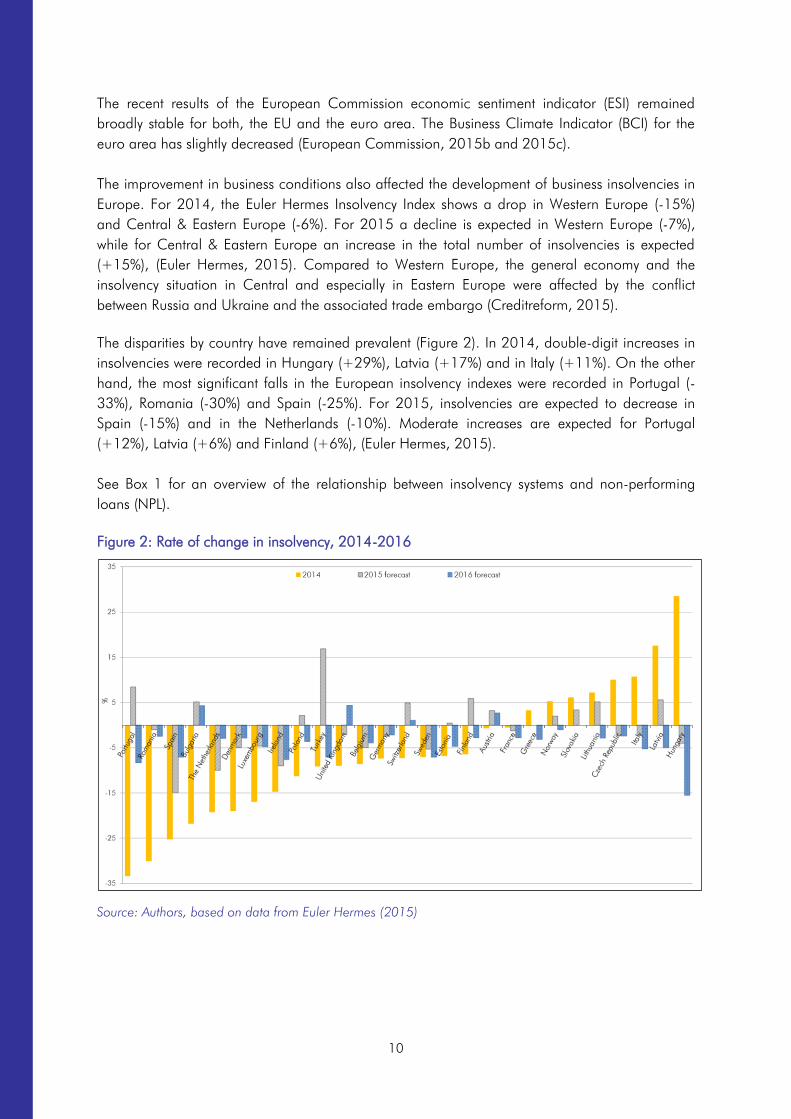
The improvement in business conditions also affected the development of business insolvencies in
Europe. For 2014, the Euler Hermes Insolvency Index shows a drop in Western Europe (-15%)
and Central & Eastern Europe (-6%). For 2015 a decline is expected in Western Europe (-7%),
while for Central & Eastern Europe an increase in the total number of insolvencies is expected
(+15%), (Euler Hermes, 2015). Compared to Western Europe, the general economy and the
insolvency situation in Central and especially in Eastern Europe were affected by the conflict
between Russia and Ukraine and the associated trade embargo (Creditreform, 2015).
The disparities by country have remained prevalent (Figure 2). In 2014, double-digit increases in
insolvencies were recorded in Hungary (+29%), Latvia (+17%) and in Italy (+11%). On the other
hand, the most significant falls in the European insolvency indexes were recorded in Portugal (-
33%), Romania (-30%) and Spain (-25%). For 2015, insolvencies are expected to decrease in
Spain (-15%) and in the Netherlands (-10%). Moderate increases are expected for Portugal
(+12%), Latvia (+6%) and Finland (+6%), (Euler Hermes, 2015).
See Box 1 for an overview of the relationship between insolvency systems and non-performing
loans (NPL).
Figure 2: Rate of change in insolvency, 2014-2016
Source: Authors, based on data from Euler Hermes (2015)

11
Box 1: Non-performing loans and insolvency systems as impediments to SME lending
High levels of non-performing loans in many European countries have a negative impact on bank
lending, and subsequently on economic growth.4
According to EIB (2014), the stock of NPLs
amounts to around EUR 800m in the Euro area and it has more than doubled since 2009, in
particular in crisis hit countries, e.g. in Cyprus, NPLs make up around 50% of total gross loans, in
Greece this value is around 34%.
Adequate insolvency frameworks are important in order to ensure an efficient management of
NPLs. The World Bank “Doing Business” data confirms that for countries, that score well on their
insolvency framework index, have higher levels of credit provided to the private sector by domestic
financial institutions (World Bank, 2014). The EU and many Member States have undertaken steps
to improve the situation (i.e. in the areas of insolvency reforms, banking supervision, debt
restructuring, or direct government support to assist debt-distressed SMEs). However, according to
the IMF, insolvency systems and out-of-court workout frameworks in Europe are still not sufficiently
tailored to the needs in the SME space (Bergthaler et al., 2015).
Figure 3 shows that time and cost to resolve insolvency processes vary significantly between
Member States. According to the data from the World Bank, clear outlier in terms of cost of
insolvency processes5
is Italy, followed by the Slovak Republic and the Czech Republic.
Concerning the time to resolve insolvencies, it takes the longest in the Slovak Republic, Greece,
and Bulgaria (World Bank, 2014).
Figure 3: Time and cost to resolve insolvencies in EU Member States
Source: Authors, based on “Doing Business 2015” (World Bank, 2014)
4
See for an analysis of NPLs and their impact on SME lending and financial stability: OECD (2015) pages
69ff.
5
The cost required to cover debt is measured as percentage of estate value; it includes court fees, fees of
insolvency administrators, lawyers’ fees, assessors’ and auctioneers’ fees and other related fees (for details
and methodology please see Word Bank (2014)).

12
Box 1 continued:
Increasing banks’ ability to resolve or dispose non-performing loans can improve their lending
capacity. The IMF encourages a comprehensive strategy covering a broad spectrum of reforms to
accelerate restructuring and resolution, in particular tighter regulation of banks’ NPL
management, insolvency reforms to improve the efficiency of SME restructuring, a greater push for
out-of-court workouts, and supportive macro and financial policies. The incentives for
restructuring should be strengthened, and moral hazard issues should be addressed by ensuring
speedy exits of non-viable SMEs (see Bergthaler et al., 2015). Moreover, the further development
of markets for NPLs can form part of the solution.
3 Small business environment
3.1 Importance of SMEs
SMEs are defined by the European Commission as having fewer than 250 employees. They
should also have an annual turnover of up to EUR 50m, or a balance sheet total of no more than
EUR 43m (Commission Recommendation of 6 May 2003), see Table 2.
Table 2: EU definition of SMEs
Enterprise category Employees Turnover Balance sheet total
Micro <10 ≤ EUR 2m ≤ EUR 2m
Small <50 ≤ EUR 10m ≤ EUR 10m
Medium-sized <250 ≤ EUR 50m ≤ EUR 43m
Source: European commission (2014a)
Small and medium-sized enterprises are often called the backbone of the European economy,
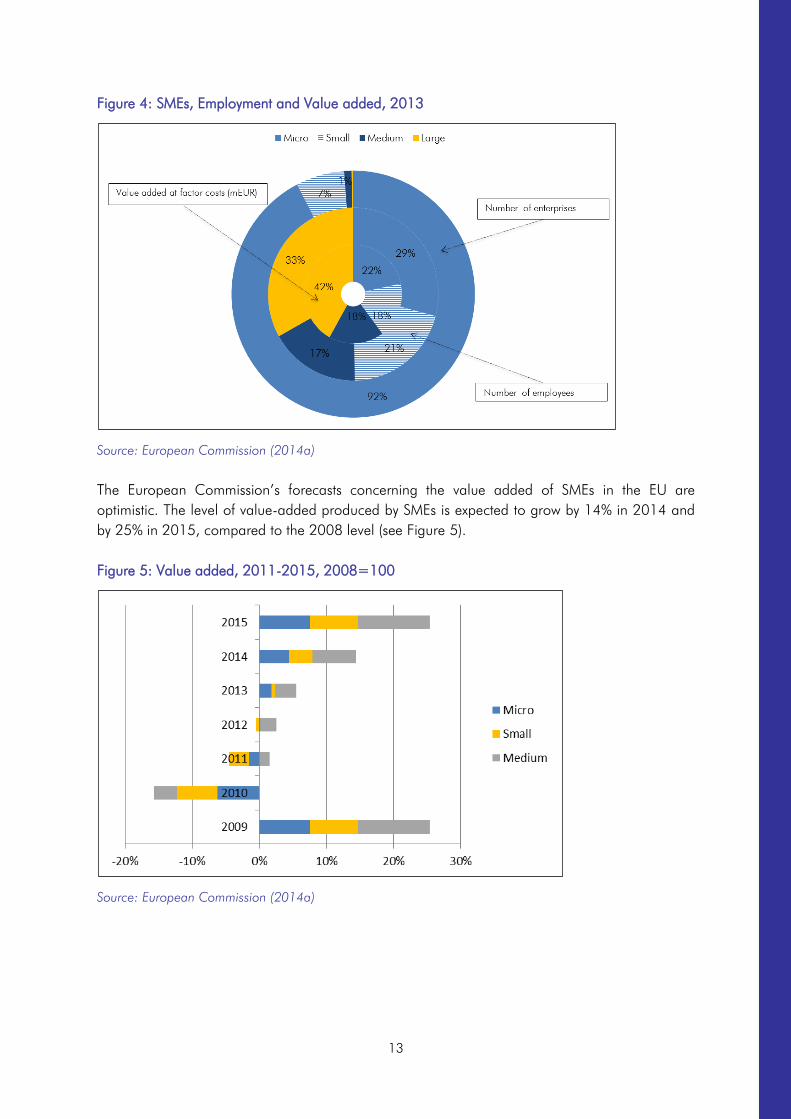
contributing to job creation and economic growth. In 2013, more than 21.5m of SMEs in the
European Union made for 99.8% of all non-financial enterprises, employed 88.8m people
(66.9% of the total employment), and generated 58.1% of total added value (see Figure 4).6
6
Gross value added is the difference between output and intermediate consumption. As an aggregate
measure of production, GDP is equal to the sum of the gross value added of all resident institutional units
(i.e. industries) engaged in production, plus any taxes and minus any subsidies, on products not included
in the value of their outputs.
http://epp.eurostat.ec.europa.eu/statistics_explained/index.php/Category:Glossary
13
Figure 4: SMEs, Employment and Value added, 2013
Source: European Commission (2014a)
The European Commission’s forecasts concerning the value added of SMEs in the EU are
optimistic. The level of value-added produced by SMEs is expected to grow by 14% in 2014 and
by 25% in 2015, compared to the 2008 level (see Figure 5).
Figure 5: Value added, 2011-2015, 2008=100
Source: European Commission (2014a)

14
3.2 SME business climate
The financial, debt and economic crisis had dramatically worsened the business environment of
European SMEs since 2008, and in particular in those countries that had suffered the most of the
crisis. However, in the recent past, some changes to the better have become visible, and SMEs’
business climate - as analysed by UEAPME (UEAPME Study Unit, 2015) - has improved again.
Significant progress was, inter alia, observed in the countries of the south/the periphery (Croatia,
Cyprus, Greece, Ireland, Italy, Malta, Portugal, Slovenia and Spain). The SME Business Climate
Index for these countries increased by 5.1 percentage points in the first half-year of 2015 (see
Figure 6), which contrasts the 1.4 percentage point decrease in the countries of the north and the
centre (Austria, Belgium, Bulgaria, Czech Republic, Denmark, Estonia, Finland, France, Germany,
Hungary, Latvia, Lithuania, Luxembourg, Netherlands, Poland, Romania, Slovakia, Sweden and
UK). As a result, the imbalance between the two diverse country groups has diminished even
more, with the current gap equal to 5.3 percentage points, compared to 11.8 percentage points
in the second half-year of 2014. The EU-wide index still stands above the neutral level. However a
small number of enterprises reported a positive business trend and a relatively large number of
business indicated neutral results, “which proves that Europe’s SMEs are more in a wait and see
mode than in a growth one” (UEAPME Study Unit, 2015).
Figure 6: SME Business Climate Index7
Source: Authors, based on UEAPME Study Unit (2015)
7
The UEAPME SME Business Climate Index is calculated as the average of the current situation and the
expectations for the next period resulting from the sum of positive and neutral (meaning: no change)
answers as regards the overall situation for the business. For example, for “semester A” with 25% positive,
neutral 55%, and 20% negative answers, the Index would be (25 + 55 =) 80 and for “semester B” with
40% positive, 30% neutral, and 30% negative answers it would fall to (40 + 30 =) 70. However, the
respective balances of positive minus negative answers would show an opposite result growing from
“semester A” (25 – 20 =) 5% to “semester B” (40 – 30 =) 10%. Therefore, these balances should also be
examined and are reported in UEAPME’s EU Craft and SME Barometer.

15
Figure 7 shows the balance of “positive minus negative” answers reported by European SMEs,
according to UEAPME Study Unit (2015), with reference to situation, turnover, employment,
prices, investments and orders on a semi-annual base, starting from the second half-year 2010,
with the last column being expectations for the first half-year of 2015. Specifically, for the first half
of 2015, all business indicators, except prices, are on balance expected to decrease.
Figure 7: Main Results of the EU Craft and SME Barometer HY1/20158
Source: Authors, based on data from UEAPME Study Unit (2015)
The balance between the expectations and the final results for the second half of 2014 is shown in
Figure 8. The indicator results for the second half-year of 2014 were significantly worse than
expected The biggest difference was observed in the orders for which the balance of expectations
(3.9%) contrasts significantly with the balance of the actual reported results (-8.3%); see UEAPME
Study Unit (2015).
The results of the recent Eurochambres (2015) Economic Survey9
point in a similar direction.
According to this study, all economic indicators, including business confidence, show a clear
improvement in outcomes in 2014. Improvements are expected for 2015, but at a slower pace.
8
The EU Craft and SME Barometer builds on the results of surveys that are conducted by UEAPME member
organisations two to four times a year in different regions all over Europe. The 2015/HY1 results are
based on about 120,000 questionnaires, with 30,000 answers received. The data for the most recent
survey were collected between December 2014 and February 2015. The balanced figures mentioned in
the text show the difference between positive and negative answers, with national results weighted by
number of employees. The surveyed categories include overall situation, turnover, employment, prices,
investment, and orders. For details see UEAPME Study Unit (2015).
9
The Eurochambres Economic Survey is a European qualitative survey of business expectations for the year
ahead. Conducted annually by the Chambers of Commerce and Industry, and coordinated by
Eurochambres, the survey records the expectations of approximately 60,000 businesses in EU Member
States and EU Candidate Countries on six economic indicators: business confidence, domestic sales,
export sales, employment & investment. The Eurochambres Economic Survey has been conducted since
1993. For details on the methodology see Eurochambres (2015).

16
Despite the general positive expectations for 2015, great disparities in business confidence by
country persist. Portugal, Latvia and Spain are the most optimistic for the year ahead. The highest
level of pessimism was observed in Austria and in Slovakia.
Figure 8: Expectations of SMEs and real outcome for HY2/2014
Source: Authors, based on data from UEAPME Study Unit (2015)
3.3 Bank lending activity
According to ECB data, the trend in lending to non-financial corporations (NFCs) in Europe has
been declining since 2009 and still has to bottom out (see Figure 9). Compared to the peak of
EUR 4.6tr reached at the beginning of 2009, the volume of outstanding loans has decreased by
11.5% to EUR 4.1tr in the Euro area in March 201510
.
10
SME loan data do not exist at the European level. With respect to financing cost for SMEs, Huerga et al.
(2012) suggest that interest rates charged on small loans to NFCs (up to and including EUR 0.25m) could
be used as a proxy. Even if new business volumes are also reported for small loans, the time series
contains data going back only to June 2010. A longer history (back to 2003) exists for the size-class
differentiation between loans to NFCs up to, and including, EUR 1m, and loans over EUR 1m. Looking at
moving averages of the preceding 12 months, loans ≤ EUR 1m grew relatively steadily and reached their
peak in April 2008 at EUR 86bn, which was 25% larger than by end-2003. Loans > EUR 1m grew for
one year longer and peaked in April 2009 at EUR 276bn, which was 81% larger than by end-2003.
Following their respective peaks, loans of both size-classes decreased continuously until June 2013, by
36% for loans ≤ EUR 1m and by 42% for loans > EUR 1m. While loans ≤ EUR 1m are today 20% below
their 2003 levels, loans > EUR 1m are still 6% above the corresponding level. This particularly reflects the
strong differences between the pre-crisis growths of both loan-size classes. However, it is questionable if
the growth in loans to NFCs of ≤ EUR 1m can be taken as a proxy for the development of SME loans. For
example, since 2011, loans to NFCs ≤ EUR 0.25m have decreased by 13%, while loans to NFCs ≤ EUR
1m (as well as loans to NFCs > EUR 1m) have (both) decreased by only 10%.

17
Figure 9: Outstanding Loans to Non-Financial Corporations in the Euro Area
Source: Authors, based on data from ECB
The current status of bank lending has also been analysed in the ECB’s latest Bank Lending Survey
(BLS, see ECB, 2015b)11
: the net tightening of credit standards in the first quarter of 2015 still
stands below its historical averages. Moreover, on balance, the reporting euro area banks have
continued to ease their credit standards to non-financial corporations (NFCs). The survey shows
that a net 9% of banks reported an easing in Q1/2015 (compared to 5% in the previous quarter).
This is the fourth time in a row that banks reported, on balance, a net easing of credit standards,
following the continuous net tightening that had been observed since 2007.12
As shown in Figure
10, banks continued reporting a net easing of credit standards for SMEs (-7%, in Q4/2014 and -
9% in Q1/2015), where the negative number indicates that the net percentages of banks
contributed to an easing of credit standards (ECB, 2015b). According to the BLS, the credit
standards improved, on balance, for both short-term and long-term loans.
11
This survey was conducted on 142 euro area banks and reports changes during the first quarter of 2015
(Q1/2015) and expectations of changes in the second quarter of 2015 (Q2/2015).
12
Text and diagram refer to net percentages of banks contributing to tightening standards (the difference
between the sum of the percentages of banks responding “tightened considerably” and “tightened
somewhat”, and the sum of the percentages of banks responding “eased somewhat” and “eased
considerably”).

18
Figure 10: Changes in credit standards applied to the approval of loans or credit lines to
enterprises (SMEs versus large enterprises)
Source: Authors, based on data from ECB (2015b)
In Q1/2015, in net terms, all the factors including the costs related to bank's capital position and
the expectations concerning the industry (or firm) specific outlook, contributed to the easing of
credit standards for SMEs (with the exception of risk on the collateral demanded, which had a
negative impact on the net easing of credit standards), see Figure 11. The net share of rejected
applications for loans to enterprises decreased (-5%) in Q1/2015 according to the banks (ECB,
2015b).
Positive signs have also been observed in the demand for bank lending. According to the
reporting banks of the ECB’s Bank Lending Survey, net demand for loans to NFCs continued to be
positive and recovered further in Q1/2015 (6%, and 18% in Q4/2014) remaining levels above its
historical average. This was mainly driven by the low general level of interest rates in all large
euro area countries. Concerning the projections for Q2/2015, banks expect a significant increase
in demand (for all categories of loans), (ECB, 2015b).

19
Figure 11: Factors contributing to tightening credit standards for SMEs13
Source: Authors, based on data from ECB (2015b)
*Note: “Bank’s risk tolerance” was introduced to BLS question nr. 2 in the previous survey.
3.4 ECB interest rate statistics
The interest rate statistics for monetary financial institutions, published by the ECB, provide
information about the interest rates and volumes for different size classes of new euro-
denominated loans. Since June 2011, the former category of loans (of up to EUR 1m) to the euro
area, extended to non-financial corporations, is divided into two sub-categories. One category
includes loans up to and including EUR 0.25m, and the other loans over EUR 0.25m and up to
EUR 1m.
Loans of amounts over EUR 0.25m up to EUR 1m (medium-size loans) had a rather stable spread
over loans of more than EUR 1m (large loans), averaging 64 basis points (bp) over the period
from June 2010 to April 2015 (see Figure 12). In contrast, the interest rate spread between loans
of up to EUR 0.25m (small loans) and large loans was higher, but relatively stable at an average
level of 145bp from the start of the time series in June 2010 until July 2011. In the following
months, this spread had showed an increasing trend until August 2012 when it reached a record
high of 279bp. Afterwards, the spread had been rather stable until August 2014, averaging
249bp. Since then, the spread has significantly come down, i.e. to 186bp in April 2015.
Overall financing costs for euro area MFIs have continued to fall across most external financing
sources. The aggregate improvement in financing conditions was driven by improving financial
13
The net percentages for responses to questions related to the factors are defined as the difference between
the percentage of banks reporting that the given factor contributed to a tightening and the percentage
reporting that it contributed to an easing.

20
market conditions and a better economic growth outlook. However, the difference between the
loan pricing conditions for small and large firms remained high in more vulnerable countries,
where SMEs remained more dependent on bank funding (ECB, 2015c).
Figure 12: Evolution of monetary financial institutions interest rates on new loans to non-
financial corporations14
Sources: Authors, based on Huerga et al. (2012), ECB (2015d), ECB SDW, and own calculations
3.5 SMEs’ Access to finance
According to the ECB latest Survey on the Access to Finance of Enterprises (SAFE), covering
October 2014 to March 2015 (European Commission, 2014b and ECB, 2015a)15
, access to
finance moved from the fifth to the sixth most pressing problem for euro area SMEs compared to
the previous survey round. The percentage of companies that mention access to finance as their
most pressing problem has dropped to a level of 11% (from 13%), see Figure 13.
14
New loans to non-financial corporations, with floating rate and up to three-month initial rate fixation by
loan size, and new loans to sole proprietors (percentages per annum excluding charges; period averages).
The series about new loans to “sole proprietors” have an initial rate fixation period of up to one year, and
not up to three-months, as the rest of the series used in the graph, because data for lower rates of
fixations are not collected.
15
The European Commission and the European Central Bank decided in 2008 to collaborate on a survey
on the access to finance of enterprises in the European Union, and they established The Survey on the
Access to Finance of Enterprises (SAFE). SAFE ECB waves are run every 6 months, covering the Euro area
countries. The SAFE Commission waves are published every year, covering all EU countries and other
countries participating in the Entrepreneurship and Innovation Programme of the CIP.

21
Unsurprisingly, the divergence across the countries remained large. On the high side, 34% of the
SMEs in Greece, 15% in Ireland and in the Netherlands, mentioned ‘access to finance’ as the
most pressing problem, compared with around 7% of the SMEs in Germany and in Austria on the
low side. ‘Finding customers’ remained the most frequently mentioned concern (ECB, 2015a).
Figure 13: The most pressing problem SMEs are facing
Source: Authors, based on SAFE, ECB (2015a), Statistical Data Warehouse
Looking at the most popular sources of debt financing for SMEs, the latest ECB survey (ECB,
2015a) identified bank products (bank overdraft, bank loans) as the most popular instrument (see
Figure 14).
Figure 14: Sources of external financing of euro area SMEs
(over the preceding six months; percentage of respondent SMEs)
Source: Authors, based on ECB (2015a), Statistical Data Warehouse
22
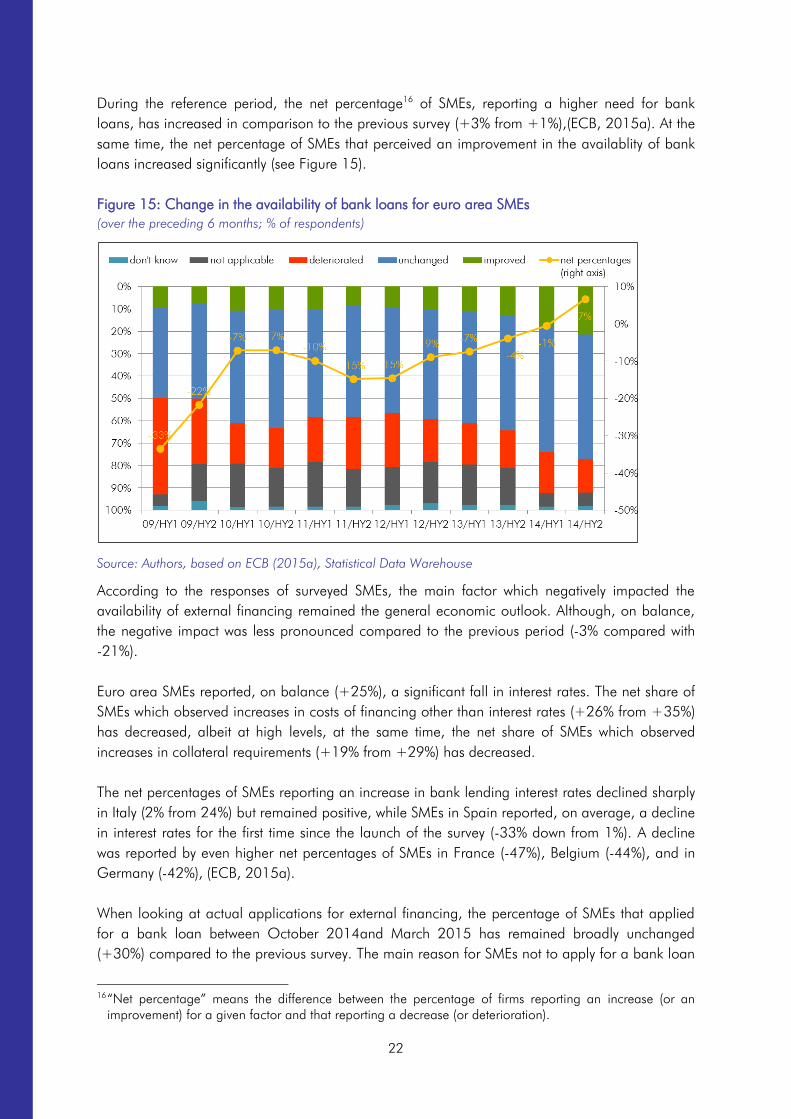
During the reference period, the net percentage16
of SMEs, reporting a higher need for bank
loans, has increased in comparison to the previous survey (+3% from +1%),(ECB, 2015a). At the
same time, the net percentage of SMEs that perceived an improvement in the availablity of bank
loans increased significantly (see Figure 15).
Figure 15: Change in the availability of bank loans for euro area SMEs
(over the preceding 6 months; % of respondents)
Source: Authors, based on ECB (2015a), Statistical Data Warehouse
According to the responses of surveyed SMEs, the main factor which negatively impacted the
availability of external financing remained the general economic outlook. Although, on balance,
the negative impact was less pronounced compared to the previous period (-3% compared with
-21%).
Euro area SMEs reported, on balance (+25%), a significant fall in interest rates. The net share of
SMEs which observed increases in costs of financing other than interest rates (+26% from +35%)
has decreased, albeit at high levels, at the same time, the net share of SMEs which observed
increases in collateral requirements (+19% from +29%) has decreased.
The net percentages of SMEs reporting an increase in bank lending interest rates declined sharply
in Italy (2% from 24%) but remained positive, while SMEs in Spain reported, on average, a decline
in interest rates for the first time since the launch of the survey (-33% down from 1%). A decline
was reported by even higher net percentages of SMEs in France (-47%), Belgium (-44%), and in
Germany (-42%), (ECB, 2015a).
When looking at actual applications for external financing, the percentage of SMEs that applied
for a bank loan between October 2014and March 2015 has remained broadly unchanged
(+30%) compared to the previous survey. The main reason for SMEs not to apply for a bank loan
16
“Net percentage” means the difference between the percentage of firms reporting an increase (or an
improvement) for a given factor and that reporting a decrease (or deterioration).

23
still remains the availability of sufficient internal funds followed by fear of rejection (discouraged
borrowers). The success rates of actual loan applications by SMEs have increased compared to
the previous survey. 64% of the euro area SMEs reported that they had received the full requested
amount (compared to 59% in the previous round). SMEs continued to report a higher rejection
rate than large firms (+8% versus +2%).
Looking ahead, and on balance, the euro area SMEs expect a significant improvement in the
availability of bank loans and bank overdrafts (11%, compared with 0%). In addition, SMEs expect
an increase in the availability of internal funds.
Based on the SAFE data (demand-side data) a composite indicator on perceived changes in the
needs and availability of external financing of firms can be calculated17
: There are also disparities
in the perception of external financing gaps across countries. At country level, Germany, Spain,
Ireland and Portugal reported negative net balances (i.e. decreasing mismatch between financing
needs and availability). The other countries reported positive net balances but with a clearly
declining trend, except Greece, which perceived an increasing trend. The overall gap indicator for
SMEs, decreased to zero (from 3% in the previous survey round), (ECB, 2015a), (Figure 16).
Figure 16: Perceived change in the external financing gap (by country)
Source: Authors, based on ECB (2015a), Statistical Data Warehouse
17
For each of the five financing instruments (bank loans, trade credit, equity, debt securities, bank overdraft),
an indicator change in a perceived financing gap takes the value of 1 (-1) if the need increases
(decreases) and availability decreases (increases). If firms perceive only a one-sided increase (decrease) in
the financing gap, the variable is assigned a value of 0.5 (-0.5). The composite indicator is the weighted
average of the financing gap related to the five instruments. A positive value of the indicator suggests an
increasing financing gap. Values are multiplied by 100 to obtain weighted net balances in percentages.

24
The ECB’s Bank Lending Survey (BLS) data allows us to calculate the gap from the supply side
(albeit only for bank loans) and compare it to the gap from the demand side (the SAFE). The BLS
bank lending gap is defined as the difference between the net percentage of banks reporting an
increase in the demand for bank loans and the net percentage of banks reporting an easing in
credit standards. In 2010 and in 2011 the perceived gaps in bank loans reported by the firms
were in line with the gaps reported by the banks in the BLS (see Figure 17).
In 2012 and 2013, a mismatch in perceptions has been observed: on balance, SMEs perceived
increasing gaps, while banks mostly perceived no changes in the gaps. In 2014 the perceived
gaps in bank loans reported by the firms were again closer to the gaps perceived by the banks.
Figure 17: Perceived change in the external financing gap, reported by borrowers and lenders18
Note: Weighted net balance for enterprises and net percentage for banks. The number of banks responding
to questions about all enterprises is different from the number of banks responding to questions about large
enterprises or SMEs. Hence, the bank lending gap line for “all” does not necessarily lie between the lines for
“SMEs” and “Large”
Source: Authors, based on SAFE, BLS and own calculations
In cooperation with EIF RMA, Ilges (2015) analysed the interaction between the supply and the
demand side in bank lending. We present key parts of this work in Box 2 below.
Box 2: Corporate lending and Financing Gap over the Business Cycle
In the aftermath of the recent economic and financial crisis, credit tightening has hit SMEs the
hardest. A prevailing theory for such phenomenon is SMEs’ typical lack of collateral, increasing
their vulnerability to credit cycles (Kiyotaki and Moore, 1997). Moreover, SMEs’ high risk profile,
and particularly the lack of credit history of young enterprises, is a driver of bank’s strategic credit
rationing (see chapter 5.1 for a more detailed elaboration)
18
On this figure the distinction between large enterprises and SMEs is based on annual sales as defined by
the BLS.
25
Box 2 continued:
However, a crucial challenge for policy-makers and researcher remains the disentangling of
demand-driven and supply-driven determinants, in order to assess how the two different sides
react to changes in the macroeconomic environment.
Against this background, the recent work of Ilges (2015)19
builds and expands on the previous
efforts of Holton et al. (2012), in combining demand-side micro-data on SMEs from the ECB
SAFE with supply-side information from the ECB Bank Lending Survey (BLS) as well as country-
and year-specific macroeconomic data. The panel, comprising semester data in 11 EU countries
from 2009 to 2014, was thus employed in an analysis of the relationships between a) fluctuations
in the macroeconomic environment and SMEs’ access to finance conditions, and b) supply- and
demand-side shifts. The multivariate regression setting also allows controlling for firm-specific
characteristics.
A wide range of empirical evidence stands out, where the most striking result relates to the high
degree of financial fragmentation measured across EU countries in terms of SMEs access to
finance: ceteris paribus, SMEs from EU peripheral countries were found to be significantly more
credit-constrained than core countries’ SMEs, albeit with some noteworthy exceptions (e.g. the
Netherlands).
At the macro level, the study is in line with its predecessor in highlighting a positive relationship
between higher GDP growth and enhanced SMEs’ access to credit. Moreover, a higher degree of
private investments is also positively linked to more favourable access to finance conditions.
Conversely, an increase in sovereign bond yields (proxy for interest rates level) shows a strong
negative correlation with SMEs access to credit. With respect to private debt-to-GDP ratio, the
study confirms previous findings of a negative relationship with SMEs’ access to finance, mostly
through credit supply factors. However, an interesting result is that higher government debt levels
are not necessarily related to a worsening SMEs’ access to finance. In fact, the relationship
between these two variables is positive, albeit very small in magnitude.
In all, the behaviour of banks plays an expectedly significant role in small-medium firms lending
dynamics. In particular, the study finds that a net tightening of credit standards is a significant
predictor of firms’ reported interest rates increases and loan availability deterioration, but not of
loan rejection rates. This could imply that banks’ decision to be more selective when granting
loans affects lending conditions and the perception of firms more than actual rejection rates.
In the following chapters we are going to analyse specific market segments of external SME
financing (i.e. private equity and venture capital, SME guarantees and securitisation, and
microfinance).
19
Thesis prepared by in cooperation with EIF RMA in fulfilment of the “Business Administration” M.Sc. at the
University of Trier; this text box was prepared by Ricardo Ilges; the project and the box benefitted from
significant input from Simone Signore and Dario Prencipe.

26
4 Private equity
4.1 Investment activity
Box 3: Introductory information on EVCA data
In this chapter, numbers, diagrams and statements are to a large extent built on statistics from the
European Private Equity & Venture Capital Association (EVCA), and we would like to thank our
colleagues from the EVCA research team for their support.
Please do also note that EVCA private equity (PE) statistics do not include infrastructure funds, real
estate funds, distressed debt funds, primary funds-of-funds, secondary funds-of-funds and PE/VC-
type activities that are not conducted by PE funds. This means that the activities of business angels
and hedge funds as well as corporate acquisitions outside of dedicated corporate venture
programmes are not included in the statistics. EVCA statistics can differ from the numbers reported
by other data providers for the reasons just mentioned and due to, e.g., different definitions and
interpretations of the PE fund and investment stages and geographical definitions (e.g. of
“Europe”). See, also for more details, EVCA (2014) and (2015a) and the EVCA website
(www.evca.eu).
Following the severe crash of European private equity (PE) investment in 2008/2009, PE had
partially rebounded over 2010-2011. However, the recovery then suffered a setback in 2012, but
stayed well above the 2009 crisis trough. In 2014, PE investment increased by 9%, compared to
the year before, to EUR 41.6bn (see Figure 18). The number of companies that benefited from PE
investment increased by 7.5% to 5,728. In terms of amounts invested, strong positive growth rates
were recorded in the growth capital (+42.4% to EUR 5.2bn) and the buyout segments (+6.7% to
EUR 31.7bn) of the PE market. Venture Capital (VC) investments increased by 4.2% to EUR 3.6bn.
(Please note that the market segment Business Angels is not included in the EVCA statistics; see
Box 3. As business angel financing is important for the financing of SMEs and innovation, we
present more information in Box 4).
Within the VC market segment, investments with a focus on the start-up (+4.1% to EUR 1.86bn)
and later stage (+5.9% to EUR 1.62bn) increased, while seed investments (–16.5% to EUR
99.6m) continued to decrease (see Figure 19).

27
Figure 18: Investment activity by private equity firms located in Europe20
*EVCA changed the data provider with effect from 2007 on. Since then, EVCA PE activity statistics are based on data from PEREP Analytics.
Source: Authors, based on data from EVCA.
Figure 19: Venture Capital investment activity evolution in Europe
Source: Authors, based on data from EVCA.
These developments were at least partially driven by the improvement in the general economic
situation, from which private equity – and in particular the buyout sector being the biggest
segment of the market – has benefited.
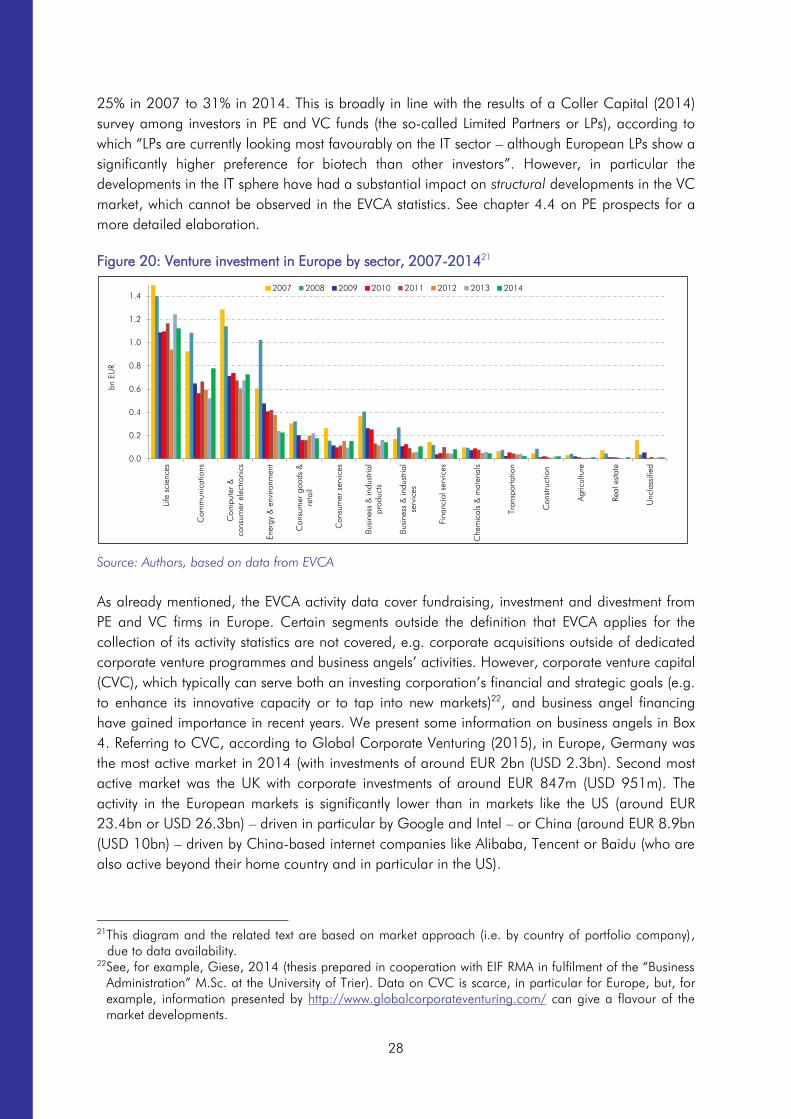
Recent developments in venture investment by sector are shown in Figure 20. In the EVCA
statistics, the relative importance of sectors shows certain stability over time: life sciences,
communications and computer/consumer electronics remained by far the most relevant industries
for venture investment. The share of life science in total VC investment activity even increased from
20
The EVCA figures mentioned in this chapter show investment activity by PE firms located in Europe
(“industry approach” or “office approach”). All investment figures are equity value, i.e. excluding leverage.
28
25% in 2007 to 31% in 2014. This is broadly in line with the results of a Coller Capital (2014)
survey among investors in PE and VC funds (the so-called Limited Partners or LPs), according to
which “LPs are currently looking most favourably on the IT sector – although European LPs show a
significantly higher preference for biotech than other investors”. However, in particular the
developments in the IT sphere have had a substantial impact on structural developments in the VC
market, which cannot be observed in the EVCA statistics. See chapter 4.4 on PE prospects for a
more detailed elaboration.
Figure 20: Venture investment in Europe by sector, 2007-201421
Source: Authors, based on data from EVCA
As already mentioned, the EVCA activity data cover fundraising, investment and divestment from
PE and VC firms in Europe. Certain segments outside the definition that EVCA applies for the
collection of its activity statistics are not covered, e.g. corporate acquisitions outside of dedicated
corporate venture programmes and business angels’ activities. However, corporate venture capital
(CVC), which typically can serve both an investing corporation’s financial and strategic goals (e.g.
to enhance its innovative capacity or to tap into new markets)22
, and business angel financing
have gained importance in recent years. We present some information on business angels in Box
4. Referring to CVC, according to Global Corporate Venturing (2015), in Europe, Germany was
the most active market in 2014 (with investments of around EUR 2bn (USD 2.3bn). Second most
active market was the UK with corporate investments of around EUR 847m (USD 951m). The
activity in the European markets is significantly lower than in markets like the US (around EUR
23.4bn or USD 26.3bn) – driven in particular by Google and Intel – or China (around EUR 8.9bn
(USD 10bn) – driven by China-based internet companies like Alibaba, Tencent or Baidu (who are
also active beyond their home country and in particular in the US).
21
This diagram and the related text are based on market approach (i.e. by country of portfolio company),
due to data availability.
22
See, for example, Giese, 2014 (thesis prepared in cooperation with EIF RMA in fulfilment of the “Business
Administration” M.Sc. at the University of Trier). Data on CVC is scarce, in particular for Europe, but, for
example, information presented by http://www.globalcorporateventuring.com/ can give a flavour of the
market developments.
0.0
0.2
0.4
0.6
0.8
1.0
1.2
1.4
Life scie
nces
Com
munic
ations
Com
pute
r &
consum
er ele
ctronic
s
Energy &
environm
ent
Consum
er goods &
reta
il
Consum
er servic
es
Busin
ess &
in
dustria
l
products
Busin
ess &
in
dustria
l
servic
es
Fin
ancia
l servic
es
Chem
icals
&
m
ate
ria
ls
Transporta
tion
Construction
Agric
ulture
Real esta
te
Uncla
ssifie
d
bn EU
R
2007 2008 2009 2010 2011 2012 2013 2014
29
Box 4: Business Angel activity
Business Angels represent an important class of private equity investors, primarily consisting of
high-net-worth individuals. They tend to invest their own money, either individually or in formal or
informal syndicates, in businesses which are not publicly traded.23
Business Angels differ from VC funds, which primarily invest third parties’ funds (e.g. institutional
investors’). Angel-financed companies are typically in earlier stages of their development,
compared to the VC-backed ones. Moreover, the holding periods of Business Angel investments
are typically shorter than the corresponding periods in Venture Capital funds (Kraemer-Eis and
Schillo, 2011). The past years have seen an increase in Business Angel investments in early-stage
high-growth companies, as VC funds have migrated to less risky later-stage investments (Kraemer-
Eis, Lang and Gvetadze, 2013b). Business Angels offer a number of advantages compared to VC
funds:
- Lower transaction costs allow them to invest on a lower scale,
- Business Angels are geographically more dispersed, and often invest in local markets,
- They are very ‘hands-on’ investors.
There are difficulties in measuring the size of the business angel community, the main ones being
identification and definition. Business Angels typically prefer to stay anonymous and the details on
their investments are rarely disclosed. Further, nothing can prevent an individual from identifying
oneself as a ‘virgin’ angel, although he/she may have never actually invested. Others may have
occasionally acted as angels, but are no longer looking for investment opportunities.
Moreover, the so called “invisible market” makes a precise estimation of the angel market
difficult. There are studies that the invisible part of the market is up to seven times greater than the
visible part (CSES, 2012), while others estimate even a multiplier of around ten (EBAN, 2014).
Such difficulties must be borne in mind when describing the market.
For the visible market segment, data is collected by angel associations from angel groups and
networks. EBAN24
(2014), for example, reported an average increase in the number of Business
Angel networks of 17% over the past 10 years to 468 in Europe in 2013, with estimated
investments by the approximately 28k BAN members of EUR 554m. Most of the BA activity within
the EU is concentrated on the UK, Spain, France, Germany, Finland and Sweden.
According to EBAN (2014), the average amount invested per company decreased over the past
three years to EUR 166k in 2013. This is well in line with the results of other studies on the size of
funding (e.g. CSES (2012)), which estimated that Business Angels provided on average around
EUR 100k to 200k per deal. Individual angel investments are varying significantly, and EBAN
(2014) reported a slight increase in the average investment per BA to EUR 20.4k in 2013.25
For a
23
For a general description of Business Angel financing we refer Kraemer-Eis and Schillo (2011) and to
OECD (2011).
24
The European Trade Association for Business Angels, Seed Funds, and other Early Stage Market Players. 25
However, according to EBAN (2014), the business figures “are not representative of the entire European
market”, because they cover only a certain part of the visible market.

30
Box 4 continued:
different dataset, Zephyr, the M&A database published by Bureau van Dijk, recorded a strong
increase in the total amount of visible BA investments to EUR 734m in 2014.
As explained, the invisible part of the market is dominant – therefore, data availability for general
statements is limited. However, it can be assumed that during the crisis Business Angels behavior
did not move in the same direction like bank lending or venture capital supply. Mason and
Harrison (2013), e.g., show for the UK that angel investment activity has held up since the onset
of the crisis and they emphasise the economic significance of this market segment. Moreover, they
underline the need for ongoing government support. Recent findings by Hellmann, Schure and Vo
(2015) also suggest that public support for start-up financing should go beyond an exclusive
support of (formal) venture capital, because additional policy measures for angel investors “would
reach a different set of entrepreneurial companies that develop outside of the reach of venture
capitalists”.
As a part of its support for this market segment, the EIF has implemented the European Angels
Fund (EAF). The EAF is a co-investment fund to provide equity to business angels for the purpose
of SME financing. It has been launched in March 2012 in Germany with an initial volume of EUR
70m and been increased and extended to Spain and Austria since then and currently reaches a
volume of c. EUR 188m. EAF has already committed app. EUR 60m to BAs who have already
drawn more than EUR 10m for co-investments in more than 60 SMEs since the launch of the
programme. Further roll-out to other countries is foreseen and the launch of the program in the
Netherlands and Ireland is scheduled for 2015. Aim of EAF is to co-invest with experienced
business angels in order to build a joint portfolio over a time of 5-10 years.26
Complementary
approaches allowing to co-invest with a broader target group including less experienced business
angels or syndicates, e.g. via managed co-investment funds, have occasionally already been
made in the past and will be focused further in the future.
4.2 Fundraising activity
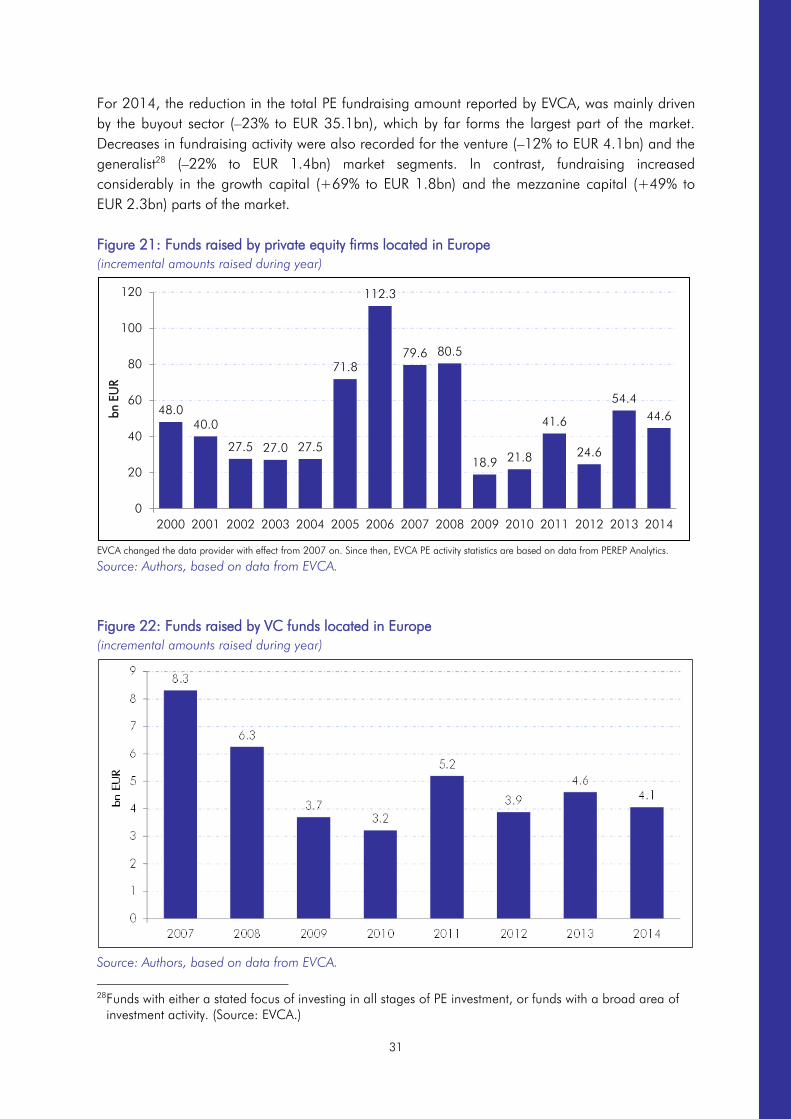
In 2014, total funds raised by private equity firms located in Europe decreased by 18% to EUR
44.6bn, compared to the year before and according to EVCA data (see Figure 21).27
Despite this
slump, European PE fundraising recorded the second largest amount since 2009. In fact, 2014’s
PE fundraising level “is only surpassed by 2013’s post-crisis peak of EUR 54.4bn, which was
heavily influenced by a small number of large funds raised” (EVCA, 2015b). According to Preqin
(2015), which uses a PE definition that is different from EVCA’s, the positive fundraising
developments observed during the recent years have led to a record amount of dry powder that is
available for European PE investments.
26
More information on the EAF is available here: http://www.eif.org/what_we_do/equity/eaf/index.htm.
27
Figures show fundraising activity (incremental amounts raised during the year) by private equity firms
located in Europe (“industry approach” or “office approach”), except where otherwise stated.
31
For 2014, the reduction in the total PE fundraising amount reported by EVCA, was mainly driven
by the buyout sector (–23% to EUR 35.1bn), which by far forms the largest part of the market.
Decreases in fundraising activity were also recorded for the venture (–12% to EUR 4.1bn) and the
generalist28
(–22% to EUR 1.4bn) market segments. In contrast, fundraising increased
considerably in the growth capital (+69% to EUR 1.8bn) and the mezzanine capital (+49% to
EUR 2.3bn) parts of the market.
Figure 21: Funds raised by private equity firms located in Europe
(incremental amounts raised during year)
EVCA changed the data provider with effect from 2007 on. Since then, EVCA PE activity statistics are based on data from PEREP Analytics.
Source: Authors, based on data from EVCA.
Figure 22: Funds raised by VC funds located in Europe
(incremental amounts raised during year)
Source: Authors, based on data from EVCA.
28
Funds with either a stated focus of investing in all stages of PE investment, or funds with a broad area of
investment activity. (Source: EVCA.)
48.0
40.0
27.5 27.0 27.5
71.8
112.3
79.6 80.5
18.921.8
41.6
24.6
54.4
44.6
0
20
40
60
80
100
120
2000 2001 2002 2003 2004 2005 2006 2007 2008 2009 2010 2011 2012 2013 2014
bn EU
R

32
The drop in European VC fundraising (see Figure 22) can almost completely be explained by the
lower activity of funds with a balanced stage focus (–42% to EUR 1.5bn), but fundraising amounts
also decreased for the later stage (–9% to EUR 0.31bn). Fundraising in the early stage VC market
segment grew by 32% to EUR 2.3bn. However, after its trough in 2010, the recovery of the total
European VC fundraising activity has by far not been that strong than what has been observed in
the overall PE market.
The average VC fund size has slightly decreased to EUR 62m (see Figure 23), based on 53 final
VC fund closings reported in the EVCA statistics for 2014. Given the evidence in previous studies,
which indicated that small fund size was one of the reasons for poor European VC performance
(Kelly, 2011), the current finding might mean negative news. However, the average VC fund size
is 44% larger than in the 2010 crisis trough. Moreover, EIF internal analysis suggest that large
funds indeed perform better, but are managed by teams that previously had smaller funds that
performed well. Thus, the size would be a consequence rather than a cause. Larger fund size (as
reported by EVCA statistics for funds with a “balanced” stage focus, i.e. venture capital funds
focused on both early-stage and later-stage companies) would be a sign of more successful GPs
and more careful due diligence by LPs.
Figure 23: Average VC fund size29
(based on final closings, cumulative amounts raised since inception)
Source: Authors, based on data from EVCA
A sign of investors’ still cautious sentiment for venture capital is the shift in the investor base, which
has been going on during the past years (see Figure 24). According to EVCA figures, government
agencies accounted for 35% of total investors into venture capital funds in 2014. However, even if
the importance of government agencies is unsatisfyingly high for the long term, it is noteworthy
that government agencies continue to play their role and support the market in a counter-cyclical
29
Numbers based on 32 funds with an early-stage focus, 5 funds with a later stage focus and 16 funds with
a balanced stage focus.

33
way, in particular in the times of an economic and financial crisis when total VC fundraising levels
came down from EUR 8.3bn in 2007 to EUR 4bn in 2014. This led almost “naturally” to an
increased share of government agency fund investors.
Figure 24: Investor base: Share of government agencies in VC fundraising30
Source: Authors, based on data from EVCA
In order to put EIF’s activity in context, one needs to take into account that EIF’s commitments
represented, for example, approx. 14% of total VC fundraising in Europe in 2014. Assuming that
the average stake in each fund has ranged in the area of 30% implies that EIF has invested in
about half of all VC funds launched in that year. Not even 30% of VC funds in which EIF invested
since 2011 managed to close with their full target size until mid-2014, and the EIF’s investment
brought the total commitment to a viable minimum fund size in nearly 60% of the cases.
Moreover, it is important to see that many of the commercial VC funds being the pillars of
Europe's VC market today would not be there without having been kick-started by EIF. This clearly
indicates EIF’s catalytic role for European VC, rather than a crowding-out effect. This view was
confirmed in the latest Unquote Intelligence (2014) survey among General Partners (GPs) and
Limited Partners (LPs), which found that “the overriding benefit of [public funding bodies’] (PFB)
money is the crucial role it plays in attracting other investors”. Moreover, “[h]aving PFB money in
a fund does not deter other LPs from committing”. However, even though EIF strives to stimulate
market activity by its investments, it would not invest into funds which are not majority-financed by
private investors.
30
Based on incremental amounts raised during year (in contrast to final closings only).
0
2
4
6
8
10
2007 2008 2009 2010 2011 2012 2013 2014
bn EU
R
New funds raised
(excluding capital gains)
Classified
Unclassified
0%
5%
10%
15%
20%
25%
30%
35%
40%
2007 2008 2009 2010 2011 2012 2013 2014
Government agencies
Family offices & Private Individuals
Corporate investors
Insurance companies
Banks
Pension funds
Fund of funds & Other asset
managers
Academic Inst. / Endowments /
Foundations
Capital markets
Sovereign wealth funds

34
4.3 Divestment activity
The strong increase in PE divestment activity in 2013 was followed by another record year in
2014. According to EVCA data, total divestments by PE firms located in Europe increased by 12%
to EUR 39.1bn (see Figure 25).31
That rise was mainly due to increased activity in the buyout
(+12% to EUR 32.8bn) segment of the market, while divestments in the VC segment decreased
(–16% to EUR 1.9bn).32
Figure 25: Divestments (by amount at cost divested) by private equity firms located in Europe
EVCA changed the data provider with effect from 2007 on. Since then, EVCA PE activity statistics are based on data from PEREP Analytics.
Source: Authors, based on data from EVCA
A closer look at the details of the EVCA divestment statistics shows the strength of the exit markets
in the recent past. As regards overall PE, the relative importance of write-offs has continuously
decreased since 2010, except for a slight increase in 2013 (see Figure 26). Trade sales and sales
to another PE house are still the most popular form of divestment. Together, they account for half
of the total divestment amounts. Public offerings are the third most important form of divestment.
In the buyout sector, the relative importance of write offs decreased to 8% of divestment amounts
at cost. In the VC market, the relative importance of write-offs slightly increased to 18% of
divestment amounts.
A positive sign for the VC exit market can be taken from the relatively stable share of public
offerings in total divestments, which was at 15% (mainly consisting in a sale of quoted equity and
to a much lower extent in IPOs) in 2014. Examples of recent exits of companies held by EIF-
supported funds included, inter alia, IPOs of the German online retailer for baby and toddler
products “Windeln.de”, the British online property portal Zoopla, the Danish prodrug developer
Ascendis and the Belgian molecular diagnostics provider Biocartis.
31
EVCA statistics show divestment amounts at cost, i.e. the total amount divested is shown as the total
amount that had been previously invested, hence not including any profit on the investment.
32
The numbers for VC, buyout and growth divestments do not sum up to total PE divestments, as total PE
divestments additionally include the rescue/turnaround and replacement capital market segments.
9.1
12.5
10.7
13.6
19.6
29.8
33.1
27.0
14.4
11.9
19.7
31.2
21.9
34.8
39.1
0
5
10
15
20
25
30
35
40
2000 2001 2002 2003 2004 2005 2006 2007 2008 2009 2010 2011 2012 2013 2014
bn EU
R

35
However, there are also warning voices as regards the current PE & VC valuations. According to
Go4Venture Advisers (2015), it is an “inescapable fact that clues of overheating continue to
accumulate”, not least because of a strong expansive monetary policy stance, and “this is of
course a breeding ground for the next investment bubble”.
Figure 26: Divestment routes (shares)33
Source: Authors, based on data from EVCA
4.4 Prospects34
The relatively positive developments in European PE and VC activity figures were confirmed by
confident outlooks reported in surveys among fund investors (see for an overview Kraemer-Eis,
Lang and Gvetadze, 2014b). Moreover, Go4Venture Advisers’ early indicator, the European Tech
Headline Transactions Index35
, has recorded, on average, strong increases in terms of investment
33
Based on amounts at cost divested; industry/office approach (i.e. divestments by funds located in Europe).
“Overall” figures are not the weighted average of the “buyout” and “venture” figures, as “overall” figures
additionally include the growth, rescue/turnaround and replacement capital market segments. In the
EVCA data, the category “Public Offerings” includes divestment on flotation (IPOs) and sale of quoted
equity.
34We are grateful to several colleagues for very helpful comments and discussions. In particular, we would
like to thank Uli Grabenwarter for an extensive written contribution to this subchapter.
35
Go4Venture Advisers’ European Tech Headline Transactions Index “is a derivative index” which is
“compiled […] based on the deals reported in major trade publications and news feeds […] as an early
indicator of evolutions in the private investments market for European TMT companies. […] TMT is defined
to include Technology, including IT and Life Sciences (except drug discovery); Media, including Internet &
Digital Media; Telecom Services (alternative operators only)”. For this and more information on definition
and methodology see Go4Venture Advisers’ (2013), Go4Venture Advisers’ (2015) and
www.go4venture.com/research/.

36
values since summer 2012. In contrast, the number of deals had declined for a year since autumn
2013, before it started to pick up again (see Figure 27, which shows the index development on a
12-month rolling-horizon basis).
Figure 27: European Tech Headline Investment Transactions (12-month rolling horizon)36
Source: Authors’ calculations based on Go4Venture Advisers data.
However, the general economic situation, structural market weaknesses and various regulatory
changes continue to make the general market environment challenging. According to a Preqin
survey (Preqin, 2014), regulation, performance and the economic environment had been
perceived as the biggest challenges that investors were facing, and similar findings were reported
by Unquote Intelligence (2014). EVCA (2015c) provides a comprehensive overview of the
regulatory initiatives and changes and their potential impact on PE/VC in Europe. We cannot go
into a detailed assessment of all the different rule sets here (just to mention a few names, e.g.,
AIFMD, Solvency II, EuVECA, CRD IV and CRR, various taxation rules, and last not least the
“Capital Markets Union” policy initiative). Besides regulatory initiatives, structural market
weaknesses such as the difficult access of smaller companies to IPO markets (see, for example,
EU IPO Task Force, 2015), limit the upside potential of the European VC market.
Moreover, the economic developments over the last years have resulted in significant structural
changes in the global and European economic landscape. The digitalisation of the economy has
led to a differentiation of market segments. Whilst companies in research-intensive sectors
continue to follow more traditional growth models with capital-intensive development stages at the
beginning of their life, companies in the digital space are able to start their activities with very
limited resources but are exposed to unprecedented needs for funding in the internationalisation
and globalisation of their business models. As a result, and depending of the sector and the
business models of the companies, time-spans from start-up to global leader have shortened
36
In the two lines in the diagram, each data point shows the sum of the total value of deals (blue line) and
the sum of the total number of deals (yellow line) observed in the month to which the respective data point
is related and over the 11 months prior to that data point. For example, in July 2013, the total value of
deals observed during the period from August 2012 to July 2013 amounted to EUR 4.1bn, and a total
number of 480 deals were observed during the same period.
300
350
400
450
500
550
2.0
2.5
3.0
3.5
4.0
4.5
5.0
5.5
6.0
6.5
7.0
Dec-10
Apr-1
1
Aug-11
Dec-11
Apr-12
Aug-12
Dec-12
Apr-13
Aug-13
Dec-13
Apr-14
Aug-14
Dec-14
Apr-15
bn EU
R
value (left-hand axis) number (right-hand axis)

37
considerably and require companies to scale quickly to sustain the risk of seeing their business
model being out-dated before they capture a significant market share.
On a global level, the VC market has adapted to this new diversity of its target sectors, which has
led to a bifurcation of the market between sometimes relatively small funds with the aim of
scouting emerging business models whilst a new class of giant VC funds expands globally from
the US, providing large scale capital to businesses in their global market expansion. In the large
scale technology growth capital space Europe has no established players, which explains why
virtually every European funding round especially in digital technology growth capital is led by US
VC growth capital funds.
In the shadow of companies driving or directly affected by the “digital revolution”, SMEs and mid-
caps in traditional industries are reshaping their strategies for competing in a rapidly changing
economic environment and are in need of flexible funding instruments with growth equity,
mezzanine debt and hybrid debt to classical debt features.
Geographically, Europe is a far less homogenous VC market than the US. Whilst the core markets
in Europe (UK, France, Scandinavia and to some extent and in some sectors Germany) have seen
some recovery since 2008, other geographies continue to struggle with the size of their domestic
VC market which is in no relation to their share in the aggregate GDP of the EU (notably Italy and
Spain). Sizable differences in the development of the VC markets prevail, especially in the
peripheral parts of the EU where markets not only suffer from subcritical size but equally from EU’s
very fragmented institutional investor base. Whilst for most market segments especially in the early
stage VC segment proximity between the VC fund managers and their target portfolio companies
is essential, to a large extent Europe lacks the market segment of international pan-European VC
growth capital funds that are able to effectively support companies in their global market
penetration effort.
However, when it comes to the question of policy support instruments, it has to be noted that the
value of capital injected for funding Europe’s economic growth is not primarily driven by volume
but by impact. This means that large-scale growth capital funds will make no difference to
achieving the policy objectives for the EU’s competitiveness if they are not associated with the
knowledge of how to grow businesses to global scale.
All these challenges continue to create access to funding problems in the European VC market.
The difficulties for young innovative companies to access seed and early stage finance have
increased over the past years, as VCs have become more risk-averse and focussed more on later
stage investments (Wilson, 2015b). A Coller Capital (2013) study found that more than half of the
global LPs believe that there are insufficient sources, other than VC, available to finance
innovation and growth in Europe. This supports a view that public backing is needed in order to
strengthen the market. We had outlined recent OECD findings on policy measures taken by
governments to support seed and early-stage financing in previous issues of the ESBFO (see
Kraemer-Eis, Lang and Gvetadze, 2013b, 2013c, 2014a and 2014b). Indeed, an Unquote
Intelligence (2014) survey found that “public money remains absolutely critical to the European
venture industry and is likely to remain so for the next five years”, and this has been particularly
true for new funds, as most public funding bodies support first-time funds, while this is true for only
38
approximately half of private investors. Besides the additional funding volumes, public investors’
participation in a PE/VC fund can also have a positive signalling effect on private investors, e.g.
due to perceived strong due diligence requirements and an assumed relatively high stability of
public LPs’ commitment to a fund. These advantages seem to outweigh the potential
disadvantages (e.g. a possibly negative impact on speed and responsiveness or imposed
restrictions in the investment strategy of the fund) of public investors’ participation.
In this context, the relationship between private VC activities and governmental support was
analysed in several empirical studies: According to Colombo, Cumming and Vismara (2014), the
design of a public VC investment scheme is important for their impact. In particular, governmental
VC schemes seem to have been more successful when they acted alongside private investors,
which would favour a governmental fund-of-funds set-up over direct public investments. Indeed,
the focus of support instruments “has shifted from government equity funds investing directly to
more indirect models such as co-investments funds and fund-of-funds” in OECD countries
(Wilson, 2015b). Moreover, Brander, Du and Hellmann (2014), in a continuation of their 2010-
study, find that enterprises funded by both governmental VC and private VC obtain more
investment than enterprises funded purely by private VCs, and much more than those funded
purely by governmental support. There is also a positive association between mixed
governmental/private funding and successful exits, as measured by initial public offerings and
acquisitions, attributable largely to the additional investment. These findings are in line with
Bertoni and Tykvová (2012), who concluded that “that syndicates between private and
governmental venture capital investors, in which the private investor takes the lead, are the most
efficient form in terms of innovation production that outperforms all other forms.” However, as
said earlier, public policy in the area of venture capital should go beyond an exclusive support of
VC funds (see Hellmann, Schure and Vo, 2015), but rather aim to attract equity financing to
Europe also from other sources, such as angel investors and crowdfunding (see Wilson, 2015a;
see also Aubrey et al., 2015, for related policy recommendations to support growth firms).
A recent Coller Capital (2015)37
survey finds that 73% of LPs believe that recent improvements in
VC returns are mainly due to strong exit markets; however, 27% believe that the VC sector has
also seen structural performance improvements. EIF market insight shows a number of VC-backed
companies in the early-stage segment that show increasing revenues and are now achieving
profitability, positioning them well for sustained organic growth and ultimate strong returns for
investors. However, while in some cases performance is indeed driven by fundamental economic
value, part of the upside performance may also be driven by higher demand due to dry powder
looking for investments. This is to be looked at with caution. It is then, however, important to
support those companies in their continued growth that have well-developing economic
fundamentals, and to also help, through the support of financial intermediaries, additional and
complementary businesses to maintain and strengthen the backbone of the European VC market,
i.e. a strong and continued supply of new innovative companies. In addition, the VC ecosystem is
37
Coller Capital’s Global Private Equity Barometer is published twice-yearly and intends to give an overview
of the plans and opinions of institutional PE investors (LPs) based in North America, Europe and Asia-
Pacific (incl. the Middle East). The 22nd edition (summer 2015) of the Global PE Barometer captured the
views of 113 PE investors from round the world, surveyed in March-April 2015. According to Coller
Capital (2015), the “findings are globally representative of the LP population by: investor location, type of
investing organisation, total assets under management, length of experience of PE investing”.

39
developing, including the emergence of more and more successful incubators and accelerators.
Should these trends continue, the potential returns of early-stage companies would have
significantly positive impacts on the performance of VC investing. In consequence, the medium-
term perspective of the European VC market can be more positive than the backward-looking
statistics reveal.38
In all, Europe therefore needs an integrated portfolio of funding instruments in support of the
various segments of its SME and mid-cap landscape to foster the recovery from the 2008 financial
crisis and to unleash the full potential of EU companies’ competitiveness and their contribution to
Europe’s economic growth and innovation. Instruments should be complementary to existing
initiatives in terms of sector, stage or geographic focus. However, the dynamics of recent
economic developments e.g. in the area of the digital economy, has made the segmentation
between early stage and late stage VC somewhat redundant. Policy instruments that create
artificial boundaries of development stages of businesses could be prohibitive to an efficient VC
market. Moreover, EU’s VC markets show different development stages and so require different
policy instruments. In less developed markets instruments may need to work strongly together with
the actors in the informal VC markets (BAs, Incubators, TT Centres) and be complemented by
flexible co-investment products to grow the domestic VC market. However, companies with global
ambitions compete globally. Instruments investing in future industry leaders compete for investors
who seek exposure to the best companies on a global scale, not with respect to a given
geography. Therefore, giving flexibility in the geographic boundaries of policy instruments is not
only key in retaining EU-based businesses in Europe but may attract non-EU based businesses to
relocate to Europe. Based on these considerations, it appears vital to offer a flexibility of
instruments adapted to diverse market conditions in the various geographies of the EU. Such
should be implementable in a time and cost efficient manner. Moreover, in times of economic
slowdown and scarcity of private capital the temptation grows to construct policy instruments that
substitute the private sector. However, there is in fact a need to use public sector resources with
the primary objectives of mobilising private sector capital, as clearly demonstrated, for example,
by the leverage factor built in the Investment Plan for Europe (see Box 12 in the Concluding
Remarks at the end of this document) and other instruments implemented by the EIF.
To summarise, it remains to be seen if the positive developments observed in the recent past could
develop into a sustainable longer-term positive trend. As a reference catalytic investor in European
venture and growth capital funds, EIF is actively working in that direction: EIF has increased its
counter-cyclical role by providing financing solutions to boost entrepreneurship and innovation. In
the coming years, EIF will continue to act as a cornerstone investor across the spectrum from
technology transfer to venture capital to the lower mid-market and mezzanine financing. On the
following pages; we describe several recent developments and EIF activities.
38
For example, EIF currently sees a positive trend in VC/Growth stage performances, and the vintage years
2007 and beyond currently show encouraging interim results.

40
Box 5: Mezzanine finance and lower mid-market
The lower mid-market and the mezzanine market are also demonstrating tangible signs of
recovery, with increased volumes of liquidity, growing deal flow and heightened exit activity. The
lower mid-market is increasingly becoming an attractive and active segment for investors. (Source:
EIF, 2015a.)
EIF provides its core lower mid-market products (equity, hybrid debt-equity and mezzanine for
SMEs and midcaps) as alternative sources of long-term finance to established businesses and later
stage technology companies. In the current market context, debt/equity finance solutions proved
highly successful, particularly for shareholding reorganisation, organic growth, restructuring or
expansion.
In 2014, EIF signed a total of EUR 875m in 32 lower mid-market and mezzanine funds, an 18%
increase on the previous year’s results, and mobilised c. EUR 6.2bn of resources, demonstrating
its crucial catalytic role in helping to maintain a viable and healthy SME and midcap-focused
private equity market.
Moreover, the launch of the new Mezzanine Co-Investment Facility (MCIF) in 2014 expanded
EIF’s lower mid-market activity to co-investments in target companies. This EUR 100m programme
enables EIF to co-invest in target companies alongside mezzanine funds supported under the
debt-equity window of the EIB Risk Capital Resources (RCR) mandate. MCIF widens the spectrum
of EIF investment products and leverages the efficiency of EIF’s risk finance support for SMEs and
midcaps, thereby enhancing their access to finance.
Going forward, EIF expects to develop further its lower mid-market investment activities in the
private debt segment through the provision of equity and guarantee solutions under the EIB Group
Risk Enhancement Mandate (EREM) mandate. For more information see the recent EIF Working
Paper on institutional non-bank lending and the role of debt funds (see Kraemer-Eis, 2014).
EIF’s activity in the equity sphere also includes the launch and extension of new and pilot
initiatives, such as, for example, the European Angels Fund (EAF), which we described in Box 4
further above. Moreover, EIF is also active in the field of Technology Transfer in order to support
the commercialisation of research know-how – see Box 6 for further information.
Box 6: Technology transfer activity
Technology transfer (TT) encourages collaboration between research organisations and industry,
the licensing of intellectual property rights, and the creation of start-up businesses and university
spin-out companies. In 2014, the European TT segment continued its trend of increasing
professionalisation, on the path of evolution towards a more mature setting. EIF has supported the
continued development of operations within European countries with a more advanced TT
infrastructure, whilst also providing support for those with an emerging TT expertise. Once again,
an increase in the underlying deal flow from leading academic seed and licensing operators was
observed and future TT investment funding is projected to remain strong and in line with an
increasing market demand. In all, EIF invested EUR 111m in six technology transfer transactions in
2014.

41
Box 6 continued:
Investments in new technology transfer markets, including Portugal, were successfully committed
and particular support was given to Turkey through the launch of the Technology Transfer
Accelerator Turkey Fund. This initiative – co-financed by the EU and the Republic of Turkey under
the Regional Development Component of the Instrument for Pre-Accession Assistance funds and
managed by EIF – will help build up the technology transfer market in Turkey, with a particular
focus on spillovers to the less developed regions of Turkey.
Discussions with the European Commission to set up a Technology Transfer finance facility have
continued through 2014. Such an instrument would open up a new market for EIF and address
the needs of a larger number of European TT players. In addition, it would provide a stimulus for
the Proof-of-Concept phase of European research commercialisation and thereby provide an
important funding bridge for the development of this nascent end of the TT spectrum. The overall
amount of the facility remains a topic for further discussion. The trends seen through recent years
are expected to continue through the coming year, during which EIF will continue with its policy of
support for leading TT intermediaries whilst maintaining appropriate risk profiles and risk
mitigation standards. EIF TT will look to continue to work alongside key TT co-financing
stakeholders and stakeholders to provide support for the continued development of the sector.
(Source: EIF.)
Another example of EIF’s initiatives is the Social Impact Accelerator (SIA)39
, which has been started
to satisfy the growing need of equity finance for support to social enterprises (see as well Box 6).
This segment of the business world is becoming increasingly instrumental in promoting social
inclusion, providing alternative sources of employment to marginalised social groups, and
contributing to growth.
Moreover, EIF is in the course of launching the new ERP-EIF Co-investment Growth Facility, a new
co-investment product which is to be piloted in Germany under a new EUR 500m co-investment
mandate financed 2/3 by the German Federal Ministry of Economic Affairs and Energy on behalf
of the European Recovery Program (ERP) and 1/3 by EIF-managed resources. The ERP-EIF Co-
investment Growth Facility is a complementary instrument to support German growth-stage
technology companies on their pathway to scale through a co-investment scheme alongside VC
funds managed by reputable VC managers. The goal is to provide the most promising growth-
stage companies an access to capital in a time- and cost-efficient manner and to allow VC fund
managers to leverage the position of their funds in larger funding rounds and thereby benefit from
the full value potential of their outperforming portfolio companies. For EIF, the German Facility is
also an important pilot for potential additional co-investment schemes, which could eventually
help mitigate similar market needs in other European geographies.
The need for such a product is confirmed by recent EIF market insight, according to which growth-
stage companies are experiencing a serious lack of growth (follow-on) funding in order to
accelerate their international expansion and to strengthen their position against global
competitors. Moreover, in an EIF survey among VC fund managers in Germany, 66% of the
39
More information on the SIA is available here: http://www.eif.org/what_we_do/equity/sia/index.htm.

42
participants saw a benefit from the availability of stable providers of co-investment capacity when
addressing potential investment opportunities. 52% would have closed more investments if they
could have relied on stable providers of co-investment capacity in the past (the share was notably
high for managers of ICT funds at 71%). 57% of respondents listed too small fund size as one of
the main reasons why they decided not to invest. 66% of participants saw a high or very high
market need for such a co-investment product (Source: EIF.) Hence, not surprisingly, the recent
Coller Capital (2015) survey finds that “most LPs expect co-investments to remain a fixed feature
of the PE landscape”.
Box 7: Social entrepreneurship and impact investing
There is no universally accepted definition of social enterprises or social entrepreneurship.
Nevertheless, typically, social enterprises are meant to show the following common features: their
primary goal is to serve a social interest (social, societal, environmental objectives) instead of
profit maximisation, but alongside a financial return, they are often of an innovative nature
(through the inputs and output), and they often employ society’s most fragile and marginalised
members who are typically excluded from the mainstream labour market - socially and financially
excluded persons, disabled people, ex-prisoners, minorities.
The growing presence of social enterprises in Europe is a direct response by the private sector to
provide certain public services, which are either not currently funded, or can no longer be funded
from state or municipality budgets. The growth of the social entrepreneurship market segment also
illustrates the current change of paradigm that marks a shift from a subsidy-based approach to
sustainable economic models for the resolution of long-term social issues. The increasing gap in
public services has triggered an increased number of ”change-makers” to set up social enterprises
that propose innovative ways to tackle current societal challenges.
A recent survey of impact investors, conducted by J.P. Morgan and the GIIN, revealed that over
the past years, governments have provided support to the impact investment market through credit
enhancement tools, tax credits and technical assistance to investees. Additionally, respondents,
particularly from Western Europe, indicated that the relevant regulations and a better definition of
“social impact” would be helpful to enhance activities in the sector (J.P. Morgan, 2015).
Investing activity related to social entrepreneurship is traditionally considered as impact investing.
Impact investing is a profit-seeking investment activity that intentionally generates measurable
benefits for society. Impact expectations and objectives are formulated prior to investing and the
progress towards achieving these objectives are measured during the term of the investment.
True impact investors don’t necessarily see a trade-off between financial returns and social
impact. The J.P Morgan/GIIN survey (J.P. Morgan, 2015) showed that over half of impact
investors (55%) principally targets “competitive, market rate returns”, with the rest of respondents
targeting “below market rate returns: closer to market rate” (27%) and “below market rate returns:
closer to capital preservation” (18%).

43
Box 7 continued:
With regard to the financial return prospect of Social Impact Funds, little evidence is publically
available at this stage. This lack of information is largely due to the fact that most of the realised
track record in Social Impact Investing is linked to the activity of family offices, which typically do
not publicly disclose figures in relation to their investment performance. Nevertheless, dedicated
research on the impact investing activities of family offices co-led by an EIF staff member from
June 2010 to February 2013 suggests that net returns to investors of 5% to 10% are achievable,
depending on the investments' target sectors (Source: EIF).
EIF activities
The EIF, with the collaboration of private sector investors, has launched the Social Impact
Accelerator (SIA), the first pan-European public-private partnership for social impact investing. SIA
is an initiative which addresses the growing need for availability of equity and hybrid finance to
support social enterprises, a segment of the business world which is becoming increasingly
instrumental in promoting social inclusion, providing alternative sources of employment for
marginalised social groups and contributing to growth.
Beyond simple financial return targets, these social impact funds seek to trigger positive societal
change as a result of their impact conscious investment activity. In addition to enhancing the
availability of finance for social enterprises, SIA aims to build up the existing market infrastructure
for social impact investing in such a way that this emerging asset class is placed on a path to
long-term sustainability.
Social impact funds in which SIA is invested are social impact funds supporting social enterprises,
which are defined as economic entities having at the core of their business model the scalable
resolution of a recurring social issue. The sectors in which those SMEs are active are typically,
employment, education, social inclusion, public health, social housing, and consumer services.
Within SIA’s portfolio, there is also the first investment fund dedicated to financing social impact
bond schemes.
Under SIA, EIF has to date approved EUR 57m to six social impact funds across the EU (2 in the
UK, 1 in Italy, 2 in France and 1 in Germany). Two additional commitments have been approved
by the EIF Board of Directors. Moreover, the pipeline of investment for the SIA is strong and shows
a high market demand for a large and stable source of funding for social entrepreneurship across
the EU.
The EIB has supported the initiative through a capital increase of the SIA, now reaching EUR
241m (further discussions with private investors are ongoing). Through the capital increase of the
SIA, social impact investing has now become a mainstream pillar of EIF’s business, expanding its
operations to a broader array of European SMEs to ensure appropriate channelling of funds to
the European economy backbone (Source: EIF).
To pursue its equity activities, EIF invests its own funds as well as resources managed on behalf of
mandators. These are deployed through various programmes including the EIB Risk Capital
Resources (RCR) mandate and the EIB Group Risk Enhancement Mandate (EREM). The RCR

44
provides EUR 7bn to support technology and industrial innovation and targets early-stage to lower
mid-market funds that specifically focus on EU-28, EU candidate, potential candidate and EFTA
countries and on SMEs and midcaps. Under the RCR, EIF co-finances with its own funds. At the
end of 2014, the RCR’s outstanding volumes amounted to EUR 5.9bn, committed directly in 397
funds and mobilising over EUR 32.3bn of resources. The RCR mandate is intended to be
increased from EUR 7bn to EUR 9.5bn in the context of the Investment Plan for Europe to the
benefit of SMEs and midcaps in the EU-28 Member States. The EREM extends, inter alia, the offer
of funding instruments to the actors in the social economy, notably social sector intermediaries
such as social investment funds that are supporting social enterprises. (Sources for this and the
following paragraphs: EIF, 2015a, EIF website and other EIF sources.)
On the European level, the “Single EU Equity Financial Instrument” supports European
enterprises’ growth, research and innovation from the early stage, including seed, up to the
expansion and growth stages. This instrument is financially supported by “Horizon 2020”, the new
EU research programme for 2014-2020, and the “Programme for the Competitiveness of
Enterprises and SMEs” (COSME). The equity arm of COSME, which is under the responsibility of
the EC Directorate-General for Growth, is the COSME Equity Facility for Growth (EFG) and
targeting growth-stage SMEs. The equity component of InnovFin – EU Finance for innovators, a
joint EIB Group (EIB and EIF) and EC (Directorate-General Research and Innovation) initiative
under Horizon 2020, will be implemented in conjunction with the COSME EFG, with focus on
early-stage SMEs as well.
Under the SME window of the Investment Plan for Europe (see the Box in the Concluding Remarks
at the end of this document), equity products are foreseen to be implemented, including an
increase of the RCR mandate by EUR 2.5bn as well as EUR 1.0bn yet to be defined but likely with
a larger target, especially on growth stage and co-investment, including a joint platform with
national promotional institutions.
Moreover, EIF supports private equity instruments by implementing funds raised from national and
regional third-party mandators (JEREMIE, ERP, IVCI, PVCI, NEOTEC, DVI etc.). The Joint
European Resources for Micro to Medium Enterprises (JEREMIE) is one of the instruments that
have defined EIF’s regional development strategy since 2007. It was developed by the European
Commission and EIF. With JEREMIE, EU Member States have the opportunity through their
national or regional managing authorities to use part of their Structural Funds to provide risk
financing to SMEs. Another recent example of EIF’s country-specific activity is the Dutch Venture
Initiative (DVI), which is a fund of funds that supports SMEs in the Netherlands by investing in
funds focused on fast-growing innovative or high-tech businesses.40
40
More information on country-/region- and sector-specific initiatives is available here:
http://www.eif.org/what_we_do/resources/index.htm.
45
5 SME guarantees and SME Securitisation in Europe
5.1 SME guarantees
In the area of access to finance for SMEs, a market imperfection/failure is not only present during
a deep recession or a financial crisis, but also on an on-going basis as a fundamental structural
issue (see OECD, 2014b, for a recent overview of market failures in SME lending and mitigation
techniques). There are several reasons for this. One of them is the disproportionality between the
extent, and hence the cost, to assess a relatively small company’s application for finance and the
potential revenue. Whereas the credit assessment contains a certain fixed cost element (i.e.
independent of the size of the finance requested), the revenue is, inter alia, dependent on the
amount. The aforementioned issue is even reinforced by the asymmetric information (in the case
of debt: information gap between lender and borrower – and the availability (and quality) of
information about smaller – and in particular younger – enterprises is typically even worse than for
the bigger and more established companies), combined with uncertainty, which causes agency
problems that affect debt providers´ behaviour (see Akerlof, 1970, Jaffee and Russell, 1976,
Stiglitz and Weiss, 1981, and Arrow, 1985).41
This results in an insufficient supply of credit (an
analogue argumentation is valid for equity financing), which can be particular true in the case of
SME financing (OECD, 2006).42
Information asymmetries exist to a lesser degree if a strong relationship between lender and
borrower has been established which makes the borrower well aware of what information needs
to be provided, including the extent of collaterals required (support in this regard is also given by
third parties like, for instance, chambers and guarantee societies), and that enable the lender to
know well not only the hard but also the soft facts of the borrower. Thus, through due
diligence/lenders’ examination (screening), and by a firm’s ability to signal its credit worthiness
(incl. an institutional assessment or rating by an independent agency and the provision of
collateral, also in form of a guarantee), information asymmetries can be reduced. However, this
means that new or young firms, with a lack of collateral and, by definition, without a track record,
are the ones with the greatest degree of difficulty in accessing debt capital. These financing
obstacles can also negatively affect productivity in the economy.
Guarantee mechanisms, “whereby should the borrower default the guarantor compensates a pre-
defined share of the outstanding loan” (OECD, 2014b), are a commonly used response to these
kinds of market failures, as guarantees reduce the risk of lenders and favour the provision of
financing to viable businesses that are constrained in their access to finance. Credit guarantee
schemes “are used widely across economies as important tools to ease financial constraints for
SMEs and start-ups” (OECD, 2013), and in order to alleviate market failures in SME financing.
Moreover, loan guarantee programs expanded substantially in the years 2007-2011, as a
government policy response to the financial crisis. In addition, “new elements were added to some
of these programmes, such as reduced red tape and more rapid provision (i.e. ‘express
guarantees’ [in Belgium]), and new instruments were created outside traditional guarantee
41
Agency theory/the principal-agent approach is often applied in economic literature for analysing relation-
ships between lenders and borrowers (e.g. contract design, selection process, credit constraints, etc.).
42
Stiglitz and Weiss (1981) argued that under certain circumstances credit rationing can be rational for
banks.

46
programmes” (OECD, 2014b). Therefore, loan guarantee programs continue to be “the most
widely used instrument at goverments’ disposal to ease SME access to finance” (OECD, 2015).
Referring to the countries in Central, Eastern and South-Eastern Europe (CESEE), the Working
Group on Credit Guarantee Schemes (CGSs) in CESEE, established under the European Bank
Coordination Initiative (Vienna Initiative 2) undertook in 2014 an analysis of the role of SME
Credit Guarantee Schemes in the respective region (VIWGCGS, 2014). The findings and
conclusions are in line with other studies (e.g. OECD, 2013 and 2014b) and emphasize the
importance of and the strong demand for SME CGSs in the region. Moreover, best practices for
the design and operational characteristics of schemes have been identified that can be
generalised as well for other parts of Europe.
In the context of this work, a sub-project concerning measuring the economic additionality of
CGSs has been performed, using a specific guarantee programme (MAP, Multi Annual
Programme for Enterprise and Entrepreneurship) that has been financed by the European
Commission and implemented by the EIF. This sub-project found, inter alia, positive effects on the
number of employees (at the level of the companies, benefitting from the guarantees), as well as
positive effects on the total factor productivity. This sub-project will be presented in detail in a
forthcoming joint working paper of the European Commission and EIF, which is summarised in
Box 8 below.
Box 8: The economic impact of EU guarantees on credit to SMEs: evidence from CESEE
countries43
The use of Public Credit Guarantee Schemes (PCGSs) is particularly widespread, across both
OECD and non-OECD economies, as a direct policy tool to alleviate SMEs’ financial distress,
and has recently intensified to address the repercussions of the financial crisis on financial and
product markets. Estimates by OECD (2015) on 14 EU members indicate an amount of –
certainly underestimated – around 200 billion provided to SMEs in 2007-2013, capable of
generating a tenfold amount of financing.
Yet despite its policy relevance, SME financial support in general, and credit guarantee schemes in
particular, have hardly been the subject of rigorous academic research, partly due to data
scarcity. Consequently, policy makers across the EU lack a reliable impact assessment of these
programmes on final SME beneficiaries. The problem is not peregrine: the credit guarantee policy
has been sometimes criticised for failing to reach its target groups (SMEs), and particularly in a
slow growth period in the EU, national and European institutions bear the responsibility of
focusing on the most effective support measures to ensure tangible added value and efficient use
of taxpayers’ money.
The study carried out by Asdrubali and Signore (2015, forthcoming), a joint European
Commission and EIF working paper, aims to fill this gap. The authors performed an impact
assessment of the EU SME Guarantee Facility (SMEG)'s loan window under the Multi-Annual
Programme for Enterprise and Entrepreneurship, and in particular for Small and Medium-sized
Enterprises (MAP), focussing their attention on CESEE countries' beneficiaries.
43
This text box was written by Simone Signore from EIF’s Research & Market Analysis team.

47
Box 8 continued:
Their paper combines propensity scores and difference-in-differences estimation in order to
evaluate the effect of having received a MAP-guaranteed SME loan on firm performance
(employment, production, profitability and factor productivity) against a control group of
comparable firms. Results offer several insights: the EU SME Guarantee Facility in the CESEE
region had, on average, a significant positive effect on firms’ employment: beneficiary firms were
able to increase their workforce by 17.3%, compared to the control groups, within the first 5 years
following the issuance of the guaranteed loan. Moreover, by the fifth year after the signature date,
the turnover of MAP beneficiaries had increased by 19.6%, compared to non-beneficiary
companies. MAP beneficiaries also faced a temporary setback in productivity, with respect to their
peers, an effect that could be due to allocative inefficiencies following the MAP-induced increase
in their production factors. Such gap was, however, partially absorbed over the medium run.
By breaking down the sample by country, signature year, size and age classes, the authors find
that micro and young SMEs have benefited the most from MAP-guaranteed loans in terms of
economic additionality. Overall, findings suggest that the EU SME Guarantee Facility has been
successful in bringing significant positive effects on beneficiary firms in CESEE Countries.
Market information concerning CGS in Europe is gathered by AECM, the European Association of
Guarantee Institutions.44
These data covers SME guarantees and counter-guarantees provided by
AECM members (in the case of counter-guarantees, the – typically public – counter-guarantor
takes over the risk from the guarantor, up to a predefined share of the guarantee. See Kraemer-
Eis, Lang and Gvetadze, 2013a, and OECD, 2013). In the following we provide information
about the countries with at least one AECM member to show the state and development of this
important market segment.
Market size
Key figures, based on outstanding guarantees on SME loan portfolios as at 31.12.201445
, are
presented in Table 3. In terms of total amounts of guarantee and counter-guarantee activities, the
core countries are Italy (EUR 33.4bn), France (EUR 18.1bn), Germany (EUR 5.8bn), Turkey (EUR
5.1bn) and Spain (EUR 4.4bn). Italy also has the highest total number of outstanding guarantees
(1,057,470), followed by: France (742,744), Turkey (318,880), Poland (242,273) and Portugal
(81,621). The total number of SME beneficiaries in the portfolios of the AECM members
amounted to almost 2.6m.
44
We thank our colleagues from AECM for their support. AECM has currently 41 members in 20 EU
Member States plus Bosnia and Herzegovina, Kyrgyzstan, Russia, and Turkey. EU countries without an
AECM member are Cyprus, Denmark, Finland, Ireland, Malta, Slovakia, Sweden and the UK, even if
guarantee activities exist. In the AECM member countries, the AECM members cover all or almost all SME
guarantee activity. Some AECM members are national associations or networks and thus have their own
member organisations. AECM has purely private, mutual, public, and public-private mixed members.
Source: AECM.
45
For data availability reasons, AECM statistics include the business figures of the largest Italian AECM
member with a time lag of one year. For similar reasons, older data were used for AECM members from
Poland, Slovenia and one Belgian member. These disclaimers apply as well for the diagrams and tables
presented throughout this chapter.

48
Table 3: Outstanding guarantees and counter-guarantees46
on SME47
loan portfolios48
and
resulting average guarantee size in 201445
by country
Source: AECM (provisional figures)
Compared to the value of economic activity, guarantees are relatively important (measured by the
volume of outstanding guarantees in portfolio as a percentage of GDP) in Italy (2.1%), Portugal
(1.7%), Lithuania (1.4%), Hungary (1.3%) and Romania (1.1%), as shown in Figure 28.49
According to the OECD (2013), guarantees are particularly relevant “in those countries where a
network of local or sectoral guarantee institutions is well established”.
46
In Romania and Slovenia, some AECM members provide counter-guarantees to other AECM members; in
these cases, the summing-up of guarantee and counter-guarantee activities leads to a double-counting of
the underlying guaranteed loans. However, for consistency of the data shown in the table, these were not
cleaned accordingly. 47
In the case of France, the counter-guarantee data include co-guarantees. These can also cover non-SME
related areas such as regional infrastructure and municipality financing. In the case of Austria, project-
related guarantees, which can also cover non-SME financing, are included since 2014. 48
In the case of some AECM members, guarantees or counter-guarantees cover portfolios of loans or
guarantees; however, in most cases, they cover single/individual loans/guarantees. 49
Here and in the following, all figures include guarantee, counter- and co-guarantee activities.
Country
Volume
[k EUR]
Number
Average
guarantee
size
[k EUR]
Volume
[k EUR]
Number
Average
guarantee
size
[k EUR]
Volume
[k EUR]
Number
Average
guarantee
size
[k EUR]
Austria 828,622 5,717 144.9 828,622 5,717 144.9
Belgium 761,332 10,488 72.6 736,573 8,942 82.4 24,759 1,546 16.0
Bosnia-Herzegovina 8,072 64 126.1 8,072 64 126.1
Bulgaria 108,182 1,234 87.7 107,299 1,218 88.1 883 16 55.2
Czech Rep. 645,627 7,044 91.7 645,627 7,044 91.7
Croatia 160,734 1,416 113.5 160,734 1,416 113.5
Estonia 115,550 1,262 91.6 115,550 1,262 91.6
France 18,139,706 742,744 24.4 17,281,482 692,990 24.9 858,224 49,754 17.2
Germany 5,761,025 48,199 119.5 5,761,025 48,199 119.5
Greece 245,810 7,673 32.0 245,810 7,673 32.0
Hungary 1,358,055 42,276 32.1 1,318,062 42,223 31.2 39,993 53 754.6
Italy 33,399,702 1,057,470 31.6 20,078,000 941,075 21.3 13,321,702 116,395 114.5
Kyrgyz Rep. 448 317 1.4 448 317 1.4
Latvia 98,024 454 215.9 98,024 454 215.9
Lithuania 508,376 7,150 71.1 213,616 3,739 57.1 294,760 3,411 86.4
Luxembourg 917 41 22.4 917 41 22.4
Netherlands 1,911,428 18,301 104.4 1,911,428 18,301 104.4
Poland 2,009,137 242,273 8.3 1,925,858 234,857 8.2 83,279 7,416 11.2
Portugal 2,934,500 81,621 36.0 2,934,500 81,621 36.0
Romania 1,598,484 21,153 75.6 1,453,011 16,750 86.7 145,473 4,403 33.0
Russia 132,993 1,601 83.1 132,993 1,601 83.1
Spain 4,350,377 30,903 140.8 4,350,377 30,903 140.8
Slovenia 230,506 2,053 112.3 230,215 2,007 114.7 291 46 6.3
Turkey 5,145,991 318,880 16.1 5,145,991 318,880 16.1
Total 80,453,598 2,650,334 30.4 65,684,233 2,467,294 26.6 14,769,364 183,040 80.7
Guarantee and counter-guarantee Guarantee activity Counter-guarantee activity

49
Figure 28: Volumes of outstanding guarantees in portfolio scaled by GDP, 2014 data
Source: AECM (provisional figures).
The guarantee activity in 2014 was strongest, related to GDP, in Hungary, Lithuania, Romania,
Poland, Portugal and Italy (see Figure 29).
Figure 29: Volumes of guarantees granted in 2014 scaled by GDP
Source: AECM (provisional figures).
0.25
0.2
0.26
0.40.4
0.6
0.8
0.2
0.1
1.3
2.1
0.4
1.4
0.002
0.3
0.5
1.7
1.1
0.011
0.4
0.6
0.8
0.0
0.5
1.0
1.5
2.0
Austria
Belg
ium
Bulg
aria
Czech Rp
Croatia
Esto
nia
France
Germ
any
Greece
Hungary
Italy
Latv
ia
Lithuania
Luxem
bourg
Neth
erla
nds
Pola
nd
Portu
gal
Rom
ania
Russia
Spain
Slo
venia
Turkey
%
0.02
0.06
0.130.15
0.09
0.35
0.28
0.05
0.0023
1.03
0.57
0.16
0.71
0.0006
0.06
0.600.58
0.66
0.0055
0.09
0.23
0.41
0.0
0.2
0.4
0.6
0.8
1.0
1.2
Austria
Belg
ium
Bulg
aria
Czech Rp
Croatia
Esto
nia
France
Germ
any
Greece
Hungary
Italy
Latv
ia
Lithuania
Luxem
bourg
Neth
erla
nds
Pola
nd
Portu
gal
Rom
ania
Russia
Spain
Slo
venia
Turkey
%

50
Market activity in 2014
Guarantees outstanding
In 2014, according to preliminary AECM data, the total volume of outstanding guarantees and
counter-guarantees in portfolio, increased by 5%, compared to the previous year. At the same
time, the number of outstanding guarantees and counter-guarantees reported by AECM increased
by 22%.
The observed development, which was more favourable for the number of guarantees than for the
total volume, is reflected in the average guarantee size. After the beginning of the financial crisis,
the AECM statistics had shown an upturn from EUR 34.1k in 2008 to EUR 40.2k in 2011. Since
then, the value dropped backed again towards the levels reached in prior years. In 2014, the
average guarantee size has further decreased to EUR 30.4k.
These developments can be explained by an increase of guarantees with smaller amounts, due to
smaller underlying loan sizes because of lower investments, as well as of short-term guarantees
(i.e. working capital loan guarantees, which have in general smaller amounts, and bridge-
financing guarantees, e.g. for the extension of an already provided guarantee). Short-term
guarantees generally (for the AECM members) cover less than 12 months. In addition to this
development, according to AECM, some members are faced with growing requests to increase
the guarantee duration of already incurred guarantee commitments, because of SMEs’ financing
constraints, which lead to requests to reschedule loan repayments.
The volume of new guarantees provided per year was reported to be at the level of EUR 27.2bn in
2014 (EUR 24.5bn of guarantee activity plus EUR 2.7bn of counter-guarantee activity). In terms of
numbers, 657,677 new guarantees were issued in the course of 2014. AECM members
supported almost 320k new SME50
beneficiaries in 2014.
Drivers of the developments in guarantee business
The developments in SMEs guarantee transactions are, on the one hand, caused by special items
in particular countries, while on the other, they seem to mirror the specific macro- and micro-
economic situation in the different economies. Those countries that suffer relatively strongly from
the current sovereign debt crisis and experience weak economic growth – or even a fall in
economic activity – also show poor developments in guarantee transactions. This seems to be
driven by both demand and supply side factors. In times of the weak growth of economic output,
SMEs business, investments, the related need for finance, and, hence, their implied demand for
guarantees – are all low. At the same time, in some countries, tightening restrictions on public
50
Number of SMEs (in case of rural guarantees including farmers) related to the new amount of guarantees
(including counter- and co-guarantees, and including guarantees for agricultural businesses) or number of
new SME partners of guarantee institutions per year.

51
budgets and high financial risk perceptions are weighing heavily on guarantee supply.
Consequently, public support on the European level, as typically provided through the EIF, could
improve the situation, if only on the supply side. In some countries, e.g. Germany, the weak
development of guarantees has also been explained by relatively favourable financing conditions,
and so lesser need for guarantees, following the large increases in guarantee demand observed
during the crisis years of 2009-10 (VDB, 2012). Hence, in some countries, the downturn in
guarantee business mirrors a development towards the levels prevalent before the crisis.
EIF’s role and recent developments
In order to alleviate problems experienced by SMEs in accessing finance, EIF is playing an
important counter-cyclical role. Through a wide range of financial intermediaries, such as banks,
leasing companies, guarantee funds, mutual guarantee institutions, promotional banks, and other
financial intermediaries, EIF can effectively provide both financing to SMEs and guarantees for
SME financing. Apart from EIF guarantees for securitised SME financing instruments (see chapter
5.2), EIF offers guarantees/counter-guarantees for portfolios of micro-credits, SME loans or
leases.
EIF manages several mandates on behalf of the EIB, the European Commission (EC) and national
and regional Managing Authorities. Among the EC mandates, the EIF manages the Loan
Guarantee Facility (LGF) under the Programme for the Competitiveness of Enterprises and Small
and Medium-sized Enterprises (COSME) and the InnovFin SME Guarantee Facility under Horizon
2020. Both facilities are windows of the Single EU Debt Financial Instrument, which is financially
supported by COSME and Horizon 2020 in order to support growth, research and innovation of
European enterprises. Guarantees play as well an important role in the Investment Plan for Europe
– also called the Juncker Plan. We cover this topic in the concluding remarks at the end of this
document.
Through COSME LGF, EIF offers guarantees and counter-guarantees, including securitisation of
SME debt finance portfolios, to selected financial intermediaries (e.g. guarantee institutions,
banks, leasing companies, loan/debt funds51
etc.) to help them provide more loans and leases to
SMEs. By sharing the risk, COSME guarantees allow the financial intermediaries to expand the
range of SMEs they can finance, facilitating access to debt finance for many SMEs which might be
having difficulties in accessing the traditional banking system. Until May 2015, 8 agreements have
been signed in 6 different countries enabling SME financing up to EUR 2.6bn. COSME LGF is a
successor to the SME Guarantee Facility (SMEG), successfully implemented by EIF, on behalf of
the EC, under the Competitiveness and Innovation Framework Programme (CIP) in the period
2007-2013.52
Until December 2014, more than 367,000 SMEs were supported under CIP
SMEG, and 73 agreements with 57 intermediaries were signed in 24 countries. The loan amount
that CIP SMEG has so far generated for SMEs was in the order of EUR 19.3bn.
51
See Kraemer-Eis (2014) for more information on institutional non-bank lending and the role of Debt
Funds.
52
Source: EIF. For more information on the COSME LGF see http://www.eif.org/what_we_do/guarantees/
single_eu_debt_instrument/cosme-loan-facility-growth/index.htm. For more information on the CIP SMEG
see http://www.eif.org/what_we_do/guarantees/cip_portfolio_guarantees/index.htm.
52
The InnovFin SME Guarantee Facility is part of “InnovFin – EU Finance for Innovators”, an
initiative launched by the EC and the EIB Group in the framework of Horizon 2020. EIF, acting as
the implementing body, covers a portion of the losses incurred by the financial intermediaries on
loans, leases and guarantees. In this way, the EU and EIF allow the provision of more debt
financing to research-based and innovative SMEs and small mid-caps (up to 499 employees).
Until May 2015, 13 agreements have been signed in 12 different countries enabling SME
financing up to approximately EUR 1.8bn. The InnovFin SME Guarantee Facility builds on the
success of the Risk Sharing Instrument (RSI), developed under FP7, the 7th EU Framework
Programme for Research and Technological Development (2007-2013), managed and
implemented by EIF. The RSI Facility for Innovative and Research oriented SMEs and small Mid-
Caps had been launched in 2011. It was an EIF/EIB/European Commission joint pilot guarantee
scheme that aimed at improving access to debt finance for innovative SMEs and small mid-caps.
RSI complemented the scope of the Risk Sharing Finance Facility (RSFF), which has been managed
by the EIB and has mainly addressed large corporates. RSI proved that it could address current
market needs and was speedily introduced to financial intermediaries with absorption and
deployment to SMEs following swiftly. As of December 2014, 40 operations (including 4
increases) with 36 different intermediaries in 18 countries had been signed, totalling
approximately EUR 1.6bn, which enables SME financing of up to EUR 3.3bn. So far EUR 1.3bn of
financing has effectively been provided to 2,353 SMEs and small mid-caps in 2,625 transactions.
Moreover, EIF continues to deploy its financial products in order to catalyse European Structural
and Investment Funds. In doing so, EIF capitalises on its experience with JEREMIE (Joint European
Resources for Micro to Medium Enterprises), a joint initiative developed by the European
Commission in co-operation with the EIB Group and other financial institutions to enhance
cohesion across the EU in the 2007-2013 programming period. JEREMIE was developed with a
view to enabling SME financing in countries less supported by “traditional” EIF products, namely
risk-sharing loans and portfolio guarantee instruments under JEREMIE53
. Under the JEREMIE First
Loss Portfolio Guarantee (FLPG), EIF has covered part of the credit risk relating to a new portfolio
of loans and/or leases granted by a financial intermediary to SMEs. Moreover, EIF has further
implemented risk-sharing loan products, the Portfolio Risk Sharing Loan (PRSL), and the Funded
Risk Sharing Product (FRSP), whereby EIF has provided funding to banks for the financing of new
portfolios of SME loans (such loans to be co-financed by the financial institutions), and has shared
part of the credit risk related to the portfolios. As at November 2014, the impact, based on these
products, is about to reach a total SME portfolio originated of almost EUR 1.8bn.
Looking forward, EIF has been entrusted with a dedicated EIB Group Risk Enhancement Mandate
(EREM; we had given a more detailed overview in Kraemer-Eis, Lang, and Gvetadze, 2014a),
which will encourage further SME lending in the EU. EREM is a facility of up to EUR 6bn (EUR 4bn
from EIB supplemented by EUR 2bn from EIF) that will back, inter alia, additional guarantees to
be issued by EIF over the next seven years.
53
The JEREMIE initiative offered EU Member States, through their national or regional Managing Authorities,
the opportunity to use part of their EU Structural Funds to finance SMEs by means of equity, loans or
guarantees, through a revolving Holding Fund acting as an umbrella fund. A JEREMIE Holding Fund
could provide to selected financial intermediaries SME-focused financial instruments, including
guarantees, co-guarantees and counter-guarantees, equity guarantees, (micro) loans, export-credit
insurance, securitisation, venture capital, Business Angel Matching Funds and investments in Technology
Transfer funds. For more information see: http://www.eif.org/what_we_do/resources/jeremie/index.htm

53
In general, it is the objective to increase coherence and consistency of the instruments. While
EREM is more to be seen as a special measure to fight the crisis, the EU level instruments are
mainly meant to mitigate the structural weaknesses in SME lending.
Another instrument to alleviate the impact of the crisis on SME lending is in the course of being
implemented: the EU SME Initiative. Its objective is to achieve an increase in the volume of lending
to SMEs. The concept of this initiative derives from the experiences of the existing programmes. Its
overall aim is to combine the resources available from the EU (COSME and Horizon 2020), the
EIB Group (EIB and EIF), third parties and the Member States (European Structural and Investment
Funds, ESIF) to achieve rapid and significant impact. Spain has been the first country to implement
this new EU initiative, contributing an amount of EUR 800 million out of its European Structural
and Investment Funds. This amount will be leveraged with commercial lending through a risk
sharing mechanism, so that more SMEs will benefit from European resources on advantageous
terms. It is expected that at least EUR 3.2 billion of new SME financing will be supported under
this programme in Spain (see EIF, 2015b)54
.Moreover, a Cultural and Creative Sectors guarantee
facility (under the Creative Europe Programme) is under development for roll-out in 2016.
Many of EIF’s guarantee products are also available for leasing providers as leasing is an
important financing tool for SME. We provide background information about SME leasing in the
following Box.
Box 9: The use of leasing among European SMEs55
In this box, we present key findings from the report “The Use of Leasing Amongst European SMEs”
(Oxford Economics, 2015), which was prepared for Leaseurope, the European Federation of
Leasing Company Associations. The report is an update of an earlier issue (Oxford Economics,
2011), of which we had presented the results in detail in two publications (see Kraemer-Eis and
Lang, 2012 and 2014). The 2015 survey was conducted among 2,950 SMEs from 8 European
countries and 9 industries over September/October 2014.
The results of the survey show that 42.5% of all SMEs used leasing in 2013 (compared to 40.3%
in 2010) demonstrating that leasing is an increasingly vital source of finance for many of these
firms in Europe, in particular for micro and small enterprises. SMEs expected a further increase in
their use of leasing for 2014. SME access to bank loans also grew in 2013 after experiencing
significant constraints during the financial crisis, while leasing use remained relatively stable over
that time. The main reason to choose leasing was a perceived better price than that of other
financing forms.
The survey also reveals that the use of leasing varies more by country than by sector. In fact, the
proportion of Dutch, French and German SMEs’ use of leasing increased notably since 2010,
while Spanish and Italian firms’ use declined. The use of leasing among Polish, Swedish and
British firms has remained fairly stable since 2010.
54
More information on the SME Initiative in Spain can be found here
http://www.eif.org/what_we_do/guarantees/sme_initiative/smei_spain/index.htm.
55
Source: Oxford Economics and Leaseurope (2015) and Leaseurope.

54
Box 9 continued:
Of those SMEs that did not use leasing in 2013, 26% reported using it in the past. Micro-
enterprises and countries which suffered more from the crisis (Spain and Italy, in this sample)
exhibited the largest shares of such “former lessees”. SMEs in these countries also reported a
generally lower use of leasing in 2013 than in 2010.
SMEs use leasing to finance a greater portion of their investment than larger businesses. In 2013,
SMEs financed 18.9% of their total investment via leasing, up from 16.7% in 2010. Penetration
rates grew across all SME size classes, with micro firms posting the largest increase. SMEs
expected leasing penetration rates to rise in 2014, while the penetration rates were expected to
decline for cash/equity and all forms of bank lending. Leasing penetration rates for SMEs in
France, Germany, Poland and the UK were high at between 20-30% in 2013. The UK and
Germany, having large well performing leasing markets, and Poland, with a relatively young but
high growth leasing sector, saw substantial increases in SME penetration rates since 2010. On the
other hand Italy and Spain saw large declines during this time period.
SMEs lease an extremely broad range of assets, indicating that almost all types of goods can be
financed by leasing. According to the survey, in 2013, vehicles remained the most frequently
leased asset type across all countries and economic sectors compared to 2010 and together with
machinery and industrial equipment dominated SME’s total equipment leasing expenditure.
According to the survey, lessees invested, on average, more than twice the amount of non-lessees.
Lessees are also more likely to be exporters and/or growth SMEs than non-lessees. The share of
companies that expected to invest more in 2014 than in 2013 was larger among those
companies that had used leasing in 2013 than among the non-lessees.
Oxford Economics (2015) estimates that at the EU level leasing was responsible for financing
around EUR 104bn of SME investment in fixed assets in 2013 and was expected to finance nearly
EUR 121bn in 2014, with medium-sized and micro enterprises contributing a larger amount than
companies in the “small” size class.

55
5.2 SME Securitisation
European SMEs depend very much on bank financing (see Figure 30). ECB president Mario
Draghi mentioned in an often quoted statement that “in the United States 80% of credit
intermediation goes via the capital markets. […] In the European situation it is the other way
round. 80% of financial intermediation goes through the banking system” (Draghi, 2013).
Figure 30: Reliance on bank financing by non-financial corporations (in %)
Source: Authors, based on IMF (2012) and updated information for 2014.
As outlined in more detail in Kraemer-Eis (2014), this ratio is moving towards more capital market
action: Cour-Thimann and Winkler (2013) state that external financing of the non-financial
corporate sector (financing other than retained earnings) is dominated by bank financing (in the
euro area). However, as the authors point out, this split refers to the stock - in terms of flows the
figures fluctuate significantly; in particular as the corporate sector can to some extent substitute
bank lending with other sources of finance. This possibility exists for SMEs only to a very limited
extent. During the crisis part of the declining bank lending was offset by an increase in capital
market funding (see Figure 31): debt securities issued by corporations (but also quoted shares
issued) increased. But, “such substitution is primarily possible for large corporations; it is less so
for small and medium-sized firms, which constitute the bulk of employment and activity in the euro
area” (Cour-Thimann and Winkler, 2013).
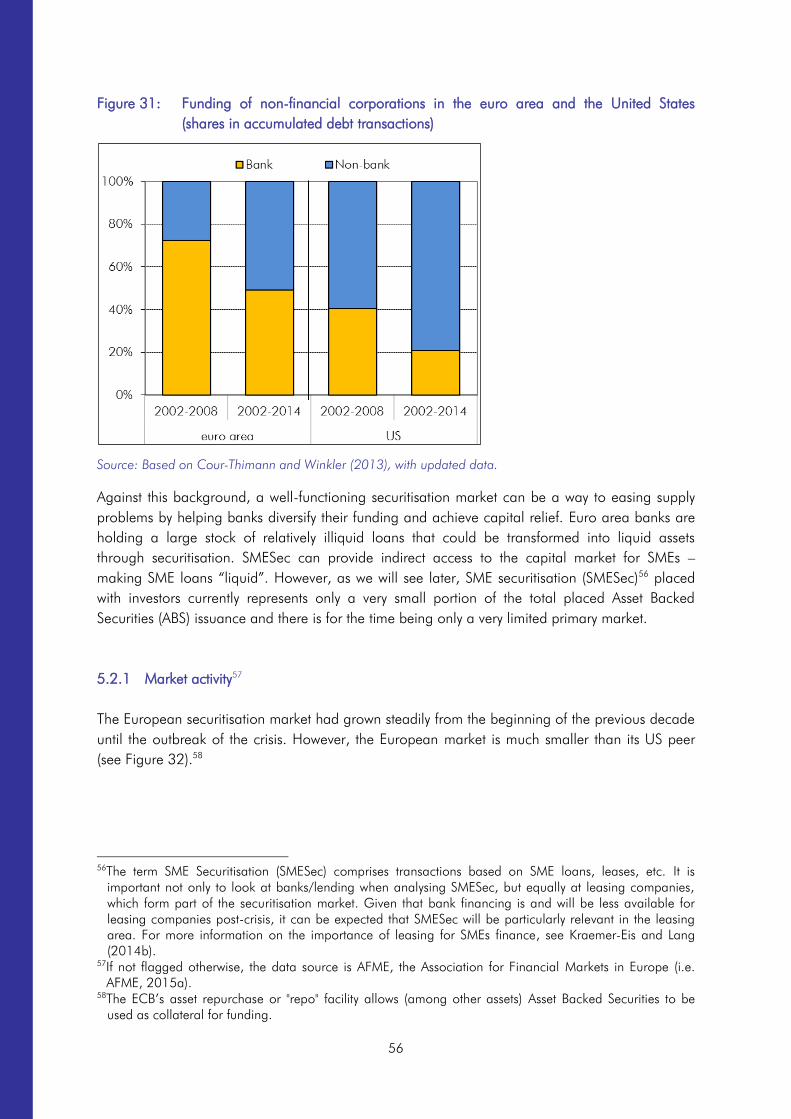
56
Figure 31: Funding of non-financial corporations in the euro area and the United States
(shares in accumulated debt transactions)
Source: Based on Cour-Thimann and Winkler (2013), with updated data.
Against this background, a well-functioning securitisation market can be a way to easing supply
problems by helping banks diversify their funding and achieve capital relief. Euro area banks are
holding a large stock of relatively illiquid loans that could be transformed into liquid assets
through securitisation. SMESec can provide indirect access to the capital market for SMEs –
making SME loans “liquid”. However, as we will see later, SME securitisation (SMESec)56
placed
with investors currently represents only a very small portion of the total placed Asset Backed
Securities (ABS) issuance and there is for the time being only a very limited primary market.
5.2.1 Market activity57
The European securitisation market had grown steadily from the beginning of the previous decade
until the outbreak of the crisis. However, the European market is much smaller than its US peer
(see Figure 32).58
56
The term SME Securitisation (SMESec) comprises transactions based on SME loans, leases, etc. It is
important not only to look at banks/lending when analysing SMESec, but equally at leasing companies,
which form part of the securitisation market. Given that bank financing is and will be less available for
leasing companies post-crisis, it can be expected that SMESec will be particularly relevant in the leasing
area. For more information on the importance of leasing for SMEs finance, see Kraemer-Eis and Lang
(2014b).
57
If not flagged otherwise, the data source is AFME, the Association for Financial Markets in Europe (i.e.
AFME, 2015a).
58
The ECB’s asset repurchase or "repo" facility allows (among other assets) Asset Backed Securities to be
used as collateral for funding.
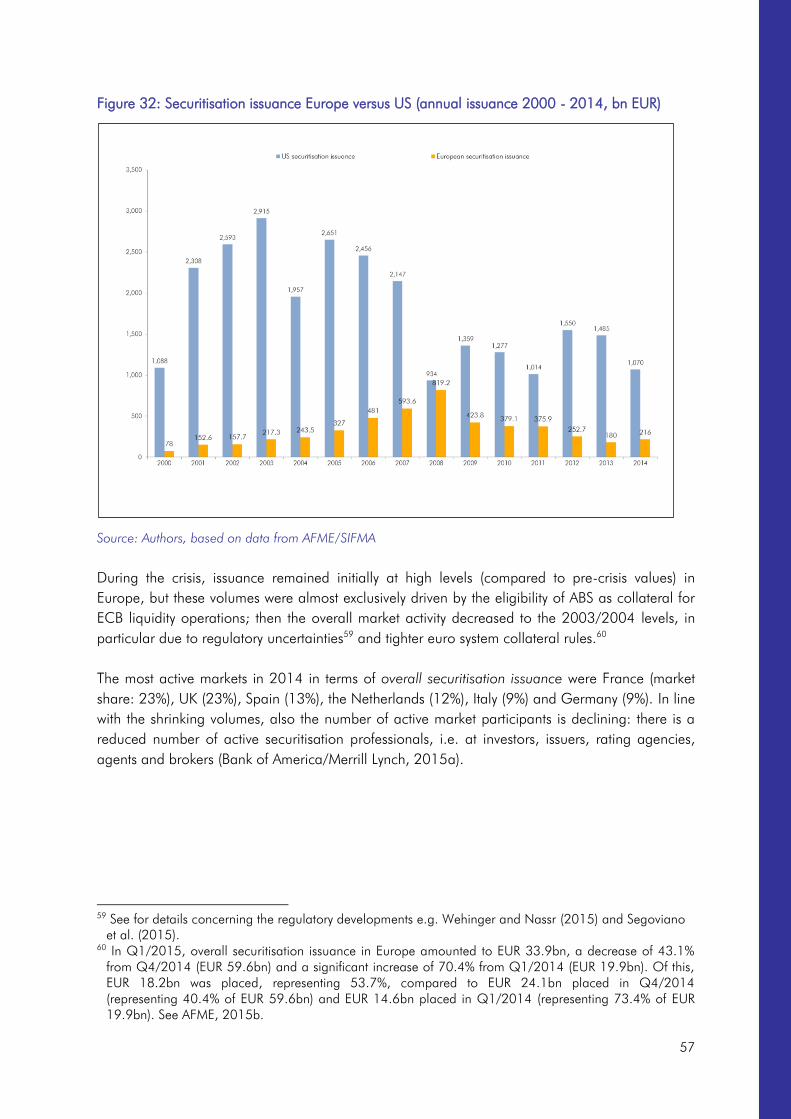
57
Figure 32: Securitisation issuance Europe versus US (annual issuance 2000 - 2014, bn EUR)
Source: Authors, based on data from AFME/SIFMA
During the crisis, issuance remained initially at high levels (compared to pre-crisis values) in
Europe, but these volumes were almost exclusively driven by the eligibility of ABS as collateral for
ECB liquidity operations; then the overall market activity decreased to the 2003/2004 levels, in
particular due to regulatory uncertainties59
and tighter euro system collateral rules.60
The most active markets in 2014 in terms of overall securitisation issuance were France (market
share: 23%), UK (23%), Spain (13%), the Netherlands (12%), Italy (9%) and Germany (9%). In line
with the shrinking volumes, also the number of active market participants is declining: there is a
reduced number of active securitisation professionals, i.e. at investors, issuers, rating agencies,
agents and brokers (Bank of America/Merrill Lynch, 2015a).
59
See for details concerning the regulatory developments e.g. Wehinger and Nassr (2015) and Segoviano
et al. (2015).
60
In Q1/2015, overall securitisation issuance in Europe amounted to EUR 33.9bn, a decrease of 43.1%
from Q4/2014 (EUR 59.6bn) and a significant increase of 70.4% from Q1/2014 (EUR 19.9bn). Of this,
EUR 18.2bn was placed, representing 53.7%, compared to EUR 24.1bn placed in Q4/2014
(representing 40.4% of EUR 59.6bn) and EUR 14.6bn placed in Q1/2014 (representing 73.4% of EUR
19.9bn). See AFME, 2015b.

58
SMESec issuance is still suffering from the crisis, however the overall issued volume of SME deals
in 2014 (EUR 33.3bn) was already significantly higher than in 2013 (see Figure 33). The market
share of SMESec rose (with some volatility) from 6% in 2001 to 18% (of total yearly issuance) in
2012, the highest value ever registered in Europe. This, however, came about due to the base
effect, as the overall activity went down (while SMESec activity decreased slightly less). In 2014,
the share of SMESec was 15%. During the crisis, also the large volumes of synthetic SMESec
transactions (see also later Box 10 on synthetic securitisations), that were evidenced pre-2007 on
SME portfolios dominated primarily by German SMEs on the back of KfW’s PROMISE program,
virtually disappeared. Rating downgrades, based on revised rating agency criteria (i.e.
counterparty and country ceiling criteria, without grandfathering), on downgrades of
counterparties involved in the transactions, and on negative credit trends, contributed to the
overall negative market sentiment.
Figure 33: SMESec issuance in Europe (volume and share of total securitisation, bn EUR and %)
Source: Authors, based on data from AFME and own calculation
In terms of countries, the market activity is concentrated: The SME related issuance in 2014
occurred only in the Netherlands (EUR 9.3bn, 28% of SME issuance), Spain (EUR 8.8bn, 26%),
Italy (EUR 5.3bn, 16%), Belgium (EUR 4.1bn, 12%), UK (EUR 4bn, 12%) and Portugal (EUR
1.8bn, 5%) – see as well Figure 34 for an overview of the SMESec issuance by country during the
crisis.
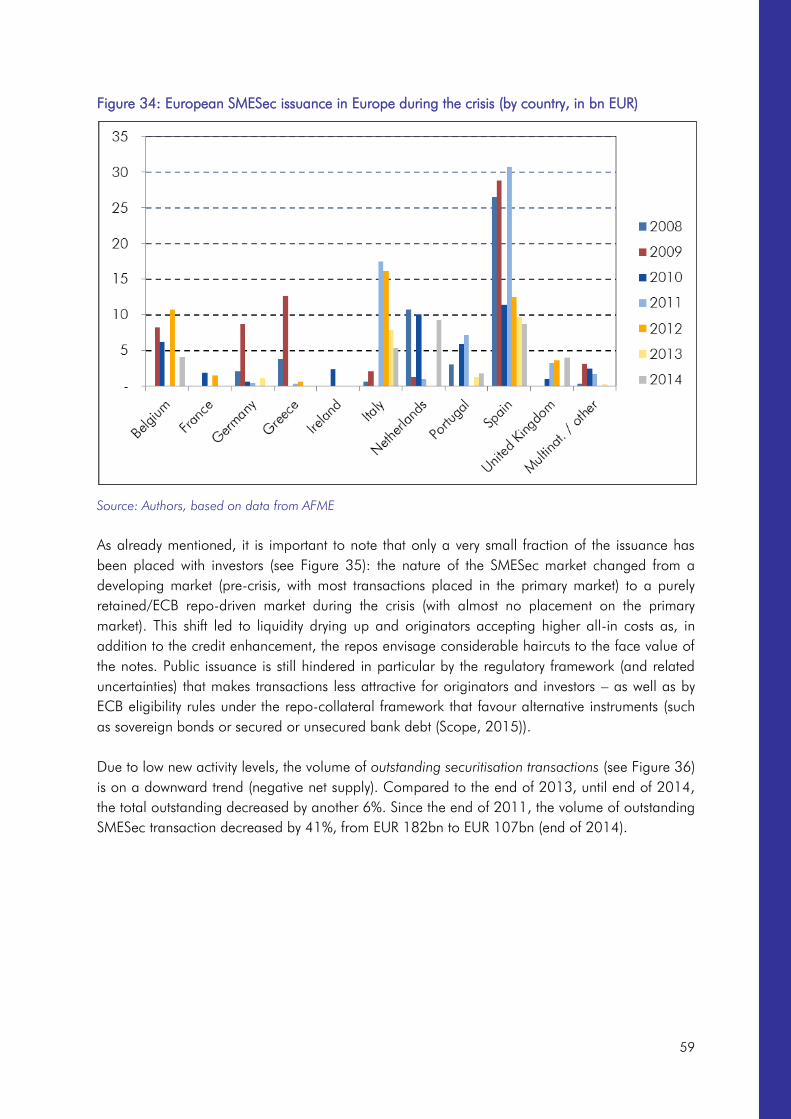
59
Figure 34: European SMESec issuance in Europe during the crisis (by country, in bn EUR)
Source: Authors, based on data from AFME
As already mentioned, it is important to note that only a very small fraction of the issuance has
been placed with investors (see Figure 35): the nature of the SMESec market changed from a
developing market (pre-crisis, with most transactions placed in the primary market) to a purely
retained/ECB repo-driven market during the crisis (with almost no placement on the primary
market). This shift led to liquidity drying up and originators accepting higher all-in costs as, in
addition to the credit enhancement, the repos envisage considerable haircuts to the face value of
the notes. Public issuance is still hindered in particular by the regulatory framework (and related
uncertainties) that makes transactions less attractive for originators and investors – as well as by
ECB eligibility rules under the repo-collateral framework that favour alternative instruments (such
as sovereign bonds or secured or unsecured bank debt (Scope, 2015)).
Due to low new activity levels, the volume of outstanding securitisation transactions (see Figure 36)
is on a downward trend (negative net supply). Compared to the end of 2013, until end of 2014,
the total outstanding decreased by another 6%. Since the end of 2011, the volume of outstanding
SMESec transaction decreased by 41%, from EUR 182bn to EUR 107bn (end of 2014).

60
Figure 35: European SMESec by retention (bn EUR and %)
Source: Authors, based on Wehinger and Nassr (2015) and updated data
Figure 36: European outstanding securitisation transactions by collateral (bn EUR)
Source: Authors, based on data from AFME
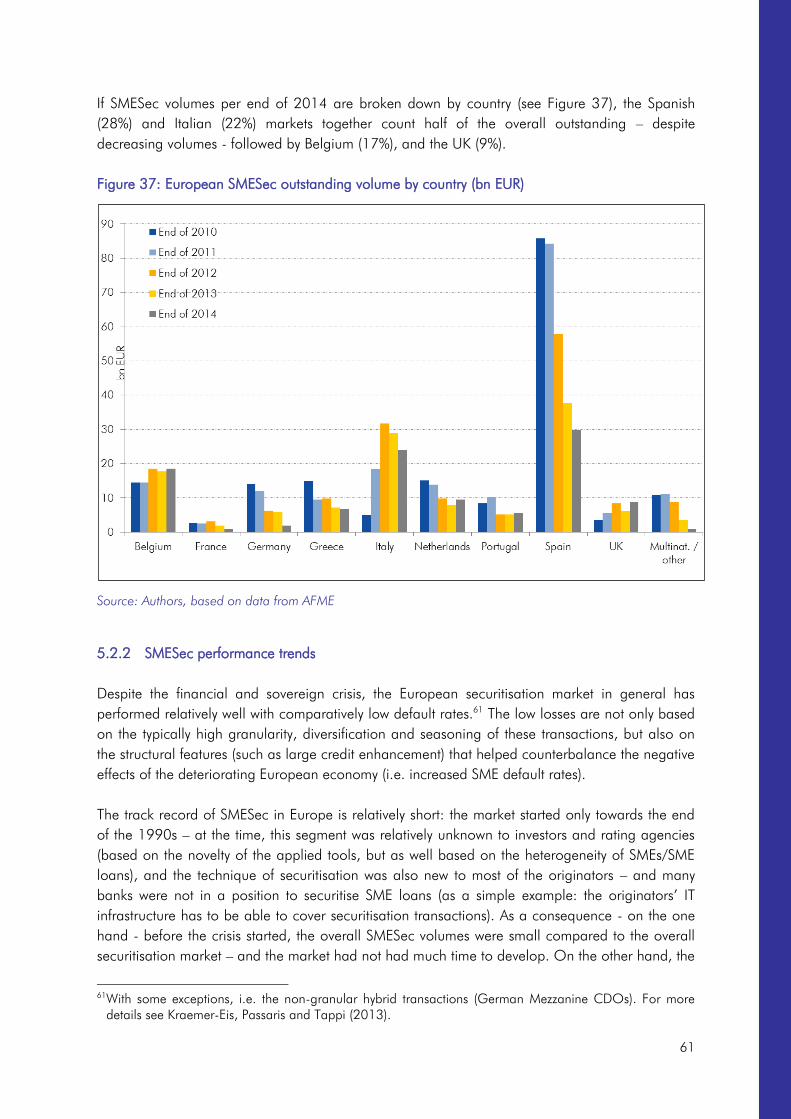
61
If SMESec volumes per end of 2014 are broken down by country (see Figure 37), the Spanish
(28%) and Italian (22%) markets together count half of the overall outstanding – despite
decreasing volumes - followed by Belgium (17%), and the UK (9%).
Figure 37: European SMESec outstanding volume by country (bn EUR)
Source: Authors, based on data from AFME
5.2.2 SMESec performance trends
Despite the financial and sovereign crisis, the European securitisation market in general has
performed relatively well with comparatively low default rates.61
The low losses are not only based
on the typically high granularity, diversification and seasoning of these transactions, but also on
the structural features (such as large credit enhancement) that helped counterbalance the negative
effects of the deteriorating European economy (i.e. increased SME default rates).
The track record of SMESec in Europe is relatively short: the market started only towards the end
of the 1990s – at the time, this segment was relatively unknown to investors and rating agencies
(based on the novelty of the applied tools, but as well based on the heterogeneity of SMEs/SME
loans), and the technique of securitisation was also new to most of the originators – and many
banks were not in a position to securitise SME loans (as a simple example: the originators’ IT
infrastructure has to be able to cover securitisation transactions). As a consequence - on the one
hand - before the crisis started, the overall SMESec volumes were small compared to the overall
securitisation market – and the market had not had much time to develop. On the other hand, the
61
With some exceptions, i.e. the non-granular hybrid transactions (German Mezzanine CDOs). For more
details see Kraemer-Eis, Passaris and Tappi (2013).

62
uncertainty was one of the reasons for the relative conservative structures in the general SMESec
segment – and this led to good SMESec performance in Europe, i.e. compared to other segments
of the securitisation market (and i.e. compared to the US).62
Figures 38 and 39 below show the
cumulative credit events or defaults on original balance by country and by vintage (of the SME
transactions in the EMEA region rated by Moody’s).
Figure 38: EMEA ABS SME loan and lease cumulative credit events or defaults on original
balance (seasoning by country)
Source: Moody's (2015)
62
According to Standard & Poor’s (2014), only 1.58% of European Structured Finance notes (rated by
Standard & Poor’s) outstanding in mid-2007 had defaulted by mid-2014. The cumulative default rate for
SMESec transactions was at 0.55% – for comparison: the cumulative default rate for US Structured
Finance notes was at 19.3%, the one for CDO of ABS was at 41.08%. See also EBA (2014) for an
analysis of historical credit performance of the securitisation market.

63
Figure 39: EMEA ABS SME loan and lease cumulative credit events or defaults on original
balance (seasoning by vintage)63
Source: Moody's (2015)
As explained in more detail in the related EIF working papers, the SMESec market has also been
hit by a wave of downgrades due to weaker (crisis-driven) performance effects in the underlying
portfolios, as well as the rating methodology changes. Typically, AAA tranches show strong rating
stability, but during the crisis also AAA and AA tranches migrated downward. This was mostly
driven by downgrades of the respective country/sovereign ratings, and the limitation by the
country ceilings, or they may be driven by downgrades of (not replaced) counterparties (whose
rating is in turn affected by the respective sovereign ratings).
The rating transition data shows that the downgrade pressure for SME transactions persists across
all tranche levels. The example below (Table 4) shows the rating migration of SME Collateralised
Loan Obligation (CLO) transactions (rated by Fitch, migration since transaction closing). For
example, of all the tranches that have initially been rated AAA, 49% (by number64
) have paid in
full (pif), 10% are still AAA, 16% moved down to AA etc. Meanwhile, there has been very limited
upgrading, but no tranche was upgraded to AAA.
63
Terminated transactions are included in the index calculation. Moody’s believes that this information must
be included for an accurate representation of trends over time. Additionally, Moody’s notes show that
vintage seasoning charts might move unexpectedly for the last few data points, because transactions start
at different points in time within a vintage and, hence, some transactions may be more seasoned than
others. The index includes only the transactions rated by Moody’s.
64
Relative to the number of tranches in a given initial rating category.

64
Table 4: Fitch European SMEs Rating Transition Matrix (May 2015)65
Source: Fitch (2015)
5.2.3 Prospects
In general, a well-functioning securitisation market can be essential in helping financial
intermediaries broaden their funding base, achieve capital relief and ultimately, increase their
SME financing. But overall, the SMESec market in Europe is underdeveloped (AFME and BCG,
2015). There are many advantages of SMESec – for banks, for investors, and – most importantly -
for the SMEs (see for a detailed discussion Kraemer-Eis et al, 2010, Wehinger and Nassr, 2015,
Bank of America/Merrill Lynch, 2015, or Aiyar et al., 2015). At first sight, the advantages are
mainly for banks and investors, but these benefits can channel through to a positive effect on
SME’s access to finance and hence to the SMEs themselves. A recovery and development of the
primary securitisation markets could play a role in unlocking credit supply and economic recovery.
However, this will only be to the benefit of SMEs if the freed-up capital / fresh liquidity is going to
be used to finance the real economy (i.e. for new SME lending).
A compelling case can be made for public assistance to enhance access to finance for SMEs
(market failure based on information asymmetries, high transaction costs, and spill-overs –
exacerbated by the credit crunch in many economies associated with the financial crisis), and for
supporting the SMESec European market (for details, see Kraemer-Eis, Passaris and Tappi, 2013).
15 years ago, public support in the form of national programmes (e.g. FTPYME in Spain and
PROMISE in Germany) and EIF-support on supranational level already contributed significantly to
the emergence of a European SMESec market. For the re-emergence of a primary European SME
securitisation market official sector support is as well required (Aiydar et al., 2015) – and it could
form an important element in the efforts to enhance access to finance for SMEs in Europe.
In this
context, not only does the supplied volume matter, but the positive signalling effect, triggered by
the public involvement and support, could be equally important. Hence, the EIB Group fully
supports the European Commission's desire to support a sustainable high quality securitisation
market in Europe – as also stated in the context of the establishment of a Capital Markets Union
(CMU).66
65
The addition sf indicates a rating for structured finance transactions.
66
See the EC’s papers concerning “Building a Capital Market Union (European Commission, 2015e, f) and
“An EU framework for simple, transparent and standardised securitisation” (European Commission,
2015a).
P IF AAAsf AAsf Asf BBBsf BBsf Bsf CCCsf CCsf Csf
AAAsf 49% 10% 16% 14% 8% 2% 1% 0% 0% 0%
AAsf 14% 0% 43% 11% 5% 11% 11% 3% 0% 3%
Asf 4% 0% 22% 35% 9% 13% 11% 2% 2% 2%
BBBsf 5% 0% 0% 5% 14% 16% 11% 23% 20% 7%
BBsf 5% 0% 0% 5% 0% 29% 14% 10% 33% 5%
Bsf 0% 0% 0% 0% 20% 40% 0% 0% 40% 0%
CCCsf 0% 0% 0% 0% 0% 0% 0% 20% 30% 50%
CCsf 0% 0% 0% 0% 0% 0% 0% 0% 40% 60%
Csf 0% 0% 0% 0% 0% 0% 0% 0% 0% 0%
Curren t rat i ng
In
itia
l R
atin
gs
% of t ranches

65
This CMU is a long-term project, while the necessary revival of the securitisation market should
happen faster. The EIB Group has maintained its presence and support of the SMESec market
during the whole period of the recent economic turmoil. This has been manifested by the launch
of several initiatives in the securitisation domain, namely (i) the EIB Group ABS Initiative for SMEs,
(ii) the Joint SME Initiative with the European Commission and (iii) securitisation mezzanine risk
cover under the EREM (EIB Group Risk Enhancement Mandate) ABS Credit Enhancement window.
So far, the EIB Group support to the European SME securitisation market amounts to more than
EUR 16bn (EIB purchases of SME related ABS and EIF guarantees for SMESec).
In November last year, the ECB started its Asset Backed Purchase Programme (ABSPP)67
. The
overall objective is to enhance the transmission of the monetary policy, support the provision of
credit to the euro area economy and, as a result, to provide further monetary policy
accommodation. The ECB’s support of the ABS market in general, and the SMESec market in
particular, is a positive step, however, the programme so far has not achieved significant volumes
As per 01.06.2015, EUR 7.21bn have been bought by the ECB (EUR 1.56bn in the primary
market, EUR 5.65 in the secondary market), compared to around EUR 85.11bn under the
Covered Bond Purchase Programme (source: ECB68
). Even though ECB’s activity in the primary
market recently started to rise, the overall market impact of the ABSPP is so far very limited. It is
worth pointing out that as part of the original ABSPP, there was a provision for the purchase by the
ECB of mezzanine tranches of ABS securitisations with an eligible guarantee. As of this moment,
further details of this programme have not been announced and it appears that there has not
been much progress on that front as yet.
In order to revitalise the SMESec market, significant changes to the regulatory environment (i.e.
liquidity risk standards and capital requirements) would be necessary in order to avoid unintended
negative impacts – from both perspectives, issuers and investors. A more holistic view than in the
past is required and regulations should not be introduced with a silo perspective, as this prevents
the ability of the market to develop and start functioning properly again. Strong, but smart
regulation is needed.
Insufficient regulatory differentiation is not the only impediment to SMESec, but it is the main
obstacle. Other issues are (inter alia) the cost of issuance, fragmented national insolvency and
debt enforcement regimes, and the lack of harmonized credit information (see for more details
Aiyar et al., 2015). Banks are generally willing to use securitisation – but given the current market
environment, their interest is not driven by funding demand (as there are cheaper alternatives
available), but by the motivation to achieve regulatory capital relief to boost their capital base and
allow themselves to re-ignite their lending to their respective SME sectors. This is particularly
important for those banks that are allowed by the regulator to use their internal rating models for
purposes of regulatory capital allocation (Internal Rating Based banks). Up until the end of last
year, each securitisation transaction needed to have the approval of the respective national
regulator. Following the creation of the Single Supervisory Mechanism (SSM), the ECB is
progressively assuming responsibility for the banking supervision in the euro area from the
67
See our previous ESBFO for a summary, see as well for more information Möglich, 2015 (in German), or
Bank of America/Merrill Lynch, 2015b. 68
https://www.ecb.europa.eu/mopo/implement/omt/html/index.en.html.

66
national regulators. One of the key prerequisites for a revival of the SMESec market is an efficient
and rapid implementation of the new supervision mechanisms.
With regard to the fine-tuning of the various regulations, no dramatic improvements are currently
foreseeable. Mitigation of the originally unintended negative effects can be achieved through the
creation of High Quality Securitisations (HQS), which should comprise of structures that are
simple, transparent and efficient and which should receive preferential regulatory treatment.
Transparency should be a prerequisite for any structured transactions. Hence, a particular focus
should be put on the promotion of simple structures and well-identified, transparent underlying
asset pools with predictable performance.69
Naturally, an adequate, clear, and pragmatic
definition of HQS is key to achieve its potential – and such a definition should include transactions
backed by SME portfolios, as well as the consideration of synthetic transactions whose underlying
assets display the required criteria (see Box 10).
Box 10: Can synthetic SMESec be HQS?70
As described in earlier EIF working papers, in synthetic transactions traditional securitisation
techniques are combined with Financial Guarantees or Credit Default Swaps (CDSs) in order to
provide credit protection on a pool of loans. In SME transactions, typically the credit risk of a
selected reference portfolio of loans (but not the loans themselves, which remain on the balance
sheet of the originator - there is no change in ownership of the underlying portfolio) is transferred
to the capital market through the issuance of notes (Credit Linked Notes), classified by risk
categories (Kraemer-Eis, et al., 2010).
In general, there is a variety of different synthetic structures, e.g. based on granular portfolios /
concentrated portfolios, funded / not funded, CDS against whole pool / individual tranches,
based on managed / static pools, and also squared transactions (e.g. CDS on different ABS), etc.
These approaches vary significantly in terms of complexity, transparency, and standardisation – a
synthetic securitisation can be rather simple and rather standardised, but as well highly complex
and intransparent. Hence, it is not reasonable to speak of synthetics as ONE single market
segment.
Synthetic securitisations have typically lower administrative costs than their cash peers, as well as
less legal and operational complexity (Moody’s, 2014). Although different concerning several
characteristics, in terms of risk, synthetic transactions do not differ significantly from their cash
deals, as they are “usually designed to replicate the exposure of cash deals” (Moody’s, 2014).
69
In our June-2014 ESBFO, we outlined what high quality SMESec could look like; see:
http://www.eif.org/news_centre/publications/eif_wp_24.pdf. Proposed attributes of HQS in Europe are as
well described in IMF (2015a) and Aiyar et al. (2015).
70
We use here HQS as term – in the current discussion, also other terminologies are used in the same
context, e.g. STS (simple, transparent, and standardised) securitisation, used e.g. by the ECB, or STC
(simple, transparent and comparable) securitisation, used by BCBS-IOSCO, or SST (simple, standard and
transparent) securitisation, used by the European Banking Authority.

67
Box 10 continued:
Synthetic transactions were used in the past - mainly until the crisis - in a number of European
countries and based on different asset classes. According to Bank of America/Merrill Lynch
(2015), most of the synthetic issuance in Europe came from the CDOs and RMBS sectors, in
particular driven by the transactions under KfW’s Promise (SME transactions) and Provide (RMBS)
platforms. These transactions were typically rather standardised bank balance sheet CDOs. The
same source confirms that there is “no conclusive general evidence that synthetic securitisations
have performed credit-wise worse than comparable traditional securitisations, yet performance
has varied significantly across asset classes and structures.” The authors find similar performances
in synthetic SME ABS transactions compared to their cash peers, in particular as the performance
of the underlying exposures is the key performance driver – then mitigated or magnified by
structural features (Bank of America/Merrill Lynch, 2015c).
The current discussion around HQS focusses on structural features, in particular simplicity,
transparency, and standardisation, as well as on quality criteria for the underlying assets. For
synthetic SMESec, the latter can be generally the same compared to cash transactions.
Concerning the structural features, strict criteria can be defined in order to achieve simple,
transparent, and standardised transactions in the spirit of HQS that should receive preferential
regulatory treatment. These criteria should in particular be related to the definition of the credit
event, the credit protection payment timing and amount, the avoidance of moral hazard (in
particular referring to the role of the calculation agent), waterfall features, as well as collateral
and counterparty risk in funded synthetic transactions (see for more details Moody’s, 2014 and
Bank of America/Merrill Lynch, 2015c).
Against this background – the answer to the introductory question of this Box is: “yes it can”!
68
6 Microfinance market
6.1 Microfinance business environment
“Microcredit is generally recognised […] as an effective financing channel for job creation and
social inclusion, which can attenuate the adverse effects of the current financial crisis while
contributing to entrepreneurship and economic growth in the EU” (European Commission,
2012b). In Europe, microfinance consists mainly of micro-loans (less than EUR 25,000) tailored
to microenterprises (92% of all European businesses) and people who would like to become self-
employed but are facing difficulties in accessing the traditional banking services. Throughout the
EU, 99% of all start-ups are micro or small enterprises, and one third of those were launched by
unemployed people. In order to prepare for a further analysis of this topic, it is helpful to start with
some definitions (see Box 11):
Box 11: What is “micro”?
A microenterprise is any enterprise with fewer than 10 employees and a turnover below EUR 2m
(as defined in the Commission Recommendation 2003/361/EC of 6 May 2003, as amended).
A microfinance institution (MFI) is an organisation/financial intermediary that provides
microfinance services. There is a wide spectrum of different MFI business models in Europe.
Microcredit in general is defined by the European Commission as a loan or lease under EUR
25,000 to support the development of self-employment and microenterprises. It has a double
impact: (1) an economic impact, as it allows the creation of income generating activities, and (2)
a social impact, as it contributes to the financial inclusion and, thus, to the social inclusion of
individuals.
Microfinance, as a general term, is traditionally defined as the provision of basic financial
services to poor (low-income) people who traditionally lack access to banking and related
services (CGAP Definition, Consultative Group to Assist the Poor). However, more and more
often, the definition is used in a wider sense, also to include financial services to existing
microenterprises. This wider concept is used in the present text and in order to achieve a
pragmatic approach, we follow a segmentation, following a differentiation introduced by EMN
(2012):
Microenterprise lending = microlending to existing enterprises. Organisations that implement
the lending model of microenterprise lending tend to focus on the upper end market of
microfinance, providing loans to bankable or nearly bankable microenterprises that have
difficulties accessing loans up to 25,000 EUR from commercial banks due to risk aversion or
lacking liabilities. The average volume of the provided loans is markedly higher than in the
model of social inclusion lending, meant to support the start or stabilisation of
microenterprises with a growth perspective. The maximum loan sizes go up to 25,000 EUR
(or even higher in some cases).
Social inclusion lending = lending to self-employed individuals that are excluded from
banking services, due to their socioeconomic status of being socially excluded or (long term)
unemployed and/or belonging to financially excluded population groups like ethnic
minorities or young people. The average loan sizes are relatively low, meant to support basic
income creating activities.

69
EIF has published two working papers so far that specifically cover the European microfinance
market (see Kraemer-Eis and Conforti, 2009 and Bruhn-Leon, Eriksson and Kraemer-Eis, 2012).
In these studies, EIF found that there are wide spectra of final beneficiaries and financial
intermediaries, and concluded that there is no common microfinance business model in Europe –
on the contrary, the market is highly fragmented and diverse, but with a trend towards efficiency,
professionalisation, and self- sustainability. In the following sections we briefly explain important
elements of the demand and supply-side perspectives, as well as their combination.
6.2 Overall situation and demand-side perspectives
Standardised, regularly available indicators to explain market developments for microfinance in
Europe do not exist yet, or refer to Central-Eastern Europe. Thus, we will focus in this section on
the framework conditions for microfinance, which are covered by the regularly updated Eurostat
indicators for poverty and social inclusion, and by data on microenterprises.
6.2.1 Business environment and access to finance of microenterprises
The UEAPME EU Craft and SME Barometer (see UEAPME Study Unit, 2015) shows that, on
balance, microenterprises estimated a significant deterioration of their overall situation (-10.1%)
while small enterprises reported a smaller deterioration and medium-sized companies reported an
improvement of their overall situation in the second half of 2014 (see Figure 40). Moreover,
expectations in the previous survey round for the second half of 2014 exceeded realised
outcomes.
Figure 40: Overall situation of European micro-firms compared to other enterprise size classes
Source: UEAPME Study Unit (2015)

70
For the first half of 2015, microenterprises, on balance, expected negative changes (-6.5%) in
their overall situation. Similar results were reported for the survey questions on turnover,
employment, and orders in the second half of 2014 and changes are negatively foreseen for the
first part of 2015. According to the overall picture, microenterprises will continue facing more
difficulties than other SMEs.
According to the data from the latest ECB survey on the access to finance of enterprises in the
euro area (ECB, 2015a), the share of enterprises which see “access to finance” as their most
pressing problem remained bigger among microenterprises than the share among other SMEs
(Figure 41). “Finding customers” stayed the most frequently mentioned concern. The ECB (2015a)
also reported a rise in bank loan rejection rates for micro and small enterprises, and a drop for
medium-sized ones. The rejection rate is still the highest for micro firms (13%), compared to 8%
for small firms and 3% for medium-sized firms.
Figure 41: Share of enterprises reporting access to finance as their most pressing problem
Source: Authors, based on data from ECB (2015a), Statistical Data Warehouse
Microenterprises, on balance, reported increased needs for bank loans, however, they use bank
loans and other external financing sources considerably less than other SME size classes,
presumably due to difficult access to finance. Figure 42 shows that, with the exception of “trade
credit”, the usage of different financing sources on average typically increases with the size of the
SME (ECB, 2015a). Among the reasons why bank loans are less relevant for microenterprises,
they reported insufficient collateral or guarantee and high interest rates or price.
Despite the increased needs for bank loans, 10 percent of microenterprises did not apply for a
loan due to fear of rejection (discouraged borrowers); such discouragement is often related to
higher costs charged by banks on smaller loans (Ferrando and Mulier, 2014).

71
Figure 42: Different financing sources used by enterprises (by enterprise size class)
Source: Authors, based on ECB (2015a) data.
According to the ECB’s SAFE survey (ECB, 2015a), microenterprises still perceive an increasing
gap in the external financing (5% down from +10% in the previous survey period), (see Figure
43).
Figure 43: Perceived change in the external financing gap (by firm size)
Source: Authors, based on ECB (2015a), Statistical Data Warehouse

72
6.2.2 Necessity-driven business creation
In order to assess the likelihood of achieving the Europe 2020 poverty/social inclusion target,
Eurostat has provided an indicator called “people at risk of poverty or social exclusion”.71
Figure
44 depicts the headline indicator, corresponding to the sum of persons who are at risk of poverty
after social transfers, or severely materially deprived, or living in households with very low work
intensity (i.e. a combination of the three sub-indicators).72
When comparing 2013 to 2012 and
2011, the situation became worse in many countries. Within the EU, the highest risks of poverty or
social exclusion are recorded in Bulgaria, Romania, Greece and Latvia. The countries on the
right-hand side of the diagram include some of the relatively new entrants to the EU and those
countries that have suffered the most from the impact of the current sovereign-debt crisis, i.e.
Greece, Italy, Cyprus, Portugal and Spain.
Figure 44: People at risk of poverty or social exclusion (percentage of total population)
Source: Authors, based on data from Eurostat
People at risk of poverty are considered to be potential business creators. A decision to start a
business often arises out of necessity, but considerations regarding the availability of the necessary
finance or the dissatisfaction in current work situation also play an important role. The majority of
71
See the Eurostat internet site on the Europe 2020 indicators at:
http://epp.eurostat.ec.europa.eu/portal/page/portal/europe_2020_indicators/headline_indicators
72
Persons are only counted once, even if they are present in several sub-indicators. At risk-of-poverty are
persons with an equivalised disposable income below the risk-of-poverty threshold, which is set at 60 % of
the national median equivalised disposable income (after social transfers). Material deprivation covers
indicators relating to economic strain and durables. Severely materially-deprived persons have living
conditions severely constrained by a lack of resources. People living in households with very low work
intensity are those aged 0-59, living in households where the adults (aged 18-59) worked less than 20%
of their total work potential during the past year. For more information please see:
http://epp.eurostat.ec.europa.eu/tgm/table.do?tab=table&init=1&plugin=1&language=en&pcode=t20
20_50

73
entrepreneurs start businesses to improve their situation (OECD, 2014a).73
“People starting
businesses from unemployment face the same principal barriers to business start-up as other
entrepreneurs – lack of finances, lack of human capital and lack of social capital”, but typically
they face tighter financial constraints than other entrepreneurs, in particular as they have lower
levels of saving (OECD/The European Commission, 2014); this refers even more to young start-
uppers.
Poor access to finance creates barriers not only for existing microenterprises or self-employed
people, but also for unemployed people who intend to become self-employed or create an
enterprise (OECD/European Commission, 2014). Unemployment is one of the main challenges in
Europe (Figure 45). Especially devastating is unemployment among young people, for whom time
spent in unemployment increases the risk to be socially excluded and decreases not only current
but also lifetime earnings. For many of them, self-employment can be a solution to end their
unemployment – and microfinance can be a tool to support such business creation. Indeed, 3% of
unemployed people in 2011 in the EU became self-employed in 2012 (OECD/European
Commission 2014).
Figure 45: Unemployment rate by age groups, 2014
Source: Authors, based on data from Eurostat
73
According to the Eurobarometer Survey on Entrepreneurship (European Commission, 2012a), in most
countries of the EU, the majority of self-employed people found dissatisfaction with their previous work
very important in their decision to start a business.
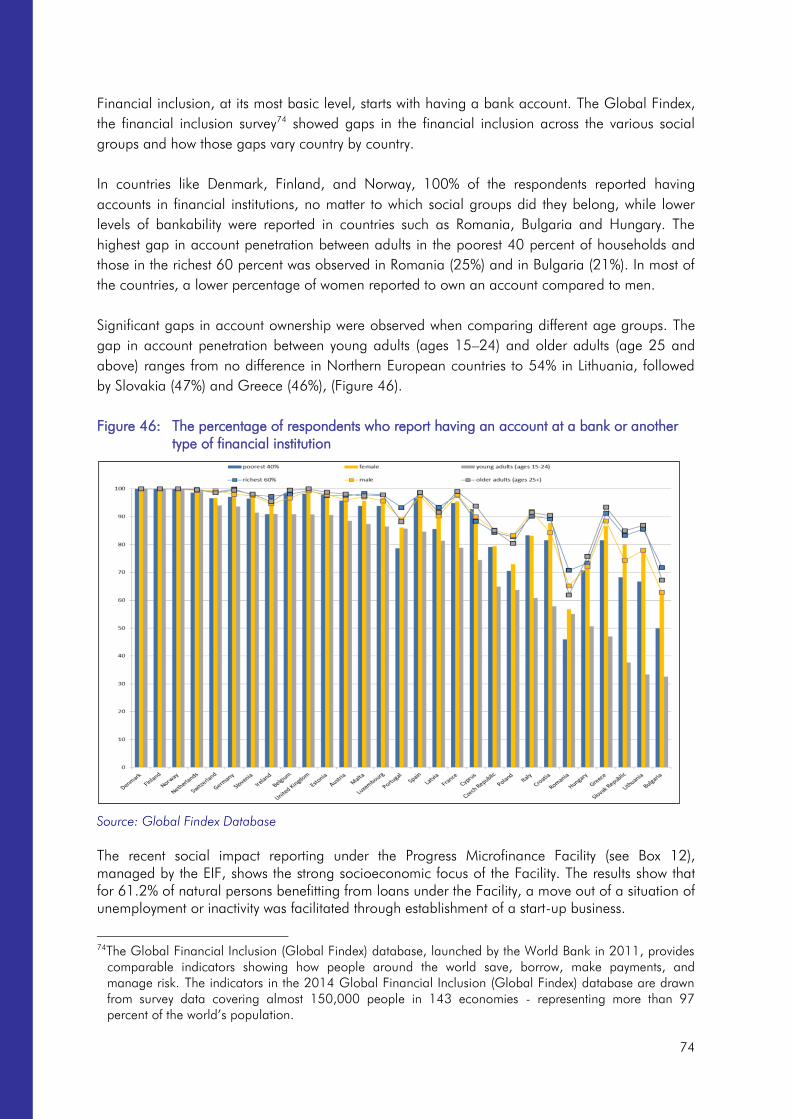
74
Financial inclusion, at its most basic level, starts with having a bank account. The Global Findex,
the financial inclusion survey74
showed gaps in the financial inclusion across the various social
groups and how those gaps vary country by country.
In countries like Denmark, Finland, and Norway, 100% of the respondents reported having
accounts in financial institutions, no matter to which social groups did they belong, while lower
levels of bankability were reported in countries such as Romania, Bulgaria and Hungary. The
highest gap in account penetration between adults in the poorest 40 percent of households and
those in the richest 60 percent was observed in Romania (25%) and in Bulgaria (21%). In most of
the countries, a lower percentage of women reported to own an account compared to men.
Significant gaps in account ownership were observed when comparing different age groups. The
gap in account penetration between young adults (ages 15–24) and older adults (age 25 and
above) ranges from no difference in Northern European countries to 54% in Lithuania, followed
by Slovakia (47%) and Greece (46%), (Figure 46).
Figure 46: The percentage of respondents who report having an account at a bank or another
type of financial institution
Source: Global Findex Database
The recent social impact reporting under the Progress Microfinance Facility (see Box 12),
managed by the EIF, shows the strong socioeconomic focus of the Facility. The results show that
for 61.2% of natural persons benefitting from loans under the Facility, a move out of a situation of
unemployment or inactivity was facilitated through establishment of a start-up business.
74
The Global Financial Inclusion (Global Findex) database, launched by the World Bank in 2011, provides
comparable indicators showing how people around the world save, borrow, make payments, and
manage risk. The indicators in the 2014 Global Financial Inclusion (Global Findex) database are drawn
from survey data covering almost 150,000 people in 143 economies - representing more than 97
percent of the world’s population.

75
Box 12: Social impact reporting under the Progress Microfinance Facility
The European Progress Microfinance Facility is a microfinance initiative which aims at increasing
access to finance for individuals who are at risk of social exclusion. The Facility also supports
microenterprises, including those providing jobs for the unemployed or the disadvantaged (more
information about the Facility is provided at the end of this chapter).
This overview aims at highlighting the socioeconomic profile of Final Beneficiaries receiving loans
under the Progress Microfinance Facility. This information is made available through the
participating intermediaries which on an annual basis provide data to EIF as part of the social
impact reporting exercise, the most recent having as cut-off date 30 September 2014. The data
set covers contributions by 44 Intermediaries, which so far have financed more than 30,000 final
beneficiaries under the Facility.
Figure 47 below provides a summary of non-financial information at final beneficiary level of the
Facility. These figures indicate that the clear majority of individual micro-borrowers which received
support under the Facility so far were either unemployed or inactive at the time they received their
loan. These aggregate figures suggest that at Facility level, considerable outreach to females was
achieved. Moreover, the highest incidence (100%) of female loan recipients relative to males at
the individual intermediary level was observed in Portugal.
A total of 1.6% of micro-borrowers across the Facility has reported themselves as belonging to a
disadvantaged group. These figures suggest minimal impact at Facility level with respect to
outreach to these particular at-risk social groups75
. As for outreach to minority groups at the
individual intermediary level, the highest percentage (88%) was reported in Spain. Moreover,
considerable outreach to disadvantaged age groups as well as to people with low or no
education was achieved.
Figure 47: Progress Microfinance Social Outreach, natural persons
Source: EIF
75
With respect to outreach to minority groups and the disabled, often information from natural persons is
omitted. Individuals do not identify themselves as a minority or a disabled. For example, in France,
statistics on minority status is not permitted under the national legal framework.
76
6.3 Supply side
The European microfinance market is still young and heterogeneous due to the diversity of legal
frameworks, institutional environments and microfinance providers in European countries. In
addition to commercial banks that target microenterprises as within their general SME lending
activity, the spectrum of European microcredit developers includes many profit-oriented and non-
profit associations: microfinance associations, credit unions, cooperatives, Community
Development Financial Institutions (CDFIs), non-bank financial institutions (NBFIs), government
bodies, religious institutions and Non-Governmental Organisations (NGOs).
The latest EMN survey76
shows a high diversity with regard to targeted social groups and societal
policy goals. Two thirds of all surveyed MFIs reported that they included social impact in their
mission, followed by job creation (58%), social (56%) and financial inclusion (50%). 85% of the
surveyed MFIs reported that they include at least one dedicated employment goal as part of their
mission. In 2013, a minimum of 121,270 microenterprises and start-ups were estimated to have
been supported by the surveyed organisations which resulted in an impact on at least 250,000
jobs throughout Europe.
According to the EMN survey, the microcredit provision in Europe showed a positive trend, in
terms of the overall total value and the number of microloans. More precisely, the surveyed
European microfinance institutions (MFIs) disbursed a total of 207,335 microloans with a total
volume EUR 1.26bn in 2013 (compared to 122,370 microloans disbursed with a volume of EUR
872m in 2011). Compared to the survey data from 2011, this shows an increase of 45% in the
total value of microloans and 69% of the number of loans in 2013 reported by the surveyed MFIs.
The average loan size also increased to EUR 9,234 in 2013 from EUR 7,129 in 2011 and
reached a similar level compared to 2009 (EUR 9,641).
In addition to the diversity of institutional environments and microfinance providers, the
characteristics of microloans are much diversified across countries. According to EMN (2014), the
average interest rate among the surveyed microfinance providers was 10% in 2013 (11% in
2011), but ranging from 5% in France, Italy, Austria and Switzerland, to 27% in the UK, and even
higher in non-EU Balkan states (Figure 48).
Similarly, the spread of average loan durations varies across countries. Long loan terms can be
found in Hungary (77 months), Portugal (72) and Austria (60 months). Typically, shorter loan
terms are observed in countries with high average interest rates and low average loan volumes,
with the exception of Germany, mainly in Balkan states (EMN, 2014).
76
The European Microfinance Network (EMN)’s Overview of the microcredit sector in the European Union
for the period 2012-2013 is based on a survey among 150 MFIs in 24 countries. 447 MFIs have been
contacted, 150 contributed data, which equals an overall response rate of 34%. The study has been
supported by EIF. The analysis is performed only biyearly and we refer here to the latest available version
from 2014.
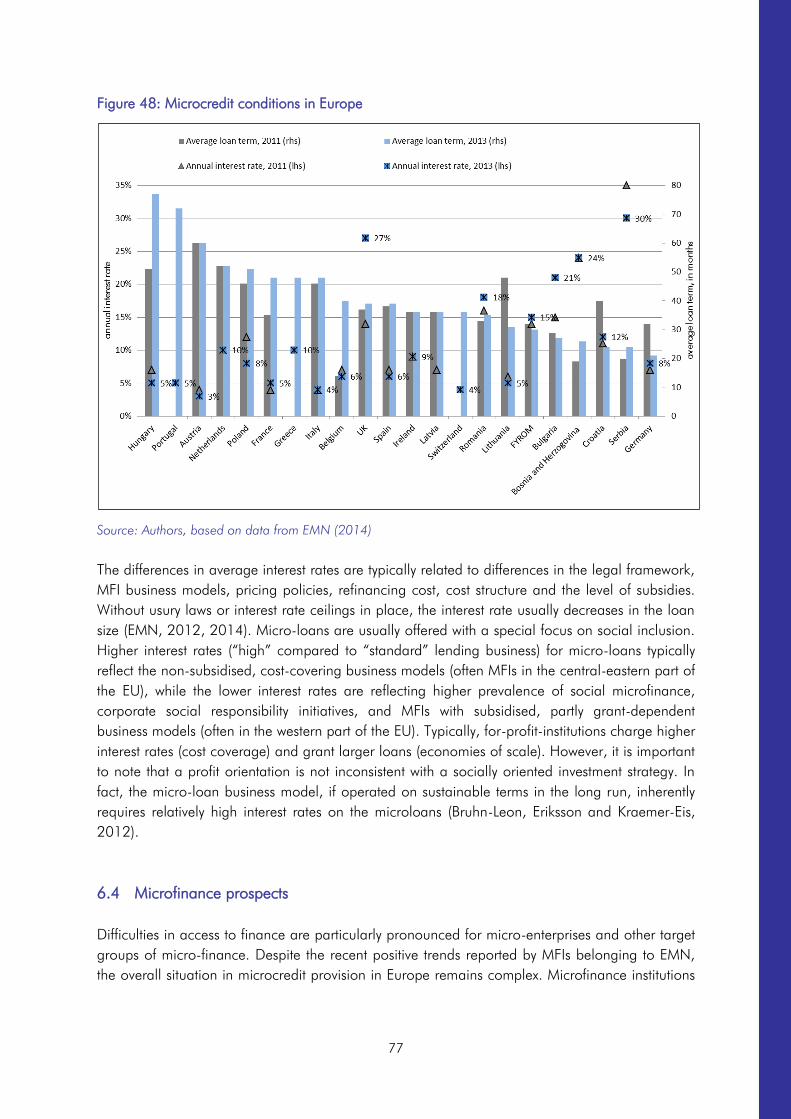
77
Figure 48: Microcredit conditions in Europe
Source: Authors, based on data from EMN (2014)
The differences in average interest rates are typically related to differences in the legal framework,
MFI business models, pricing policies, refinancing cost, cost structure and the level of subsidies.
Without usury laws or interest rate ceilings in place, the interest rate usually decreases in the loan
size (EMN, 2012, 2014). Micro-loans are usually offered with a special focus on social inclusion.
Higher interest rates (“high” compared to “standard” lending business) for micro-loans typically
reflect the non-subsidised, cost-covering business models (often MFIs in the central-eastern part of
the EU), while the lower interest rates are reflecting higher prevalence of social microfinance,
corporate social responsibility initiatives, and MFIs with subsidised, partly grant-dependent
business models (often in the western part of the EU). Typically, for-profit-institutions charge higher
interest rates (cost coverage) and grant larger loans (economies of scale). However, it is important
to note that a profit orientation is not inconsistent with a socially oriented investment strategy. In
fact, the micro-loan business model, if operated on sustainable terms in the long run, inherently
requires relatively high interest rates on the microloans (Bruhn-Leon, Eriksson and Kraemer-Eis,
2012).
6.4 Microfinance prospects
Difficulties in access to finance are particularly pronounced for micro-enterprises and other target
groups of micro-finance. Despite the recent positive trends reported by MFIs belonging to EMN,
the overall situation in microcredit provision in Europe remains complex. Microfinance institutions

78
have been affected by the adverse macro-economic conditions during the global financial and
economic crisis, generally through significantly higher bad debt rates among their clients and in
some cases through increased difficulties in accessing external sources of funding. With ongoing
problems in the banking sector, the target groups for microfinance are faced with tightening credit
supply by mainstream banks due to their higher risk aversion and increasing need to de-leverage
their balance sheets. In an increasingly risk-averse environment of credit allocation, lending might
be allocated away from small and young firms as they are more risky than their larger peers and
have small financing needs which are difficult to cover in a cost-efficient manner by mainstream
funding providers. This refers by nature in particular to the segment of microfinance.
Microfinance can be an important contribution to overcome the effects of the crisis for some
specific groups and in particular to support inclusive growth. However, the perspectives of the
sector with regard to growth and self-sufficiency are limited, if microfinance providers do not have
access to stable funding.
Moreover, with regard to future trends, MFIs expect less public support in the coming years, due
to public budget restrictions. The MFIs have prepared to develop more efficient and lean
processes, and to reduce the costs for the provision of microloans and to look for additional
funding sources EMN, 2014). Furthermore, collaboration between MFIs and crowdfunders as well
between MFIs and banks might increase.
According to EMN (2015), crowdfunding may offer MFIs different scenarios for collaboration: (i)
crowdlending platforms could successfully be used to finance microfinance activities and attract
potential investors. (ii) MFIs can act as intermediaries between the platforms and microfinance
seekers. The mechanism might allow MFIs to use their expertise by pooling and disbursing the
raised money on the platform. (iii) MFIs’ involvement in the crowdfunding platform could widen
financial inclusion. The poorest might still remain beyond the platform as they usually lack
computer and business skills, which are necessary to attract potential investors. MFIs could assist
them when choosing the most suitable crowdfunding model and could even supplement the raised
money up to the desired amount in case needed. (iv) MFIs could completely transfer their activities
to the crowdfunding and P2P platforms in order to increase outreach. However, such a complete
transformation would most probably change the original mission of the MFI.
Collaboration and partnership between MFIs and banks already exists. MFIs borrow from banks to
finance their micro-lending or operating activities. On the other hand, banks benefit MFI
screening and monitoring technologies and better tailored products to the clients. The main
challenge is alignment of objectives of MFIs and banks. “Cooperation can be improved through
long term commitments, the creation of multi-bank partnerships models, larger decision power
given to MFIs, decreased complexity of the partnerships, increased awareness of banks about
microfinance and standardisation of methods and criteria employed” (Cozarenco, 2015).
Against the background of the current difficult framework conditions, support on a European level
has become even more important – via funding, guarantees and technical assistance to a broad
range of financial intermediaries, from small non-bank financial institutions to well-established
microfinance banks – in order to make microfinance a fully-fledged segment of the European
financial sector.

79
We discussed the rationale for public support in the microfinance area in one of our previous
working papers (i.e. in Bruhn-Leon, Eriksson and Kraemer-Eis, 2012), and explained the chosen
approach for the Progress Microfinance mandate as support on European level – via the EIF. The
intervention logic is based on the market structure and its significant diversity. It seeks to maximise
outreach through a flexible investment approach in terms of eligible types of investments and types
of financial intermediaries. The key target group are non-bank MFIs, but the range of financial
intermediaries is extended also to banks with good outreach to microfinance clients, such as
cooperative banks or micro-banks.
Results show so far that non-bank MFIs have been the most active lenders over the first four years
of Progress Microfinance, as their main focus is micro-lending, unlike banks. Moreover, many
non-bank MFIs have made use of the flexibility under Progress Microfinance to provide funding
and risk coverage denominated in local currency. Progress Microfinance covers 20 countries as of
end-2014 with two additional countries (Estonia and Hungary) likely to be added in early 2015.
Progress Microfinance had as of end-September 2014 mobilised around EUR 274m of new
financing to eligible micro-borrowers. The long-term target under the facility of providing EUR
500m of new micro credits to minimum 46,000 micro-borrowers is still within reach.
In mid-2015 the Progress Microfinance successor program, the program for Employment and
Social Innovation (EaSI) will be launched; the related mandate agreement between the European
Commission and the EIF was signed on 24 June 2015. The EaSI investment period will run until
2023. EaSI contributes to the Europe 2020 strategy by supporting the EU's objective of high level
employment, adequate social protection, fighting against social exclusion and poverty and
improving working conditions. EIF will manage and implement the EaSI, enhancing access to
microfinance for vulnerable groups and micro-enterprises and social enterprises, while building-
up the institutional capacities of microcredit and social finance providers. In an initial phase
through a new guarantee instrument, the EC will make available EUR 96m to offer credit risk
protection for lending products provided to micro and social enterprises. In a second phase, likely
to start in the first semester of 2016, additional funds will be made available by the EC also for
funded instruments to intermediaries such as senior loans, subordinated loans and direct equity
investments.

80
7 Concluding remarks
Although there are signs of improvements, as shown above, the imbalances between the EU
Member States are still significant. A large fraction of SMEs continues to face major problems with
access to finance, and there are, in particular, significant differences from country to country in
such fields as, for example, debt financing.
It is evident that public support continues to play a crucial role in enhancing access to finance for
SMEs. However, as outlined in detail in our previous ESBFO, it is important “how” this support is
provided: support mechanisms have to be designed in a way that they catalyse other sources of
finance to the benefit of SMEs. The decision to finance a company should be made by market-
oriented professionals who make investment decisions on a business basis. This is also in line with
the OECD (2014b) argument that “[p]ublic financial institutions have an important role in
fostering co-participation of the private sector in the lending markets through managing
guarantees and in encouraging new public-private collaboration in equity instruments.” This is the
investment approach of the EIF – the core competency is to select financial intermediaries who in
turn know their individual markets best. Indeed, the existing support measures have facilitated
SME survival, development and success in many countries of the EU, and – equally importantly –
many new public support initiatives have been started, and several others are under preparation.
In all these efforts, EIF’s goal is not just to provide capital or guarantees: it is also to help
spreading best market practice, encourage collaboration and network building, and the creation
of a sustainable financing eco-system to the benefit of SMEs, entrepreneurship, and innovation.
It is a key priority for the EIF to help establish a well-functioning, liquid equity market that attracts
a wide range of private sector investors. In doing so, EIF aims at leveraging its market assistance
and seizing market opportunities in all areas of the equity eco-system which are relevant to the
sustainable development of the industry. EIF has increased – as the key catalytic investor in
European venture and growth capital funds – its counter-cyclical role in providing financing
solutions to boost entrepreneurship and innovation. In the coming years, EIF will continue to act
as a cornerstone investor across the spectrum of Technology Transfer through Venture Capital to
the Lower Mid-Market and mezzanine financing. This also includes the launch and extension of
new/pilot initiatives, such as the European Angels Fund, partnerships with corporate investors, or
a Social Impact Accelerator - a first step in the EIB Group’s strategy to pioneer the impact
investing space and to respond to the wider EU policy aim of establishing a sustainable funding
market for social entrepreneurship in Europe.
In the areas of credit guarantees and securitisations, EIF cooperates with a wide range of financial
intermediaries. They include: banks, leasing companies, guarantee funds, mutual guarantee
institutions, promotional banks, and other financial institutions that provide financing or financing
guarantees to SMEs. Given that SMEs have no direct access to the capital markets, banks are
typically the most important source of external SME finance. Hence, funding limitations of banks
have direct impact on SME lending capacity. For loans to SMEs, a standardised, highly
transparent and quality-controlled securitisation market could transform these illiquid loans into an
asset class with adequate market liquidity – this can also broaden the transmission mechanism of
monetary policy, while providing a lasting intermediation market for this segment (Brunnermeier
and Sannikov, 2014).

81
There are several initiatives to revive the SME securitisation market. However, there is currently
significant uncertainty concerning the future regulatory treatments of securitisations. In our
understanding, a holistic view has to be taken, and the impact of the “regulatory wave” duly
analysed not to stall the market revival, but to frame its development in an
economically reasonable way. In this context, the introduction of a properly defined concept of
“high quality securitisation” can add substantial information and such a definition should include
SMESec transactions, as well as simple and transparent synthetic transactions.
Finally, microfinance is an important contribution to overcoming the effects of the crisis, and in
particular to supporting inclusive growth. EIF provides funding, guarantees and technical
assistance to a broad range of financial intermediaries, from small non-bank financial institutions
to well-established microfinance banks to make microfinance a fully-fledged segment of the
European financial sector. Moreover, EIF intends to sustain its support of microcredit, social
investments, and participation in the increasing number of social finance institutions that are being
established in the EU Member States.
Additional support for European enterprises is available under the new “Investment Plan for
Europe”. On November 26, 2014, the European Commission has launched this plan, under
which the EIB Group and the European Commission are working together to mobilise EUR 315bn
of investment in strategic infrastructure and companies. The Investment Plan for Europe should
catalyse private sector investment and create growth and jobs for a more competitive Europe. An
essential part of the Investment Plan put forward is to set up a new European Fund for Strategic
Investments (EFSI), see Box 13 for more information. At the time of finalising this Working Paper,
the European Parliament and the Council of the EU had adopted the regulation establishing the
EFSI. The regulation is expected to enter into force in early July (see Council of the EU, 2015, and
European Parliament, 2015).
According to the related European Commission (2014f) communication, the EFSI “will support
risk finance for SMEs and mic-cap companies across Europe, relying on the European Investment
Fund […] for the operational implementation. This should help them overcome capital shortages
by providing higher amounts of direct equity, as well as additional guarantees for high-quality
securitisation of SME loans. This is an effective way to kick-start job creation and growth, including
the recruitment of young people. The EIF is highly experienced in these kinds of activities. The
European Fund for Strategic Investments should thus serve to scale up the activities of the EIF and,
in doing so, create new channels for NPBs [National Promotional Banks] to develop their own
activities in this area. This will come on top of existing activities for SMEs initiated by programmes
such as COSME and Horizon 2020, which will notably already provide significant sources of
funding in 2015.”

82
Box 13: The European Fund for Strategic Investments (EFSI)
The global economic and financial crisis has hampered investment in infrastructure, innovation
and the private sector. As part of the Investment Plan for Europe77
, the European Fund for
Strategic Investments (EFSI) aims to unlock investment by addressing market gaps and mobilising
private resources. By taking on some of the risk, the EIB Group can help increase the appetite to
invest. The EIB Group will provide loans and other financial products that will be partly covered by
an EU budget. As there is abundant liquidity in the market, sound projects and risk-absorbing
financial products will be able to attract more funding, especially from private investors.
EFSI will be integrated into the EIB Group and transactions supported by EFSI will be subject to the
normal transaction cycle and governance. It will be launched soon following the recent adoption
of the EU Regulation (see further above), which establishes EFSI. In the meantime, the EIB Group
will use existing capital to start pre-financing operations.
EFSI is a strategic partnership between the EC and the EIB Group. The EIB Group will contribute
EUR 5bn to the new initiative, alongside a EUR 16bn guarantee from the EU budget (see Figure
49). The SME window will be implemented by the EIF through agreements between the EIF and
financial intermediaries signed in 2015-2018. The financial support must be additional to what
will have been delivered under the existing and already foreseen programmes in the period 2015-
2018.
Figure 49: EFSI
Source: EIB Group
77
See for more information: http://www.eib.org/about/invest-eu/index.htm
83
Box 13 continued:
Against the background that there is already a strong market demand for existing EIF products
and that a rapid deployment of the initiative is key, the implementation starts with “more of the
same”, i.e. established equity products and portfolio guarantees (COSME and InnovFin-type);
over time additional instruments are foreseen to be implemented (uncapped guarantees,
securitisation).
Technically, the SME window is financed through a EUR 2.5bn increase of the Risk Capital
Resources (RCR) mandate from EIB to EIF for equity financing, a EUR 1.25bn EFSI guarantee to
accelerate the implementation of the InnovFin SME and COSME SME guarantee programmes,
and a EUR 1.25bn EFSI guarantee for equity financing, guarantees and SME securitisations. The
RCR increase was approved in April this year by the EIB and EIF Boards and the amendment of
the RCR contract is under negotiation at service level with a target signature in mid-2015. Already
four equity transactions have been signed in anticipation of such RCR increase (in Germany,
France and Italy).
The front loading of the InnovFin SME and COSME SME guarantee programmes was approved in
April by the EIF Board, including a EUR 0.5bn warehousing capacity by EIF. Several transactions
are already in preparation, of which the first was signed as the first one under EFSI on 12th of
May with the French public investment bank bpifrance (a subsidiary of Caisse des Dépôts). The
guarantee agreement will increase lending to innovative SMEs and small mid-caps in France. As
indicated, the transaction was signed even before EFSI was formally established. This reflects the
EIB Group’s commitment to respond swiftly to calls from Member States, the EC and the European
Parliament for a rapid launch of concrete initiatives under EFSI.
Further signatures should follow soon, as reflected by EIF’s substantial deal pipeline. The
additional equity, guarantee and SME securitisation products under EFSI are currently being
discussed with the European Commission with the view to be launched end of 2015/early 2016.
It is foreseen that the equity product shall notably include a co-investment platform with National
Promotional Institutions.

84
ANNEX
Annex 1: Private Equity Glossary
(selection, from EVCA)
Buyout: A buyout is a transaction financed by a mix of debt and equity, in which a business, a business
unit or a company is acquired with the help of a financial investor from the current shareholders (the
vendor).
Buyout fund: Funds whose strategy is to acquire other businesses; this may also include mezzanine debt
funds which provide (generally subordinated) debt to facilitate financing buyouts, frequently alongside a
right to some of the equity upside.
Capital weighted average IRR: The average IRR weighted by fund size.
Carried interest: A share of the profit accruing to an investment fund management company or
individual members of the fund management team, as a compensation for the own capital invested and
their risk taken. Carried interest (typically up to 20% of the profits of the fund) becomes payable once
the limited partners have achieved repayment of their original investment in the fund plus a defined
hurdle rate.
Closing: A closing is reached when a certain amount of money has been committed to a private equity
fund. Several intermediary closings can occur before the final closing of a fund is reached.
Commitment: A limited partner’s obligation to provide a certain amount of capital to a private equity
fund when the general partner asks for capital.
Deal flow: The number of investment opportunities available to a private equity house.
Disbursement: The flow of investment funds from private equity funds into portfolio companies.
Distribution: The amount disbursed to the limited partners in a private equity fund.
Divestment: See exit.
Drawdown: When investors commit themselves to back a private equity fund, all the funding may not be
needed at once. Some is used as drawn down later. The amount that is drawn down is defined as
contributed capital.
Early stage: Seed and start-up stages of a business.
Early stage fund: Venture capital funds focused on investing in companies in the early part of their lives.
Exit: Liquidation of holdings by a private equity fund. Among the various methods of exiting an
investment are: trade sale; sale by public offering (including IPO); write-offs; repayment of preference
shares/loans; sale to another venture capitalist; sale to a financial institution.
Expansion capital: Also called development capital. Financing provided for the growth and expansion
of a company, which may or may not break even or trade profitably. Capital may be used to: finance
increased production capacity; market or product development; provide additional working capital.
Follow-on investment: An additional investment in a portfolio company which has already received
funding from a private equity firm.
Fund: A private equity investment fund is a vehicle for enabling pooled investment by a number of
investors in equity and equity-related securities of companies (investee companies). These are generally
private companies whose shares are not quoted on any stock exchange. The fund can take the form
either of a company or of an unincorporated arrangement such as a limited partnership. See limited
partnership.
Fund of Funds: A fund that takes equity positions in other funds. A fund of fund that primarily invests in
new funds is a Primary or Primaries fund of funds. One that focuses on investing in existing funds is
referred to as a Secondary fund of funds.
Fund size: the total amount of capital committed by the limited and general partners of a fund.
Fundraising: The process in which venture capitalists themselves raise money to create an investment
fund. These funds are raised from private, corporate or institutional investors, who make commitments
to the fund which will be invested by the general partner.

85
General Partner: A partner in a private equity management company who has unlimited personal
liability for the debts and obligations of the limited partnership and the right to participate in its
management.
General Partner’s commitment: Fund managers typically invest their personal capital right alongside
their investors capital, which often works to instil a higher level of confidence in the fund. The limited
partners look for a meaningful general partner investment of 1% to 3% of the fund.
Generalist fund: Funds with either a stated focus of investing in all stages of private equity investment,
or funds with a broad area of investment activity.
Holding period: The length of time an investment remains in a portfolio. Can also mean the length of
time an investment must be held in order to qualify for Capital Gains Tax benefits.
Horizon IRR: The Horizon IRR allows for an indication of performance trends in the industry. It uses the
fund’s net asset value at the beginning of the period as an initial cash outflow and the Residual Value at
the end of the period as the terminal cash flow. The IRR is calculated using those values plus any cash
actually received into or paid by the fund from or to investors in the defined time period (i.e. horizon).
Hurdle rate: A return ceiling that a private equity fund management company needs to return to the
fund’s investors in addition to the repayment of their initial commitment, before fund managers become
entitled to carried interest payments from the fund.
Inception: The starting point at which IRR calculations for a fund are calculated; the vintage year or
date of first capital drawdown.
Institutional investor: An organisation such as a bank, investment company, mutual fund, insurance
company, pension fund or endowment fund, which professionally invest, substantial assets in
international capital markets.
Internal rate of return (IRR): The IRR is the interim net return earned by investors (Limited Partners), from
the fund from inception to a stated date. The IRR is calculated as an annualised effective compounded
rate of return using monthly cash flows to and from investors, together with the Residual Value as a
terminal cash flow to investors. The IRR is therefore net, i.e. after deduction of all fees and carried
interest. In cases of captive or semi-captive investment vehicles without fees or carried interest, the IRR is
adjusted to create a synthetic net return using assumed fees and carried interest.
For the avoidance of doubts: IRR means the financial IRR and not the economic IRR, i.e. it does not
account for any externalities.
IPO (Initial public offering): The sale or distribution of a company’s shares to the public for the first
time. An IPO of the investee company’s shares is one the ways in which a private equity fund can exit
from an investment.
Later stage: Expansion, replacement capital and buyout stages of investment.
Leverage buyout (LBO): A buyout in which the New Company’s capital structure incorporates a
particularly high level of debt, much of which is normally secured against the company’s assets.
Limited Partnership: The legal structure used by most venture and private equity funds. The partnership
is usually a fixed-life investment vehicle, and consists of a general partner (the management firm, which
has unlimited liability) and limited partners (the investors, who have limited liability and are not involved
with the day-to-day operations). The general partner receives a management fee and a percentage of
the profits. The limited partners receive income, capital gains, and tax benefits. The general partner
(management firm) manages the partnership using policy laid down in a Partnership Agreement. The
agreement also covers, terms, fees, structures and other items agreed between the limited partners and
the general partner.
Management fees: Fee received by a private equity fund management company from its limited
partners, to cover the fund’s overhead costs, allowing for the proper management of the company. This
annual management charge is equal to a certain percentage of the investors’ commitments to the fund.
Mezzanine finance: Loan finance that is halfway between equity and secured debt, either unsecured or
with junior access to security. Typically, some of the return on the instrument is deferred in the form of
86
rolled-up payment-in-kind (PIK) interest and/or an equity kicker. A mezzanine fund is a fund focusing on
mezzanine financing.
Multiples or relative valuation: This estimates the value of an asset by looking at the pricing of
“comparable” assets relative to a variable such as earnings, cash flows, book value or sales.
Pooled IRR: The IRR obtained by taking cash flows from inception together with the Residual Value for
each fund and aggregating them into a pool as if they were a single fund. This is superior to either the
average, which can be skewed by large returns on relatively small investments, or the capital weighted
IRR which weights each IRR by capital committed. This latter measure would be accurate only if all
investments were made at once at the beginning of the funds life.
Portfolio company: The company or entity into which a private equity fund invests directly.
Pre seed stage: The investment stage before a company is at the seed level. Pre-seed investments are
mainly linked to universities and to the financing of research projects, with the aim of building a
commercial company around it later on.
Private Equity: Private equity provides equity capital to enterprises not quoted on a stock market. Private
equity can be used to develop new products and technologies (also called venture capital), to expand
working capital, to make acquisitions, or to strengthen a company’s balance sheet. It can also resolve
ownership and management issues. A succession in family-owned companies, or the buyout and buyin
of a business by experienced managers may be achieved by using private equity funding.
Private Equity Fund: A private equity investment fund is a vehicle for enabling pooled investment by a
number of investors in equity and equity-related securities of companies. These are generally private
companies whose shares are not quoted on a stock exchange. The fund can take the form of either a
company or an unincorporated arrangement such as a Limited Partnership.
Quartile: The IRR which lies a quarter from the bottom (lower quartile point) or top (upper quartile
point) of the table ranking the individual fund IRRs.
Rounds: Stages of financing of a company. A first round of financing is the initial raising of outside
capital. Successive rounds may attract different types of investors as companies mature.
Secondary investment: An investment where a fund buys either, a portfolio of direct investments of an
existing private equity fund or limited partner's positions in these funds.
Seed stage: Financing provided to research, assess and develop an initial concept before a business
has reached the start-up phase.
Start-up: Companies that are in the process of being set up or may have been in business for a short
time, but have not sold their product commercially.
Target company: The company that the offeror is considering investing in. In the context of a public-to-
private deal this company will be the listed company that an offeror is considering investing in with the
objective of bringing the company back into private ownership.
Top Quarter: Comprises funds with an IRR equal to or above the upper quartile point.
Track record: A private equity management house’s experience, history and past performance.
Venture Capital: Professional equity co-invested with the entrepreneur to fund an early-stage (seed and
start-up) or expansion venture. Offsetting the high risk the investor takes is the expectation of higher
than average return on the investment. Venture capital is a subset of private equity.
Venture Capitalist: The manager of private equity fund who has responsibility for the management of
the fund’s investment in a particular portfolio company. In the hands-on approach (the general model
for private equity investment), the venture capitalist brings in not only moneys as equity capital (i.e.
without security/charge on assets), but also extremely valuable domain knowledge, business contacts,
brand-equity, strategic advice, etc.
Vintage year: The year of fund formation and first drawdown of capital.
Volatility: The volatility of a stock describes the extent of its variance over time.
Write-off: The write-down of a portfolio company’s value to zero. The value of the investment is
eliminated and the return to investors is zero or negative.

87
Annex 2: Securitisation Glossary
Credit Default Swap: An agreement used in synthetic securitisations where the originator (protection
buyer) sells the credit risk of an underlying portfolio to a counterparty (protection seller) without
transferring the ownership of the assets.
Credit Enhancement: Refers to one or more measures taken in a securitisation structure to enhance the
security, the credit quality or the rating of the securitised instrument, e.g. by providing a third party
guarantee (such as the EIF guarantee). The credit enhancement could be provided in the form of:
(i) Structural credit enhancement (tranching of the transaction in senior, mezzanine and junior tranches);
(ii) Originator credit enhancement (cash collateral, profit retention mechanism, interest sub-
participation mechanism);
(iii) Third party credit enhancement (e.g. EIF or monoline insurers).
Credit Linked Notes (CLN): A security issued by an SPV (or directly from the balance-sheet of the
originator) credit-linked to the default risk of an underlying portfolio of assets. Usually used in synthetic
securitisations for the mezzanine tranches of a transaction.
Collateralized loan obligations (CLOs) are a form of securitisation where payments from multiple
middle sized and large business loans are pooled together and passed on to different classes of owners
in various tranches.
First Loss Piece: Part of a securitisation transaction which is usually kept by the originator (as an “equity
piece”) and which covers the risk of first loss in the portfolio. Its size is a function of the historical losses,
so as to protect the investors against the economic risk (estimated loss) of the transaction.
Issuer: Refers to the SPV which issues the securities to the investors.
Mezzanine Risk: Risk or tranche which is subordinated to senior risk, but ranks senior to the First Loss
Piece.
Originator: The entity assigning receivables in a securitisation transaction (funded transaction) or
seeking credit risk protection on the assets (unfunded transaction).
Primary market: The market in which securities are issued.
Secondary market: The market where issued securities are traded.
Senior: The class of securities with the highest claim against the underlying assets in a securitisation
transaction. Often they are secured or collateralised, or have a prior claim against the assets. In true
sale structures they rank senior in the cash flow allocation of the issuer’s available funds.
Servicer: Refers to the entity that continues to collect the receivables, enforcement of receivables, etc.
Generally, the originator is also the servicer.
Special Purpose Vehicle (SPV): Issuing entity holding the legal rights over the assets transferred by the
originator. An SPV has generally a limited purpose and/or life.
Subordinated: The classes of securities with lower priority or claim against the underlying assets in a
securitisation transaction. Typically, these are unsecured obligations. They are also called Junior (or
Mezzanine) notes and bonds.
Synthetic securitisation: A transaction where the assets are not sold to an SPV but remain on balance
sheet; and where only the credit risk of the assets is transferred to the market through credit default
swaps or credit linked notes.
Tranche: A piece, a portion or slice within a structured transaction.
True sale: It refers to the separation of the portfolio risk from the risk of the originator, i.e. there is a
non-recourse assignment of assets from the originator to the issuer (special purpose vehicle). To be
contrasted with synthetic securitisations where only the underlying credit risk is transferred.
Whole Business Securitisation (WBS): Securitisation of the general operating cash flow arising from a
certain line or area of the business of the originator over the long term.

88
Annex 3: List of acronyms
ABS: Asset Backed Securities
ABSPP: Asset Backed Securities Purchase Programme
AECM: European Association of Mutual Guarantee Societies
AFME: Association for financial markets in Europe
AIFMD: Alternative Investment Fund Managers Directive
BA: Business Angel
BAN: Business Angels Network
BCG: Boston Consulting Group
BCI: Business Climate Indicator
BLS: Bank Lending Survey
BMWi: Bundesministerium für Wirtschaft und Technologie
bn: billion
BoE: Bank of England
bp: basis point(s)
CDFIs: Community Development Financial Institutions
CDO: Collateralized Debt Obligation
CESEE (countries): (countries in) Central, Eastern and South-Eastern Europe
CGAP: Consultative Group to Assist the Poor
CGS: Credit Guarantee Scheme
CIP: Competitiveness and Innovation Framework Programme
CLN: Credit Linked Note
CLO: Collateralized Loan Obligation
CMU: Capital Markets Union
COM: European Commission (also: EC)
COSME: Programme for the Competitiveness of enterprises and SMEs (COSME) 2014-2020
CRD: Capital Requirements Directive
CRR: Capital Requirements Regulation
CVC: Corporate Venture Capital
EAF: European Angels Fund
EBA: European Banking Authority
EBAN: European Business Angels Network
EC: European Commission (also: COM)
ECB: European Central Bank
EFG: Equity Facility for Growth
EFSI: European Fund for Strategic Investments
EFTA: European Free Trade Association
EIB: European Investment Bank
EIF: European Investment Fund
EMEA: Europe, Middle East, and Africa
EMN: European Microfinance Network
EREM: EIB Group Risk Enhancement Mandate
ERP: European Recovery Program
ESBFO: European Small Business Finance Outlook
ESI: Economic Sentiment Indicator
ESIF: EU Structural and Investment Fund
EU: European Union
EU27: the 27 EU Member States
EU28: the 28 EU Member States
EUR: Euro
EuVECA: European Venture Capital Fund Regulation
EVCA: European Private Equity & Venture Capital Association

89
FLPG: First Loss Portfolio Guarantee
FRSP: Funded Risk Sharing Product
FTPYME: Fondos de Titulización de activos para Pequeñas Y Medianas Empresas (Asset
Securitization Funds for SMEs)
FYROM: Former Yugoslav Republic of Macedonia
GDP: Gross Domestic Product
GP: General Partner
HICP: Harmonised index of consumer prices
HM / HMT: HM Treasury is the UK government’s economic and finance ministry
HQS: High quality securitisation
HY: Half Year
ICT: Information and communications technologies
IMF: International Monetary Fund
IPO: Initial Public Offering
IRR: Internal Rate of Return
IT: Information Technology
JEREMIE: Joint European Resources for Micro to Medium Enterprises
k: thousand
LBO: Leveraged buy out
LFA: Förderbank Bayern
LGF: Loan Guarantee Facility
LP: Limited Partner
m: million
MAP: Multi Annual Programme for Enterprise and Entrepreneurship
MCIF: Mezzanine Co-Investment Facility
MDD: Mezzanine Dachfonds für Deutschland
MFG: Mezzanine Facility for Growth
MFI (in the context of ECB): Monetary Financial Institutions
MFI (in the context of microfinance): Microfinance Institution
NBFIs: Non-bank Financial Institutions
NFC: Non-financial corporation
NGO: Non-Governmental Organisation
NPB: National Promotional Bank
NPL: Non-performing loan
NRW: The development bank of North Rhine-Westphalia.
OECD: Organisation for Economic Co-Operation and Development
PE: Private Equity
PFB: Public Funding Body
pif: paid in full
PRSL: Portfolio Risk Sharing Loan
PVCI: Portugal Venture Capital Initiative
Q: Quarter
RCR: Risk Capital Resources
RMA: Research and Market Analysis
RMBS: Residential mortgage backed securities
RSFF: Risk Sharing Finance Facility
RSI: Risk-Sharing Instrument for Innovative and Research oriented SMEs and small Mid-Caps
SAFE: Survey on the Access to Finance of Enterprises
sf: Structured Finance
SIA: Social Impact Accelerator
SME: Small and medium sized enterprise
SMEG: SME Guarantee Facility
SMESec: SME Securitisation (comprising transactions based on SME loans, leases etc.)
SPV: Special Purpose Vehicle

90
SSM: Single Supervisory Mechanism
TMT: Technology, Media, Telecom
TT: Technology transfer
TTFF: Technology Transfer Finance Facility
UEAPME: European Association of Craft, Small and Medium-sized Enterprises
UK: United Kingdom
US: United States
VC: Venture Capital
VDB: Verband Deutscher Bürgschaftsbanken e.V.
WBS: Whole Business Securitisation

91
References
Asdrubali, P. and Signore, S. (2015). The economic impact of EU guarantees on credit to SMEs.
Evidence from CESEE countries. European Commission and European Investment Fund Joint Working
Paper. Forthcoming.
Aubrey, T., Thillaye, R., and Reed, A. (2015). Supporting investors and growth firms: A bottom-up
approach to a Capital Markets Union. Policy Network. 9 June 2015. http://www.policy-
network.net/publications/4916/Supporting-Investors-and-Growth-Firms
AFME (2015a). Securitisation data report Q4/2014 (and earlier reports).
http://www.afme.eu/Documents/Statistics-and-reports.aspx
AFME (2015b). Securitisation data snapshot Q1/2015. http://www.afme.eu/Documents/Statistics-
and-reports.aspx
AFME and BCG (2015). Bridging the growth gap. February 2015.
www.afme.eu/WorkArea/DownloadAsset.aspx?id=12509
Aiyar, S., Al-Eyd, A., Barkbu, B., and Jobst, A. (2015). Revitalizing Securitization for Small and
Medium-Sized Enterprises in Europe. IMF Staff Discussion Note SDN/15/07, May 2015.
http://www.imf.org/external/pubs/cat/longres.aspx?sk=42859
Akerlof, G. A. (1970). The Market for “Lemons”: Quality Uncertainty and the Market Mechanism. In:
Quarterly Journal of Economics, Vol. 84, No. 3, pp. 488–500.
Arrow, K. J. (1985). The Economics of Agency. In: J. W. Pratt und R. J. Zeckhauser, Principals and
Agents: The Structure of Business. 1985.
Bank of America/Merrill Lynch (2015a). Saving the European asset-based finance markets. European
Structured Finance - ABS. 20.02.2015.
Bank of America/Merrill Lynch (2015b). Shining light on CB & ABSPPs. European SF & CB Weekly.
06.04.2015.
Bank of America/Merrill Lynch (2015c). Week of 8th June 2015: Qualifying synthetics?. In: European
SF & CB Weekly. 14.06.2015.
Bergthaler, W., Kang, K., Liu, Y. and Monaghan, D. (2015). Tackling small and medium sized
enterprise problem loans in Europe. IMF Staff Discussion Note SDN/15/04, March 2015.
http://www.imf.org/external/pubs/ft/sdn/2015/sdn1504.pdf
Bruhn-Leon, B., Eriksson, P.-E. and Kraemer-Eis, H. (2012). Progress for microfinance in Europe. EIF
Research & Market Analysis. Working Paper 2012/013. January 2012.
http://www.eif.org/news_centre/research/index.htm
Coller Capital (2013). Global Private Equity Barometer. Winter 2013-14.
http://www.collercapital.com/uploaded/documents/Publications/2013/Coller_Capital_Global_Barom
eter_-_Winter_2013.pdf
Coller Capital (2014). Global Private Equity Barometer. Summer 2014. June 2014.
http://www.collercapital.com/Uploaded/Documents//Publications/2014/Coller_Capital_Global_Baro
meter_-_Summer_2014.pdf
Coller Capital (2015). Global Private Equity Barometer. Summer 2015. June 2015.
http://www.collercapital.com/Uploaded/Documents//Publications/2015/Global_Private_Equity_Baro
meter_Summer_2015_WEB.pdf
Council of the EU (2015). Investing in European projects: Council adopts EFSI regulation. Press
release. 25 June 2015. http://www.consilium.europa.eu/press-releases-
pdf/2015/6/40802199945_en.pdf
Cour-Thimann, P. and Winkler, B. (2013). The ECB’s non-standard monetary policy measures. The
role of institutional factors and financial structure. ECB Working Paper Series. No 1528. April 2013.
http://www.ecb.europa.eu/pub/pdf/scpwps/ecbwp1528.pdf
Cozarenco , A. (2015). Microfinance Institutions and Banks in Europe: The story to date. EMN
Research Paper 2015. June 2015.
Creditreform (2015).Corporate insolvencies in Europe 2014/15. 19.05.2015.

92
CSES (2012). Evaluation of EU Member States’ Business Angel Markets and Policies. Final Report.
October 2012. http://ec.europa.eu/enterprise/dg/files/ba-rep_en.pdf
EBA (2014). EBA Discussion Paper on simple standard and transparent securitisation. European
Banking Authority. 14.10.2014. https://www.eba.europa.eu/documents/10180/846157/EBA-DP-
2014-02+Discussion+Paper+on+simple+standard+and+transparent+securitisations.pdf
EBAN (2014). Statistics Compendium. http://www.eban.org/wp-content/uploads/2014/09/13.-
Statistics-Compendium-2014.pdf
ECB (2015a). Survey on the access to finance of enterprises in the Euro area. October 2014 to March
2015. June 2015. http://www.ecb.europa.eu/stats/money/surveys/sme/html/index.en.html
ECB (2015b). The euro area bank lending survey. First quarter 2015. April 2015.
http://www.ecb.europa.eu/stats/pdf/blssurvey_201410.pdf?2c94dc05dc5cd40aadb6f077dc320999
ECB (2015c). Financial Stability Review. May 2015.
https://www.ecb.europa.eu/pub/fsr/html/index.en.html
ECB (2015d). Euro area MFI interest rate statistics: April 2015. Press release. 05.06.2015.
http://www.ecb.eu/press/pr/stats/mfi/html/index.en.html
EIB (2014). Unlocking lending in Europe. October 2014.
http://www.eib.org/attachments/efs/economic_report_unlocking_lending_in_europe_en.pdf
EIF (2015a). Annual Report 2014. 18.05.2015.
http://www.eif.org/news_centre/publications/eif_annual_report_2014.pdf
EIF (2015b). EIB-EC SME Initiative: Spain first country to implement initiative. EIF press release. 26
January 2015. http://www.eif.org/what_we_do/guarantees/news/2015/SME-initiative.htm
EMN (2012). Bendig, M., Unterberg, M., and Sarpong, B. (2012). Overview of the Microcredit Sector
in the European Union 2010-2011. European Microfinance Network (EMN).27.12.2012.
http://www.mikrofinanz.net/fileadmin/user_upload/dateien/pdf/overview2010-2011-final.pdf
EMN (2014). Bendig, M., Unterberg, M., and Sarpong, B. (2014). Overview of the Microcredit Sector
in the European Union 2012-2013. European Microfinance Network. September 2014.
http://www.europeanmicrofinance.org/docs/emn_publications/emn_overview/Overview2012-
2013_Nov2014.pdf
EMN (2015). Crowdfunding and P2P lending: which opportunities for Microfinance? EMN Magazine
2015. May 2015.
EU IPO Task Force (2015). EU IPO Report. Rebuilding IPOs in Europe : Creating jobs and growth in
European capital markets. European Issuers, EVCA, FESE. March 2015.
http://www.europeanissuers.eu/_mdb/spotlight/44en_Final_report_IPO_Task_Force_20150323.pdf
Euler Hermes (2015). Macroeconomic, Country Risk and Global Sector Outlook. Economic Outlook
no. 1216. March 2015.
Eurochambres (2015). Economic Survey 2015.
http://www.eurochambres.eu/custom/EUROCHAMBRES_Economic_Survey_2015-2014-00860-01.pdf
European Commission (2012a). Flash Eurobarometer 354. 2012.
European Commission (2012b). Report from the Commission to the European Parliament and the
Council on the application of Directive 2006/48/EC to microcredit. COM (2012) 769 final.
18.12.2012.
European Commission (2014a). Annual Report on European SMEs 2013/2014 – A Partial and Fragile
Recovery. 2014. http://ec.europa.eu/enterprise/policies/sme/facts-figures-analysis/performance
review/index_en.htm
European Commission (2014b). Survey on the access to finance of enterprises (SAFE). 2014.
http://ec.europa.eu/enterprise/policies/finance/data/index_en.htm
European Commission (2015a). An EU framework for simple, transparent and standardised
securitisation. Brussels, 18.02.2015.
http://ec.europa.eu/finance/consultations/2015/securitisation/docs/consultation-document_en.pdf
European Commission (2015c). Business Climate Indicator for the Euro area. May 2015.
http://ec.europa.eu/economy_finance/db_indicators/surveys/index_en.htm

93
European Commission (2015b). Business and consumer survey results. May 2015.
http://ec.europa.eu/economy_finance/db_indicators/surveys/index_en.htm
European Commission (2015d). European Economic Forecast. Spring 2015.
http://ec.europa.eu/economy_finance/eu/forecasts/index_en.htm
European Commission (2015e). Green Paper. Building a Capital Markets Union. COM(2015)63.
http://eur-lex.europa.eu/legal-content/EN/TXT/?uri=CELEX:52015DC0063
European Commission (2015f). Initial reflections on the obstacles to the development of deep and
integrated EU capital markets. Commission staff working document. COM(2015)13.
http://eur-lex.europa.eu/legal-content/EN/TXT/?uri=CELEX:52015SC0013
European Parliament (2015). Spurring economic recovery: Parliament approves Juncker Plan rules.
Press release. 25 June 2015. http://www.europarl.europa.eu/news/en/news-
room/content/20150622IPR69218/html/Spurring-economic-recovery-Parliament-approves-Juncker-
Plan-rules
EVCA (2014). Quarterly Activity Indicator. Q1 2007 – Q3 2014. Statistics on Fundraising, Investments
& Divestments. 21 November 2014. http://www.evca.eu/media/332093/EVCA-Quarterly-Activity-
Indicator-Q3-2014-For-Members-and-Contributors-FINAL.pdf
EVCA (2015a). 2014 European Private Equity Activity. Statistics on Fundraising, Investment &
Divestments. May 2015. http://www.evca.eu/media/385581/2014-european-private-equity-activity-
final-v2.pdf
EVCA (2015b). European private equity investment over EUR 40bn in 2014, exits hit record levels, new
EVCA data shows. EVCA press release. 12 May 2015. http://www.evca.eu/news-
opinion/newsroom/press-releases/activity-data-2014/
EVCA (2015c). Public Affairs Overview. April 2015. http://www.evca.eu/media/379543/EVCA-PA-
Overview_April-2015.pdf
Ferrando, A. and Mulier, K. (2014). The real effects of credit constraints: Evidence from discouraged
borrowers in the euro area. Mimeo. 2014.
Fitch (2015). SME CLO Compare. May 2015.
Giese, V. (2014). Characteristics of European Corporate Venture Capital Investments – A Quantitative
Analysis across Selected Industries. Master thesis, University of Trier. 4.11.2014. Mimeo.
Global Corporate Venturing (2015). The World of Corporate Venturing 2015. The definitive guide to
the industry. 2015.
Go4Venture Advisers (2013). Go4Venture Advisers’ European Venture & Growth Equity Market
Monthly Bulletin – Methodology.
Go4Venture Advisers (2015). European Venture & Growth Equity Market Monthly Bulletin. March
2015. 02.05.2015. http://www.go4venture.com/bulletin/
Hellmann, T.F., Schure, P. and Vo, D. (2015). Angels and Venture Capitalists: Substitutes or
Complements? (February 23, 2015). Available at http://ssrn.com/abstract=2602739 or
http://dx.doi.org/10.2139/ssrn.2602739
Holton, S., Lawless, M., and McCann, F. (2012): Firm Credit in Europe: A tale of three crises.
Research Technical Paper, Central Bank of Ireland, June 29th 2012.
Huerga, J., Puigvert, J. and Rodriguez, C. (2012). Enhancements on ECB MFI Interest Rate Statistics.
In: OECD - The Statistics Newsletter. Issue No. 55. March 2012.
Ilges, R. (2015). Corporate Lending and Financing Gap over the Business Cycle. Master Thesis.
Delivered at the University of Trier. 29.04.2015. Mimeo.
IMF (2012). Global Financial Stability Report. April 2012.
http://www.imf.org/external/pubs/ft/gfsr/2012/01/pdf/text.pdf
IMF (2015a). Proposed attributes of High-Quality Securitization in Europe. 07.05.2015.
http://www.imf.org/external/pubs/ft/sdn/2015/sdn1507annexII.pdf
Jaffee, D.M. and Russel, T. (1976). Imperfect information, uncertainty and credit rationing. In:
Quarterly Journal of Economics. Vol. 90. November 1976.
94
IMF (2015b). Spring Economic Outlook. April 2015.
http://www.imf.org/external/pubs/ft/weo/2015/01/
J.P. Morgan (2015). Eyes on the Horizon. Global Social Finance. J.P. Morgan and GIIN. 4 May
2015. http://www.thegiin.org/cgi-bin/iowa/resources/research/662.html
Kelly, R. (2011). The performance and prospects of European Venture Capital. EIF Working Paper
2011/009. May 2011. http://www.eif.org/news_centre/research/index.htm
Kiyotaki, N. and Moore, J. (1997): Credit chains. In: Journal of Political Economy. 105.21: 211-248.
Kolev, A., Tanayama, T., and Wagenvoort, R. (ec. eds.) (2013). Investment and Investment Finance in
Europe. EIB Economics Department. http://www.eif.org/news_centre/publications/Bottlenecks-in-SME-
financing.htm
Kraemer-Eis, H. (2014). Institutional non-bank lending and the role of Debt Funds. With contributions
from F. Battazzi, R. Charrier, M. Natoli, M. Squilloni. EIF Working Paper 2014/25. October 2014.
http://www.eif.org/news_centre/publications/eif_wp_25.pdf
Kraemer-Eis, H. and Conforti, A. (2009). Microfinance in Europe. A market overview. EIF Working
Paper 2009/001. http://www.eif.org/news_centre/research/index.htm
Kraemer-Eis, H. and Lang, F. (2014a). Guidelines for SME Access to Finance Market Assessments
(GAFMA). EIF Research & Market Analysis. Working Paper 2014/022. April. 2014.
http://www.eif.org/news_centre/publications/EIF_Working_Paper_2014_22.htm
Kraemer-Eis, H. and Lang, F. (2014b). The importance of leasing for SME financing. In: World Leasing
Yearbook 2014. Euromoney, January 2014.
http://www.eif.org/news_centre/research/eif_euromoney_importance-of-leasing-for-smes_fv.pdf
Kraemer-Eis, H., and Lang, F. (2012). The importance of leasing for SME finance. EIF Working Paper
2012/15. 22.08.2012. http://www.eif.org/news_centre/research/index.htm
Kraemer-Eis, H. and Passaris, G. (2015). SME Securitization in Europe. In: The Journal of Structured
Finance, Vol. 20, No. 4, Winter 2015.
Kraemer-Eis, H., Schaber, M. and Tappi, A. (2010). SME loan securitisation. An important tool to
support European SME lending. EIF Working Paper 2010/007. October 2010.
http://www.eif.org/news_centre/publications/eif-wp_2010_007_smesec.pdf
Kraemer-Eis, H. and Schillo, M. (2011). Business Angels in Germany - EIF's initiative to support the
non-institutional financing market. EIF Working Paper 2011/011. November 2011.
http://www.eif.org/news_centre/research/index.htm
Kraemer-Eis, H., Lang, F. and Gvetadze, S. (2013a). Bottlenecks in SME financing. In: Kolev, A.,
Tanayama, T., and Wagenvoort, R. (ec. eds.) (2013). Investment and Investment Finance in Europe.
EIB Economics Department. Pp. 277ff. http://www.eif.org/news_centre/publications/Bottlenecks-in-
SME-financing.htm
Kraemer-Eis, H., Lang, F. and Gvetadze, S. (2013b). European Small Business Finance Outlook June
2013. EIF Working Paper 2012/018. June 2013. http://www.eif.org/news_centre/research/index.htm
Kraemer-Eis, H., Lang, F. and Gvetadze, S. (2013c). European Small Business Finance Outlook June
2013. EIF Working Paper 2012/020. December 2013.
http://www.eif.org/news_centre/research/index.htm
Kraemer-Eis, H., Lang, F. and Gvetadze, S. (2014a). European Small Business Finance Outlook. EIF
Working Paper 2014/24. EIF Research & Market Analysis. June 2014.
http://www.eif.org/news_centre/publications/eif_wp_24.pdf
Kraemer-Eis, H., Lang, F. and Gvetadze, S. (2014b). European Small Business Finance Outlook. EIF
Working Paper 2014/26. EIF Research & Market Analysis. December 2014.
http://www.eif.org/news_centre/research/index.htm
Mason, C.M. and Harrison, R.T. (2013). Business angel investment activity in the financial crisis: UK
evidence and policy implications. July 2013. http://www.gla.ac.uk/media/media_286594_en.pdf
Moeglich, A.-K. (2015). ABSPP – Auswirkungen auf den europäischen Verbriefungsmarkt. DZ Bank.
ABS & Structured Credits. 20.04.2015.
Moody’s (2014). Understanding the risks of synthetic transactions. Special comment. 30.09.2014.

95
Moody’s (2015). EMEA ABS SME loan and lease indices – January 2015. 06.05.2015
OECD (2006). The SME Financing Gap. Vol. 1. Theory and Evidence.
OECD (2011). Financing high-growth firms. The role of angel investors. December 2011.
OECD (2013). SME and Entrepreneurship Financing: The Role of Credit Guarantee Schemes and
Mutual Guarantee Societies in supporting finance for small and medium-sized enterprises. Final
Report. CFE/SME(2012)1/FINAL. Unclassified. 30.01.2013.
OECD (2014a). Entrepreneurship at a Glance 2014. http://www.oecd-ilibrary.org/industry-and-
services/entrepreneurship-at-a-glance-2014_entrepreneur_aag-2014-en
OECD (2014b). Financing SMEs and Entrepreneurs 2014. An OECD Scoreboard.
OECD (2015). Financing SMEs and Entrepreneurs 2015. An OECD Scoreboard.
OECD/The European Commission (2014). The Missing Entrepreneurs: Policies for inclusive
entrepreneurship in Europe. 2014.
Oxford Economics (2011). The use of leasing amongst European SMEs. A report prepared for
Leaseurope. November 2011.
Oxford Economics (2015). The Use of Leasing Amongst European SMEs. 2015 Report. A report
prepared for Leaseurope. Forthcoming.
Oxford Economics and Leaseurope (2015). The Use of Leasing Amongst European SMEs : 2015
Report – Summary of Key Findings. Brussels. 21 May 2015.
Preqin (2014). Preqin Investor Outlook: Alternative Assets. H1 2014.
https://www.preqin.com/docs/reports/Preqin_Investor_Outlook_Alternative_Assets_H1_2014.pdf
Preqin (2015). Private Equity in Europe. The facts. 16 June 2015.
https://www.preqin.com/docs/reports/Preqin-European-Private-Equity-June-2015.pdf
Scope (2015). Obstacles to public European SME CLOs. Special Report. 23.04.2015.
https://www.scoperatings.com/research/news-and-research
Segoviano, M., Bradley, J., and Lindner, P. (2015). Securitization: the road ahead. IMF Staff
Discussion Note SDN/15/01, January 2015.
http://www.imf.org/external/pubs/cat/longres.cfm?sk=41741
Standard & Poor’s (2014). Seven years on, the cumulative default rate for European Structured
Finance is only 1.6%. 26.08.2014.
Stiglitz, J.E. and Weiss, A. (1981). Credit Rationing in Markets with Incomplete Information. In: The
American Economic Review, Vol. 71, No. 3, pp. 393-410.
UEAPME Study Unit (2015). The EU Craft and SME Barometer 2015/H1. March 2015.
http://www.ueapme.com/spip.php?rubrique120
Unquote Intelligence (2014). The Role of Public Funding Bodies in European Venture Capital. Q2
2014.
VDB (2012). Stabilität für den Mittelstand. Die deutschen Bürgschaftsbanken 2011. Verbandsbericht.
http://www.vdb-info.de/media/file/1919.VDB_Verbandsbericht_2011.pdf
VIWGCGS (2014). Credit Guarantee Schemes for SME lending in Central, Eastern and South-Eastern
Europe. A report by the Vienna Initiative Working Group on Credit Guarantee Schemes. November
2014. http://www.eib.org/infocentre/publications/all/viwg-credit-guarantee-schemes-report.htm
Wehinger, G. and Nassr, I (2015). Unlocking SME finance through market-based debt: Securitisation,
private placements and bonds, In: OECD Journal: Financial Market Trends. April 2015.
http://www.oecd.org/daf/fin/financial-markets/Unlocking-SME-finance-through-market-based-
debt.pdf
Wilson, K. (2015a). How to unleash the financing of high growth firms in Europe : 10
recommendations for catalysing growth. Bruegel blog. 27 May 2015.
http://www.bruegel.org/nc/blog/detail/article/1636-how-to-unleash-the-financing-of-high-growth-
firms-in-europe/

96
Wilson, K. (2015b). “Policy Lessons from Financing Innovative Firms”. OECD Science, Technology and
Industry Policy Papers, No. 24. OECD Publishing, Paris. 24 June 2015.
http://dx.doi.org/10.1787/5js03z8zrh9p-en
World Bank (2014). Doing Business 2015. Going beyond efficiency. 12th
edition.
http://www.doingbusiness.org/~/media/GIAWB/Doing%20Business/Documents/Annual-
Reports/English/DB15-Full-Report.pdf
97
About …
… the European Investment Fund
The European Investment Fund (EIF) is the European body specialised in small and medium sized
enterprise (SME) risk financing. The EIF is part of the European Investment Bank group and has a
unique combination of public and private shareholders. It is owned by the EIB (63.7%), the
European Union - through the European Commission (24.3%) and a number (26 from 15
countries) of public and private financial institutions (12.0%).
EIF's central mission is to support Europe's SMEs by helping them to access finance. EIF primarily
designs and develops venture capital and guarantees instruments which specifically target this
market segment. In this role, EIF fosters EU objectives in support of innovation, research and
development, entrepreneurship, growth, and employment.
The EIF total net commitments to venture capital and private equity funds amounted to over EUR
8.2bn at end 2014. With investments in over 500 funds, the EIF is the leading player in European
venture capital due to the scale and the scope of its investments, especially in the high-tech and
early-stage segments. The EIF commitment in guarantees totaled over EUR 5.7bn in over 300
operations at end 2014, positioning it as a major European SME loan guarantees actor and a
leading microfinance guarantor.
… EIF’s Research & Market Analysis
Research & Market Analysis (RMA) supports EIF’s strategic decision-making, product development
and mandate management processes through applied research and market analyses. RMA works
as internal advisor, participates in international fora and maintains liaison with many
organisations and institutions.
… this Working Paper series
The EIF Working Papers are designed to make available to a wider readership selected topics and
studies in relation to EIF´s business. The Working Papers are edited by EIF´s Research & Market
Analysis and are typically authored or co-authored by EIF staff. The Working Papers are usually
available only in English and distributed only in electronic form (pdf).
98
EIF Working Papers
2009/001 Microfinance in Europe – A market overview.
November 2009.
2009/002 Financing Technology Transfer.
December 2009.
2010/003 Private Equity Market in Europe – Rise of a new cycle or tail of the recession?
February 2010.
2010/004 Private Equity and Venture Capital Indicators – A research of EU27 Private Equity
and Venture Capital Markets. April 2010.
2010/005 Private Equity Market Outlook.
May 2010.
2010/006 Drivers of Private Equity Investment activity. Are Buyout and Venture investors really
so different? August 2010
2010/007 SME Loan Securitisation – an important tool to support European SME lending.
October 2010.
2010/008 Impact of Legislation on Credit Risk – How different are the U.K. and Germany?
November 2010.
2011/009 The performance and prospects of European Venture Capital.
May 2011.
2011/010 European Small Business Finance Outlook 1/2011.
June 2011.
2011/011 Business Angels in Germany. EIF’s initiative to support the non-institutional financing
market. November 2011.
2011/012 European Small Business Finance Outlook 2/2011.
December 2011.
2012/013 Progress for microfinance in Europe.
January 2012.
2012/014 European Small Business Finance Outlook.
May 2012.
2012/015 The importance of leasing for SME finance.
August 2012.
2012/016 European Small Business Finance Outlook.
December 2012.

99
2013/017 Forecasting distress in European SME portfolios.
May 2013.
2013/018 European Small Business Finance Outlook.
June 2012.
2013/019 SME loan securitisation 2.0 – Market assessment and policy options.
October 2013.
2013/020 European Small Business Finance Outlook.
December 2013.
2014/021 Financing the mobility of students in European higher education.
January 2014.
2014/022 Guidelines for SME Access to Finance Market Assessments
April 2014.
2014/023 Pricing Default Risk: the Good, the Bad, and the Anomaly.
June 2014.
2014/024 European Small Business Finance Outlook.
June 2014.
2014/025 Institutional non-bank lending and the role of debt funds.
October 2014.
2014/026 European Small Business Finance Outlook.
December 2014.
2015/027 Bridging the university funding gap: determinants and
consequences of university seed funds and proof-of-concept
Programs in Europe.
May 2015.
2015/028 European Small Business Finance Outlook.
June 2015.


