Abstract— This paper analyses the various losses due to
partial shading on different photovoltaic array configurations
under moving non-uniform illumination conditions (passing
cloud). Each solar array is composed of modules which are
interconnected in series and parallel. Bypass diodes are also
modelled to avoid hotspot conditions in a photovoltaic module.
The developed model is able to simulate and compute the
electrical characteristics of the different array configurations
under changing illumination conditions. The array
configurations have been compared on the basis of various
partial shading losses and fill factor.
Index Terms— bypass diode; mismatch loss; fill factor;
passing cloud; single diode model
I. INTRODUCTION
The energy requirement of the world is ever increasing.
Among the renewable sources accessible, solar energy has
received special attention. In the recent years the
advancement of smart grid concept has acted as a catalyst
for the widespread expansion of Photo Voltaic (PV)
systems. The electric grids have precise voltage levels. In
order to interface the PV generators with the grid, the PV
cells are connected in series to form PV modules. The
generators are built by linking the PV modules in series and
in parallel (PV array) in order to get necessary voltage level
and to increase the nominal power of the generator.
The series connection of PV cells is subjected to
mismatch power losses if the electrical characteristics of the
PV cells are not identical or the cells do not operate under
uniform conditions. The PV cell with the lowermost short
circuit (SC) current limits the current of the whole series
connection [1]. The major environmental reason for the
uneven SC current is the partial shading (PS) of the PV
power generator due to clouds, nearby trees, buildings etc.
This will also generate hot spots in the shaded cells and the
cell may be damaged [2]. To prevent PV cells from damage
Manuscript received April 8, 2014; revised April 15, 2014.
Vijayalekshmy S is a research scholar in the Department of Electrical
Engineering, College of Engineering, Trivandrum, Kerala, India.
(corresponding author: +914712446994); e-mail: 73viji@ gmail.com).
Bindu G R is Associate Professor in the Department of Electrical and
Electronics Engineering, College of Engineering, Trivandrum, Kerala,
India.e-mail: [email protected].
S Rama Iyer was the Dean at College of Engineering, Trivandrum.e-
mail:[email protected]
due to hotspots, bypass diodes are connected in antiparallel
with the PV cells [3]. When the shaded cells in the PV
module become reverse biased, the bypass diode connected
in antiparallel begins to bypass the current exceeding the SC
current of the shaded cells and limits the power dissipated in
the shaded cells.
When the bypass diodes conduct during non-uniform
condition, the power- voltage (PV) curves of a PV generator
shows multiple maxima. Thus the extraction of maximum
power from the PV array becomes complex since there are
local maximum power point (MPP) at low voltages and at
higher voltages. Techniques to track the global maximum
power point (GMPP) have also been developed as in [4] -
[8], but they tend to be complicated and many of them are
unable to track the GMPP under changing illumination
conditions.
Significant influence on partial shading on the electrical
characteristics and the power output of the PV arrays on the
different PV generator configurations has been reported by
researchers [9]. The focus has been mainly on the
development of a simulation model for a series connected
PV array and on the operation of MPPT algorithms or the
converter configuration. A new mathematical formulation
for the optimal reconfiguration of PV arrays to minimize
partial shading losses has been developed in [10]. The
mismatch losses and the power losses due to tracking of
local MPP instead of the global one for long string, parallel
string and multi string configurations has been studied in
[11]. A comparative analysis on the performance of a short
string of series connected and parallel connected PV
modules for low power application is dealt in [12]. A
detailed analysis on the various array configurations under
changing illumination conditions is reported in [13]. In [14],
a method to configure the physical placement of the modules
based on Su Do Ku puzzle pattern in a TCT connected PV
array has been proposed to enhance the PV power
generation under partial shaded conditions.
In this paper, the various partial shading losses due to the
false tracking of the local MPP instead of the global MPP
and fill factor under changing illumination conditions (i.e. a
passing cloud) have been thoroughly investigated. Four
configurations namely series parallel (SP), bridge linked
(BL), honey comb (HC) and total cross tied (TCT)
configurations have been investigated by using a MATLAB
/Simulink model. The influence of bypass diodes on the
electrical characteristics of the solar array under moving
shadows for the four configurations have also been
evaluated.
Estimation of Power Losses in Photovoltaic
Array Configurations under Passing Cloud
Conditions
Vijayalekshmy S, Bindu G R, and S Rama Iyer
Proceedings of the World Congress on Engineering 2014 Vol I, WCE 2014, July 2 - 4, 2014, London, U.K.
ISBN: 978-988-19252-7-5 ISSN: 2078-0958 (Print); ISSN: 2078-0966 (Online)
WCE 2014
I. PV MODULE MODELLING
Various electrical equivalents of the PV cell are found in
literature of which the single diode model is the most widely
used model. In this paper the single diode model of the PV
cell proposed by Villalva et al [15] is implemented. The PV
cell current is given by (1).
where V and I represent the PV cell output voltage and
current respectively, Iph is the light generated cell current
(photo current), Rs and Rsh are the solar cell series and shunt
resistances, I0, the reverse saturation current, A is a
dimensionless junction material factor, K is Boltzmann‟s
constant (1.38 × 10⁻²³
J/K), T is the temperature in Kelvin
and q is the electron charge (1.6 × 10⁻²³
C) respectively.
The photo current Iph can be expressed by the relation,
In (2), Isc is the cell SC current, Ki the temperature
coefficient of SC current, G the irradiance reaching the
surface of the module and ST the Standard test conditions:
Irradiance 1000W/m2, cell junction temperature 25
0 C, and
reference air mass 1.5 solar spectral irradiance distribution.
Definite number of such solar cells is connected in series to
constitute a PV module. The module current, Imod is
described by equation (3)
Vmod is the output voltage of the module , Ns is the number of
solar cells connected in series to constitute a PV module ,
RsM the series resistance of the module and RshM the shunt
resistance of the module.
Bypass diodes are connected across each module (fig .1.)
to bypass the module current under shadowing conditions so
as to protect the module from damage. Henceforth the
expression for module current with bypass diode is as in (4).
Iobypass is the saturation current and Abypass is the ideality
factor of the bypass diode. The simulation has been
performed for the values available from the datasheet of
GENERIC POLY 60Wp module. The open circuit (OC)
voltage and SC current of the module under ST conditions
are 21.1V and 3.8A respectively. The nominal voltage and
current are 17.1V and 3.5A respectively. The shunt
resistance and series resistance of the module considered are
339.1Ω and 0.1Ω respectively.
II. PARTIAL SHADING LOSSES.
The MPP of the array does not match with the MPP of
the individual modules under PS conditions and this causes
power losses through different mechanisms [16]. Various
powers
Fig. 1. Equivalent circuit of PV Module with bypass diode.
Fig. 2. Various losses for the PS Array
losses due to PS are illustrated in fig. 2. The maximum
possible power under PS is the sum of the maximum powers
of the individual modules when operating independently
under the same solar insolation. Obviously, array maximum
power without partial shading is always more than the
maximum possible power under PS. The difference between
the two powers, the shading losses cannot be avoided.
Mismatch loss is a distinctive property of each generator
configuration. Mismatch loss of the PV generator is
calculated by comparing the power of the global MPP to the
sum of the maximum power of the individual modules under
PS conditions. The mismatch loss represents the lost power
owing to the fact that the PV modules do not operate at its
own MPP, although the whole PV generator operates at its
GMPP. Mismatch loss is depicted by (5)
Loss of power due to PS is also defined by the Fill Factor
(FF). FF is specified by (6)
III. ARRAY CONFIGURATIONS.
Four different configurations (Fig. 3) as described in
Section I are considered in this paper. In SP, the modules are
first connected in series to get the preferred voltage and then
the series connected modules are paralleled to get the
desired power output. In BL configuration the modules are
interconnected as in a bridge approach. Two modules in a
bridge are linked in series and then they are connected in
parallel. Bridges are interconnected through ties. TCT
Proceedings of the World Congress on Engineering 2014 Vol I, WCE 2014, July 2 - 4, 2014, London, U.K.
ISBN: 978-988-19252-7-5 ISSN: 2078-0958 (Print); ISSN: 2078-0966 (Online)
WCE 2014

configuration has been derived from SP by interconnecting
the rows of the junction through ties. In TCT, voltage across
the various ties and the sum of the currents through various
ties are equal. The BL configuration has been adapted to get
the HC configuration. TCT has more number
SP BL HC TCT
Fig.3. Different Array Configurations
of ties which make difficulties in the interconnection
between the modules. HC has lesser number of ties and
under certain conditions of insolation level HC is more
suitable than TCT.
IV. MODELLING AND SIMULATION OF A MOVING CLOUD.
The PV array is modelled as a matrix with dimensions
(pxq), where p denotes the number of modules in the series
string and q represents the number of modules in the parallel
string. The shadow of the moving cloud will reduce the solar
irradiance resulting in non-uniform solar insolation to the
PV array. The change in insolation will change the SC
current and the OC voltage of each cell. The temperature of
the solar cells is assumed to remain constant. The irradiance
of each solar module at each instant of time (t1 to t4) varies
in accordance with the ST conditions.
For simulating a moving cloud a method has been
proposed in [17].The distance Dx, y between the solar module
with index (x, y) at instant of time tz and the center of the
cloud is to be determined. This is found by solving (7)
The cloud is moving with the speed v . Realistic values for
the ratio of irradiance in each solar cell or module will range
from 0 to 1, and can be specified using the sine function as
in the subsequent equation
In (8), ISC0 is the short circuit current of the non-shaded solar
cell and ISC(x,y) are short circuit current of the solar cell (x,y).
The approaching cloud is darker at the center and brighter at
the bounds. At t1 the epicenter of the cloud falls in the lowest
left solar cell. At the end point t4, the center of the cloud
falls in the extreme right side solar cell. The insolation is
roughly proportional to the short- circuit current, so that the
effect of a passing cloud to a solar array may be modelled as
the change of SC current through all elements of p x q
matrix. Fig.4. illustrates the graphical output of the
MATLAB program based on (7) and (8).
(a)
(b)
(c)
(d)
Fig.4. The non-uniform irradiance due to the effect of a passing cloud. The irradiance at each instant of time (t1 –t4) as denoted in (a), (b), (c) and (d)
Proceedings of the World Congress on Engineering 2014 Vol I, WCE 2014, July 2 - 4, 2014, London, U.K.
ISBN: 978-988-19252-7-5 ISSN: 2078-0958 (Print); ISSN: 2078-0966 (Online)
WCE 2014
V. RESULTS AND DISCUSSION.
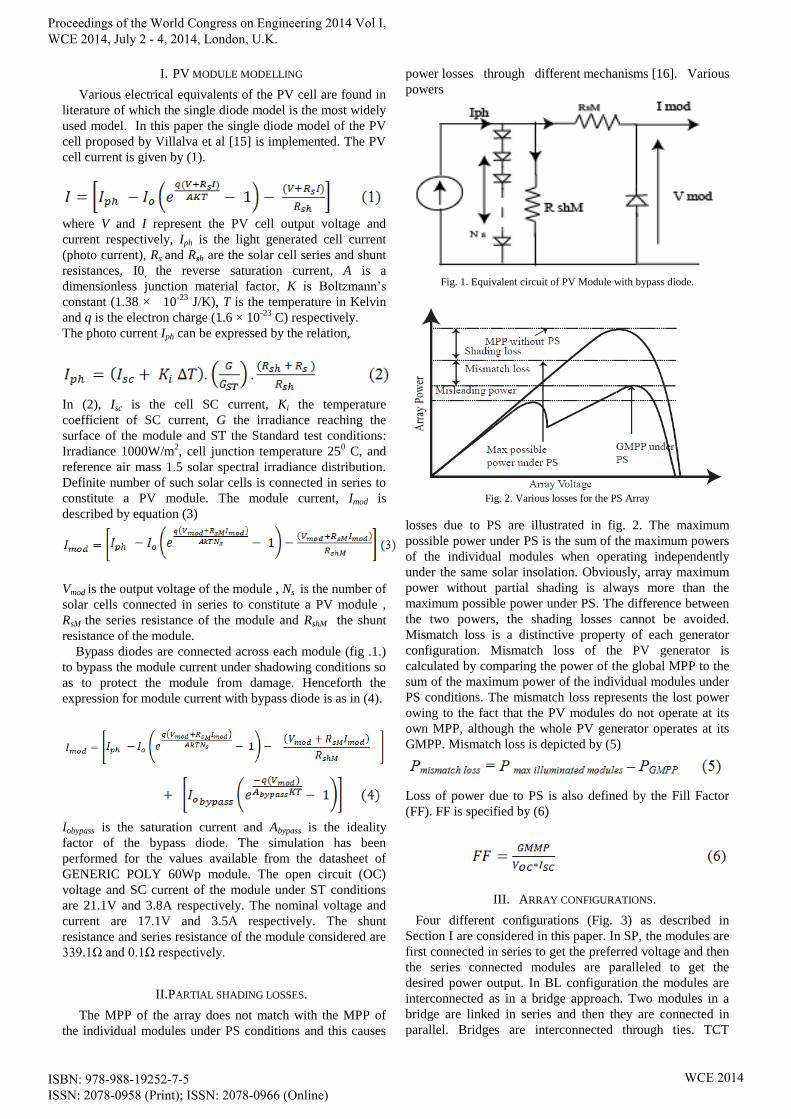
A. Mismatch loss
Mismatch loss is the difference between the sum of
individual maximum power under PS conditions and the
GMMP. The sum of individual maximum powers under PS
is the same irrespective of the configuration. Mismatch loss
of the four different configurations of the approaching
cloud is shown in bar chart (Fig.5.). For all the four
configurations it is observed that at time instants of t2 and t3,
the mismatch loss is less than at instants of t1 and t4. At t2
and t3 the locus of the cloud is towards the centre of the
array and hence there is only small variation in the insolation
levels between the various modules. But at instants of t1 and
t4 the centre of the cloud is towards the corners of the array.
Hence there is wide discrepancy in insolation level among
the modules. Hence it is concluded that shade dispersion
improves the power output of the array. The mismatch loss
is found to be more for a SP configuration. As the number of
parallel ties in the configurations increases, the mismatch
loss is found to decline appreciably. The mismatch loss is
found to be lower in the case of a TCT configuration as is
evident from the literature.
Fig. 5. % Mismatch loss for the four configurations
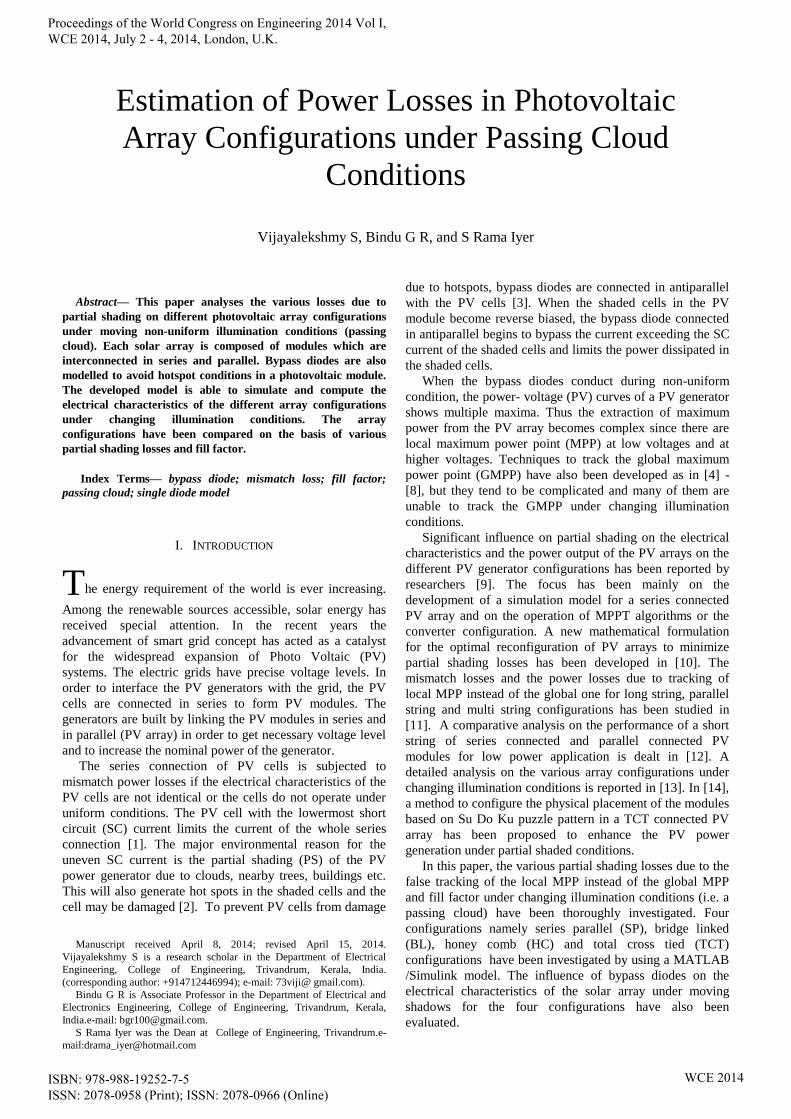
B. Shading loss
Shading loss is the difference between the array maximum power without PS and the sum of individual maximum power of the modules under PS condition. Unlike the mismatch loss TCT configuration does not produce the maximum possible power under PS conditions. The array maximum power without PS is 806.3W for all the configurations under study. Further the sum of individual maximum powers for the four configurations at instants of t1, t2, t3 and t4 are 590.11W, 712.2W, 712.2W and 590.11 W respectively. Hence the shading loss for the four configurations under study is the same at instants of t1, t2, t3 and t4. The shading loss is as depicted in fig. 6.
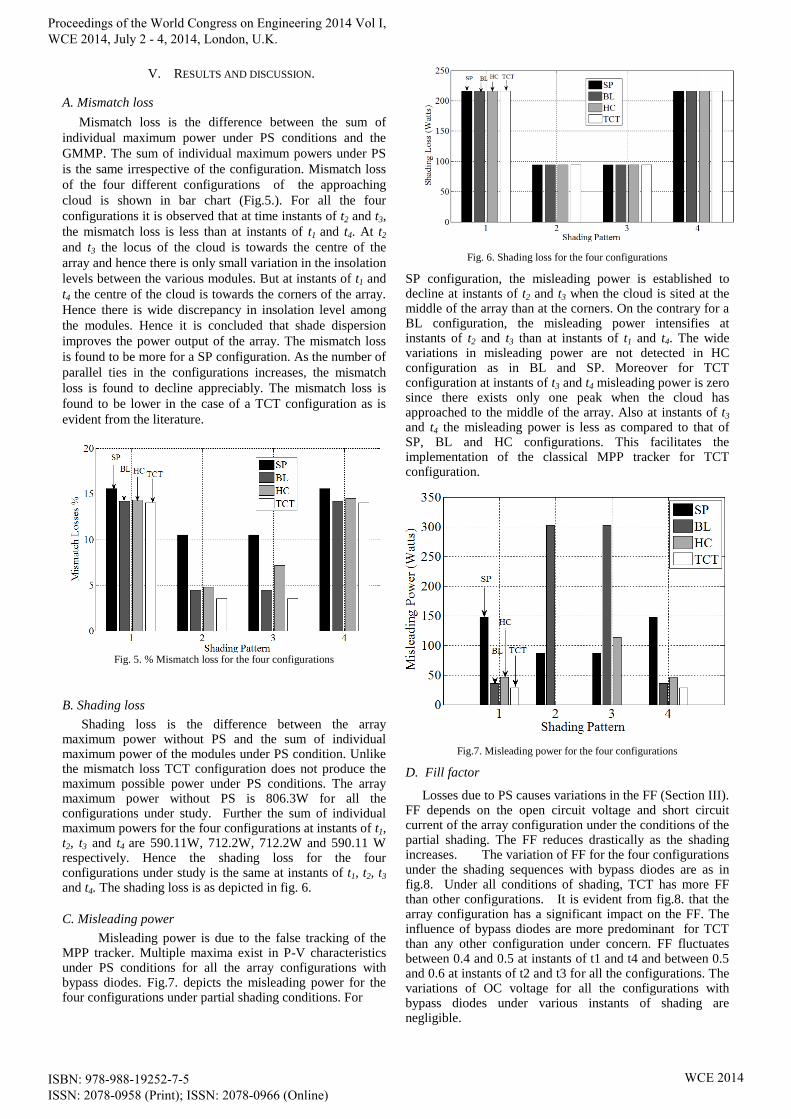
C. Misleading power
Misleading power is due to the false tracking of the MPP tracker. Multiple maxima exist in P-V characteristics under PS conditions for all the array configurations with bypass diodes. Fig.7. depicts the misleading power for the four configurations under partial shading conditions. For
Fig. 6. Shading loss for the four configurations
SP configuration, the misleading power is established to decline at instants of t2 and t3 when the cloud is sited at the middle of the array than at the corners. On the contrary for a BL configuration, the misleading power intensifies at instants of t2 and t3 than at instants of t1 and t4. The wide variations in misleading power are not detected in HC configuration as in BL and SP. Moreover for TCT configuration at instants of t3 and t4 misleading power is zero since there exists only one peak when the cloud has approached to the middle of the array. Also at instants of t3 and t4 the misleading power is less as compared to that of SP, BL and HC configurations. This facilitates the implementation of the classical MPP tracker for TCT configuration.
Fig.7. Misleading power for the four configurations
D. Fill factor
Losses due to PS causes variations in the FF (Section III). FF depends on the open circuit voltage and short circuit current of the array configuration under the conditions of the partial shading. The FF reduces drastically as the shading increases. The variation of FF for the four configurations under the shading sequences with bypass diodes are as in fig.8. Under all conditions of shading, TCT has more FF than other configurations. It is evident from fig.8. that the array configuration has a significant impact on the FF. The influence of bypass diodes are more predominant for TCT than any other configuration under concern. FF fluctuates between 0.4 and 0.5 at instants of t1 and t4 and between 0.5 and 0.6 at instants of t2 and t3 for all the configurations. The variations of OC voltage for all the configurations with bypass diodes under various instants of shading are negligible.
Proceedings of the World Congress on Engineering 2014 Vol I, WCE 2014, July 2 - 4, 2014, London, U.K.
ISBN: 978-988-19252-7-5 ISSN: 2078-0958 (Print); ISSN: 2078-0966 (Online)
WCE 2014
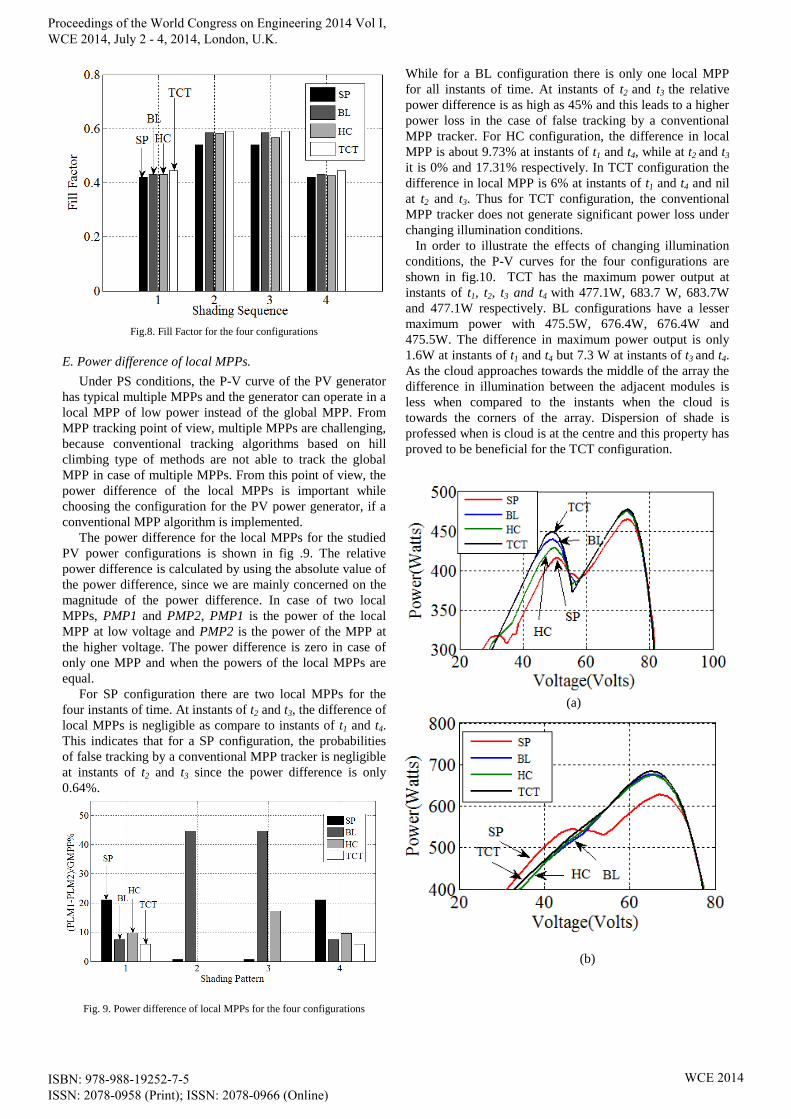
Fig.8. Fill Factor for the four configurations
E. Power difference of local MPPs.
Under PS conditions, the P-V curve of the PV generator
has typical multiple MPPs and the generator can operate in a
local MPP of low power instead of the global MPP. From
MPP tracking point of view, multiple MPPs are challenging,
because conventional tracking algorithms based on hill
climbing type of methods are not able to track the global
MPP in case of multiple MPPs. From this point of view, the
power difference of the local MPPs is important while
choosing the configuration for the PV power generator, if a
conventional MPP algorithm is implemented.
The power difference for the local MPPs for the studied
PV power configurations is shown in fig .9. The relative
power difference is calculated by using the absolute value of
the power difference, since we are mainly concerned on the
magnitude of the power difference. In case of two local
MPPs, PMP1 and PMP2, PMP1 is the power of the local
MPP at low voltage and PMP2 is the power of the MPP at
the higher voltage. The power difference is zero in case of
only one MPP and when the powers of the local MPPs are
equal.
For SP configuration there are two local MPPs for the
four instants of time. At instants of t2 and t3, the difference of
local MPPs is negligible as compare to instants of t1 and t4.
This indicates that for a SP configuration, the probabilities
of false tracking by a conventional MPP tracker is negligible
at instants of t2 and t3 since the power difference is only
0.64%.
Fig. 9. Power difference of local MPPs for the four configurations
While for a BL configuration there is only one local MPP
for all instants of time. At instants of t2 and t3 the relative
power difference is as high as 45% and this leads to a higher
power loss in the case of false tracking by a conventional
MPP tracker. For HC configuration, the difference in local
MPP is about 9.73% at instants of t1 and t4, while at t2 and t3
it is 0% and 17.31% respectively. In TCT configuration the
difference in local MPP is 6% at instants of t1 and t4 and nil
at t2 and t3. Thus for TCT configuration, the conventional
MPP tracker does not generate significant power loss under
changing illumination conditions.
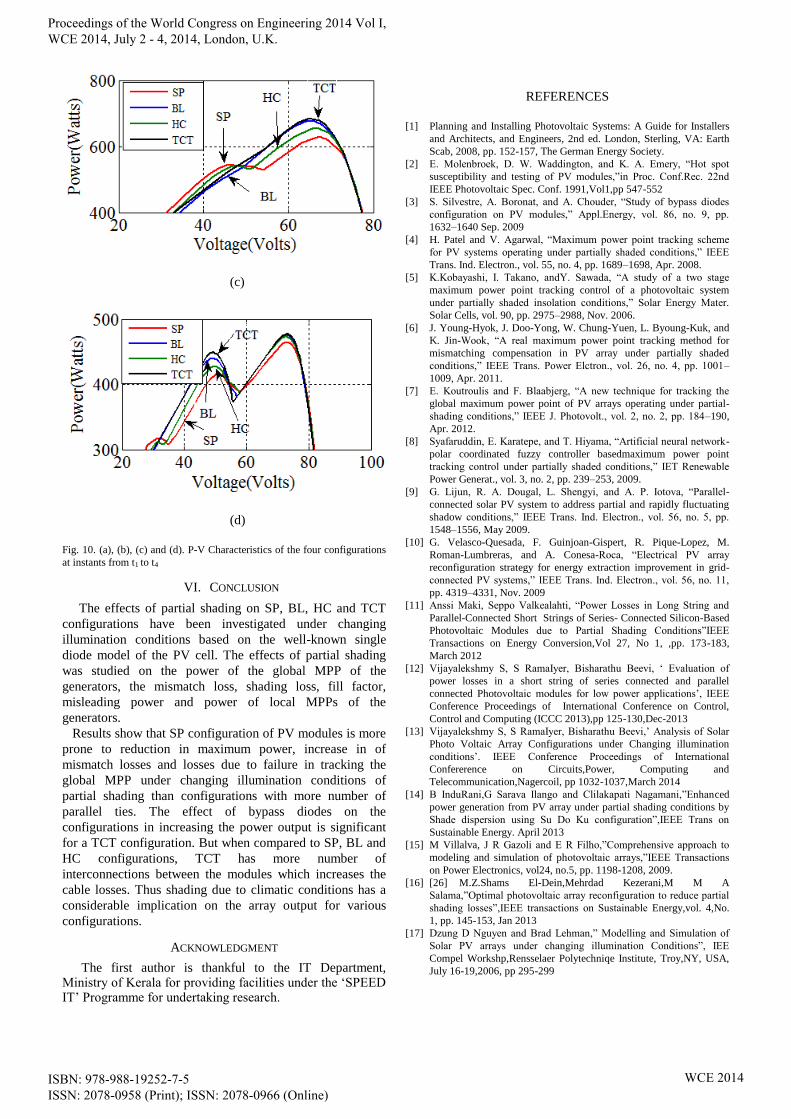
In order to illustrate the effects of changing illumination
conditions, the P-V curves for the four configurations are
shown in fig.10. TCT has the maximum power output at
instants of t1, t2, t3 and t4 with 477.1W, 683.7 W, 683.7W
and 477.1W respectively. BL configurations have a lesser
maximum power with 475.5W, 676.4W, 676.4W and
475.5W. The difference in maximum power output is only
1.6W at instants of t1 and t4 but 7.3 W at instants of t3 and t4.
As the cloud approaches towards the middle of the array the
difference in illumination between the adjacent modules is
less when compared to the instants when the cloud is
towards the corners of the array. Dispersion of shade is
professed when is cloud is at the centre and this property has
proved to be beneficial for the TCT configuration.
(a)
(b)
Proceedings of the World Congress on Engineering 2014 Vol I, WCE 2014, July 2 - 4, 2014, London, U.K.
ISBN: 978-988-19252-7-5 ISSN: 2078-0958 (Print); ISSN: 2078-0966 (Online)
WCE 2014
(c)
(d)
Fig. 10. (a), (b), (c) and (d). P-V Characteristics of the four configurations
at instants from t1 to t4
VI. CONCLUSION
The effects of partial shading on SP, BL, HC and TCT
configurations have been investigated under changing
illumination conditions based on the well-known single
diode model of the PV cell. The effects of partial shading
was studied on the power of the global MPP of the
generators, the mismatch loss, shading loss, fill factor,
misleading power and power of local MPPs of the
generators.
Results show that SP configuration of PV modules is more
prone to reduction in maximum power, increase in of
mismatch losses and losses due to failure in tracking the
global MPP under changing illumination conditions of
partial shading than configurations with more number of
parallel ties. The effect of bypass diodes on the
configurations in increasing the power output is significant
for a TCT configuration. But when compared to SP, BL and
HC configurations, TCT has more number of
interconnections between the modules which increases the
cable losses. Thus shading due to climatic conditions has a
considerable implication on the array output for various
configurations.
ACKNOWLEDGMENT
The first author is thankful to the IT Department, Ministry of Kerala for providing facilities under the „SPEED IT‟ Programme for undertaking research.
REFERENCES
[1] Planning and Installing Photovoltaic Systems: A Guide for Installers
and Architects, and Engineers, 2nd ed. London, Sterling, VA: Earth
Scab, 2008, pp. 152-157, The German Energy Society.
[2] E. Molenbroek, D. W. Waddington, and K. A. Emery, “Hot spot
susceptibility and testing of PV modules,”in Proc. Conf.Rec. 22nd
IEEE Photovoltaic Spec. Conf. 1991,Vol1,pp 547-552
[3] S. Silvestre, A. Boronat, and A. Chouder, “Study of bypass diodes
configuration on PV modules,” Appl.Energy, vol. 86, no. 9, pp.
1632–1640 Sep. 2009
[4] H. Patel and V. Agarwal, “Maximum power point tracking scheme
for PV systems operating under partially shaded conditions,” IEEE
Trans. Ind. Electron., vol. 55, no. 4, pp. 1689–1698, Apr. 2008.
[5] K.Kobayashi, I. Takano, andY. Sawada, “A study of a two stage
maximum power point tracking control of a photovoltaic system
under partially shaded insolation conditions,” Solar Energy Mater.
Solar Cells, vol. 90, pp. 2975–2988, Nov. 2006.
[6] J. Young-Hyok, J. Doo-Yong, W. Chung-Yuen, L. Byoung-Kuk, and
K. Jin-Wook, “A real maximum power point tracking method for
mismatching compensation in PV array under partially shaded
conditions,” IEEE Trans. Power Elctron., vol. 26, no. 4, pp. 1001–
1009, Apr. 2011.
[7] E. Koutroulis and F. Blaabjerg, “A new technique for tracking the
global maximum power point of PV arrays operating under partial-
shading conditions,” IEEE J. Photovolt., vol. 2, no. 2, pp. 184–190,
Apr. 2012.
[8] Syafaruddin, E. Karatepe, and T. Hiyama, “Artificial neural network-
polar coordinated fuzzy controller basedmaximum power point
tracking control under partially shaded conditions,” IET Renewable
Power Generat., vol. 3, no. 2, pp. 239–253, 2009.
[9] G. Lijun, R. A. Dougal, L. Shengyi, and A. P. Iotova, “Parallel-
connected solar PV system to address partial and rapidly fluctuating
shadow conditions,” IEEE Trans. Ind. Electron., vol. 56, no. 5, pp.
1548–1556, May 2009.
[10] G. Velasco-Quesada, F. Guinjoan-Gispert, R. Pique-Lopez, M.
Roman-Lumbreras, and A. Conesa-Roca, “Electrical PV array
reconfiguration strategy for energy extraction improvement in grid-
connected PV systems,” IEEE Trans. Ind. Electron., vol. 56, no. 11,
pp. 4319–4331, Nov. 2009
[11] Anssi Maki, Seppo Valkealahti, “Power Losses in Long String and
Parallel-Connected Short Strings of Series- Connected Silicon-Based
Photovoltaic Modules due to Partial Shading Conditions”IEEE
Transactions on Energy Conversion,Vol 27, No 1, ,pp. 173-183,
March 2012
[12] Vijayalekshmy S, S RamaIyer, Bisharathu Beevi, „ Evaluation of
power losses in a short string of series connected and parallel
connected Photovoltaic modules for low power applications‟, IEEE
Conference Proceedings of International Conference on Control,
Control and Computing (ICCC 2013),pp 125-130,Dec-2013
[13] Vijayalekshmy S, S RamaIyer, Bisharathu Beevi,‟ Analysis of Solar
Photo Voltaic Array Configurations under Changing illumination
conditions‟. IEEE Conference Proceedings of International
Confererence on Circuits,Power, Computing and
Telecommunication,Nagercoil, pp 1032-1037,March 2014
[14] B InduRani,G Sarava Ilango and Clilakapati Nagamani,”Enhanced
power generation from PV array under partial shading conditions by
Shade dispersion using Su Do Ku configuration”,IEEE Trans on
Sustainable Energy. April 2013
[15] M Villalva, J R Gazoli and E R Filho,”Comprehensive approach to
modeling and simulation of photovoltaic arrays,”IEEE Transactions
on Power Electronics, vol24, no.5, pp. 1198-1208, 2009.
[16] [26] M.Z.Shams El-Dein,Mehrdad Kezerani,M M A
Salama,”Optimal photovoltaic array reconfiguration to reduce partial
shading losses”,IEEE transactions on Sustainable Energy,vol. 4,No.
1, pp. 145-153, Jan 2013
[17] Dzung D Nguyen and Brad Lehman,” Modelling and Simulation of
Solar PV arrays under changing illumination Conditions”, IEE
Compel Workshp,Rensselaer Polytechniqe Institute, Troy,NY, USA,
July 16-19,2006, pp 295-299
Proceedings of the World Congress on Engineering 2014 Vol I, WCE 2014, July 2 - 4, 2014, London, U.K.
ISBN: 978-988-19252-7-5 ISSN: 2078-0958 (Print); ISSN: 2078-0966 (Online)
WCE 2014


