
English Housing Survey Headline Report 2014-15
Contents
Introduction and main findings Section 1: Households Section 2: Housing stock Technical notes and glossary

Introduction and main findings | 1
Introduction and main findings
1. English Housing Survey is a national survey of people's housing
circumstances and the condition and energy efficiency of housing in
England. In its current form, it was first run in 2008-09. Prior to then, the
survey was run as two standalone surveys: the English House Condition
Survey and the Survey of English Housing. This report provides the
findings from the 2014-15 survey.
2. The report is split into two chapters. The first, on households, covers
tenure (owner occupation and the social and private rented sectors) and
the demographic and economic characteristics of the people who live in
the three different tenures. For the first time, first time buyers are included.
Rents and Housing Benefit, buying expectations, overcrowding and under-
occupation, and well-being are also examined.
3. Chapter 2 provides an overview of the housing stock in England including:
the age, size, and type of home; energy efficiency of the housing stock;
decent homes; homes affected by damp and mould; and smoke alarms.
Additional annex tables provide further detail to that covered in the main
body of the report.
4. This is the first release of data from the 2014-15 survey. The report will be
followed up with a series of more detailed annual reports in the summer.

2 | English Housing Survey Headline Report 2014-15
Main findings
After a period of recent decline, the fall in owner occupation appears to
have abated.
Of the estimated 22.5 million households in England in 2014-15, 14.3 million or 64% were owner occupiers. The proportion of all households in owner occupation increased steadily from the 1980s to 2003 when it reached a peak of 71%. A period of gradual decline in owner occupation followed but this seems to have abated with no change in owner occupation rates between 2013-14 and 2014-15.
Among owner occupiers, the proportion of households who owned
outright remained larger than the proportion buying with a mortgage,
although not in London.
In 2014-15, there were more outright owners (33%) than ‘mortgagors’ (30%), a continuation of the trend first identified in 2013-14. This was not the case in London where there were more mortgagors (27%) than outright owners (23%), most likely as a result of the younger age profile of the population in London.
The private rented sector remained larger than the social rented sector.
In 2014-15, 19% (4.3 million) of households were renting privately, while 17% (3.9 million) of households lived in the social rented sector. There was no change in the size of either sector between 2013-14 and 2014-15.
There has been an increase in the number of families with dependent
children in the private rented sector.
Over the last 10 years, the proportion of households in the private rented sector with dependent children increased from 30% in 2004-05 to 37% in 2014-15. With considerable growth in the overall number of private renters over this period, this seven percentage point increase equates to about 912,000 more households with children in the private rented sector.
Over the last decade the average age of first time buyers increased.
In 2014-15, the average age of first time buyers was 33, up from 31 in 2004-05.
Younger people (aged 25-34) are more likely to rent privately than to be
buying with a mortgage.
Over the last 10 years there has been a significant increase in the proportion of younger households in the private rented sector. In 2004-05, 24% of those aged 25-34 lived in the private rented sector. By 2014-15
Introduction and main findings | 3
this had increased to 46%. Over the same period, the proportion of 25-34 year olds buying with a mortgage decreased from 54% to 34%. In other words, younger households aged 25-34 are more likely to be renting privately than buying their own home, a continuation of a trend first identified in 2012-13. Over the same 10 year period, rates of younger households in the social rented sector remained stable.
The proportion of private renters who expect to buy has declined. No
such decline was observed among social renters.
In 2014-15, 57% of private renters and 24% of social renters stated that they expected to buy a property at some point in the future.
Between 2013-14 and 2014-15, there was a decline in the proportion of private renters who expected to buy (from 61% to 57%). There was no such decline in the proportion of social renters who expected to buy.
The proportion of social renters who expect to buy their current home
has increased.
Among social renters who expected to buy, half (52%) of local authority tenants and a third (35%) of housing association tenants expected to buy their current home.
The overall proportion of social tenants who expected to buy their current home increased from 35% in 2010-11 to 42% in 2014-15. This may, in part be explained by the reinvigoration of the Right to Buy scheme which allows local authority tenants to buy their home at a discount. As the Right to Buy scheme is extended to include housing association tenants we may expect to see a further increase in the overall proportion of social tenants who expect to buy their current home in future waves of the English Housing Survey.
While social rents increased between 2013-14 and 2014-15, private rents
remained stable. Although this was not the case in London.
In 2014-15, the average (mean) rent (excluding services but including Housing Benefit) for households in the social sector was £99 compared with £179 per week in the private rented sector.
For social renters, average rents increased between 2013-14 and 2014-15, from £94 to £99. Average private rents were unchanged.
While private rents did not increase between 2013-14 and 2014-15 at the national level, in London there was a £17 per week increase, from an average of £281 per week to £298 per week.
4 | English Housing Survey Headline Report 2014-15
The proportion of working private renters in receipt of Housing Benefit
increased.
Between 2013-14 and 2014-15, the proportion of non-working private renters on Housing Benefit declined from 57% to 49% while the proportion of private renters in work and on Housing Benefit increased from 14% to 18%. No such pattern was observed among social renters.
Rates of overcrowding remained low but under-occupation increased,
driven by an increase in the proportion of under-occupied homes in the
owner occupied sector.
The overall number and proportion of under-occupied households in England increased between 1995-96 and 2014-15 from 31% (6.2 million households) to 36% (8.2 million households). This was driven mainly by an increase in under-occupied households in the owner occupied sector, from 39% (5.3 million households) in 1995-96 to 51% (7.3 million households) in 2014-15.
The overall rate of overcrowding in England in 2014-15 was 3%, unchanged from 2013-14, with 675,000 households living in overcrowded conditions.
Meanwhile, under-occupation in the rented sectors declined.
Under-occupation amongst private renters decreased from 18% in 1995-96 to 13% in 2014-15 and under-occupation amongst social renters decreased from 12% to 9%.
The energy efficiency of the English housing stock continued to
improve.
In 2014, the average SAP rating of English dwellings was 61 points, up from 45 points in 1996. The improvement was evident in all tenures.
The number of non-decent homes in England continued to decline.
In 2014, a fifth of dwellings (20% or 4.6 million homes) failed to meet the Decent Homes standard, a reduction of 3.1 million homes since 2006, when 35% of homes failed to meet the standard.
The private rented sector had the highest proportion of non-decent homes (29%) while the social rented sector had the lowest (14%). Among owner occupied homes, 19% failed to meet the Decent Homes standard in 2014.
Introduction and main findings | 5
While the majority of homes had at least one working smoke alarm, a
quarter of households have never tested their smoke alarm.
In 2014, 88% of households had at least one working smoke alarm but this varied by tenure. Private renters were least likely to have at least one working smoke alarm (81%), compared with 88% of owner occupiers, 92% of local authority renters and 93% of households in housing association properties.
Around a quarter (22%) of households had never tested their smoke alarm. This also varied by tenure with private renters the most likely to have never tested their alarm (33%). By comparison 27% of social renters and 18% of owner occupiers had never tested their smoke alarm.
Acknowledgements and further queries
5. Each year the English Housing Survey relies on the contributions of a
large number of people and organisations. The Department for
Communities and Local Government would particularly like to thank the
following people and organisations, without whom the 2014-15 survey and
this report, would not have been possible: all the households who gave up
their time to take part in the survey, NatCen Social Research, the Building
Research Establishment (BRE) and CADS Housing Surveys.
6. If you have any queries about this report, would like any further information
or have suggestions for analyses you would like to see included in future
EHS reports, please contact [email protected].
7. The responsible analyst for this report is: Reannan Rottier, Housing and
Planning Analysis Division, DCLG. Contact via
6 | English Housing Survey Headline Report 2014-15
Section 1 Households
1.1 There are three main housing tenures in England: owner occupation
and the private and social rented sectors. Owner occupation includes
households that own their home outright and households that have a
mortgage. The social rented sector includes local authority and housing
association homes and provides accommodation at a subsidised rent,
while the private rented sector offers accommodation at market rents.
1.2 This section compares the demographic characteristics of the people
who live in these three different tenures, and how this has changed
over time. It also describes the characteristics of first time buyers,
including details on how they funded the purchase of their first home.
1.3 It then explores buying expectations among renters, average rental
costs in the private and social rented sectors and the extent to which
private and social renters claim Housing Benefit to help meet the cost
of their rent. Rates of overcrowding and under-occupation by tenure
are then explored followed by some analysis of personal well-being and
the extent to which this varies by tenure.
Trends in tenure
1.4 In 2014-15, there were an estimated 22.5 million households in
England living in self-contained accommodation, Annex Table 1.1. This
figure excludes those living in institutional accommodation such as
nursing homes or halls of residence.
1.5 Owner occupation remained the largest tenure group with 14.3 million
households, representing about two thirds (64%) of all households in
2014-15. The proportion of all households in owner occupation
increased steadily from the 1980s to 2003 when it reached a peak of
71%. Since then, there has been a gradual decline in owner
occupation. However, the recent decline seems to have abated with no
change in owner occupation rates between 2013-14 and 2014-15,
Figure 1.1.
1.6 Owner occupiers are comprised of two groups: those who own outright
and those who are buying with a mortgage (referred to throughout this
report as ‘mortgagors’). In 2014-15, there were more outright owners
(33%) than ‘mortgagors’ (30%), a continuation of the trend first
identified in 2013-14. This is not the case in London where there were
Section 1 Households | 7
more mortgagors (27%) than outright owners (23%), most likely as a
result of the younger age profile of the population in London, Annex
Table 1.2.
1.7 In 2014-15, the private rented sector accounted for 4.3 million or 19%
of households. Throughout the 1980s and 1990s, the proportion of
private rented households stayed steady at around 10%. However, the
sector has undergone sharp growth since then and has doubled in size
since 2002, driven by a number of factors. In the late 1990s rent
controls were removed, and assured shorthold tenancies became the
standard, giving greater flexibility in the length of tenancies. Lenders
also introduced the buy-to-let mortgage at around the same time,
Annex Table 1.1.
1.8 In 2014-15, the social rented sector, at 3.9 million households (17%),
was the smallest tenure, following a long downward trend which has
stabilised in recent years. From the 1980s, the Right to Buy enabled
many local authority tenants to purchase their home at a discounted
price, and the proportion of households in the social sector fell from
31% in 1980 to 19% in 2000.
8 | English Housing Survey Headline Report 2014-15
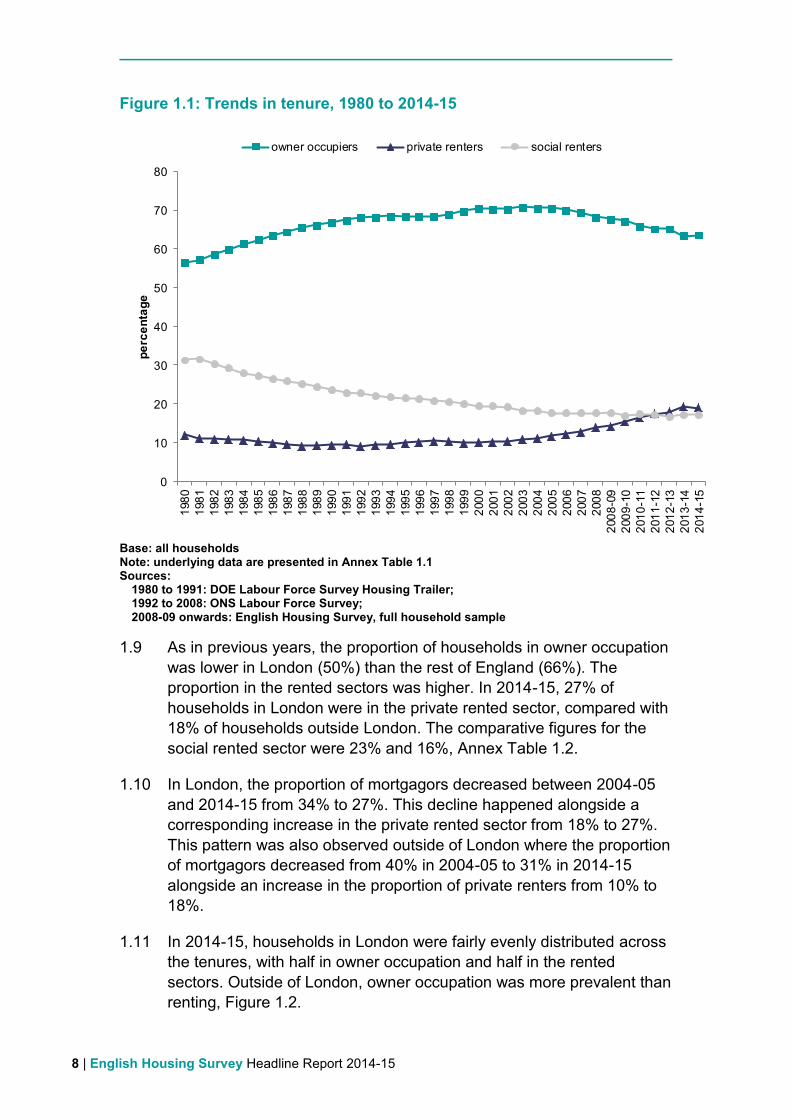
Figure 1.1: Trends in tenure, 1980 to 2014-15
Base: all households Note: underlying data are presented in Annex Table 1.1 Sources:
1980 to 1991: DOE Labour Force Survey Housing Trailer; 1992 to 2008: ONS Labour Force Survey; 2008-09 onwards: English Housing Survey, full household sample
1.9 As in previous years, the proportion of households in owner occupation
was lower in London (50%) than the rest of England (66%). The
proportion in the rented sectors was higher. In 2014-15, 27% of
households in London were in the private rented sector, compared with
18% of households outside London. The comparative figures for the
social rented sector were 23% and 16%, Annex Table 1.2.
1.10 In London, the proportion of mortgagors decreased between 2004-05
and 2014-15 from 34% to 27%. This decline happened alongside a
corresponding increase in the private rented sector from 18% to 27%.
This pattern was also observed outside of London where the proportion
of mortgagors decreased from 40% in 2004-05 to 31% in 2014-15
alongside an increase in the proportion of private renters from 10% to
18%.
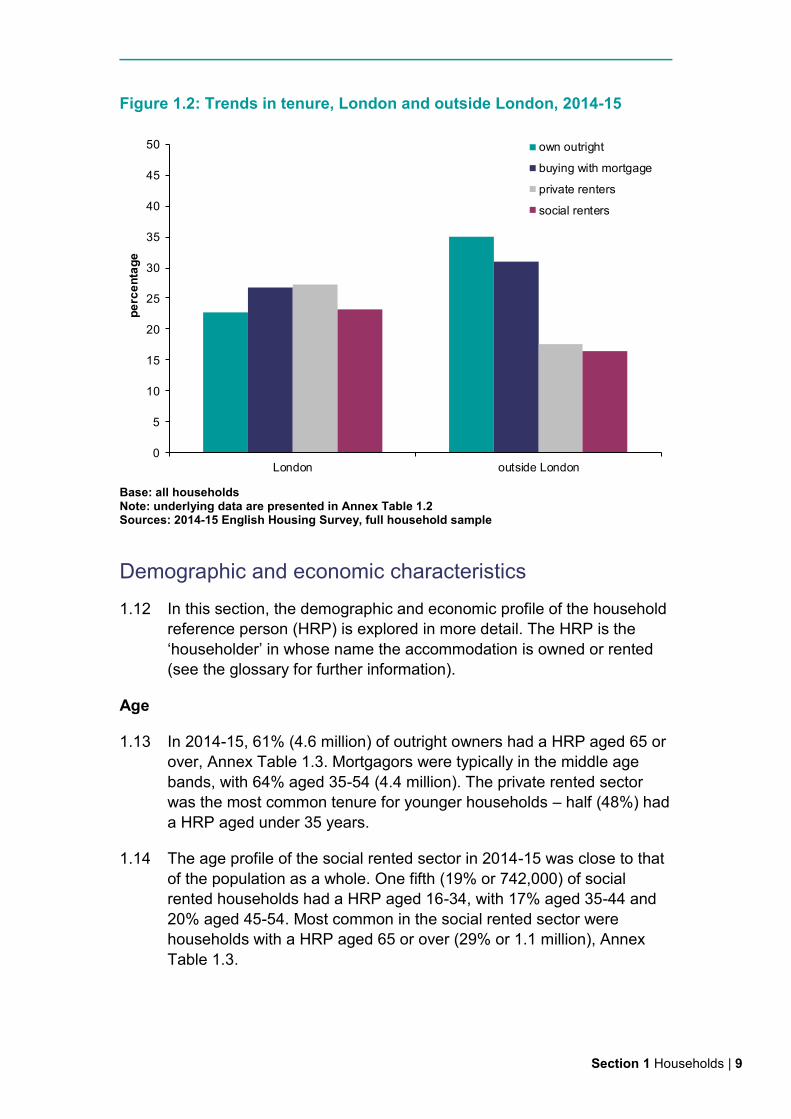
1.11 In 2014-15, households in London were fairly evenly distributed across
the tenures, with half in owner occupation and half in the rented
sectors. Outside of London, owner occupation was more prevalent than
renting, Figure 1.2.
0
10
20
30
40
50
60
70
801
98
0
198
1
198
2
198
3
198
4
198
5
198
6
198
7
198
8
198
9
199
0
199
1
199
2
199
3
199
4
199
5
199
6
199
7
199
8
199
9
200
0
200
1
200
2
200
3
200
4
200
5
200
6
200
7
200
8
200
8-0
9
200
9-1
0
201
0-1
1
201
1-1
2
201
2-1
3
201
3-1
4
201
4-1
5
pe
rce
nta
ge
owner occupiers private renters social renters
Section 1 Households | 9
Figure 1.2: Trends in tenure, London and outside London, 2014-15
Base: all households Note: underlying data are presented in Annex Table 1.2 Sources: 2014-15 English Housing Survey, full household sample
Demographic and economic characteristics
1.12 In this section, the demographic and economic profile of the household
reference person (HRP) is explored in more detail. The HRP is the
‘householder’ in whose name the accommodation is owned or rented
(see the glossary for further information).
Age
1.13 In 2014-15, 61% (4.6 million) of outright owners had a HRP aged 65 or
over, Annex Table 1.3. Mortgagors were typically in the middle age
bands, with 64% aged 35-54 (4.4 million). The private rented sector
was the most common tenure for younger households – half (48%) had
a HRP aged under 35 years.
1.14 The age profile of the social rented sector in 2014-15 was close to that
of the population as a whole. One fifth (19% or 742,000) of social
rented households had a HRP aged 16-34, with 17% aged 35-44 and
20% aged 45-54. Most common in the social rented sector were
households with a HRP aged 65 or over (29% or 1.1 million), Annex
Table 1.3.
0
5
10
15
20
25
30
35
40
45
50
London outside London
pe
rce
nta
ge
own outright
buying with mortgage
private renters
social renters

10 | English Housing Survey Headline Report 2014-15
1.15 Over the last 10 years there has been a significant increase in the
proportion of younger households in the private rented sector. In 2004-
05, 24% of those aged 25-34 lived in the private rented sector. By
2014-15 this had increased to 46%. Over the same period, the
proportion of 25-34 year olds buying with a mortgage decreased from
54% to 34%. In other words, younger households aged 25-34 were
more likely to be renting privately than buying their own home, a
continuation of a trend first identified in 2012-13. Over the same 10
year period, rates of younger households in the social rented sector
remained stable, Figure 1.3.
Figure 1.3: Households with a HRP aged 25-34, by tenure, 2004-05 to 2014-15
Base: all households with a HRP aged 25-34 Notes:
1) based on the age of the household reference person 2) underlying data are presented in Annex Table 1.4
Sources: 2004-05 to 2007-08: English House Condition Survey, full household sample; 2008-09 onwards: English Housing Survey, full household sample
1.16 The proportion of 16-24 year olds in the social rented sector declined
between 2004-05 and 2014-15 from 30% to 21%. The proportion of
social renters aged 65+ also decreased from 23% to 18%. Meanwhile,
the proportion of 45-54 year olds in social housing increased from 14%
to 18%. Rates remained stable for other age groups, Annex Table 1.4.
0
10
20
30
40
50
60
200
4-0
5
200
5-0
6
200
6-0
7
200
7-0
8
200
8-0
9
200
9-1
0
201
0-1
1
201
1-1
2
201
2-1
3
201
3-1
4
201
4-1
5
pe
rce
nta
ge
private renters owner occupiers social renters
Section 1 Households | 11
Household type and household size
1.17 Household type and size varied widely by tenure. Reflecting their older
age profile, in 2014-15, outright owner households were predominately
couples with no dependent children (53%) and one person aged 60+
(28%), Annex Table 1.3.
1.18 Couples with and without dependent children predominate among
mortgagors (41% and 35% respectively)
1.19 The private rented sector had a higher proportion of households with
one person under 60 (20%) than mortgagors (12%) and fewer couples
with no dependent children (23%). Only 2% of mortgagors and 7% of
private rented household were single people aged 60 or over.
1.20 Multi-person households include lone parents with independent
children only, two or more families (with or without dependent children)
and a lone person sharing with other lone persons. This kind of
household was more prevalent in the private rented sector (14%) than
the social rented sector (11%) or in owner occupation (6%).
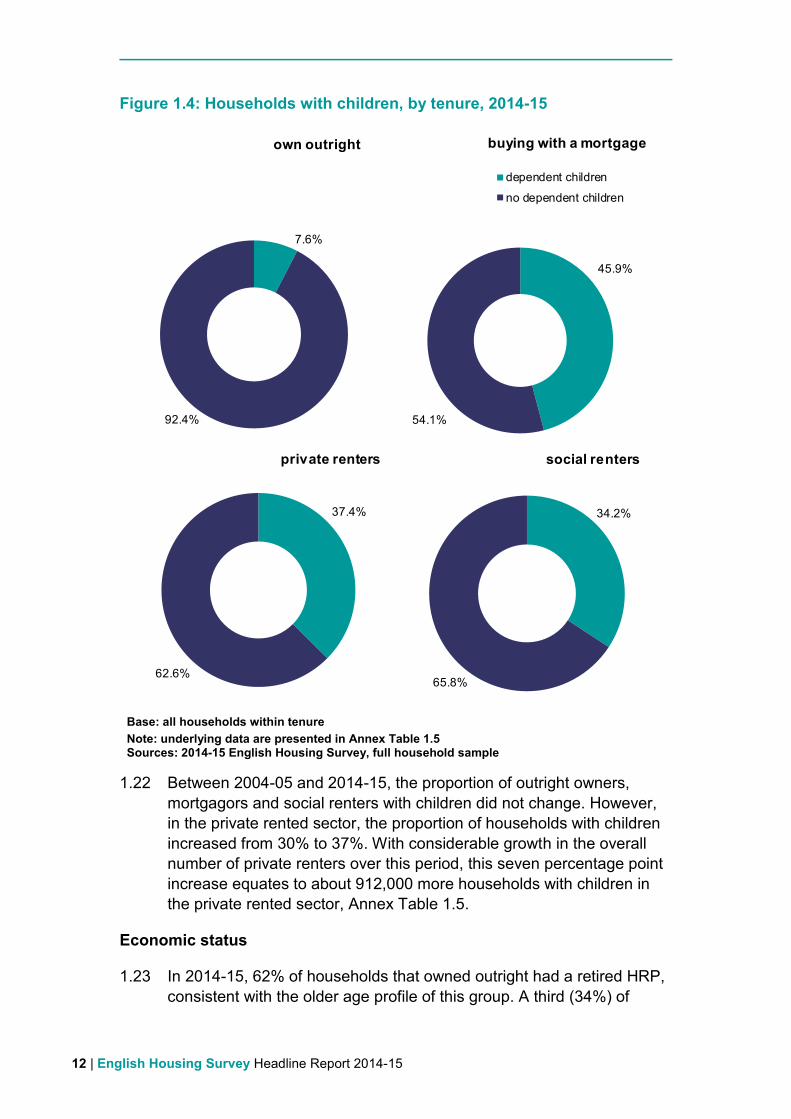
1.21 Not surprisingly, the proportion of households with children varied by
tenure. Almost half (45%) of households buying with a mortgage had
children compared with just 7% of outright owners. Around a third of
private (36%) and social (33%) renters had children, Figure 1.4.
12 | English Housing Survey Headline Report 2014-15
Figure 1.4: Households with children, by tenure, 2014-15
Base: all households within tenure
Note: underlying data are presented in Annex Table 1.5 Sources: 2014-15 English Housing Survey, full household sample
1.22 Between 2004-05 and 2014-15, the proportion of outright owners,
mortgagors and social renters with children did not change. However,
in the private rented sector, the proportion of households with children
increased from 30% to 37%. With considerable growth in the overall
number of private renters over this period, this seven percentage point
increase equates to about 912,000 more households with children in
the private rented sector, Annex Table 1.5.
Economic status
1.23 In 2014-15, 62% of households that owned outright had a retired HRP,
consistent with the older age profile of this group. A third (34%) of
7.6%
92.4%
own outright
45.9%
54.1%
buying with a mortgage
dependent children
no dependent children
37.4%
62.6%
private renters
34.2%
65.8%
social renters

Section 1 Households | 13
outright owners was working. In contrast, 91% of mortgagors were
working, with 83% in full-time work and 8% in part-time work. Just 4%
of mortgagors were retired, Annex Table 1.3.
1.24 One tenth (9%) of social rented sector HRPs were unemployed,
compared with 5% of private renters and 1% of owner occupiers.
1.25 The proportion of ‘other inactive’ households was considerably higher
in the social rented sector. Around a quarter (22%) of social rented
sector HRPs were in the ’other inactive’ category, compared with 9% of
private renters and 3% of owner occupiers. This category includes
those who have a long-term illness or disability and those looking after
the family or home.
Ethnicity
1.26 One in ten (11%) households in England had a HRP from an ethnic
minority background. In the social and private rented sectors, this
proportion was higher than the national average, 15% and 17%
respectively. The proportion of owner occupiers from an ethnic minority
background was below the national average (8%).
First time buyers
1.27 In 2014-15, there were 564,000 first time buyers in England. That is,
buyers who had bought for the first time in the last three years, a
decline from 815,000 in 2004-05. The decline in the number of first time
buyers in the last 10 years was largely driven by a decline in the
number of first time buyers outside of London (from around 668,000 to
438,000). The number of first time buyers in London remained fairly
stable, Annex Table 1.6.
Demographic and economic characteristics
1.28 In 2014-15, the average age of first time buyers was 33, up from 31 in
2004-05. Almost two thirds (61%) of first time buyers were aged
between 25 and 34 years. Just 10% were younger than this (aged 16-
24) while 29% were older (aged 35+), Annex Table 1.7.
1.29 Half (49%) of first time buyers were couples without dependent children
while about a third (31%) were couples with dependent children.
1.30 With an average (mean) deposit of £42,505 (£25,000 median), it is not
surprising that the majority of first time buyers were in the upper
income quintiles – 72% were in the fourth and fifth income quintiles,
Annex Tables 1.7 and 1.8.
14 | English Housing Survey Headline Report 2014-15
1.31 Almost all first time buyers (99%) had a repayment mortgage. Half
(51%) had 20-29 year mortgages while 43% had a mortgage of 30
years or more.
1.32 Two thirds (67%) of first time buyers paid a deposit of less than 20% of
the purchase price of their property. A very small number (20,000 or
4%) bought their first home outright.
1.33 The majority (83%) of first time buyers funded the purchase of their first
home with savings; 27% had help from family or friends while 10%
used an inheritance. Many first time buyers used a combination of
sources.
1.34 More than half (59%) of first time buyers had bought their first home
jointly with a partner or spouse while 39% bought in their name only.
Future buying expectations
1.35 In 2014-15, 57% of private renters (2.3 million households) and 24% of
social renters (911,000) stated that they expected to buy a property at
some point in the future, Annex Table 1.9.
1.36 Between 2013-14 and 2014-15, there was a decline in the proportion of
private renters who expected to buy (from 61% to 57%). There was no
such decline in the proportion of social renters who expected to buy,
Figure 1.5. This was true for both local authority and housing
association tenants, Annex Table 1.10.
1.37 Over the longer term, while the proportion of private renters who
expected to buy was low in 2014-15, the rate was not significantly
different from the proportion of private renters who expected to buy in
2008-09 (59%).
1.38 While the proportion of social renters who expected to buy declined
between 2008-09 and 2014-15 from 27% to 24%, the latter figure is an
improvement from 2011-12 when just 20% of social renters expected to
buy.

Section 1 Households | 15
Figure 1.5: Percentage of private and social renters who expect to buy, 2008-09 to 2014-15
Base: all renting households Note: underlying data are presented in Annex Table 1.10 Source: English Housing Survey, full household sample
1.39 Among social renters who expected to buy, half (52%) of local authority
tenants and a third (35%) of housing association tenants expected to
buy their current home, Annex Table 1.9.
1.40 The overall proportion of social tenants who expected to buy their
current home increased from 35% in 2010-11 to 42% in 2014-15. This
may, in part be explained by the reinvigoration of the Right to Buy
scheme which allows local authority tenants to buy their home at a
discount. As the Right to Buy scheme is extended to include housing
association tenants we may expect to see a further increase in the
overall proportion of social tenants who expect to buy their current
home in future waves of the English Housing Survey.
1.41 Renters who expected to buy a home were also asked how long they
thought it would be before they would do so. In 2014-15, 25% of private
renters and 11% of social renters said they expected to buy within two
years. Meanwhile, 43% of private renters and two thirds (65%) of social
renters expecting to buy thought that it would be five years or more
before they did so.
0
10
20
30
40
50
60
70
200
8-0
9
200
9-1
0
201
0-1
1
201
1-1
2
201
2-1
3
201
3-1
4
201
4-1
5
pe
rce
nta
ge
private renters social renters
16 | English Housing Survey Headline Report 2014-15
Rents
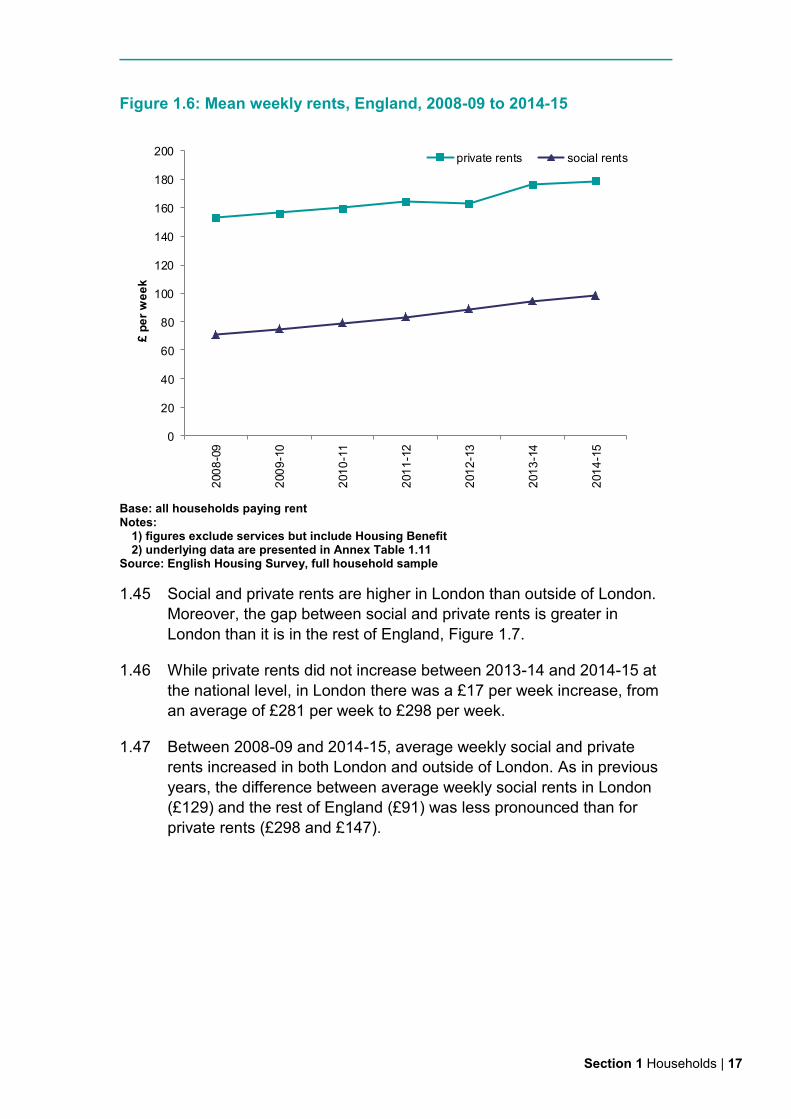
1.42 In 2014-15, the average (mean) rent (excluding services but including
Housing Benefit) for households in the social sector was £99 compared
with £179 per week in the private rented sector1, a difference of £80
per week, Annex Table 1.11. While rents in the social sector are
subsidised, the difference in average rents will also partly reflect the
difference in the type of properties in the sectors.
1.43 Between 2008-09 and 2014-15, average weekly rents increased in both
the social and private rented sectors, Figure 1.6. In the social rented
sector, average rent increased from £71 in 2008-09 to £99 per week in
2014-15, while average private rents increased from £153 to £179 per
week.
1.44 Average weekly rents in the social rented sector also increased
between 2013-14 and 2014-15, from £94 to £99. Average private rents
remained stable between 2013-14 and 2014-15.
1 There are differences in the methodology of the English Housing Survey compared with ONS
experimental quarterly Index of Private Housing Rental Prices (IPHRP). The English Housing Survey
average weekly private rents over time reflect changes in price, quality and composition of the private
rented stock. In contrast, the IPHRP specifically excludes both changes in composition and quality to
ensure only pure price change is captured. See: http://www.ons.gov.uk/ons/rel/hpi/index-of-private-
housing-rental-prices/index.html for more information.
Section 1 Households | 17
Figure 1.6: Mean weekly rents, England, 2008-09 to 2014-15
Base: all households paying rent Notes:
1) figures exclude services but include Housing Benefit 2) underlying data are presented in Annex Table 1.11
Source: English Housing Survey, full household sample
1.45 Social and private rents are higher in London than outside of London.
Moreover, the gap between social and private rents is greater in
London than it is in the rest of England, Figure 1.7.
1.46 While private rents did not increase between 2013-14 and 2014-15 at
the national level, in London there was a £17 per week increase, from
an average of £281 per week to £298 per week.
1.47 Between 2008-09 and 2014-15, average weekly social and private
rents increased in both London and outside of London. As in previous
years, the difference between average weekly social rents in London
(£129) and the rest of England (£91) was less pronounced than for
private rents (£298 and £147).
0
20
40
60
80
100
120
140
160
180
200
200
8-0
9
200
9-1
0
201
0-1
1
201
1-1
2
201
2-1
3
201
3-1
4
201
4-1
5
£ p
er
we
ek
private rents social rents

18 | English Housing Survey Headline Report 2014-15
Figure 1.7: Mean weekly rents, London and outside London, 2008-09 to 2014-15
Base: all households paying rent Notes:
1) figures exclude services but include Housing Benefit 2) underlying data are presented in Annex Table 1.11
Source: English Housing Survey, full household sample
1.48 Private renters move more frequently than social renters. In 2014-15,
private renters had been in their current home for an average of 4.0
years. The average length of residence for social renters was 11.4
years, Annex Table 1.15.
1.49 In general, those who had lived in their home for longer paid less rent.
Private renters that had lived in their current home for less than a year
0
50
100
150
200
250
300
200
8-0
9
200
9-1
0
201
0-1
1
201
1-1
2
201
2-1
3
201
3-1
4
201
4-1
5
£ p
er
we
ek
London
0
50
100
150
200
250
300
£ p
er
we
ek
outside London
private rents social rents

Section 1 Households | 19
paid an average weekly rent of £192 compared with £168 for residents
of 5-9 years and £120 for residents of 20 or more years, Figure 1.8. For
social renters, the relationship between length of residence and the
amount of rent paid was less stark, Annex Table 1.12.
Figure 1.8: Mean weekly private rents, by length of residence, 2014-15
Base: all households in private rented sector paying rent Notes:
1) figures exclude services but include Housing Benefit 2) underlying data are presented in Annex Table 1.12
Source: English Housing Survey, full household sample
Housing Benefit
1.50 Housing Benefit is a means-tested benefit provided by the state to low
income households living in the two rented sectors. The benefit is
usually administered by the local authority in which the rented property
is located. This section compares take up of Housing Benefit by social
and private renting households.
1.51 In 2014-15, 63% of social renters and 27% of private renters received
Housing Benefit to help with the payment of their rent, Annex Table
1.13. This was higher than in 2008-09 when 59% of social renters and
19% of private renters were in receipt of Housing Benefit.
1.52 Social renters in receipt of Housing Benefit received an average of £80
per week, lower than the average amount received by private renters
(£108). Between 2008-09 and 2014-15, the average weekly amount of
Housing Benefit received increased for both social and private renters
(from £62 and £100 per week respectively).
0
20
40
60
80
100
120
140
160
180
200
< 1 year 1 year up to2 years
2 years upto 3 years
3-4 years 5-9 years 10-19 years 20+ years
£ p
er
we
ek

20 | English Housing Survey Headline Report 2014-15
Housing Benefit, by economic status
1.53 The increase in the proportion of renters in receipt of Housing Benefit
was driven by an increase in the proportion of working social and
private renters in receipt of the benefit. In 2008-09, 7% of working
private renters received Housing Benefit. By 2014-15, this had
increased to 18%. Over the same period, the proportion of working
social renters in receipt of Housing Benefit increased from 19% to 29%,
Figure 1.9 and Annex Table 1.14.
Figure 1.9: Proportion of social and private renters in receipt of Housing Benefit, by economic status, 2008-09 to 2014-15
Base: all renters Note: underlying data are presented in Annex Table 1.14 Source: English Housing Survey, full household sample
0
10
20
30
40
50
60
70
80
90
100
pe
rce
nta
ge
private renters
working not working
0
10
20
30
40
50
60
70
80
90
100
200
8-0
9
200
9-1
0
201
0-1
1
201
1-1
2
201
2-1
3
201
3-1
4
201
4-1
5
pe
rce
nta
ge
social renters
Section 1 Households | 21
1.54 Between 2013-14 and 2014-15, the proportion of non-working private
renters on Housing Benefit declined from 57% to 49% while the
proportion of private renters in work and on Housing Benefit increased
from 14% to 18%. No such pattern was observed among social renters.
Length of time in current accommodation and tenure
1.55 In 2014-15, owner occupiers had, on average, lived at their current
address for 17.5 years. Not surprisingly, outright owners had lived in
their current home for longer than mortgagors (24.1 years compared
with 10.4 years).
1.56 Social renters had lived at their current address for an average of 11.4
years, while for private renters the average length of residence was 4.0
years, Annex Table 1.15. This was unchanged from previous years.
1.57 For the first time, in 2014-15, the English Housing Survey included a
question on the amount of time private renters have lived in the private
rented sector.
1.58 In 2014-15, over half (54%) of private renters had lived in the sector for
less than 5 years while 24% had been in the sector for 5-9 years and
22% for more than 10 years2, Annex Table 1.16.
Space
1.59 In this section, data on living space are presented as measured by the
number of bedrooms available to each household. The number and
proportion of homes considered overcrowded or under-occupied are
also provided, with comparisons made across tenures.
Number of bedrooms
1.60 In 2014-15, the overall average (mean) number of bedrooms per
household was 2.8, although this varied by tenure and homes in the
owner occupied sector generally had more bedrooms than those in the
rented sectors. Owner occupiers had, on average, 3.1 bedrooms,
private renters had 2.4 bedrooms, and social renters had 2.1
bedrooms, Annex Table 1.17. There has been no change in the mean
number of bedrooms per household (overall and by tenure) since 2010-
11.
2 More detail on private renters’ housing histories will be included in the in the EHS Private Rented
Sector Report, due in the summer.
22 | English Housing Survey Headline Report 2014-15
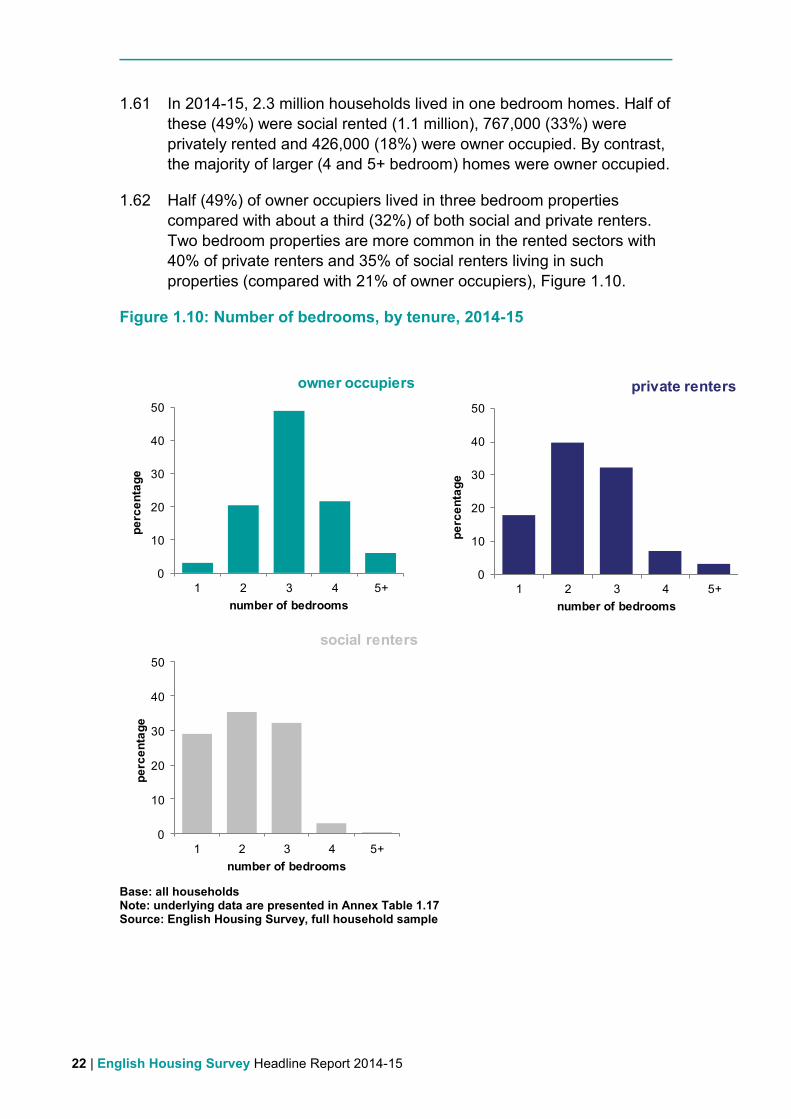
1.61 In 2014-15, 2.3 million households lived in one bedroom homes. Half of
these (49%) were social rented (1.1 million), 767,000 (33%) were
privately rented and 426,000 (18%) were owner occupied. By contrast,
the majority of larger (4 and 5+ bedroom) homes were owner occupied.
1.62 Half (49%) of owner occupiers lived in three bedroom properties
compared with about a third (32%) of both social and private renters.
Two bedroom properties are more common in the rented sectors with
40% of private renters and 35% of social renters living in such
properties (compared with 21% of owner occupiers), Figure 1.10.
Figure 1.10: Number of bedrooms, by tenure, 2014-15
Base: all households Note: underlying data are presented in Annex Table 1.17 Source: English Housing Survey, full household sample
0
10
20
30
40
50
1 2 3 4 5+
pe
rce
nta
ge
number of bedrooms
owner occupiers
0
10
20
30
40
50
1 2 3 4 5+
pe
rce
nta
ge
number of bedrooms
social renters
0
10
20
30
40
50
1 2 3 4 5+
pe
rce
nta
ge
number of bedrooms
private renters

Section 1 Households | 23
Overcrowding and under-occupation
1.63 By comparing the number of bedrooms available to each household
with the number of adults and children that require a separate bedroom
a measure of overcrowding can be derived, Box 1.
1.64 The overall rate of overcrowding in England in 2014-15 was 3%,
unchanged from 2013-14, with 675,000 households living in
overcrowded conditions. Overcrowding was more prevalent in the
rented sectors than for owner occupiers. Only 1% of owner occupiers
(211,000 households) were overcrowded in 2014-15 compared with 6%
of social renters (247,000) and 5% of private renters (216,000), Annex
Table 1.18.
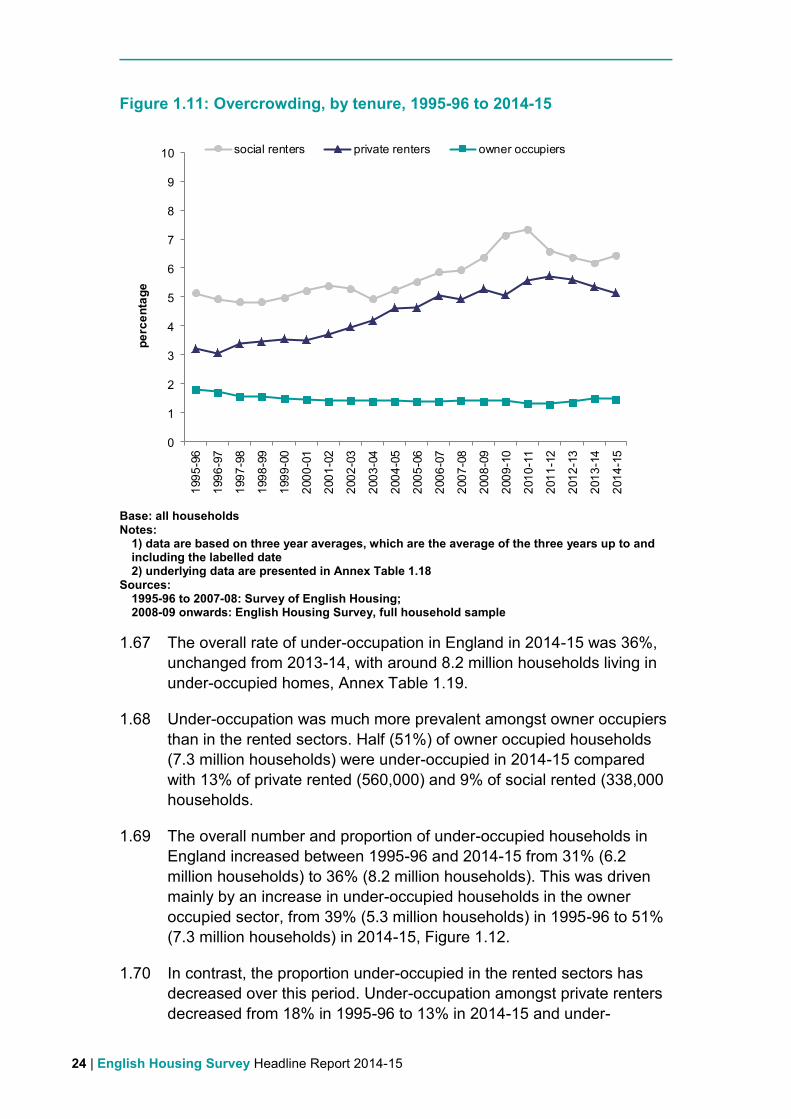
1.65 The number and proportion of overcrowded households in the owner
occupied sector has remained relatively stable since 1995-96, Figure
1.11. In the social rented sector, overcrowding declined from a peak of
7% in 2010-11 and has been 6% since 2012-13.
1.66 The proportion of overcrowded households in the private rented sector
increased from 3% in 1995-96 to a peak of 6% in 2011-12, and since
then has decreased to 5%. The rapid overall growth in private renters
between 1995-96 and 2014-15 explains the more pronounced increase
in actual numbers of overcrowded households from 63,000 in 1995-96
to 216,000 in 2014-15.
Box 1: Overcrowding and under-occupation
Levels of overcrowding and under-occupation are measured using the
bedroom standard (see glossary). This is essentially the difference
between the number of bedrooms needed to avoid undesirable sharing
(given the number, ages and relationship of the household members) and
the number of bedrooms actually available to the household.
Since the number of overcrowded households included in each survey year is too small to enable reliable overcrowding estimates for any single year, data from the three most recent survey years were combined to produce the overcrowding estimates in this section.
24 | English Housing Survey Headline Report 2014-15
Figure 1.11: Overcrowding, by tenure, 1995-96 to 2014-15
Base: all households Notes:
1) data are based on three year averages, which are the average of the three years up to and including the labelled date 2) underlying data are presented in Annex Table 1.18
Sources: 1995-96 to 2007-08: Survey of English Housing; 2008-09 onwards: English Housing Survey, full household sample
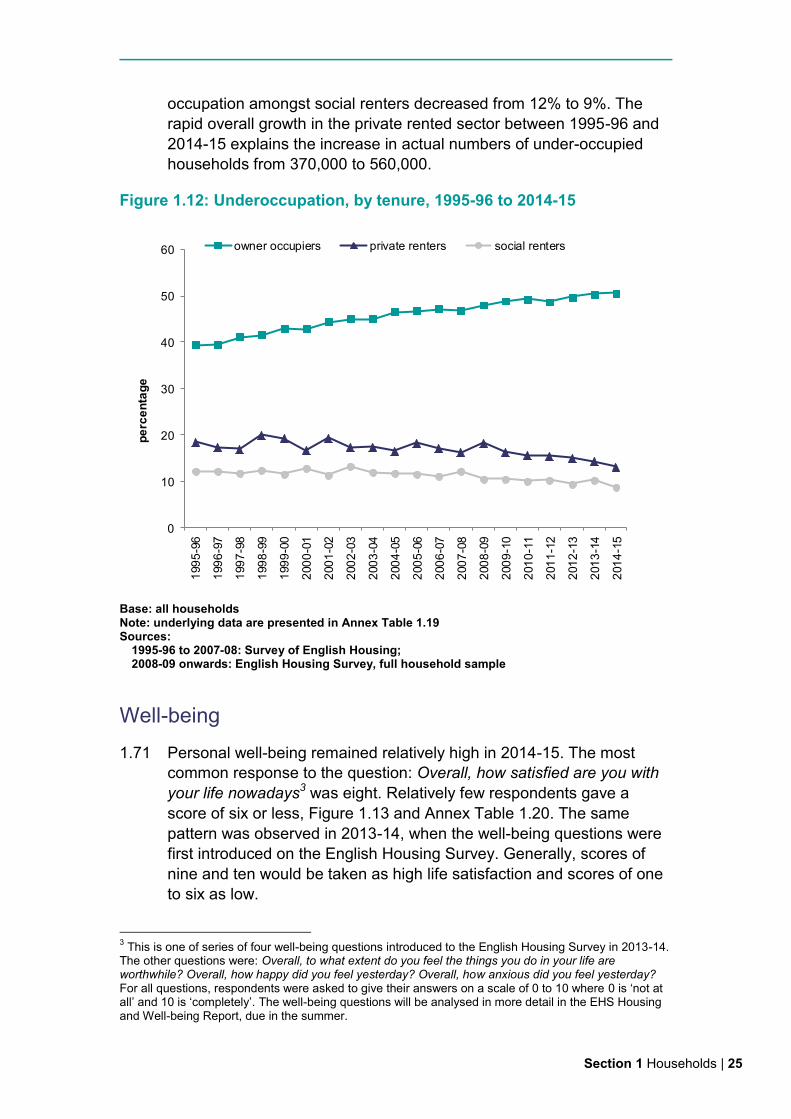
1.67 The overall rate of under-occupation in England in 2014-15 was 36%,
unchanged from 2013-14, with around 8.2 million households living in
under-occupied homes, Annex Table 1.19.
1.68 Under-occupation was much more prevalent amongst owner occupiers
than in the rented sectors. Half (51%) of owner occupied households
(7.3 million households) were under-occupied in 2014-15 compared
with 13% of private rented (560,000) and 9% of social rented (338,000
households.
1.69 The overall number and proportion of under-occupied households in
England increased between 1995-96 and 2014-15 from 31% (6.2
million households) to 36% (8.2 million households). This was driven
mainly by an increase in under-occupied households in the owner
occupied sector, from 39% (5.3 million households) in 1995-96 to 51%
(7.3 million households) in 2014-15, Figure 1.12.
1.70 In contrast, the proportion under-occupied in the rented sectors has
decreased over this period. Under-occupation amongst private renters
decreased from 18% in 1995-96 to 13% in 2014-15 and under-
0
1
2
3
4
5
6
7
8
9
10
199
5-9
6
199
6-9
7
199
7-9
8
199
8-9
9
199
9-0
0
200
0-0
1
200
1-0
2
200
2-0
3
200
3-0
4
200
4-0
5
200
5-0
6
200
6-0
7
200
7-0
8
200
8-0
9
200
9-1
0
201
0-1
1
201
1-1
2
201
2-1
3
201
3-1
4
201
4-1
5
pe
rce
nta
ge
social renters private renters owner occupiers
Section 1 Households | 25
occupation amongst social renters decreased from 12% to 9%. The
rapid overall growth in the private rented sector between 1995-96 and
2014-15 explains the increase in actual numbers of under-occupied
households from 370,000 to 560,000.
Figure 1.12: Underoccupation, by tenure, 1995-96 to 2014-15
Base: all households Note: underlying data are presented in Annex Table 1.19 Sources:
1995-96 to 2007-08: Survey of English Housing; 2008-09 onwards: English Housing Survey, full household sample
Well-being
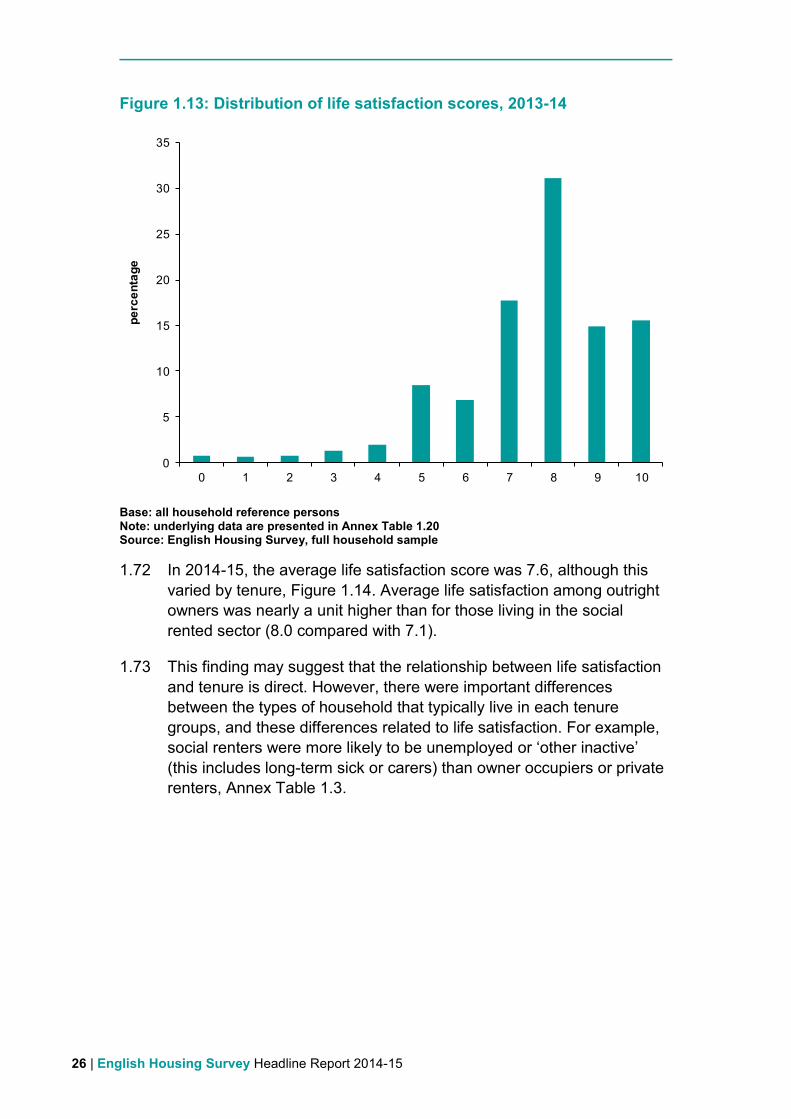
1.71 Personal well-being remained relatively high in 2014-15. The most
common response to the question: Overall, how satisfied are you with
your life nowadays3 was eight. Relatively few respondents gave a
score of six or less, Figure 1.13 and Annex Table 1.20. The same
pattern was observed in 2013-14, when the well-being questions were
first introduced on the English Housing Survey. Generally, scores of
nine and ten would be taken as high life satisfaction and scores of one
to six as low.
3 This is one of series of four well-being questions introduced to the English Housing Survey in 2013-14.
The other questions were: Overall, to what extent do you feel the things you do in your life are worthwhile? Overall, how happy did you feel yesterday? Overall, how anxious did you feel yesterday? For all questions, respondents were asked to give their answers on a scale of 0 to 10 where 0 is ‘not at all’ and 10 is ‘completely’. The well-being questions will be analysed in more detail in the EHS Housing and Well-being Report, due in the summer.
0
10
20
30
40
50
60
199
5-9
6
199
6-9
7
199
7-9
8
199
8-9
9
199
9-0
0
200
0-0
1
200
1-0
2
200
2-0
3
200
3-0
4
200
4-0
5
200
5-0
6
200
6-0
7
200
7-0
8
200
8-0
9
200
9-1
0
201
0-1
1
201
1-1
2
201
2-1
3
201
3-1
4
201
4-1
5
pe
rce
nta
ge
owner occupiers private renters social renters
26 | English Housing Survey Headline Report 2014-15
Figure 1.13: Distribution of life satisfaction scores, 2013-14
Base: all household reference persons Note: underlying data are presented in Annex Table 1.20 Source: English Housing Survey, full household sample
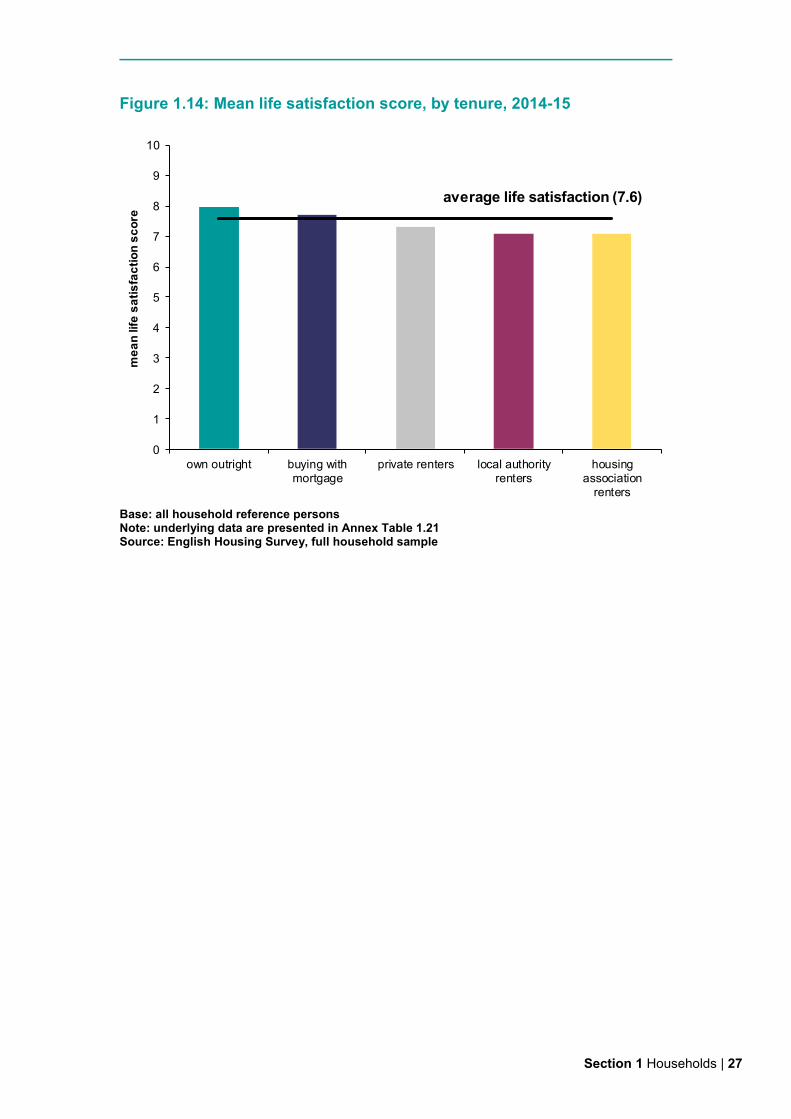
1.72 In 2014-15, the average life satisfaction score was 7.6, although this
varied by tenure, Figure 1.14. Average life satisfaction among outright
owners was nearly a unit higher than for those living in the social
rented sector (8.0 compared with 7.1).
1.73 This finding may suggest that the relationship between life satisfaction
and tenure is direct. However, there were important differences
between the types of household that typically live in each tenure
groups, and these differences related to life satisfaction. For example,
social renters were more likely to be unemployed or ‘other inactive’
(this includes long-term sick or carers) than owner occupiers or private
renters, Annex Table 1.3.
0
5
10
15
20
25
30
35
0 1 2 3 4 5 6 7 8 9 10
pe
rce
nta
ge
Section 1 Households | 27
Figure 1.14: Mean life satisfaction score, by tenure, 2014-15
Base: all household reference persons Note: underlying data are presented in Annex Table 1.21 Source: English Housing Survey, full household sample
0
1
2
3
4
5
6
7
8
9
10
own outright buying withmortgage
private renters local authorityrenters
housingassociation
renters
me
an
lif
e s
ati
sfa
cti
on
sc
ore
average life satisfaction (7.6)
28 | English Housing Survey Headline Report 2014-15
Section 2 Housing stock
2.1 This section begins with an overall profile of the English housing stock,
including the age, type and size of dwellings by tenure. It then reports
on house condition, including the prevalence of damp and the extent to
which the English housing stock meets the Decent Homes standard.
2.2 The energy efficiency of the English housing stock is then explored
followed by a brief section on smoke alarms, including results from a
new question on when smoke alarms were last tested.
Stock profile
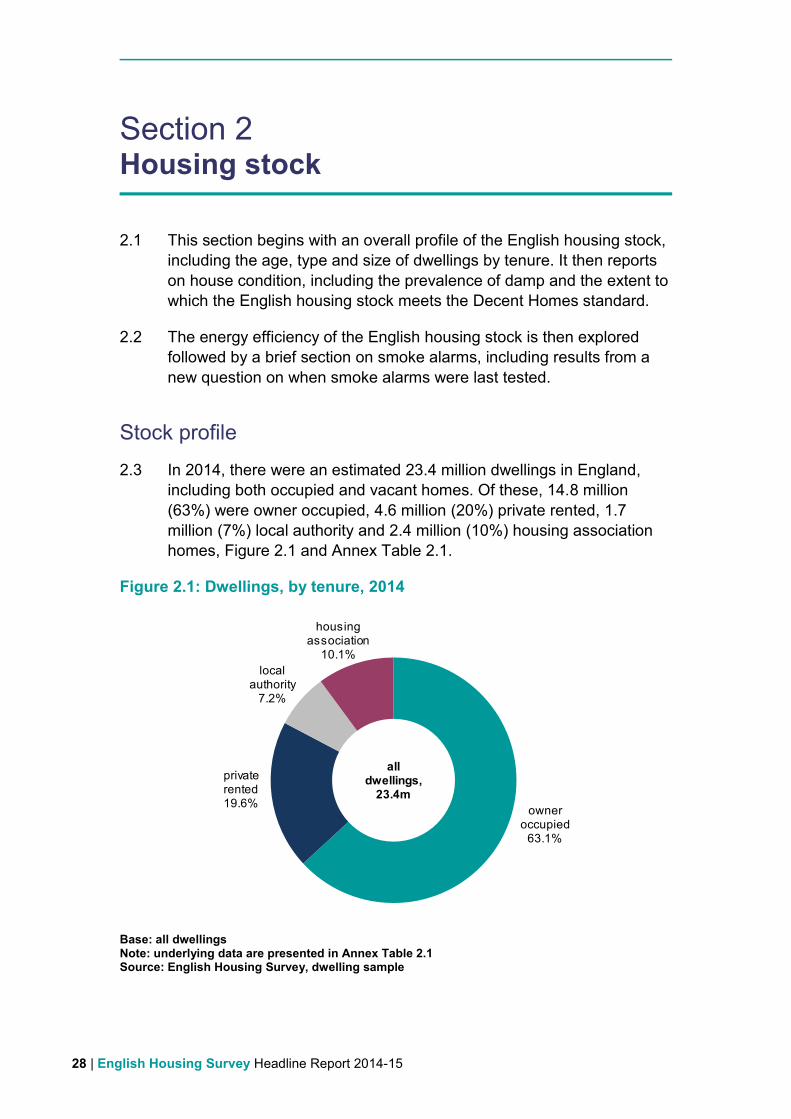
2.3 In 2014, there were an estimated 23.4 million dwellings in England,
including both occupied and vacant homes. Of these, 14.8 million
(63%) were owner occupied, 4.6 million (20%) private rented, 1.7
million (7%) local authority and 2.4 million (10%) housing association
homes, Figure 2.1 and Annex Table 2.1.
Figure 2.1: Dwellings, by tenure, 2014
Base: all dwellings Note: underlying data are presented in Annex Table 2.1 Source: English Housing Survey, dwelling sample
owner occupied
63.1%
private rented19.6%
local authority
7.2%
housingassociation
10.1%
all dwellings,
23.4m
Section 2 Housing stock | 29
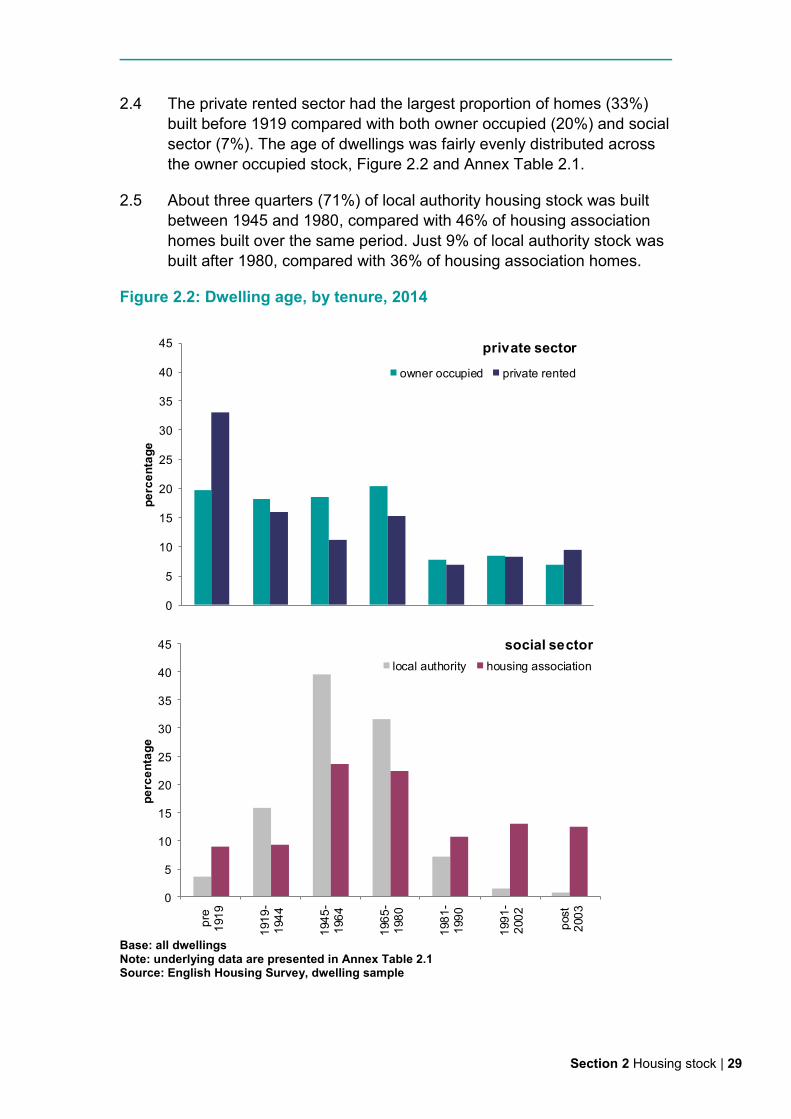
2.4 The private rented sector had the largest proportion of homes (33%)
built before 1919 compared with both owner occupied (20%) and social
sector (7%). The age of dwellings was fairly evenly distributed across
the owner occupied stock, Figure 2.2 and Annex Table 2.1.
2.5 About three quarters (71%) of local authority housing stock was built
between 1945 and 1980, compared with 46% of housing association
homes built over the same period. Just 9% of local authority stock was
built after 1980, compared with 36% of housing association homes.
Figure 2.2: Dwelling age, by tenure, 2014
Base: all dwellings Note: underlying data are presented in Annex Table 2.1 Source: English Housing Survey, dwelling sample
0
5
10
15
20
25
30
35
40
45
pe
rce
nta
ge
private sector
owner occupied private rented
0
5
10
15
20
25
30
35
40
45
pre
191
9
191
9-
194
4
194
5-
196
4
196
5-
198
0
198
1-
199
0
199
1-
200
2
post
200
3
pe
rce
nta
ge
social sector
local authority housing association
30 | English Housing Survey Headline Report 2014-15
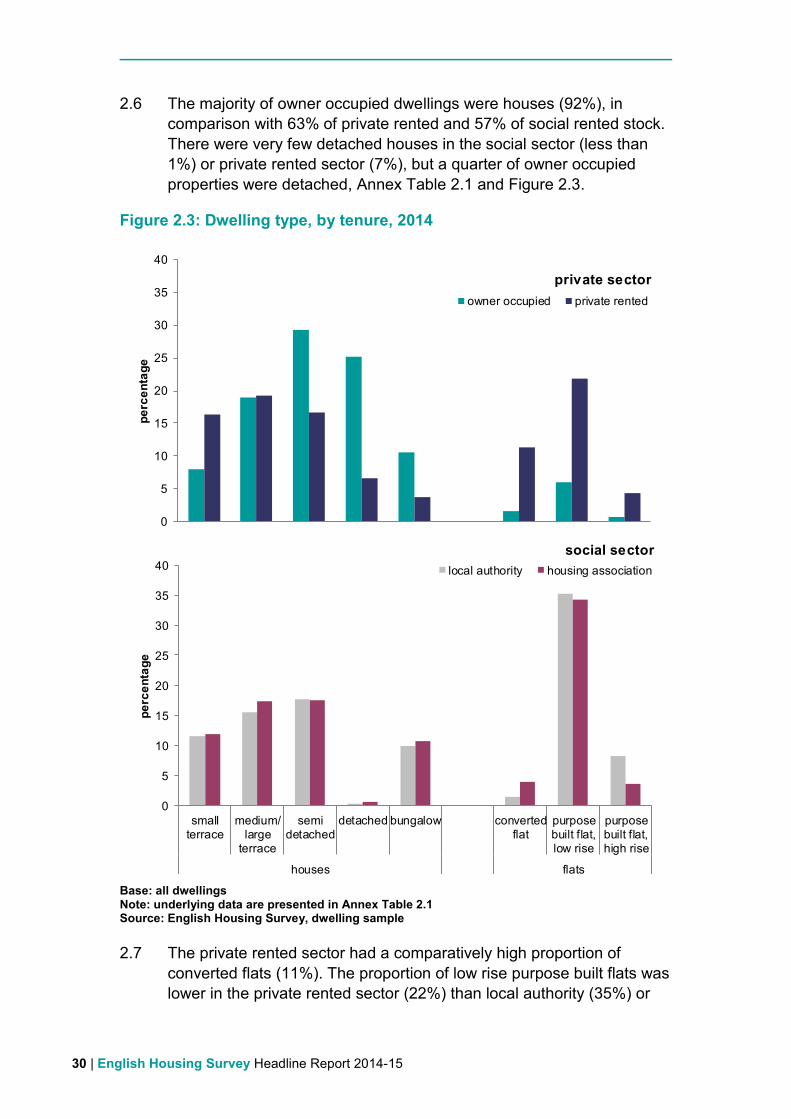
2.6 The majority of owner occupied dwellings were houses (92%), in
comparison with 63% of private rented and 57% of social rented stock.
There were very few detached houses in the social sector (less than
1%) or private rented sector (7%), but a quarter of owner occupied
properties were detached, Annex Table 2.1 and Figure 2.3.
Figure 2.3: Dwelling type, by tenure, 2014
Base: all dwellings Note: underlying data are presented in Annex Table 2.1 Source: English Housing Survey, dwelling sample
2.7 The private rented sector had a comparatively high proportion of
converted flats (11%). The proportion of low rise purpose built flats was
lower in the private rented sector (22%) than local authority (35%) or
0
5
10
15
20
25
30
35
40
pe
rce
nta
ge
private sector
owner occupied private rented
0
5
10
15
20
25
30
35
40
smallterrace
medium/large
terrace
semidetached
detached bungalow convertedflat
purposebuilt flat,low rise
purposebuilt flat,high rise
houses . flats
pe
rce
nta
ge
social sector
local authority housing association
Section 2 Housing stock | 31
housing association (34%) stock. High rise flats were more common in
the local authority (8%) than housing association (4%) stock.
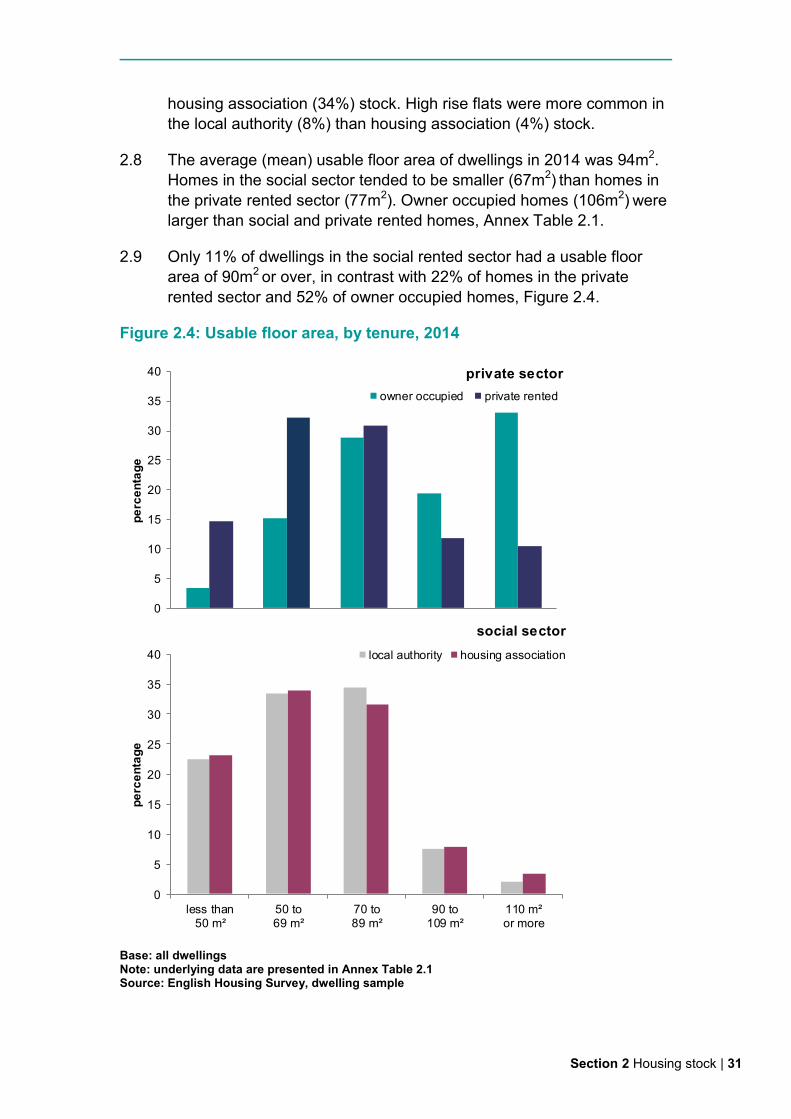
2.8 The average (mean) usable floor area of dwellings in 2014 was 94m2.
Homes in the social sector tended to be smaller (67m2) than homes in
the private rented sector (77m2). Owner occupied homes (106m2) were
larger than social and private rented homes, Annex Table 2.1.
2.9 Only 11% of dwellings in the social rented sector had a usable floor
area of 90m2 or over, in contrast with 22% of homes in the private
rented sector and 52% of owner occupied homes, Figure 2.4.
Figure 2.4: Usable floor area, by tenure, 2014
Base: all dwellings Note: underlying data are presented in Annex Table 2.1 Source: English Housing Survey, dwelling sample
0
5
10
15
20
25
30
35
40
pe
rce
nta
ge
private sector
owner occupied private rented
0
5
10
15
20
25
30
35
40
less than50 m²
50 to69 m²
70 to89 m²
90 to109 m²
110 m²or more
pe
rce
nta
ge
social sector
local authority housing association
32 | English Housing Survey Headline Report 2014-15
House condition
Decent Homes
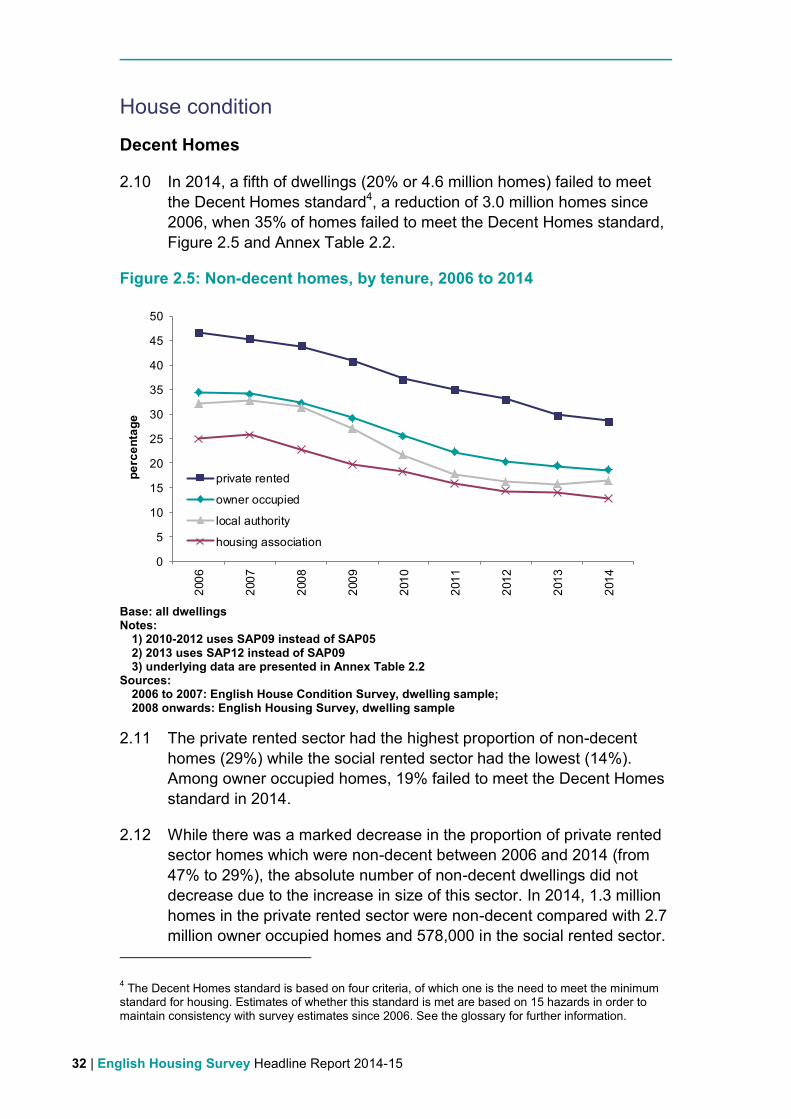
2.10 In 2014, a fifth of dwellings (20% or 4.6 million homes) failed to meet
the Decent Homes standard4, a reduction of 3.0 million homes since
2006, when 35% of homes failed to meet the Decent Homes standard,
Figure 2.5 and Annex Table 2.2.
Figure 2.5: Non-decent homes, by tenure, 2006 to 2014
Base: all dwellings Notes:
1) 2010-2012 uses SAP09 instead of SAP05 2) 2013 uses SAP12 instead of SAP09 3) underlying data are presented in Annex Table 2.2
Sources: 2006 to 2007: English House Condition Survey, dwelling sample; 2008 onwards: English Housing Survey, dwelling sample
2.11 The private rented sector had the highest proportion of non-decent
homes (29%) while the social rented sector had the lowest (14%).
Among owner occupied homes, 19% failed to meet the Decent Homes
standard in 2014.
2.12 While there was a marked decrease in the proportion of private rented
sector homes which were non-decent between 2006 and 2014 (from
47% to 29%), the absolute number of non-decent dwellings did not
decrease due to the increase in size of this sector. In 2014, 1.3 million
homes in the private rented sector were non-decent compared with 2.7
million owner occupied homes and 578,000 in the social rented sector.
4 The Decent Homes standard is based on four criteria, of which one is the need to meet the minimum
standard for housing. Estimates of whether this standard is met are based on 15 hazards in order to maintain consistency with survey estimates since 2006. See the glossary for further information.
0
5
10
15
20
25
30
35
40
45
50
200
6
200
7
200
8
200
9
201
0
201
1
201
2
201
3
201
4
pe
rce
nta
ge
private rented
owner occupied
local authority
housing association
Section 2 Housing stock | 33
Damp
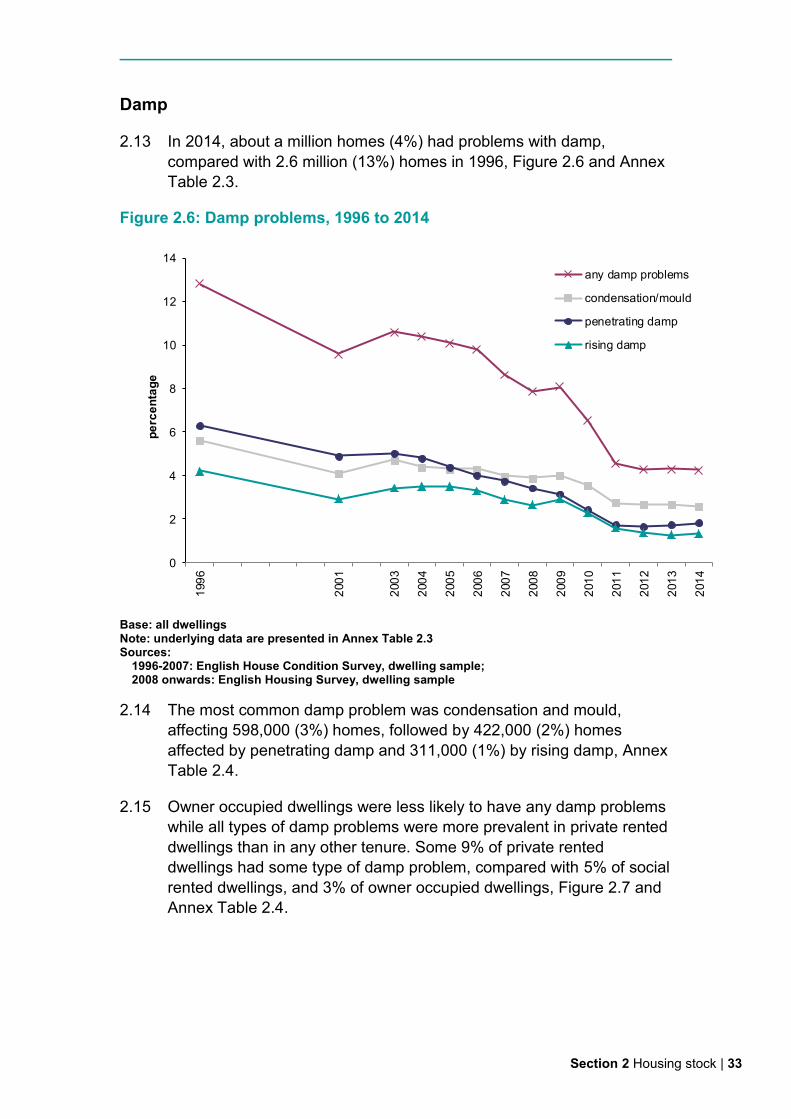
2.13 In 2014, about a million homes (4%) had problems with damp,
compared with 2.6 million (13%) homes in 1996, Figure 2.6 and Annex
Table 2.3.
Figure 2.6: Damp problems, 1996 to 2014
Base: all dwellings Note: underlying data are presented in Annex Table 2.3 Sources:
1996-2007: English House Condition Survey, dwelling sample; 2008 onwards: English Housing Survey, dwelling sample
2.14 The most common damp problem was condensation and mould,
affecting 598,000 (3%) homes, followed by 422,000 (2%) homes
affected by penetrating damp and 311,000 (1%) by rising damp, Annex
Table 2.4.
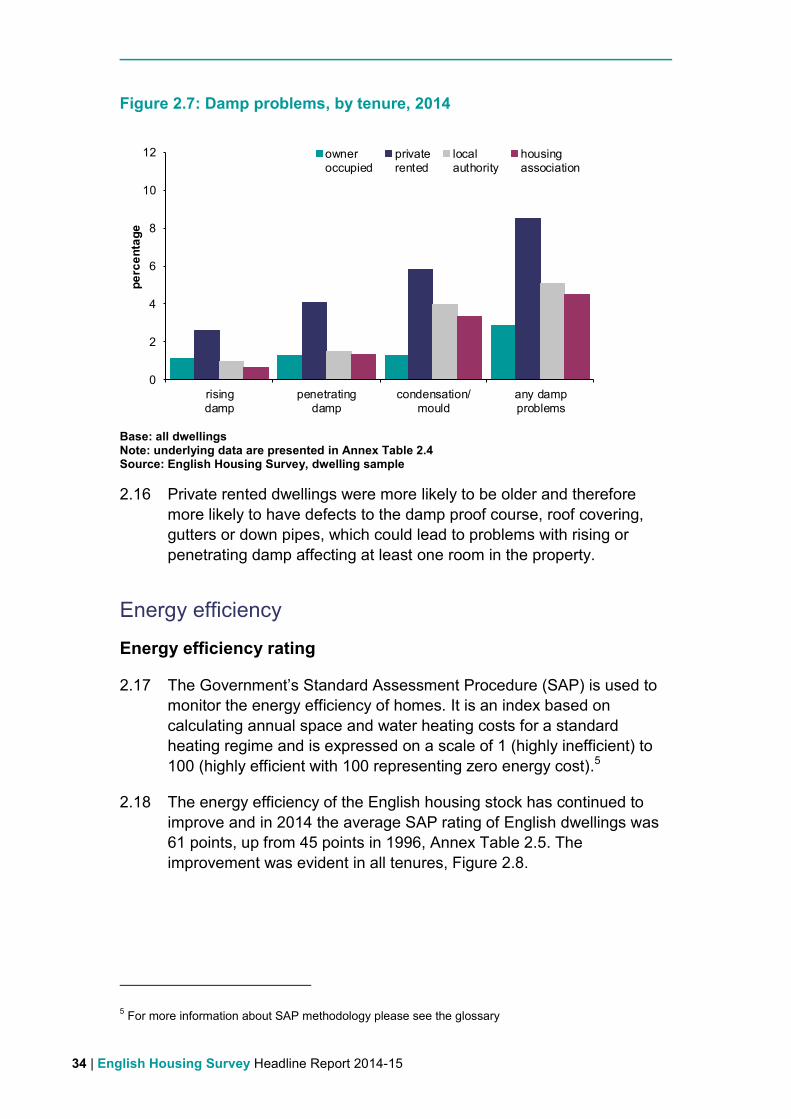
2.15 Owner occupied dwellings were less likely to have any damp problems
while all types of damp problems were more prevalent in private rented
dwellings than in any other tenure. Some 9% of private rented
dwellings had some type of damp problem, compared with 5% of social
rented dwellings, and 3% of owner occupied dwellings, Figure 2.7 and
Annex Table 2.4.
0
2
4
6
8
10
12
14
199
6
200
1
200
3
200
4
200
5
200
6
200
7
200
8
200
9
201
0
201
1
201
2
201
3
201
4
pe
rce
nta
ge
any damp problems
condensation/mould
penetrating damp
rising damp
34 | English Housing Survey Headline Report 2014-15
Figure 2.7: Damp problems, by tenure, 2014
Base: all dwellings Note: underlying data are presented in Annex Table 2.4 Source: English Housing Survey, dwelling sample
2.16 Private rented dwellings were more likely to be older and therefore
more likely to have defects to the damp proof course, roof covering,
gutters or down pipes, which could lead to problems with rising or
penetrating damp affecting at least one room in the property.
Energy efficiency
Energy efficiency rating
2.17 The Government’s Standard Assessment Procedure (SAP) is used to
monitor the energy efficiency of homes. It is an index based on
calculating annual space and water heating costs for a standard
heating regime and is expressed on a scale of 1 (highly inefficient) to
100 (highly efficient with 100 representing zero energy cost).5
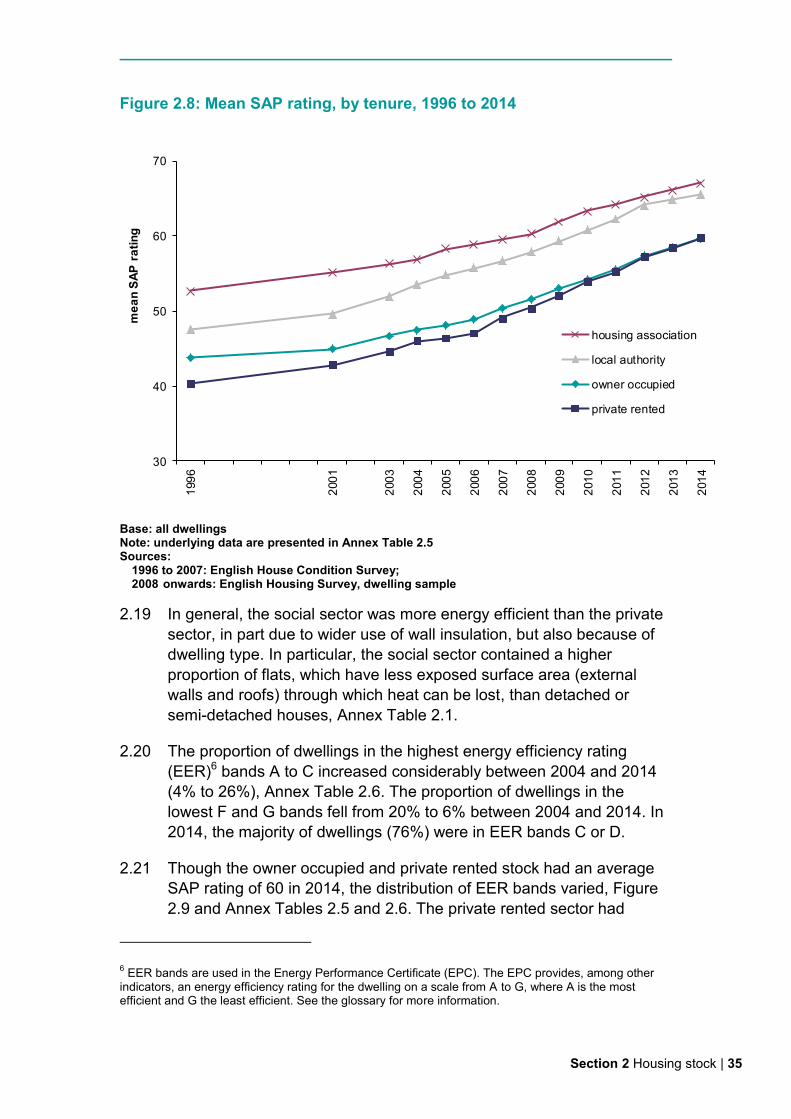
2.18 The energy efficiency of the English housing stock has continued to
improve and in 2014 the average SAP rating of English dwellings was
61 points, up from 45 points in 1996, Annex Table 2.5. The
improvement was evident in all tenures, Figure 2.8.
5 For more information about SAP methodology please see the glossary
0
2
4
6
8
10
12
risingdamp
penetratingdamp
condensation/mould
any dampproblems
pe
rce
nta
ge
owneroccupied
privaterented
localauthority
housingassociation
Section 2 Housing stock | 35
Figure 2.8: Mean SAP rating, by tenure, 1996 to 2014
Base: all dwellings Note: underlying data are presented in Annex Table 2.5 Sources:
1996 to 2007: English House Condition Survey; 2008 onwards: English Housing Survey, dwelling sample
2.19 In general, the social sector was more energy efficient than the private
sector, in part due to wider use of wall insulation, but also because of
dwelling type. In particular, the social sector contained a higher
proportion of flats, which have less exposed surface area (external
walls and roofs) through which heat can be lost, than detached or
semi-detached houses, Annex Table 2.1.
2.20 The proportion of dwellings in the highest energy efficiency rating
(EER)6 bands A to C increased considerably between 2004 and 2014
(4% to 26%), Annex Table 2.6. The proportion of dwellings in the
lowest F and G bands fell from 20% to 6% between 2004 and 2014. In
2014, the majority of dwellings (76%) were in EER bands C or D.
2.21 Though the owner occupied and private rented stock had an average
SAP rating of 60 in 2014, the distribution of EER bands varied, Figure
2.9 and Annex Tables 2.5 and 2.6. The private rented sector had
6 EER bands are used in the Energy Performance Certificate (EPC). The EPC provides, among other
indicators, an energy efficiency rating for the dwelling on a scale from A to G, where A is the most efficient and G the least efficient. See the glossary for more information.
30
40
50
60
70
199
6
200
1
200
3
200
4
200
5
200
6
200
7
200
8
200
9
201
0
201
1
201
2
201
3
201
4
me
an
SA
P r
ati
ng
housing association
local authority
owner occupied
private rented

36 | English Housing Survey Headline Report 2014-15
proportionally more dwellings in EER band C (69-80 SAP points) than
the owner occupied sector (24% compared to 20%). While there were
more EER band D (55-68 SAP points) in owner occupied homes (54%)
than in private rented sector (49%). This was in part due to the fact that
the private rented sector contains a larger proportion of flats than the
owner occupied sector and these flats, especially newer purpose built
ones, tend to be more energy efficient than the average dwelling.
Figure 2.9: Energy efficiency rating bands, by tenure, 2014
Base: all dwellings Note: underlying data are presented in Annex Table 2.6 Source: English Housing Survey, dwelling sample
2.22 There are two key methods of improving the energy efficiency of
existing dwellings: upgrading the dwelling’s heating system and
improving insulation.
0 10 20 30 40 50 60
owner occupied
private rented
local authority
housing association
owner occupied
private rented
local authority
housing association
owner occupied
private rented
local authority
housing association
owner occupied
private rented
local authority
housing association
owner occupied
private rented
local authority
housing association
owner occupied
private rented
local authority
housing association
..
..
..
percentage
A/B
C
D
E
F
G
Section 2 Housing stock | 37
Heating
2.23 Since 1996 the proportion of homes with central heating increased
(from 80% to 92% in 2014) while the proportion of homes with room
heaters as their main heating source – the least cost-effective and
most inefficient method of heating – decreased from 12% to 3%. The
proportion of homes with storage heaters decreased over this period
from 8% to 6%, Annex Table 2.7.
2.24 In 2014, the private rented sector had the lowest proportion of homes
with central heating (85%), followed by housing association (88%).
Owner occupied and local authority homes had the highest (94% and
93% respectively), Annex Table 2.8.
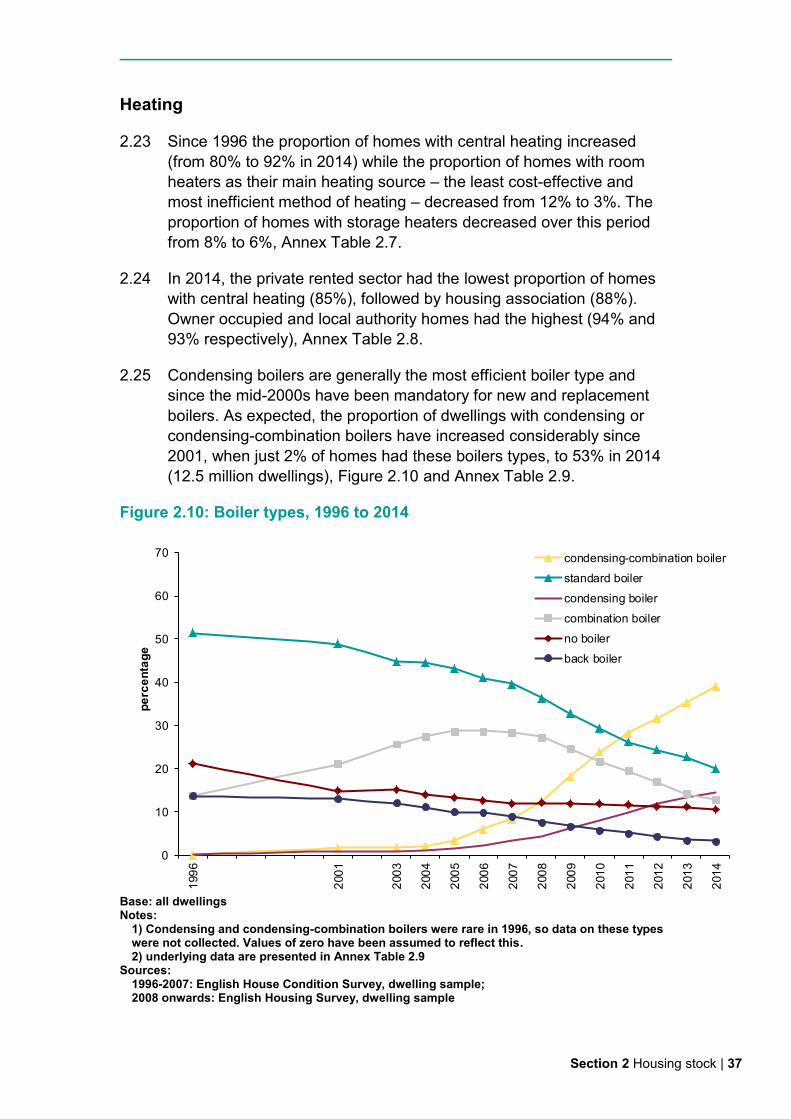
2.25 Condensing boilers are generally the most efficient boiler type and
since the mid-2000s have been mandatory for new and replacement
boilers. As expected, the proportion of dwellings with condensing or
condensing-combination boilers have increased considerably since
2001, when just 2% of homes had these boilers types, to 53% in 2014
(12.5 million dwellings), Figure 2.10 and Annex Table 2.9.
Figure 2.10: Boiler types, 1996 to 2014
Base: all dwellings Notes:
1) Condensing and condensing-combination boilers were rare in 1996, so data on these types were not collected. Values of zero have been assumed to reflect this. 2) underlying data are presented in Annex Table 2.9
Sources: 1996-2007: English House Condition Survey, dwelling sample; 2008 onwards: English Housing Survey, dwelling sample
0
10
20
30
40
50
60
70
199
6
200
1
200
3
200
4
200
5
200
6
200
7
200
8
200
9
201
0
201
1
201
2
201
3
201
4
pe
rce
nta
ge
condensing-combination boiler
standard boiler
condensing boiler
combination boiler
no boiler
back boiler
38 | English Housing Survey Headline Report 2014-15
2.26 Older, less energy efficient boiler types were more prevalent in the
private sector. In 2014, 24% of owner occupied dwellings and 15% of
private rented dwellings had a standard boiler, compared with 11% of
social sector dwellings, Annex Table 2.10.
Insulation
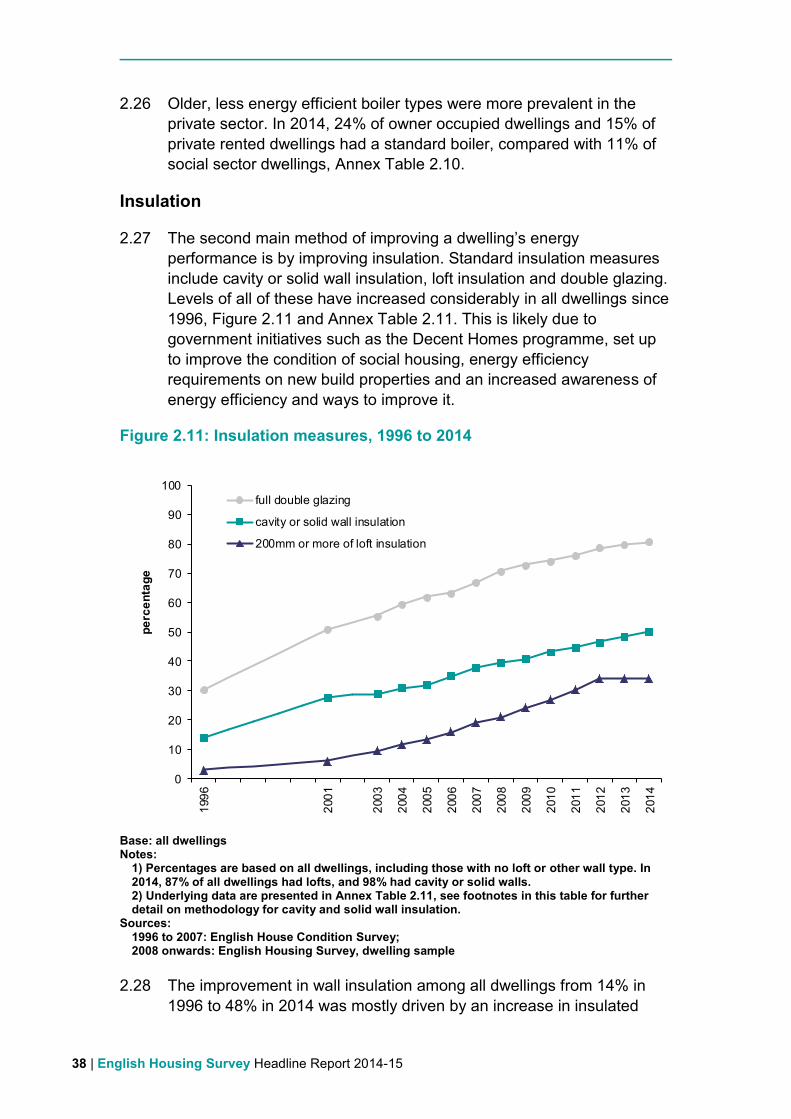
2.27 The second main method of improving a dwelling’s energy
performance is by improving insulation. Standard insulation measures
include cavity or solid wall insulation, loft insulation and double glazing.
Levels of all of these have increased considerably in all dwellings since
1996, Figure 2.11 and Annex Table 2.11. This is likely due to
government initiatives such as the Decent Homes programme, set up
to improve the condition of social housing, energy efficiency
requirements on new build properties and an increased awareness of
energy efficiency and ways to improve it.
Figure 2.11: Insulation measures, 1996 to 2014
Base: all dwellings Notes:
1) Percentages are based on all dwellings, including those with no loft or other wall type. In 2014, 87% of all dwellings had lofts, and 98% had cavity or solid walls. 2) Underlying data are presented in Annex Table 2.11, see footnotes in this table for further detail on methodology for cavity and solid wall insulation.
Sources: 1996 to 2007: English House Condition Survey; 2008 onwards: English Housing Survey, dwelling sample
2.28 The improvement in wall insulation among all dwellings from 14% in
1996 to 48% in 2014 was mostly driven by an increase in insulated
0
10
20
30
40
50
60
70
80
90
100
199
6
200
1
200
3
200
4
200
5
200
6
200
7
200
8
200
9
201
0
201
1
201
2
201
3
201
4
pe
rce
nta
ge
full double glazing
cavity or solid wall insulation
200mm or more of loft insulation

Section 2 Housing stock | 39
cavity walls. Taking dwellings with predominantly cavity or solid walls
separately, 69% of dwellings with predominantly cavity walls had
insulation installed compared with only 9% of dwellings with
predominantly solid walls. The social rented sector had a higher
proportion of solid walls with insulation (29%) than owner occupied
(6%) or private rented sector (6%), Figure 2.12 and Annex Table 2.12.
Figure 2.12: Wall insulation, by main wall type and tenure, 2014
Base: dwellings with predominantly cavity walls (green); dwellings with predominantly solid walls (blue) Note: underlying data are presented in Annex Table 2.12 Source: English Housing Survey, dwelling sample
Smoke alarms
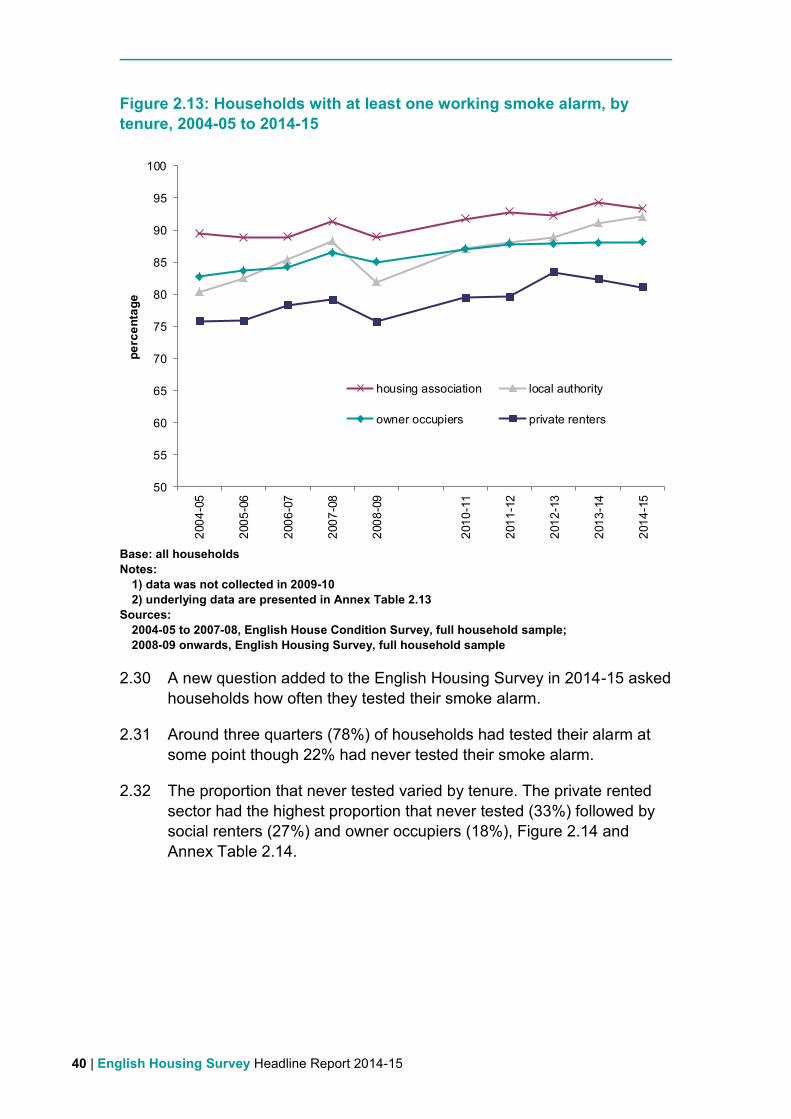
2.29 In 2014-15, 88% of households had at least one working smoke alarm.
The proportion of households with working smoke alarms varied
depending on tenure. Private renters were least likely to have at least
one working smoke alarm (81%), compared with 88% of owner
occupiers, 92% of local authority renters and 93% of households in
housing association properties. Between 2004-05 and 2014-15, the
proportion of households with a working smoke alarm increased among
owner occupiers (from 83% to 88%) and local authority renters (from
80% to 92%). No such change was observed among private or housing
association renters.
0
10
20
30
40
50
60
70
80
owneroccupied
privaterented
localauthority
housingassociation
owneroccupied
privaterented
localauthority
housingassociation
cavity wall properties with insulation solid wall properties with insulation
pe
rce
nta
ge
40 | English Housing Survey Headline Report 2014-15
Figure 2.13: Households with at least one working smoke alarm, by
tenure, 2004-05 to 2014-15
Base: all households
Notes:
1) data was not collected in 2009-10
2) underlying data are presented in Annex Table 2.13
Sources:
2004-05 to 2007-08, English House Condition Survey, full household sample;
2008-09 onwards, English Housing Survey, full household sample
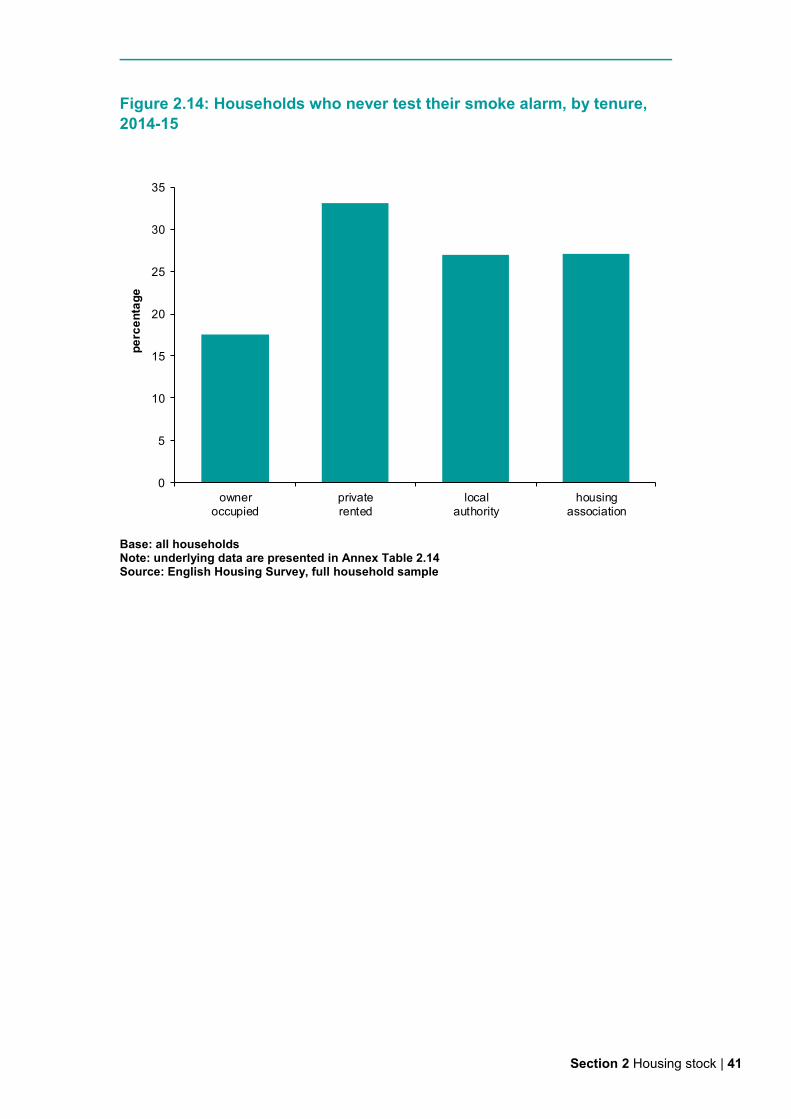
2.30 A new question added to the English Housing Survey in 2014-15 asked
households how often they tested their smoke alarm.
2.31 Around three quarters (78%) of households had tested their alarm at
some point though 22% had never tested their smoke alarm.
2.32 The proportion that never tested varied by tenure. The private rented
sector had the highest proportion that never tested (33%) followed by
social renters (27%) and owner occupiers (18%), Figure 2.14 and
Annex Table 2.14.
50
55
60
65
70
75
80
85
90
95
100
200
4-0
5
200
5-0
6
200
6-0
7
200
7-0
8
200
8-0
9
201
0-1
1
201
1-1
2
201
2-1
3
201
3-1
4
201
4-1
5
pe
rce
nta
ge
housing association local authority
owner occupiers private renters
Section 2 Housing stock | 41
Figure 2.14: Households who never test their smoke alarm, by tenure,
2014-15
Base: all households Note: underlying data are presented in Annex Table 2.14 Source: English Housing Survey, full household sample
0
5
10
15
20
25
30
35
owneroccupied
privaterented
localauthority
housingassociation
pe
rce
nta
ge
42 | English Housing Survey Headline Report 2014-15
Technical notes and glossary
Technical notes
1. Results for the first section of this report, on households, are presented for ‘2014-
15’ and are based on fieldwork carried out between April 2014 and March 2015
on a sample of 13,174 households. Throughout the report, this is referred to as
the ‘full household sample’.
2. Results in the second section of the report, which relate to the physical dwelling,
are presented for ‘2014’ and are based on fieldwork carried out between April
2013 and March 2015 (a mid-point of April 2014). The sample comprises 12,297
occupied or vacant dwellings where a physical inspection was carried out.
Throughout the report, this is referred to as the ‘dwelling sample’.
3. Where the numbers of cases in the sample are too small for any inference to be
drawn about the national picture, the cell contents are replaced with a “u”. This
happens where the cell count is less than 5. When percentages are based on a
row or column total with unweighted total sample size of less than 30, the figures
are italicised. Figures in italics are therefore based on a small sample size and
should be treated as indicative only.
4. Where comparative statements have been made in the text, these have been
significance tested to a 95% confidence level. This means we are 95% confident
that the statements we are making are true.
5. Additional annex tables, including the data underlying the figures and charts, are
published on the website:
https://www.gov.uk/government/organisations/department-for-communities-and-
local-government/series/english-housing-survey alongside many supplementary
tables, which are updated each year (in the summer) but are too numerous to
include in our reports. Further information on the technical details of the survey,
and information and past reports on the Survey of English Housing and the
English House Condition Survey, can also be accessed via this link.

Technical notes and glossary | 43
Glossary
Assured shorthold private tenancy: This type of tenancy is where the landlord can regain possession of the property six months after the beginning of the tenancy, as long as they provide the tenant with two months’ notice. Assured private tenancy: This type of tenancy is where the tenant has the right to remain in the property unless the landlord can prove they have grounds for possession. The landlord does not have an automatic right to repossess the property when the tenancy comes to an end. Bedroom standard: The ‘bedroom standard’ is used by government as an indicator of occupation density. A standard number of bedrooms are calculated for each household in accordance with its age/sex/marital status composition and the relationship of the members to one another. A separate bedroom is allowed for each married or cohabiting couple, any other person aged 21 or over, each pair of adolescents aged 10-20 of the same sex, and each pair of children under 10. Any unpaired person aged 10-20 is notionally paired, if possible, with a child under 10 of the same sex, or, if that is not possible, he or she is counted as requiring a separate bedroom, as is any unpaired child under 10. This notional standard number of bedrooms is then compared with the actual number of bedrooms (including bed-sitters) available for the sole use of the household, and differences are tabulated. Bedrooms converted to other uses are not counted as available unless they have been denoted as bedrooms by the respondents; bedrooms not actually in use are counted unless uninhabitable. Households are said to be overcrowded if they have fewer bedrooms available than the notional number needed. Households are said to be under-occupying if they have two or more bedrooms more than the notional needed. Boiler type: The report covers a number of boiler types:
standard: provides hot water or warm air for space heating with the former also
providing hot water via a separate storage cylinder. back: located behind a room heater and feeds hot water to a separate storage
cylinder. They are generally less efficient than other boiler types. combination: provides hot water or warm air for space heating and can provide
hot water on demand negating the need for a storage cylinder, therefore requiring less room.
condensing: standard and combination boilers can also be condensing. A
condensing boiler uses a larger, or dual, heat exchanger to obtain more heat from burning fuel than an ordinary boiler, and is generally the most efficient boiler type.
Damp and mould: There are three main categories of damp and mould covered in this report:

44 | English Housing Survey Headline Report 2014-15
rising damp: where the surveyor has noted the presence of rising damp in at least one of the rooms surveyed during the physical survey. Rising damp occurs when water from the ground rises up into the walls or floors because damp proof courses in walls or damp proof membranes in floors are either not present or faulty.
penetrating damp: where the surveyor has noted the presence of penetrating
damp in at least one of the rooms surveyed during the physical survey. Penetrating damp is caused by leaks from faulty components of the external fabric e.g. roof covering, gutters etc. or leaks from internal plumbing, e.g. water pipes, radiators etc.
condensation or mould: caused by water vapour generated by activities like
cooking and bathing condensing on cold surfaces like windows and walls. Virtually all dwellings have some level of condensation. Only serious levels of condensation or mould are considered as a problem in this report, namely where there are extensive patches of mould growth on walls and ceilings and/or mildew on soft furnishings.
Decent home: A home that meets all of the following four criteria: it meets the current statutory minimum standard for housing as set out in the
Housing Health and Safety Rating System (HHSRS – see below). it is in a reasonable state of repair (related to the age and condition of a range
of building components including walls, roofs, windows, doors, chimneys, electrics and heating systems).
it has reasonably modern facilities and services (related to the age, size and
layout/location of the kitchen, bathroom and WC and any common areas for blocks of flats, and to noise insulation).
it provides a reasonable degree of thermal comfort (related to insulation and
heating efficiency). The detailed definition for each of these criteria is included in A Decent Home: Definition and guidance for implementation, Department for Communities and Local Government, June 20067. Dependent children: Any person aged 0 to 15 in a household (whether or not in a family) or a person aged 16 to 18 in full-time education and living in a family with his or her parent(s) or grandparent(s). It does not include any people aged 16 to 18 who have a spouse, partner or child living in the household. Double glazing: This covers factory made sealed window units only. It does not include windows with secondary glazing or external doors with double or secondary glazing (other than double glazed patio doors, which are surveyed as representing two windows).
7 https://www.gov.uk/government/publications/a-decent-home-definition-and-guidance

Technical notes and glossary | 45
Dwelling: A unit of accommodation which may comprise one or more household spaces (a household space is the accommodation used or available for use by an individual household). A dwelling may be classified as shared or unshared. A dwelling is shared if: the household spaces it contains are ‘part of a converted or shared house’, or not all of the rooms (including kitchen, bathroom and toilet, if any) are behind a
door that only that household can use, and there is at least one other such household space at the same address with
which it can be combined to form the shared dwelling. Dwellings that do not meet these conditions are unshared dwellings. The EHS definition of dwelling is consistent with the Census 2011. Dwelling type: Dwellings are classified, on the basis of the surveyor’s inspection, into the following categories: small terraced house: a house with a total floor area of less than 70m2 forming
part of a block where at least one house is attached to two or more other houses. medium/large terraced house: a house with a total floor area of 70m2 or more
forming part of a block where at least one house is attached to two or more other houses.
end terraced house: a house attached to one other house only in a block where
at least one house is attached to two or more other houses. mid-terraced house: a house attached to two other houses in a block. semi-detached house: a house that is attached to just one other in a block of
two. detached house: a house where none of the habitable structure is joined to
another building (other than garages, outhouses etc.). bungalow: a house with all of the habitable accommodation on one floor. This
excludes chalet bungalows and bungalows with habitable loft conversions, which are treated as houses.
converted flat: a flat resulting from the conversion of a house or former non-
residential building. Includes buildings converted into a flat plus commercial premises (such as corner shops).
purpose built flat, low rise: a flat in a purpose built block less than six storeys
high. Includes cases where there is only one flat with independent access in a building which is also used for non-domestic purposes.

46 | English Housing Survey Headline Report 2014-15
purpose built flat, high rise: a flat in a purpose built block of at least six storeys high.
Economic status: Respondents self-report their situation and can give more than one answer. working full-time/part-time: full-time work is defined as 30 or more hours per
week. Part-time work is fewer than 30 hours per week. Where more than one answer is given, ‘working’ takes priority over other categories (with the exception that all those over State Pension Age (SPA) who regard themselves as retired are classified as such, regardless of what other answers they give).
unemployed: this category covers people who were registered unemployed or
not registered unemployed but seeking work. retired: this category includes all those over the state pension age who reported
being retired as well as some other activity. For men the SPA is 65 and for women it is 60 if they were born before 6th April 1950. For women born on or after the 6th April 1950, the state pension age has increased incrementally since April 20108.
full-time education: education undertaken in pursuit of a course, where an
average of more than 12 hours per week is spent during term time. other inactive: all others; they include people who were permanently sick or
disabled, those looking after the family or home and any other activity. On occasions, full-time education and other inactive are combined and described as other economically inactive. Energy efficiency rating: A dwelling’s energy costs per m2 of floor area for standard occupancy of a dwelling and a standard heating regime and is calculated from the survey using a simplified form of SAP. The energy costs take into account the costs of space and water heating, ventilation and lighting, less cost savings from energy generation technologies. They do not take into account variation in geographical location. The rating is expressed on a scale of 1-100 where a dwelling with a rating of 1 has poor energy efficiency (high costs) and a dwelling with a rating of 100 represents zero net energy cost per year. It is possible for a dwelling to have a SAP rating of over 100 where it produces more energy than it consumes, although such dwellings will be rare within the English housing stock. The detailed methodology for calculating SAP to monitor the energy efficiency of dwellings was updated in 2012 to reflect developments in the energy efficiency technologies and knowledge of dwelling energy performance. These changes in the SAP methodology were relatively minor compared with previous SAP methodology updates in 2005 and 2009. It means, however that a SAP rating using the 2009 method is not directly comparable to one calculated under the 2012 methodology, and it would be incorrect to do so. All SAP statistics used in reporting from 2013 are
8 For further information see: www.gov.uk/browse/working/state-pension
Technical notes and glossary | 47
based on the SAP 2012 methodology and this includes time series data from 1996 to the current reporting period (i.e. the SAP 2012 methodology has been retrospectively applied to 1996 and subsequent survey data to provide consistent results in the 2013 and following reports). Energy efficiency rating (EER) bands: The 1-100 SAP energy efficiency rating is also presented in an A-G banding system for an Energy Performance Certificate, where Band A rating represents low energy costs (i.e. the most efficient band) and Band G rating represents high energy costs (the least efficient band). The break points in SAP (see below) used for the EER Bands are: Band A (92–100) Band B (81–91) Band C (69–80) Band D (55–68) Band E (39–54) Band F (21–38) Band G (1–20) Gross annual income: The annual income of the household reference person and (any) partner. This includes income from private sources (regular employment, self-employment, government schemes, occupational pensions, private pensions and other private income), state benefits/allowances and tax credits, as collected on the EHS (this includes housing benefit/Local Housing Allowance but excludes council tax benefit and Support for Mortgage Interest) and interest from savings. It is a gross measure i.e. income before Income Tax or National Insurance deductions. Heating system: There are three main types of heating covered in this report: central heating system: most commonly a system with a gas fired boiler and
radiators which distribute heat throughout the dwelling (but also included in this definition are warm air systems, electric ceiling/underfloor and communal heating). It is generally considered to be a cost effective and relatively efficient method of heating a dwelling.
storage heaters: predominately used in dwellings that have an off-peak
electricity tariff. Storage heaters use off-peak electricity to store heat in clay bricks or a ceramic material, this heat is then released throughout the day. However, storage heating can prove expensive if too much on peak electricity is used during the day.
room heaters: this category includes all other types of heater such as fixed gas,
fixed electric or portable electric heaters, this type of heating is generally considered to be the least cost effective of the main systems and produces more carbon dioxide emissions per kWh.
Household: One person or a group of people (not necessarily related) who have the accommodation as their only or main residence, and (for a group) share cooking facilities and share a living room or sitting room or dining area.

48 | English Housing Survey Headline Report 2014-15
The EHS definition of household is slightly different from the definition used in the 2011 Census. Unlike the EHS, the 2011 Census did not limit household membership to people who had the accommodation as their only or main residence. The EHS included that restriction because it asks respondents about their second homes, the unit of data collection on the EHS, therefore, needs to include only those people who have the accommodation as their only or main residence. Household reference person (HRP): The person in whose name the dwelling is owned or rented or who is otherwise responsible for the accommodation. In the case of joint owners and tenants, the person with the highest income is taken as the HRP. Where incomes are equal, the older is taken as the HRP. This procedure increases the likelihood that the HRP better characterises the household’s social and economic position. The EHS definition of HRP is not consistent with the Census 2011, in which the HRP is chosen on basis of their economic activity. Where economic activity is the same, the older is taken as HRP, or if they are the same age, HRP is the first listed on the questionnaire. Household type: The main classification of household type uses the following categories: married/cohabiting couple with no dependent children or with non-dependent
child(ren) only. married/cohabiting couple with dependent child(ren) – may also include non-
dependent child(ren). lone parent family (one parent with dependent child(ren) – may also include non-
dependent child(ren). other multi-person household (includes flat sharers, lone parents with non-
dependent children only and households containing more than one couple or lone parent family).
one person aged under 60. one person aged 60 or over. The married/cohabiting couple and lone parent household types (the first three categories above) may include one-person family units in addition to the couple/lone parent family. Housing Health and Safety Rating System (HHSRS): A risk assessment tool used to assess potential risks to the health and safety of occupants in residential properties in England and Wales. It replaced the Fitness Standard in April 2006. The purpose of the HHSRS assessment9 is not to set a standard but to generate objective information in order to determine and inform enforcement decisions. There are 29 categories of hazard, each of which is separately rated, based on the risk to the potential occupant who is most vulnerable to that hazard. The individual hazard scores are grouped into 10 bands where the highest bands (A-C representing scores of 1,000 or more) are considered to pose Category 1 hazards. Local authorities have a duty to act where Category 1 hazards are present, and may take into account the vulnerability of the actual occupant in determining the best course of action.
9 https://www.gov.uk/government/organisations/department-for-communities-and-local-
government/series/housing-health-and-safety-rating-system-hhsrs-guidance
Technical notes and glossary | 49
For the purposes of the decent homes standard, homes posing a Category 1 hazard are non-decent on its criterion that a home must meet the statutory minimum requirements. The EHS is not able to replicate the HHSRS assessment in full as part of a large scale survey. Its assessment employs a mix of hazards that are directly assessed by surveyors in the field and others that are indirectly assessed from detailed related information collected. For 2006 and 2007, the survey (the then English House Condition Survey) produced estimates based on 15 of the 29 hazards. From 2008, the survey is able to provide a more comprehensive assessment based on 26 of the 29 hazards. See the EHS Technical Note on Housing and Neighbourhood Conditions10 for a list of the hazards covered. Insulation: There are two main types of insulation covered in this report: wall insulation
solid walls: where a dwelling has external walls of predominantly masonry solid construction, it is defined as having solid wall insulation if at least 50% of the solid walls are fitted with insulation. This could be applied either externally (e.g. insulated board attached to the external face with a render finish) or internally (e.g. insulated plasterboard fitted to the external walls inside each room, with a plaster finish). cavity walls: where a dwelling has external walls of predominantly cavity construction, it is defined as having cavity wall insulation if at least 50% of the cavity walls are filled with insulation. This could have been fitted during construction or retrospectively injected between the masonry leaves of the cavity wall. other walls: these are any dwellings with predominantly non-cavity or masonry solid walls (e.g. timber, metal or concrete frames).
loft insulation: the presence and depth of loft insulation is collected for all
houses and top-floor flats. Insulation could be found between joists above the ceiling of the top floor of the dwelling or between the roof timbers where the loft has been converted to a habitable space. Where insulation could not be observed, information is taken from the householder or from imputed estimates based on the age and type of the dwelling.
Overcrowding: Households are said to be overcrowded if they have fewer bedrooms available than the notional number needed according to the bedroom standard definition. See bedroom standard. Private accommodation: The majority of homes in all three tenures, excluding hotels, bed and breakfast accommodation and institutional residences such as student halls, army barracks and care homes. The EHS only covers private accommodation.
10
https://www.gov.uk/government/uploads/system/uploads/attachment_data/file/211302/Housing_and_Neighbourhood_Conditions.pdf
50 | English Housing Survey Headline Report 2014-15
Right to Buy scheme: The Right to Buy scheme gives secure tenants in a local authority home the opportunity to buy their home at a discount. In order to qualify for the scheme a social tenant must have lived for a total of at least five years in a public sector tenancy. The scheme is also available to assured tenants of non-charitable housing associations who have transferred with their homes from a local authority as part of a stock transfer. In this case the tenants is said to have a ‘preserved Right to Buy’. The Government has plans to extend Right to Buy to housing association tenants and are currently running a Voluntary Right to Buy pilot scheme amongst a small number of housing associations. SAP: The energy cost rating as determined by Government’s Standard Assessment Procedure (SAP) and is used to monitor the energy efficiency of dwellings. It is an index based on calculated energy costs for a standard heating regime and is expressed on a scale of 1 (highly inefficient) to 100 (highly efficient with 100 representing zero energy cost). It is possible for a dwelling to have a SAP rating of over 100 where it produces more energy than it consumes although such dwellings will be rare within the English housing stock. The method for calculating SAP was comprehensively updated in 2005 and in 2009 with an update of a more minor nature in 2012. This new SAP 2012 methodology is used in this report. Social housing rents: Most social housing rents are calculated according to ‘rent restructuring’ policy, introduced in 2001. The overall intention of the policy was that similar properties in similar areas should have similar levels of rents. The formula calculates rents for each individual property based on 30% of the relative property values at 1999 levels, 70% on relative local earnings and the size of the property. The formula rent had been increased annually at the rate of Retail Price Index inflation at the previous September + 0.5% until 2015-16 when it was increased by CPI +1%.
In 2012, the Government introduced Affordable Rent as another main type of social housing rents, which can be set at up to 80% of the market rate of the property, inclusive of service charges. Between 2016-17 and 2019-20, social housing rents will be reduced by 1% a year, for 4 years except from supported housing, almshouses, community land trusts and fully mutual housing co-ops which will be excepted during the first year. There is also a different arrangement for rents for intermediate rent properties (which falls within the statutory definition of social housing). Tenure: In this report, households are typically grouped into three broad categories known as tenures: owner occupiers, social renters and private renters. The tenure defines the conditions under which the home is occupied, whether it is owned or

Technical notes and glossary | 51
rented, and if rented, who the landlord is and on what financial and legal terms the let is agreed. owner occupiers: households in accommodation which they either own outright,
are buying with a mortgage or as part of a shared ownership scheme.
social renters: this category includes households renting from Local Authorities (including Arms’ Length Management Organisations (ALMOs) and Housing Action Trusts) and Housing Associations, Local Housing Companies, co-operatives and charitable trusts.
A significant number of Housing Association tenants wrongly report that they are Local Authority tenants. The most common reason for this is that their home used to be owned by the Local Authority, and although ownership was transferred to a Housing Association, the tenant still reports that their landlord is the Local Authority. There are also some Local Authority tenants who wrongly report that they are Housing Association tenants. Data from the EHS for 2008-09 onwards incorporate a correction for the great majority of such cases in order to provide a reasonably accurate split of the social rented category.
private renters: this sector covers all other tenants including all whose
accommodation is tied to their job. It also includes people living rent-free (for example, people living in a flat belonging to a relative).
Under-occupation: Households are said to be under-occupying their property if they have two or more bedrooms more than the notional number needed according to the bedroom standard definition. See bedroom standard. Usable floor area: The total usable internal floor area of the dwelling as measured by the surveyor, rounded to the nearest square metre. A new modelling approach since the 2013 report uses assumptions aligned with the Nationally Described Space Standard which was published as part of the Housing Standards Review. It excludes integral garages, balconies, stores accessed from the outside only and the area under external walls. The area remaining represents the total of all room areas, hallways and circulation space including cupboards and stairs. The area under internal partition walls is also included. Loft space is not included unless the loft is habitable, with a fixed stair in place to access it. Dwellings are also grouped into the following five categories: less than 50m2 50 to 69m2 70 to 89m2 90 to 109m2 110m2 or more. Vacant dwellings: The assessment of whether or not a dwelling is vacant is made at the time of the interviewer’s visit. Clarification of vacancy is sought from neighbours. Surveyors are required to gain access to vacant dwellings and undertake full inspections.

52
Crown copyright, 2016
Copyright in the typographical arrangement rests with the Crown.
You may re-use this information (not including logos) free of charge in any format or medium, under the terms of the Open Government Licence. To view this licence,http://www.nationalarchives.gov.uk/doc/open-government-licence/version/3/ or write to the Information Policy Team, The National Archives, Kew, London TW9 4DU, or email: [email protected].
This document/publication is also available on our website at www.gov.uk/dclg
If you have any enquiries regarding this document/publication, complete the form at http://forms.communities.gov.uk/ or write to us at:
Department for Communities and Local Government Fry Building 2 Marsham Street London SW1P 4DF Telephone: 030 3444 0000 Email: [email protected]
For all our latest news and updates follow us on Twitter: https://twitter.com/CommunitiesUK
February 2016
ISBN: 978-1-4098-4779-3
The United Kingdom Statistics Authority has designated these statistics
as National Statistics, in accordance with the Statistics and Registration
Service Act 2007 and Signifying compliance with the Code of Practice for
Official Statistics.
Designation can be broadly interpreted to mean that the statistics:
meet identified user needs;
are well explained and readily accessible;
are produced according to sound methods, and
are managed impartially and objectively in the public interest.
Once statistics have been designated as National Statistics it is a
statutory requirement that the Code of Practice shall continue to be
observed.


