
Energy Postgraduate Conference 2013
Resource Assessment of the Agulhas Current to determine Feasibility for Marine Energy Extraction Centre for Renewable and Sustainable Energy StudiesStellenbosch University
Presenter: Josh ReineckeResearchers: I. Meyer, J. Reinecke & Prof J. L Van Niekerk

Ocean Current Energy Ocean Current Energy around South Africaaround South Africa
Agulhas Current is South Africa’s strongest ocean
current resource
Viability for energy extraction?

• Water mass contribution of the Agulhas Current:– Agulhas Current retroflection – largest source– Mozambique Current– East Madagascar Current
• Poleward flowing Under Current
• The continental shelf narrows between Durban and Port Edward
– causing the current to flow near the shore with a high velocity
– also helps stabilize the Agulhas Current in this region and no regular wide meanderings are present.
• Destabilizing Region: The Natal Bight
– Situated between Durban and Richards Bay
– This area has a wider continental shelf and the shelf’s morphology change destabilizes the current, resulting in infrequent formation of Natal Pulses
Agulhas Current: Agulhas Current: CharacteristicsCharacteristics
} The contributions from these two sources are mostly in the form of eddies or rings

Agulhas Current: Previous Agulhas Current: Previous ResearchResearch
Mean structure of the Agulhas Current presented by Bryden et al (Bryden, et al., 2005)
Velocity structure [cm/s] (Beal & Bryden, 1999)
• Bryden et al (2005) took the variability into account when examining the mean characteristics of the Agulhas Current through the use of composite spectral analysis
• It was concluded in the study that a transport of -69.7 Sv ± 4.3 Sv is achieved by the Agulhas Current at 31o S
Beal and Bryden discovered that the core of the current is situated 20 km from the coastline at the surface and it is 70 km wide

Agulhas Current: Data Agulhas Current: Data AnalysedAnalysed
%U
%U
%U%U
%U
%U
%U
%U
%U
%U
%U
%U%U%U%U%U%U%U
%U%U%U%U%U$T$T$T$T$T$T$T$T$T$T
%U%U%U%U%U%U%U%U
%U%U
%U%U%U%U%U%U
#
#
#
#
#
#
#
#
Kei Mouth
East London
Port Alfred
Port Edward
Mbashe estuary
Mdumbi estuary
Port Elizabeth
Port St. Johns
Waterfall Bluff
Cape St. Francis
Port Edward%U
East London%U
Nortek$T
Cape Morgan%U
Fish River%U
200 m
500 m
1000 m
Eskom ADCP deployments
Location of ADCP deployment of data
collected
Data analyses on shore due to restrictions in
morning depth of available technology

Factors impacting Factors impacting deployment site deployment site choicechoice
•External factors that can impact the depth, location and available resource:
− Shipping routes− Existing infrastructure that can
utilize the generated energy − Marine Protected Areas
•Technology specific factors:− Operational depth − Turbine Capacity factor− Array configuration and spacing− Instrumentation used for data
capturing
Distance from the assessment sites to closest substation

Parameter Value
Mean [m/s] 1.46Median [m/s] 1.6Mode [m/s] 1.76Standard Deviation [m/s]
0.59
Minimum [m/s] 0Maximum [m/s] 2.82
Agulhas Current: Results from 18 Agulhas Current: Results from 18 month analysismonth analysisCape MorganCape Morgan
Probability of exceedance
Velocity [m/s]
P50 1.6P75 1.15P90 0.44P99 0.1

Natal Pulses
Agulhas Current: Results from 18 Agulhas Current: Results from 18 month analysismonth analysisCape MorganCape Morgan

Turbine specifications
SeaGen Turbine (Siemens, 2012)
Numerical Turbine
Cut in speed 0.8 m/s 0.6 m/sCut out speed 2.5 m/s 2.0 m/sCp 0.45 0.4
Diameter 16 m 16 m
Agulhas Current: Results from 18 Agulhas Current: Results from 18 month analysismonth analysisCape MorganCape Morgan
The capacity factor also gives a good indication of the variability of the site
The achieved capacity factors are considerably lower than expected. This can be accounted for by the lower velocities experienced in ocean currents in comparison to tidal applications which the technology is designed for and
the variability of the Agulhas Current.
Site Capacity factor %
Cape Morgan 50.9East London location 1 50.8East London location 2 47.5

The plot shows the power plot which has averaged over a five day period. This five day averaged power presents a smoother trend plot and highlights where the distinct drop in power occurs
Agulhas Current: Results from 18 Agulhas Current: Results from 18 month analysismonth analysisCape MorganCape Morgan
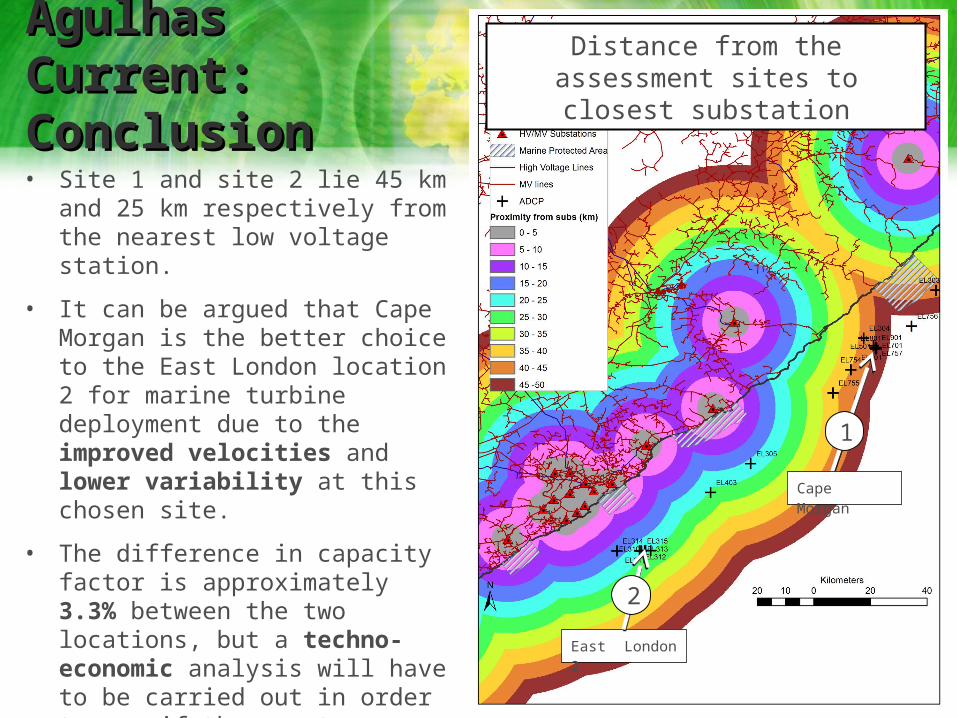
• Site 1 and site 2 lie 45 km and 25 km respectively from the nearest low voltage station.
• It can be argued that Cape Morgan is the better choice to the East London location 2 for marine turbine deployment due to the improved velocities and lower variability at this chosen site.
• The difference in capacity factor is approximately 3.3% between the two locations, but a techno-economic analysis will have to be carried out in order to see if the greater capacity power produced will compensate for the costs incurred for the longer distance of sea cabling.
Agulhas Agulhas Current: Current: ConclusionConclusion
East London 2
Cape Morgan
1
2
Distance from the assessment sites to closest substation


