Download - Energy Policy Council

1 | E P C B i e n n i a l R e p o r t 2 0 2 0
Energy Policy Council 2020 Biennial Report
A Report to the:
North Carolina Governor
Speaker of the North Carolina House of Representatives
President Pro Tempore of the North Carolina Senate,
Environmental Review Commission,
Joint Legislative Commission on Energy Policy, and
the Chair of the Utilities Commission.
OCTOBER 27, 2020

2 | E P C B i e n n i a l R e p o r t 2 0 2 0
This page is intentionally left blank
3 | E P C B i e n n i a l R e p o r t 2 0 2 0
Transmittal Page
Pursuant to N.C.G.S. §113B-12, this comprehensive report providing a general overview of the
energy conditions of the State of North Carolina is hereby transmitted to the Governor, the
Speaker of the North Carolina House of Representatives, the President Pro Tempore of the North
Carolina Senate, the Environmental Review Commission, the Joint Legislative Commission on
Energy Policy, and the chairman of the Utilities Commission.
Respectfully submitted,
_______________________________
Dan Forest, Lieutenant Governor
Chair, Energy Policy Council

4 | E P C B i e n n i a l R e p o r t 2 0 2 0
This page is intentionally left blank

5 | E P C B i e n n i a l R e p o r t 2 0 2 0
Table of Contents
List of Abbreviations ...................................................................................................................... 7
1. Energy Policy Council Overview .............................................................................................. 9
1.1 Overview of the Energy Policy Council .............................................................................. 9
1.2 Energy Policy Council Members and Committees ............................................................ 10
1.3 Purpose of this Report ........................................................................................................ 11
2. Energy Policy Council Recommendations .............................................................................. 12
2.1 Energy Infrastructure Committee ...................................................................................... 12
2.2 Energy Assurance Committee ............................................................................................ 16
2.3 Energy Efficiency Committee ............................................................................................. 17
3. Committee Updates .................................................................................................................. 27
3.1 Energy Infrastructure Committee ...................................................................................... 27
3.2 Energy Assurance Committee ............................................................................................ 38
3.3 Energy Efficiency Committee ............................................................................................ 41
4. North Carolina’s Energy Profile .............................................................................................. 44
4.1 State Energy Statistics........................................................................................................ 44
4.2 State Regulatory Profile ..................................................................................................... 51
Appendices
A. List of EPC Committee Meetings
B. Staff to the Council
C. Public Comments

6 | E P C B i e n n i a l R e p o r t 2 0 2 0
This page is intentionally left blank
7 | E P C B i e n n i a l R e p o r t 2 0 2 0
List of Abbreviations
Btu British thermal units
CHP Combined Heat and Power
CME Coronal Mass Ejection
CNG Compressed Natural Gas
CO2 Carbon Dioxide
DEC & DEP Duke Energy Carolinas and Duke Energy Progress
DEQ North Carolina Department of Environmental Quality
E85 Flex Fuel (high percent ethanol)
EA Energy Assurance
EE Energy Efficiency
EERS Energy Efficiency Resource Standard
EI Energy Infrastructure
EIA Energy Information Agency
EMC Electric Membership Cooperative
EMP Electromagnetic Pulse
EOP Emergency Operations Plan
EPC North Carolina Energy Policy Council
EPRI Electric Power Research Institute
EV Electric Vehicle
FERC Federal Energy Regulatory Commission
GDP Gross Domestic Product
GHG Greenhouse Gases
IRP Integrated Resource Plan
KW Kilowatt
kWh Kilowatt-hour
MMBtu Million British Thermal Unit
MW Megawatt
NCDOT NC Department of Transportation
NCUC North Carolina Utilities Commission
NERC North American Electric Reliability Corporation
NOX Oxides of Nitrogen
O3 Ozone
PC Performance Contracting
PURPA Federal Public Utilities Regulatory Policy Act of 1978
PV Photovoltaic
RE Renewable Energy
REPS Renewable Energy Portfolio Standard
RNG Renewable Natural Gas
8 | E P C B i e n n i a l R e p o r t 2 0 2 0
SO2 Sulfur Dioxide
T&D Transmission and Distribution
USDA United States Department of Agriculture
USDOE United States Department of Energy
USDOI United States Department of the Interior
USEPA United States Environmental Protection Agency
USI North Carolina Utility Savings Initiative
VOCs Volatile Organic Compounds
WAP North Carolina Weatherization Assistance Program

9 | E P C B i e n n i a l R e p o r t 2 0 2 0
1. Energy Policy Council Overview
1.1 Overview of the Energy Policy Council
Under the North Carolina Energy Policy Act of 19751, the General Assembly determined that
energy is essential to the health, safety and welfare of the people of this State and to the
workings of the State economy. It further recognized that it is in the State's best interest to
support the development of a reliable and adequate supply of energy for North Carolina that is
secure, stable, and predictable in order to facilitate economic growth, job creation, and expansion
of business and industry opportunities. The Act created the Energy Policy Council (“Council”) to
advise the Governor and the General Assembly about legislation and regulations to protect the
environment, advance domestic energy exploration and development, and encourage economic
development in North Carolina. The Council’s responsibilities include the preparation of
comprehensive energy policy that addresses present and future energy needs while positioning
North Carolina and the nation towards achieving energy independence.
Members of the Council possess expertise in areas such as: research and policy; the utility
industry; environmental management; and a diverse suite of energy resources and delivery
practices. The Council also develops contingency and emergency plans to address possible
energy shortages in order to protect the public’s health, safety, and welfare, and makes
recommendations about energy efficiency and conservation programs. The Council is an
independent body that is supported by staff in the North Carolina Department of Environmental
Quality.
Pursuant to Chapter 113B of the North Carolina General Statutes, the Council’s responsibilities
include:
• Developing a comprehensive State Energy Policy for the Governor and the General
Assembly that addresses energy requirements in the short- (10 years), mid- (25 years),
and long-term (50 years) in order to achieve maximum effective management and use of
present and future sources of energy.
• Conducting an ongoing assessment of the opportunities and constraints presented by
various uses of all forms of energy to facilitate the expansion of domestic energy supplies
and to encourage the efficient use of energy.
• Reviewing and coordinating energy-related research, education, and management
programs that inform the public, and actively engage in discussions with the federal
government to identify opportunities to increase domestic energy supply within North
Carolina and its adjacent offshore water.
• Recommending to the Governor and the General Assembly, legislation, rulemaking, and
any necessary modifications to energy policy, plans, and programs.
1 North Carolina Energy Policy Act of 1975, North Carolina General Statues § 113B-1,
https://www.ncleg.gov/EnactedLegislation/Statutes/HTML/ByChapter/Chapter_113B.html
10 | E P C B i e n n i a l R e p o r t 2 0 2 0
• Recommending an energy efficiency program that is designed to protect the public health
and safety of the citizens of North Carolina, and considering the conservation of energy
through reducing wasteful, inefficient, or uneconomical use of energy resources.
• Developing contingency and emergency plans to protect the public from possible
shortages of energy, to be compiled into an emergency energy program.
In order to fulfill its statutory directives, the full Council meets quarterly. The three committees
of the Council, which include Energy Infrastructure, Energy Assurance, and Energy Efficiency,
meet more frequently to receive information pertinent to their charge and to develop
recommendation for the full Council’s consideration.
Since the Council convened after the last 2018 Biennial report, full Council meetings were held
in 2018 on May 16 and August 15; in 2019 full Council meetings were held on February 20,
May 15, August 21 and November 18; and in 2020 the full Council met on February 19 with an
upcoming meeting on August 19. The agendas, minutes, and associated presentations and
materials from these meetings are available on the Council’s Web Page.
1.2 Energy Policy Council Members and Committees
The Council is chaired by the Lieutenant Governor or his designee Steven Walker and supported
by 12 additional members appointed according to §113B-3. Together, the Council works to
identify and utilize all domestic energy resources in order to ensure a secure, stable, and
predictable energy supply and to protect the economy of the State, promote job creation, and
expand business and industry opportunities while ensuring the protection and preservation of the
State's natural resources, cultural heritage, and quality of life. The Council anticipates that much
of the work it will perform going forward will be completed by the committees as described
below. Steven Walker (acting for Lt. Governor Forest) serves on each committee but only votes
in the case of a tie.
1. The Energy Assurance (EA) Committee focuses on: energy supply networks and disruptions;
system security (both physical and cyber vulnerabilities); microgrid deployment; distributed
generation (small-scale renewable, combined heat and power); alternative fuels; and
resiliency in building codes. The members of the EA Committee are:
• Paul Worley (Chair)
• Herb Eckerlin
• John Hardin, acting for Secretary of Commerce Copeland
• Jenny Kelvington
• Steven Walker, acting for Lt. Governor Forest
2. The Energy Infrastructure (EI) Committee focuses on: utility-scale generation, transmission,
and distribution; exploration for and penetration of traditional and renewable energy
resources; identifying new energy resources; smart grid technology deployment; and grid
modernization. The members of the EI Committee are:
• Gus Simmons (Chair)
11 | E P C B i e n n i a l R e p o r t 2 0 2 0
• Bruce Barkley
• Rob Caldwell (former)
• Diane Denton (replacement for Rob Caldwell)
• Rachael Estes
• Steven Walker, acting for Lt. Governor Forest
3. The Energy Efficiency (EE) Committee focuses on: life-cycle cost analyses for new and
existing development; performance contracting; expansion of existing programs to all
sectors; transportation applications; energy efficiency building code adoption; and synergies
across State and other programs. The members of the EE Committee are:
• Scott Tew (Chair)
• Paolo Carollo
• Richard Feathers
• Sushma Masemore, acting for DEQ Secretary Regan
• Steven Walker, acting for Lt. Governor Forest
1.3 Purpose of this Report
This 2020 biannual report has been prepared by the Council for transmittal to the Governor, the
Speaker of the House of Representatives, the President Pro Tempore of the Senate, the
Environmental Review Commission, the Joint Legislative Commission on Energy Policy, and
the chairman of the Utilities Commission pursuant to § 113B-12. The report contains policy and
program recommendations prioritized by the Energy Infrastructure Committee, Energy
Assurance Committee, and the Energy Efficiency Committee (Chapter 2). Chapter 3 summarizes
key findings and energy landscape discussion that support the committees’ recommendations.
Chapter 4 provides North Carolina’s energy profile statistics including a general overview of the
energy resources utilized in the State, projected trends in energy consumption and environmental
emissions, demographic data, and economic trends. The chapter concludes with recent legislative
and regulatory actions that could shape the state’s energy profile in the future.
The 2020 biannual report has undergone a public review process from July 10, 2020 to August 9,
2020 prior to adoption or discussion by the full Energy Policy Council. The Council considered
the public comments, discussed, and voted on the final recommendation at its August 19, 2020
joint meeting.

12 | E P C B i e n n i a l R e p o r t 2 0 2 0
2. Energy Policy Council Recommendations
2.1 Energy Infrastructure Committee
The Energy Infrastructure (EI) Committee focuses on: electricity generation, transmission, and
distribution; exploration for and penetration of traditional and renewable energy resources;
identifying new energy resources; smart grid technology deployment; and grid modernization.
The EI Committee is chaired by Gus Simmons of Cavanaugh & Associates, P.A., and its
members are: Bruce Barkley of Piedmont Natural Gas, Rachael Estes of Apex Clean Energy,
Rob Caldwell of Duke Energy and Steven Walker, acting for Lt. Governor Forest.
Following are the EI Committee’s recommendations related to energy infrastructure planning,
bioenergy, and renewable energy.
Energy Infrastructure Planning
Recommendation #EI 1
Energy providers in North Carolina should continue to invest in their generation, transmission,
and distribution infrastructure in order to support future load and economic growth in the State,
while providing the highest levels of reliability and customer service in a safe, cost effective
manner. North Carolina’s legislative and regulatory bodies should provide legislation and
policies that support these investments.
Recommendation #EI 2
Electric utilities in North Carolina should continue to further reduce carbon dioxide
(CO2) emissions and adjust to evolving and innovative technologies in a way that
properly reflects reliability and affordability of electric service. The State’s
legislative and regulatory bodies should continue supporting policies that sustain a
balanced generation portfolio mix in a cost-effective and equitable manner. Specific
system investments to advance these goals should be addressed in future utility
integrated resource plans.
Recommendation #EI 3
North Carolina should consider adopting legislation, similar to that recently approved in
Tennessee and Arizona, that prevents local governmental entities from banning energy choices.
Energy policy should be enacted by the General Assembly and implemented by the North
Carolina Utilities Commission. Integrated resource planning, conducted in the best interest of all
North Carolina consumers, cannot be optimally accomplished in a fractured, uncoordinated basis
that varies by county or municipality.
13 | E P C B i e n n i a l R e p o r t 2 0 2 0
Bioenergy
Recommendation #EI 4:
Develop North Carolina’s Bioenergy Resources Related to Biogas/Biomethane/Renewable
Natural Gas Production. North Carolina holds significant bioenergy production potential to
generate biogas. External demand for renewable natural gas (RNG), through policies such as the
federal Renewable Fuel Standard and state Low Carbon Fuel Standards, has placed a premium
on RNG production, with livestock waste-derived biogas being some of the most valuable. RNG
is methane, a potent greenhouse gas same as natural gas. As such, the venting of RNG to the
environment through routine operation and transportation activities will pose the similar climate
risk as the venting of natural gas. The use of biogas as an energy resource offers a way to
achieve state carbon emission reduction targets while simultaneously offering advanced and
alternative ways of managing the organic wastes created within our State. The resource can
fulfill thermal energy needs as well as be used to create electricity and transportation fuel, all of
which offer energy supply resiliency benefits. Further efforts and leadership are needed to
develop a cohesive strategy related to in-state biogas and RNG development, including but not
limited to standards and policies aimed at cultivating and facilitating the ability of biogas
utilization to reach its full potential. An analysis of the economic, social and environmental costs
associated with the development of biogas should be conducted to assist with further efforts and
leadership. The analysis should address the impact of swine waste-to-energy biogas on the state’s
air and water quality, a clean energy ranking for biogas as compared to other renewable energy
sources, the impact of expanded biogas development on existing legal obligations borne by
major biogas producers in the state, and advanced technologies that reduce concerns with
existing biogas capture and distribution.2 The following actions are recommended to further and
more comprehensively develop the State’s biogas resource potential. They are intended to build
upon recommendations and ongoing work stemming from the EPC’s 2018 recommendations
related to North Carolina’s biogas production potential and effects.3
2 An analysis is being conducted by Research Triangle Institute (RTI) International in conjunction with Duke University and East
Carolina University to quantify biogas opportunities within North Carolina. A preliminary report on the analysis to date was
submitted to the Energy Policy Council on August 8, 2020. The report gives the total biogas potential and the costs for
development of RNG at single site locations. The costs for multi-farm systems and the analysis of the effects of biogas use on
the climate, environment, and other societal impacts will be available when the final report is released in October of 2020. It will
also recommend policy measures for biogas development and best uses of biogas.
3 The 2018 Energy Policy Council’s report included the following recommendations:
1. Developing a bioenergy resource inventory and economic impact analysis related to North Carolina’s biogas
potential; establish goals for the capture and refining of biogas into renewable natural gas for distribution; and
goals for incorporation of biogas-derived natural gas into the State’s transportation fuels program for State
fleets and public transportation.
2. Conducting economic impact analysis including analyses of environmental and community benefits and
impacts, for the beneficial and optimum utilization of the State’s bioenergy resources.
3. Creating a bioenergy resource inventory for North Carolina based on input from industry, regulatory and
academic sources that are current and specific to North Carolina.
4. Completing and summarizing the results of this work in the 2020 Biennial report of the EPC.
Note that the results of a collaborative research project underway to carry out the 2018 recommendations will be provided via the
forthcoming public comment period for the 2020 EPC Biennial Report.

14 | E P C B i e n n i a l R e p o r t 2 0 2 0
A. Evaluate and quantify potential economic and environmental benefits related to the
capture and commercial use of biogas. In addition to the analysis recommended in the
2018 EPC Report,4 further analyses should include consideration of options for building
biogas production capacity and ways by which the state could facilitate ongoing
production and maintenance of production supply chains to maximize economic and
environmental benefits. The economic value of incorporating the state’s biogas and the
renewable natural gas that results from the processing and upgrading of biogas should be
determined to better inform its energy resource planning. The economic and
environmental benefits of greater incorporation of biogas should be compared with the
use of other lower carbon intensity energy resources, as part of efforts to analyze options
for implementing the state’s clean energy plan. Any such data regarding resource
potential, availability and viability of biogas resources as well as other bioenergy
resources (as such data become available) should be presented with and alongside other
energy resources evaluated by the State in any efforts related to energy resource planning
and carbon emission reduction plans and strategies.
B. Develop a comprehensive and implementable plan to incorporate biogas and
renewable natural gas into the State’s 2022 energy resource planning. Incorporating
results of the State Biogas Analysis recommended in the 2018 EPC Report, the goal of
this plan is to implement a renewable natural gas standard or program and associated
regulations for the plan’s implementation by 2022. An evaluation should be conducted in
support of 2022 implementation of the costs and benefits of establishing renewable
natural gas goals and requirements necessary for incorporation of such goals into local
distribution companies (“gas utilities”) that serve North Carolina customers, and options
for the establishment of a means for such gas utilities to recover reasonable costs
associated with any necessary infrastructure improvements and/or costs associated with
incorporating and procuring renewable natural gas derived from in-state resources;
C. Expand evaluation and development efforts related to biogas associated with the
diversion of food waste and other organics from landfills and use of biogas
generated from municipal wastewater treatment plants. Building upon knowledge of
and progress towards biogas development from animal waste, the state should similarly
make progress relative to wastewater treatment plants and diversion of food waste and
other organics from landfills. Evaluation should center on available production methods
and the costs and net benefits of each method. Particular attention should be given to
landfills that currently flare or vent landfill gas and to landfills that service more
populated areas of the state. The evaluation should include recommendations for the
implementation of a state-supported food waste diversion program, including
recommendations for regulatory changes necessary to support such a program, with a
4 NC DEQ Energy Policy Council. (2018) Energy Policy Council Biennial Report. Retrieved from
https://files.nc.gov/ncdeq/Energy%20Mineral%20and%20Land%20Resources/Energy/Energy%20Policy%20Council/2018%20E
PC%20Biennial%20Report%20-%20FINAL.pdf

15 | E P C B i e n n i a l R e p o r t 2 0 2 0
goal of implementing a statewide food waste diversion program, policies and/or
regulations by 2025, to be incorporated into state renewable natural gas standards to be
developed by 2022, as recommended in Recommendation B, above.
D. Develop support programs, such as grant and loan programs, to aid North
Carolina’s smaller municipalities and smaller farming operations implement
systems and processes to produce renewable natural gas from organic wastes, all of
which should be incorporated and/or considered in developing the 2022 plan described
above; and
E. Examine the existing North Carolina General Statutes, Rules, and Policies for
inappropriate barriers to bioenergy use. The existing North Carolina General Statutes,
Rules, and Policies regarding the use and management of conventional fossil-derived
energy resources should be examined for applicability and consistency of outcomes as
pertains to the incorporation of North Carolina’s bioenergy resources generally, biogas,
and renewable natural gas resources in particular. The examination will identify policy
and regulatory changes that should be enacted by or before 2022 necessary for the
development of North Carolina’s bioenergy resources as they relate to biogas in
particular.
Renewable Energy
Recommendation # EI 5:
Adopt legislation requiring North Carolina’s electricity generating utilities to use net-zero
emissions energy resources by 2050 similar to those adopted by other states including
neighboring states, such as Virginia. The General Assembly should invest in North Carolina’s
carbon-free future by increasing the deployment of net zero-emission clean energy sources that
could provide the State with the least expense generation mix, as the levelized cost of renewables
has recently dropped below those of non-renewable forms of energy, like natural gas and coal.5
The system of the future, as we intend it to be clean, should ensure that it provides reliable power
at an affordable cost to all ratepayers. According to a recent study by the Center for
Environmental Policy at the University of California, Berkeley, “the United States can achieve
90% clean, carbon-free electricity nationwide by 2035, dependably, at no extra cost to
consumers, and without new fossil fuel plants.”6 The EI Committee has not reviewed this study,
but it is provided for reference purposes as recommended in the August EPC meeting. The use
5 “Lazard’s Levelized Cost of Energy Analysis – Version 12.0”, Nov 2018, accessed at
https://www.lazard.com/media/450784/lazards-levelized-cost-of-energy-version-120-vfinal.pdf
6 2035 Report: Plummeting Solar, Wind, and Battery Costs Can Accelerate our Clean Energy Future (The 2035 Report),
University of California Berkeley – Goldman School of Public Policy, June 2020, accessed at
https://www.2035report.com/?utm_medium=email&_hsmi=2&_hsenc=p2ANqtz-
_Fv1XU39cJTj0cTJxa4uVRUm_ma6AJoKL2btL3DayzZMcW4o935OB7agNq_O7NsYvYbgT6josa5CqpvJn7unoh5w_MFg&ut
m_content=2&utm_source=hs_email
16 | E P C B i e n n i a l R e p o r t 2 0 2 0
of clean energy resources has already resulted in significant job and economic growth for the
state. Further expansion of homegrown clean energy resource has the potential to put North
Carolinians back to work, create significant tax revenue, and invigorate economic activity in
both urban and rural parts of the State while preserving our environment for future generations.
2.2 Energy Assurance Committee
North Carolina’s energy infrastructure, consisting of diversified generating plants, transmission
and distribution lines, petroleum pipeline systems, and renewable resources, is susceptible to
both natural and man-made occurrences that may result in local or statewide energy emergency
events. As stated on the National Association of Energy Officials website, we work to “achieve a
robust, secure and reliable energy infrastructure that is also resilient - able to restore services
rapidly in the event of any disaster.”7 The Energy Assurance (EA) Committee engages with
energy providers and other stakeholders to address energy assurance in the State’s electric sector,
and its natural gas, petroleum and propane pipelines to consider threats for disruption and any
other occurrences or issues that may jeopardize North Carolina’s energy supply and public
safety.
The EA Committee is chaired by Paul Worley of Mott MacDonald and its members are: Herb
Eckerlin of NC State University, Steven Walker from the Lieutenant Governor’s Office, Jenny
Kelvington from NC State University, and John Hardin representing Secretary Copeland of the
NC Department of Commerce. The EA Committee focuses on identifying and planning for
potential energy emergency threats, preparing for them and mitigating their impacts. Following
are the EA Committee’s recommendations.
Recommendation #EA 1:
Encourage redundancy in North Carolina’s fossil fuel supply chain to mitigate long-term outages
(3+ days) by conducting a statewide tabletop exercise for natural gas and motor fuels that
addresses fuel supply disruptions, curtailment actions, and adequate storage. We recommend
that the North Carolina Department of Environmental Quality’s Energy Office collaborate with
the North Carolina Department of Public Safety’s Division of Emergency Management to
develop and execute the exercise. Participants in the tabletop exercise should include energy
suppliers, Federal, State and local officials, and other stakeholders. The tabletop exercise (held
during calendar year 2020) should help to identify potential fuel redundancy improvement
options for North Carolina, including the development of in-state fuel resources.
7 National Association of Energy Officials (NASEO) (2020) Energy Assurance Planning. Retrieved February 6, 2020 from
https://www.naseo.org/energyassurance/

17 | E P C B i e n n i a l R e p o r t 2 0 2 0
Recommendation #EA 2:
Investigate electric grid reliability and resiliency impacts on North Carolina’s economy and
citizens. Consideration should be given to the impacts on electric generation providers as they
transition from existing coal-fired generation to increased natural gas generation, add renewable
generation, provide added security from cyber and physical attacks, and invest in grid
modernization to mitigate future interruptions. Two existing initiatives, the (1) E4 Carolinas’ and
the North Carolina Office of Science, Technology & Innovation’s Southeast Innovation
Collaborative and (2) a U.S Department of Energy Grant on “Planning an Affordable, Resilient,
and Sustainable Grid” in North Carolina, that address grid resilience/reliability may offer insight
about this recommendation. The findings of this study should be shared with the North Carolina
Climate Change Interagency Council for their consideration in developing resiliency plans
specified in the Governor’s Executive Order 80.
2.3 Energy Efficiency Committee
The Council’s Energy Efficiency committee is chaired by Scott Tew of Trane Technologies and
its members are: Paolo Carollo of Geocycle, Richard Feathers with the North Carolina
Association of Electric Cooperatives, Sushma Masemore representing Secretary Michael Regan
of the Department of Environmental Quality, and Steven Walker representing Lt. Governor
Forest. The Committee has focused on reducing wasteful and inefficient uses of energy
resources through state policy and practice, along with consideration of policies to advance
energy efficiency in State-owned buildings, minimize fuel consumption by motor vehicles, and
to otherwise maximize efficient use of energy resources in the State.
As its starting point, the Committee assessed which prior Committee recommendations,
previously approved by the EPC, had been implemented by either legislative or executive action.
The Committee also subsequently reviewed recommendation in the state’s new Clean Energy
Plan8 released in October 2019 and the Duke Nicholas Institute’s new Energy Efficiency
Roadmap9 released in August 2019.
Following are the EE Committee’s decisions on past recommendations and revised slightly to
reflect the current state of knowledge.
8 North Carolina Clean Energy Plan – Transitioning to a 21st Century Electricity System, Policy and Action Recommendations,
North Carolina Department of Environmental Quality, October 2019. Retrieved from https://deq.nc.gov/energy-climate/climate-
change/nc-climate-change-interagency-council/climate-change-clean-energy-16
9 North Carolina Energy Efficiency Roadmap, Duke University Nicholas Institute for Environmental Policy Solutions, August
2019, Retrieved from www.nicholasinstitute.duke.edu/publications/north-carolina-energy-efficiency-roadmap
18 | E P C B i e n n i a l R e p o r t 2 0 2 0
Past Recommendations for Reapproval in 2020 [initially approved 11/19/2014]
Recommendation #EE 1:
Increase the state buildings energy use reduction goal from 30% to 40% by 2025, thereby
potentially saving an additional $2 billion in reduced utility costs. In 2015, North Carolina
agencies and universities achieved the 30% energy use reduction goal established in G.S. §143-
64.12. In 2019, the reduction level has essentially remained the same.10 The proposed increase
to 40% percent energy use reduction from the 2002–2003 baseline year will enhance the state’s
competitiveness for federal grant funding opportunities and encourage further energy savings.
These state building energy use reduction goals should be addressed in the 2021 NC Legislative
session.
Recommendation #EE 2:
Strengthen and support the state’s Utility Savings Initiative (USI) for public facilities by
providing a 1% pass-through of the annual avoided utility costs realized by the USI program.
The USI program has supported state agencies and universities in avoiding $1.3 billion in utility
expenses since the 2002 – 2003 baseline year.11 To assist state facilities in meeting the proposed
40% percent energy use reduction goal from the 2002 – 2003 baseline year, USI will use the
proposed 1% pass-through budget (approximately $1.14 million) to support training, engineering
and technical assistance, outreach, and incentives for energy project investments.
Recommendation #EE 3:
Establish a program with state governmental entities to allow utility savings to be reinvested in
short duration, rapid payback, and energy conservation measures. Reinvesting energy cost
reductions incentivizes state agencies and universities to re-commission buildings, optimize
building automation systems, and upgrade equipment. One such measure is to allow state
governmental entities flexibility in how to fund EE projects including the ability to carry an EE
reserve fund. Another is to allow for annual Office of State Budget and Management (OSBM)
increases that reflect known utility rate increases and utilize utility savings realized by state
entities to remain available to the agency for additional EE projects.
10 Comprehensive Program to Manage Energy, Water, and Other Utility Use for State Agencies and State Institutions of Higher
Learning - Program Update and Energy Data Legislative Report, Department of Environmental Quality, December 1, 2019.
Retrieved from
https://files.nc.gov/ncdeq/Environmental%20Assistance%20and%20Customer%20Service/Utility%20Savings%20Initiative/com
prehensive-reports/DEQ-Comprehensive-Energy-Program-Report-2019-12-01.pdf
11 Comprehensive Program to Manage Energy, Water, and Other Utility Use for State Agencies and State Institutions of Higher
Learning - Program Update and Energy Data Legislative Report, Department of Environmental Quality, December 1, 2019.
Retrieved from
https://files.nc.gov/ncdeq/Environmental%20Assistance%20and%20Customer%20Service/Utility%20Savings%20Initiative/com
prehensive-reports/DEQ-Comprehensive-Energy-Program-Report-2019-12-01.pdf
19 | E P C B i e n n i a l R e p o r t 2 0 2 0
Recommendation #EE 4:
Pursue a system of electronic data transfer from utility providers to customer’s/owner’s data
collection and analysis systems with a focus on deploying a system such as the USEPA Portfolio
Manager. Accessing electronic utility data will assist state agencies, municipalities, universities,
and retail, commercial and industrial institutions to better manage energy and water use and costs
and identify the best opportunities for energy savings.
Recommendation #EE 5:
Establish a policy that provides for initial and ongoing staff training, resources, and retention to
institutionalize the skills needed to maintain state buildings in an energy-efficient manner. This
can be accomplished by building on the existing USI structure to create a statewide energy
manager program, providing technical support and training to K–12 school districts and
community colleges lacking in-house energy management.
Recommendation #EE 6:
Require commissioning of all new state buildings to ensure they are brought online in optimal
performance, thereby saving taxpayers on long-term costs of building operations.
Commissioning a new building adds roughly 0.6% to the total construction cost, but with the
energy savings, the payback period can be less than 5 years.
2020 Recommendations by Sector
Public Buildings
Recommendation #EE 7:
Revert from the current bi-annual energy reporting period to an annual energy reporting period
for public buildings and institutions under the USI program.
Recommendation #EE 8:
Strengthen the USI Public Buildings programs by:
a. Funding the Energy Management Diploma training.
b. Requiring commissioning for North Carolina Connect Bond projects per S.L. 2015-
280.
c. Providing commissioning training using a state commissioning working group.
d. Exploring expansion of annually reporting utility data to K-12 schools.
20 | E P C B i e n n i a l R e p o r t 2 0 2 0
Commercial Energy Efficiency
Recommendation #EE 9:
Examine the costs and benefits associated with adopting a minimum requirement for commercial
buildings to require third-party commissioning and/or promote training, awareness, and
incentives related to improving energy efficiency in the commercial energy sector.
Recommendation #EE 10:
Investigate state-level support for consumer financing programs such as on-bill financing,
Commercial PACE (C-PACE), and Property Assessed Clean Energy (PACE) financing for both
commercial and residential sectors. The legislature should re-authorize the enabling NC
renewable energy and energy efficiency legislation, as the sunset for cities and towns is July 1,
2020 and July 1, 2022 for counties.12,13 The legislature should also consider improvements in the
existing legislation by giving local governments the authority to delegate the development and
administration of a PACE program to a statewide or regional third-party entity and by easing the
requirement for state level approval of local debt.
Residential Energy Efficiency
Recommendation #EE 11:
Support North Carolina Weatherization Assistance Program (WAP) proposals to integrate two
new components for greater energy reduction through: (i) improved priority scoring and (ii)
measurement & verification practices. One example is to create a unified, standardized waiver
for applicant/homeowners that allows energy consumption data to be shared with multiple state
agencies. The waiver would enable agencies to market programs in more targeted fashion,
measure the efficacy of certain interventions, identify need for follow-up or continued support,
and in the aggregate, understand which programs are most effective at reducing energy burden
for beneficiaries.
Recommendation #EE 12:
Create statewide project management coordination system for delivery of EE, urgent repair, and
weatherization programs. North Carolina energy efficiency, urgent repair, and weatherization
programs are administered separately by multiple agencies, creating significant inefficiencies,
12 NC Session Law 2009-525 (SB 97), Critical Infrastructure Assessment Changes (2009). Retrieved from
https://www.ncleg.gov/Sessions/2009/Bills/Senate/PDF/S97v6.pdf
13 The law allows board of commissioners of a county or a city council to make special assessments against benefited property
for the purpose of financing the installation of distributed generation renewable energy sources or energy efficiency
improvements that are permanently fixed to residential, commercial, industrial, or other real property. The legislation made
changes to critical infrastructure assessment laws to allow for both project debt financing and renewable energy and energy
efficiency improvements to be added on as part of existing special assessment laws. In other words, it amends existing general
statutes (G.S. 153A sections 210.2 (section 1a), 210.4 (section 1b), 210.7 (project implementation), 160A-239.2 (Section 2 a),
160A-239.4 (section 2b), 160A-239.7 (project implementation), and 159-11 (section 3 of SB97)) that deal with special
assessment laws to add RE and EE to the list of approved projects.

21 | E P C B i e n n i a l R e p o r t 2 0 2 0
and falling short of their goals. A coordinated communication between the participating agencies
and building an effective and efficient energy services delivery mechanism is needed to relieve
or eliminate energy burden and improve housing conditions.
Recommendation #EE 13:
Research new programs and incentives for improving the energy efficiency of manufactured
housing.
Recommendation #EE 14:
Assess the costs and benefits of measures intended to encourage builders or owners to exceed
code standards, including programs such as Duke Energy Carolina’s pending NCUC filing to
expand Duke Energy Progress’s incentive for new construction built to or above the Energy
Conservation Code’s High Efficiency Residential Option (“HERO”), or programs offered by
electric and natural gas utilities that provide discounts for Energy Star rated homes.
Recommendation #EE 15:
Consider the value of initiatives designed to promote the competitive advantage of energy
efficient homes, including educating consumers and realtors about metrics to assess residential
EE, such as the Home Energy Rating System (“HERS”) Index or other energy efficiency ratings.
Recommendation #EE 16:
Increase funding to the North Carolina Housing Trust Fund, which has a long history of creating
high-quality multi- and single-family affordable housing opportunities for low-income
communities. The legislature should provide additional funding to improve energy efficient
affordable housing options. By investing in the Housing Trust Fund, the state can meet many
challenges of EE in low-income communities while also creating jobs and new economic
opportunities that healthy housing provides.
Energy Codes
Recommendation #EE 17:
Monitor developments at the General Assembly, particularly those legislative proposals that
support or discourage energy efficiency requirements for buildings and support improvements in
the legislative process for building codes. When the North Carolina legislature makes building
and energy code changes, the NC Building Code Council (NCBCC) should be given the
opportunity to formally review and analyze the proposed changes, especially when they impact
energy usage, health, and life safety.

22 | E P C B i e n n i a l R e p o r t 2 0 2 0
Recommendation #EE 18:
Monitor developments at the NCBCC, particularly those that consider balancing issues of cost
and policy in advancing energy efficient residential construction because of the benefits to
homeowners and renters.
Recommendation #EE 19:
Explore whether a return to a code cycle of 3 years, instead of recently-adopted change to a 6-
year cycle, would be unduly burdensome from a regulatory perspective in light of the potential
benefits to more frequent consideration of code provisions.
Recommendation #EE 20:
Improve the NCBCC by adding energy efficiency expertise to the Council’s makeup, increasing
the EE education of all existing members and establishing new actionable goals that prioritize EE
in North Carolina’s current and future building codes. One additional energy expert to represent
the EE, RE and EV markets should be added to the Council’s makeup.
Recommendation #EE 21:
Establish a defined pathway to net-zero energy ready targets for new buildings by 2042 by
considering costs and benefits. North Carolina’s most current residential and commercial energy
codes most closely follow the 2012 International Energy Conservation Code. The latest energy
codes are between 1–2 percent more energy efficient than the prior 2012 North Carolina Energy
Conservation Code. The EE Roadmap contains several elements for a pathway to net-zero
energy ready new buildings that should be considered, including code updates or shorter code
cycles to ensure a closer alignment to national and international standards.
Codes: Electric Vehicles
Recommendation #EE 22:
Support the burgeoning electric vehicle (EV) industry in the transportation sector of the North
Carolina economy. The additional energy expert referred to in Recommendation #EE 20 will
also represent the EV market. The Council encourages the state to adopt measures and
implement programs that (i) promote electric vehicle adoption, (ii) increase the availability and
public’s knowledge of electric vehicles, and (iii) ease the transition to an electrified
transportation economy for all North Carolinians.14 The Council recommends consideration, by
elected officials and regulatory agencies, of measures intended to address perceived barriers to
EV deployment, including examples such as:
14 During the August EPC meeting, a Council member noted that battery EVs do not appear to be more fuel efficient over their
lifecycle than modern Internal Combustion Engine (ICE) vehicles that are similarly equipped and asked the EE Committee Chair
to evaluate the efficiency of battery EVs. The Committee Chair agreed to look into the matter.

23 | E P C B i e n n i a l R e p o r t 2 0 2 0
a. Residential building codes for the feasibility of required or recommended pre-wiring
for Level 2 EV charging.
b. Commercial building codes for the feasibility of requiring or recommending that
parking lot construction is EV Ready, and identification of what constitutes “EV
Ready.”
c. Americans with Disabilities Act guidelines for EV charging stations.
d. A standardized and streamlined processing for permitting new construction that
incorporates EV Ready infrastructure.
e. Local government authorization to establish codes that encourage EV ready
construction.
Industrial Energy Efficiency
Recommendation #EE 23:
Consider measures intended to encourage adoption of prevailing energy efficiency technology in
industrial settings. Possible areas to consider would include the following:
a. Lighting upgrades from less efficient technology to more efficient Light Emitting
Diodes (LED)
b. Use of occupancy sensors in lightly used areas to automate efficiency
c. Transition to air compression technologies with variable frequency drives (VFD) and
use of the correct size compressor for the right application (i.e., small units at night
during lower demand).
d. Lower compressor pressure settings, use of metered storage for high intermittent use
applications
e. Ensuring industrial boilers are properly maintained and served including proper
insulation of steam/hot water lines
Recommendation #EE 24:
Conduct an analysis of the costs and benefits of using electrification to reduce energy burden and
greenhouse gas emissions in consumer end-use sectors in NC, such as in homes, buildings,
transportation, industrial and agricultural operations and initiate an analysis of the costs and
benefits of electrification of these end-use sectors.
Recommendation #EE 25:
Identify and create opportunities to engage industrial firms to design energy efficiency programs
for industrial application that would improve the number of industrial customers’ participation in
the electric utility programs adopted pursuant to the state Renewable Energy and Energy
Efficiency Portfolio Standard (REPS).
24 | E P C B i e n n i a l R e p o r t 2 0 2 0
Recommendation #EE 26:
Further evaluate opportunities that would expand Combined Heat and Power (CHP) deployment
for both industrial and large commercial and public buildings.
Transportation Efficiency
Recommendation #EE 27:
Investigate potential for improved traffic flow strategies and best practices implemented in other
states, such as traffic circles.
a. Support NC Department of Transportation (NCDOT) and other stakeholders to
provide knowledge and training for community planners who must plan for
increasing population in both large urban areas and small rural communities. In many
areas, the lack of planning to address population demands impedes efficient traffic
infrastructure.
b. Focus efforts on education, performance assessment, and the provision of knowledge
and global benchmarking tools available to local and regional planners and leaders to
better inform their decision-making. Investigate and evaluate tools and policies at the
State level that allow city planners to assess and improve the efficiency of traffic
systems, and more importantly, to gain knowledge of possible options with high
return for investment that can be used to fund future projects.
Recommendation #EE 28:
Evaluate options for establishing targets for transitioning public transit, private and fleet
transportation, and other modes of transport to higher utilization of alternative fuels, including
conversion of and engine rebuild for school buses and other vehicles.
Recommendation #EE 29:
Create and implement standardized highway and wayfinding language for alternative fuel
stations, chargers, and associated infrastructure.
Recommendation #EE 30:
Evaluate the feasibility of on-road alternative fuel vehicles incentives, such as utilization of high-
occupancy vehicle (HOV) lanes.
Recommendation #EE 31:
Collective recognition that EV adoption in the State will not happen in a vacuum and the impacts
of such a paradigm shift are far-reaching. Opportunities to shape EV adoption in North Carolina
will hinge on:
25 | E P C B i e n n i a l R e p o r t 2 0 2 0
• How EV corridors of the State are publicized, marketed, and managed.
• Whether the State establishes an EV adoption / EV charging infrastructure goal.
• How the State leads-by-example in terms of its motor fleet EV purchases.
• The State’s position on allowing private power supply for EV charging at public facilities.
• How the State manages and assesses its impacts to the electric power grid and the GHG roadmap.
Education, Data, and Tools
Recommendation #EE 32:
Increase energy efficiency education and career awareness in K–12 and Community Colleges.
Curate and produce a series of EE “toolkits” containing sector-specific EE education and
outreach material, scripts, presentations, and activities that would reside on one portal website
with links to other materials as appropriate. In partnership with ApprenticeshipNC, create an EE
apprenticeship program to include apprenticeships and pre-apprenticeships for NC workers with
industry partners and organizations, and “career awareness” programs in K–12 settings.
Recommendation #EE 33:
Establish an online data repository for energy efficiency metrics including energy use, energy
savings and types of EE measures implemented. Present information in an online database that
enables users to download aggregated energy use and savings data. After demonstrating the
utility of the database in tracking progress across the state, expand it to include voluntary
reporting from new entities.
The Council is aware of the docket opened by the North Carolina Utilities Commission (NCUC)
to consider the subject of electronic data transfer and customer access to data usage. The
Council intends to monitor the progress of these discussions, and the extent to which measures
adopted by the Commission support increased energy efficiency achievable by utility customers.
Statewide Policy and Planning
Recommendation #EE 34:
Support analysis of carbon-reduction and clean energy policies that best achieve statewide GHG
emission reductions, electricity affordability, and grid reliability. These policy designs should
consist of strategies such as accelerated coal retirements, market-based carbon reduction
programs, clean energy policies, such as an updated REPS, clean energy standard, and Energy
Efficiency Resources Standard (EERS) or a combination of these strategies.
26 | E P C B i e n n i a l R e p o r t 2 0 2 0
Recommendation #EE 35:
Establish minimum energy efficiency goals within the current REPS program. Beginning in
2021, the legislature should consider incorporating a 25 percent minimum, up to 40 percent
maximum EE contribution to the REPS goal for investor owned utilities, subject to cost-
effectiveness screens.
Recommendation #EE 36:
Evaluate the creation of a NC Clean Energy Fund to issue loans, provide credit enhancements,
and invest in clean energy and EE projects, to the benefit of NC businesses, congregations,
nonprofits, and consumers.
Recommendation #EE 37:
NCUC should commence a study on EE cost-effectiveness testing and select a consultant to
analyze opportunities to improve EE program participation using current or new cost-
effectiveness testing regulations and protocols, including the National Standard Practice Manual
(NSPM). The study would include valuation of non-energy benefits in EE investments and
NCUC would develop methodology to calculate benefits to public health (via air and water
quality), economic development, environmental health (GHG emission reduction, air and water
quality), and increased property value and reduced tenant turnover for EE investments at the
utility scale and at the building level.

27 | E P C B i e n n i a l R e p o r t 2 0 2 0
3. Committee Updates
3.1 Energy Infrastructure Committee
Energy Resource Planning
North Carolina’s energy infrastructure includes systems for electric power generation,
transmission and distribution, and fuel distribution. The State depends on this infrastructure for
its commerce and the support of its citizens, and must assure that it is robust, reliable and
resilient both now and in the future. The infrastructure’s inter-dependencies require each system
to operate individually while supporting each other as a single unit similar to the fingers on one’s
hand.
The electric infrastructure generates energy from various sources (fossil fuel, nuclear and
renewables) and transports power through its grid throughout its system of transmission and
distribution lines. Electric utilities in North Carolina should continue to invest in their
generation, transmission, and distribution infrastructure in order to support future load and
economic growth in the State, while providing the highest levels of reliability and customer
service in a safe, cost effective manner.
Since infrastructure is vital to a clean energy transformation, North Carolina’s legislative and
regulatory bodies should enact legislation, policies, and rules that support investments in
maintaining electric utility’s reliability, resilience and affordability. For example, the retirement
of coal units will require investment in both replacement generation and transmission and
distribution infrastructure to integrate higher percentages of distributed energy resources (solar,
wind, energy storage) and to prevent line congestion. Distribution grid upgrades are necessary to
leverage behind-the-meter energy technologies such as home battery storage and electric
vehicles. Policies must explicitly incent grid upgrades and address barriers to transmission
expansion.
Electric utilities in North Carolina should continue to further reduce CO2 emissions and adjust to
evolving and innovative technologies in a way that properly reflects reliability and affordability
of electric service. Policies must ensure that energy remains reliable and affordable for
customers, and that all North Carolinians will benefit from the energy transformation. Energy
reliability is vital to the state’s economic health and growth. As the energy system is
transformed, state policy should ensure that reliability is not compromised. The pace and cost of
energy transformation must not leave anyone behind or disadvantage low-income households
who spend a larger percentage of their income on energy bills. The state should develop policies
that achieve emissions reductions in a cost-effective and equitable manner.
Furthermore, using legislations adopted in Tennessee and Arizona as examples, local
governmental entities should not ban customer energy choices. The North Carolina General
Assembly should not allow local governmental entities to make such decisions, thereby
depriving citizens of the ability to select their energy source. Integrated planning conducted in
28 | E P C B i e n n i a l R e p o r t 2 0 2 0
the best interest of all North Carolina consumers cannot be optimally accomplished in a
fractured, uncoordinated basis that varies by county or municipality. The Tennessee statute
includes the following directive: “A political subdivision of this state shall not adopt a policy
that prohibits, or has the effect of prohibiting, the connection or reconnection of a utility service
based upon the type or source of energy to be delivered to an individual customer.”
Bioenergy Resources Related to Biogas/Biomethane/Renewable Natural Gas
Production
North Carolina possesses significant bioenergy production potential, arguably the greatest of
which is its biogas production capacity. Biogas, also referred to as biomethane, is produced
during the breakdown of organic waste in oxygen-starved environments. The biogas released
during this process is comprised of a mixture of approximately 60% methane and 40% carbon
dioxide, which can be used to power small engines capable of running on raw biogas to produce
electricity or can be refined into renewable natural gas (RNG), which can be used
interchangeably with, and as a renewable substitute for, fossil-derived natural gas.
Biogas is particularly important for controlling greenhouse gas (GHG) emissions and meeting
carbon reduction goals because its capture avoids the release of GHGs that would otherwise
occur during the breakdown of organic waste and other organic matter. Its use as a substitute for
natural gas helps to avoid emissions associated with conventional natural gas use, typically
supplied by hydraulic fracturing or fracking methods. Hence, if better utilized, biogas can help
North Carolina meet greenhouse gas emission reduction goals while relying on an in-state
renewable energy resource.
A. Continue and advance the evaluation and quantification of economic and
environmental benefits related to the capture and commercial use of biogas.
The use of bioenergy (biomass15, biofuels16, and biogas17) in North Carolina represents a real and
consequential opportunity for the state to convert existing under-valued or low-value organic
resources into increased economic prosperity for rural areas. North Carolina consumes about
2.6% of the total energy consumed in the nation, ranking 12th within the residential, commercial,
industrial, and transportation sectors. The state relies heavily on imported fuel and energy
sources; 74% of the state’s annual consumption is imported.18 The use of biogas will also reduce
our State’s reliance on conventional fossil-derived fuels, which at present must all be purchased
15 Biomass is derived from plant-based materials such as crop wastes, purpose-grown grasses and woody energy crops, poultry
litter, and forestry residues.
16 Biofuels refers to bio-alcohols, such as ethanol, derived from the fermentation of crops rich in sugars and starches, biodiesel,
derived from oil-producing crops, or bio-oils, derived from pyrolysis of woody biomass. Liquid biofuels are commonly used in
place of, or blended with existing liquid petroleum fuels, such as gasoline and diesel.
17 Biogas, sometimes referred to as biomethane, which can be purified to renewable natural gas (“RNG”), is a fuel in a gaseous
form typically derived from the anaerobic digestion of organics, most commonly waste organics.
18 U.S. States Profiles and Energy Estimates, U.S. Energy Information Administration, 2017. Retrieved from
https://www.eia.gov/state/seds/data.php?incfile=/state/seds/sep_fuel/html/fuel_te.html&sid=US.

29 | E P C B i e n n i a l R e p o r t 2 0 2 0
from suppliers out of state, representing a large export of wealth from our State’s economy. A
reduction in North Carolina’s reliance on fossil-derived fuels will result in a reduction in the
carbon emissions associated with the state’s energy sector, as well as other constituents that
result from the combustion of fossil fuels.
The opportunities and benefits from increased incorporation of bioenergy, and particularly
biogas, into our State’s energy profile make it crucial for stakeholders and policy makers to
actively pursue its development and the policies necessary to support such development.
Continued evaluation and quantification of environmental benefits related to the capture and
commercial use of biogas should also be supported.19
Bioenergy derived from often undervalued and underutilized or wasted organic materials is
typically used to create heat and electricity via combustion, in manner similar to, but in place of,
conventional fossil-derived fuels, such as coal and geologically-derived natural gas. Waste
organics typically include such materials as animal manures, poultry litter, food waste, forestry
harvesting residues, crop residues, and biosolids created at municipal wastewater treatment
facilities. Under typical conditions and management practices, these organic materials naturally
decompose, releasing biogas or biomethane, which is comprised of methane and carbon dioxide,
into the atmosphere. Emissions from the natural decomposition of organics represents a
substantial source of North Carolina’s total carbon emissions.
Capturing and repurposing biomethane naturally emitted from the decomposition of wasted or
underutilized organic resources to satisfy current and future energy needs provides (1) a
reduction in the existing carbon emissions from the natural decomposition of these wastes, and
(2) a reduction in carbon emissions through the displacement of conventional energy fuels, like
coal and geologic natural gas, when used as a replacement fuel. An added advantage of biogas
development is that income from biogas sales may help to offset the cost of further
improvements to waste management systems. Considering that the state has the capacity to
produce 105 billion cubic feet per year (63 trillion Btu/year)20 of biogas, and the follow-on
economic and environmental benefits of biogas development, it is important for biogas potential
to be properly represented in the state’s energy and greenhouse gas emission reduction plans.
19 Stakeholders have expressed concerns over air and water pollution from swine operations’ use of biogas technologies that rely
on lagoons and sprayfield waste management systems. Pollution to waterways, odors, and public health concerns for nearby and
downstream communities, including those felt disproportionately by minority populations, are the reasons for opposition to
biogas production from swine operations. Anaerobic digesters with methane capture coupled with energy recovery is an effective
management system that allows additional add-on treatment systems to further reduce pollutants of concern to local communities.
Management systems and add-on treatment technologies to address nutrient loading, odor, and pathogens that reduce methane
emissions and risks to nearby ecosystems and communities should be supported with (1) demonstration projects, (2) dedicated
funding mechanisms to enable farms to add any necessary technologies, (3) appropriate policy mechanisms, and (4) meaningful
involvement of affected community on matters related to equity, biogas production and transport of waste and biogas.
20 East Carolina University Biogas Inventory Assessment, 2020.
30 | E P C B i e n n i a l R e p o r t 2 0 2 0
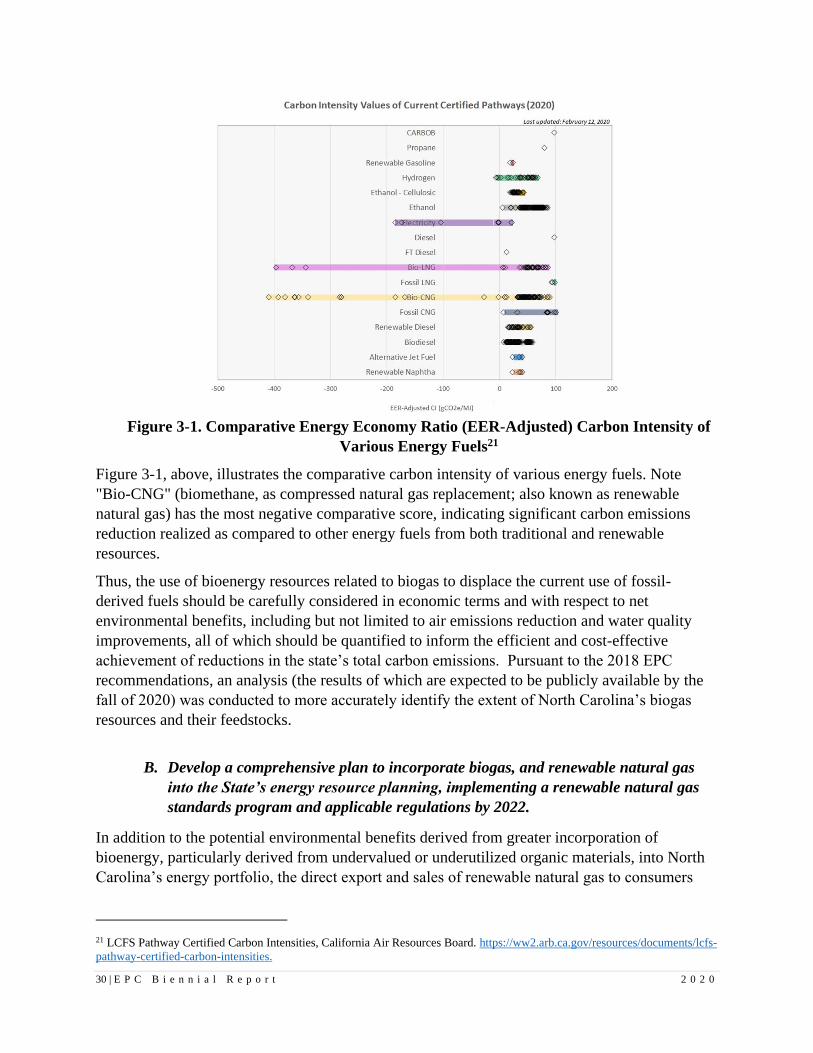
Figure 3-1. Comparative Energy Economy Ratio (EER-Adjusted) Carbon Intensity of
Various Energy Fuels21
Figure 3-1, above, illustrates the comparative carbon intensity of various energy fuels. Note
"Bio-CNG" (biomethane, as compressed natural gas replacement; also known as renewable
natural gas) has the most negative comparative score, indicating significant carbon emissions
reduction realized as compared to other energy fuels from both traditional and renewable
resources.
Thus, the use of bioenergy resources related to biogas to displace the current use of fossil-
derived fuels should be carefully considered in economic terms and with respect to net
environmental benefits, including but not limited to air emissions reduction and water quality
improvements, all of which should be quantified to inform the efficient and cost-effective
achievement of reductions in the state’s total carbon emissions. Pursuant to the 2018 EPC
recommendations, an analysis (the results of which are expected to be publicly available by the
fall of 2020) was conducted to more accurately identify the extent of North Carolina’s biogas
resources and their feedstocks.
B. Develop a comprehensive plan to incorporate biogas, and renewable natural gas
into the State’s energy resource planning, implementing a renewable natural gas
standards program and applicable regulations by 2022.
In addition to the potential environmental benefits derived from greater incorporation of
bioenergy, particularly derived from undervalued or underutilized organic materials, into North
Carolina’s energy portfolio, the direct export and sales of renewable natural gas to consumers
21 LCFS Pathway Certified Carbon Intensities, California Air Resources Board. https://ww2.arb.ca.gov/resources/documents/lcfs-
pathway-certified-carbon-intensities.
31 | E P C B i e n n i a l R e p o r t 2 0 2 0
across the U.S. has the potential to stimulate economic gain for North Carolina. As companies,
businesses and nonprofit institutions strive to improve their corporate sustainability programs in
response to growing consumer demands for improved sustainability and climate neutrality, North
Carolina is well-positioned to provide bioenergy resources in the form of biogas and renewable
natural gas in particular to aid those entities in meeting such goals.
Consumer sustainability demands are already guiding programs for many of North Carolina’s
manufacturers and suppliers of consumer goods, who are turning to both the utilities that serve
them and open markets for additional sources of renewable energy to fuel their operations.
Many manufacturers, processors, and suppliers need renewable fuels to generate heat in addition
to electricity, and therefore, have thermal energy needs that cannot be addressed through utility-
scale solar and wind turbines. Additionally, renewable natural gas provides an alternative to
imported natural gas that is subject to volatility in gas prices and interstate infrastructure capacity
limitations.
Increased development of North Carolina’s biogas resources also can provide our existing
manufacturers (particularly in rural parts of the state) with renewable fuels to sustain their ability
to meet customer demands, attract new businesses seeking such resources, and provide for the
export and sale of renewable energy to other states and their customers. Currently, North
Carolina purchases all22 conventional energy fuels from out of state suppliers. A few facilities in
North Carolina are currently producing renewable electricity by combusting bioenergy-derived
resources: CPI USA Southport, 85 MW; Craven County Wood Energy New Bern, 50 MW;
Capital Power Corp. Roxboro, 67.5 MW), and two renewable natural gas facilities (i.e., Optima
KV and Optima, TH) are in operation. It is worth noting that a few additional projects (i.e., C2e
Renewables NC, BF Grady Road RNG, Upper Piedmont Renewables, Catawba Biogas RNG
(which uses poultry litter), Union County Green Energy and Wilson County Green Energy RNG
projects, NCRP-Lumberton 22 MW capacity) are in the planning stages at the time of the writing
of this report. The Loyd Ray Farms system, a project between Duke University and Duke
Energy, has been collecting biogas in an anaerobic digester since 2011, which is used to power
an on-farm 65 KW microturbine while Butler Farms has been generating electricity to power an
180 KW on-farm gen-set.
In response to such market demands by businesses and manufacturers, several states in the U.S.
have either proposed or adopted laws to support the expansion of their state’s renewable natural
gas production and transmission capabilities, include biogas in their state renewable energy
plans, or have approved or are considering requests from state natural gas utilities to interconnect
RNG and/or offer RNG products to their customers. As an example, Table 3-1 below offers a
list of states who are leading on renewable natural gas development and the corresponding
standards, programs and/or proposals relevant to each.
22 U.S. Energy Information Administration. (2019) North Carolina State Profile Analysis. Retrieved from
https://www.eia.gov/state/analysis.php?sid=NC

32 | E P C B i e n n i a l R e p o r t 2 0 2 0
Table 3-1. State RNG Development-Related Efforts23
NV NV PUC required to adopt regulations allowing public utility resale purchasers of natural
gas to purchase RNG and recover reasonable costs associated with RNG acquisition.
CO Introduced SB 20-150 to implement cost recovery for expansion of infrastructure
supporting “the further incorporation of RNG”, plus requirement to include RNG targets.
VT
VT PUC approved an RNG program in 2017;24 Vermont includes Farm, Non-Farm and
Landfill-generated biogas in its Comprehensive Energy Plan and supports incentives for
farm-derived biogas, incl. Green Mountain Power’s Cow Power program, Vermont’s
Clean Energy Development Fund, plus USDA programs; in 2010, the Vermont legislature
allowed existing farm methane projects into the Standard Offer program and released all
farm methane projects from the Standard Offer’s kW capacity cap.25
ME
Maine’s REPS (M.R.S. 35-A §3210) recognizes “anaerobic digestion of by-products of
waste from animals or agricultural crops, food or vegetative material, algae or organic
refuse” as a “renewable capacity resource” and compliance instrument.
WA
HB 2580 encourages RNG expansion through tax incentives and an inventory of potential
RNG supply and associated costs, voluntary gas quality standards for injecting RNG into
the natural gas system, and additional measures to promote RNG use.26
OR
SB 98, a RNG portfolio standard, requires new portfolio targets for RNG by OR’s natural
gas utilities and directs OR PUC to create cost recovery mechanisms for recovery of
RNG-related investments; RNG targets set from 5% in 2020-24 to 30% by 2045-50.27
OK HB3970 introduced in OK State Legislature early 2020 that directs state PUC to
promulgate rules for incremental goals for increasing RNG in overall gas supply.28
CA Implemented various regulations to include RNG as part of a broader GHG reduction
strategy, incl. Low Carbon Fuel Standard (LCFS) and GHG cap-and-trade program.29
CT
Bill introduced in 2018 to “define RNG, create a renewable portfolio standard and
procurement process for RNG, to require the Public Utilities Regulatory Authority to
establish a quality standard for RNG and to require the procurement of electricity
generated from a biomass facility by electric distribution companies.”
NY Northeast Gas Assn and GTI issued an RNG Interconnect Guide for NY in Aug. 2019 30
23 In addition, Michigan’s PUC has approved a DTE program to sell RNG offsets.
24 Vermont Gas Systems, Inc.; the PUC and Vermont’s Department of Public Service must assess VGS’ RNG program annually,
with a comprehensive review of its effectiveness every 3 years “to ensure appropriate progress toward Vermont’s Comprehensive
Energy Plan goal of meeting 90% of Vermont’s energy needs via renewables. See https://vtdigger.org/2017/09/07/vermont-
public-utility-commission-approves-renewable-natural-gas-program-vermont-gas-customers/.
25 See VT Comprehensive Energy Plan 2016 at 369, available at
https://outside.vermont.gov/sov/webservices/Shared%20Documents/2016CEP_Final.pdf.
26 https://www.ngvamerica.org/2018/03/22/washington-gov-jay-inslee-signs-renewable-natural-gas-bill-law/.
27 https://www.natlawreview.com/article/oregon-adopts-renewable-natural-gas-portfolio-standards.
28 http://www.oklegislature.gov/BillInfo.aspx?Bill=hb3970&Session=2000.
29 https://www.mjbradley.com/sites/default/files/MJB%26A_RNG_Final.pdf.
30 https://www.northeastgas.org/pdf/nga_gti_interconnect_0919.pdf.

33 | E P C B i e n n i a l R e p o r t 2 0 2 0
MN MN PUC considering interconnection request from CenterPoint Energy to accept
Minnesota-produced RNG into its distribution system.31
Given North Carolina’s substantial and yet-to-be developed renewable natural gas resources,
North Carolina should adopt similar supportive measures to promote the efficient and beneficial
use of its renewable biogas resources and promote the economic gains and other benefits
afforded to North Carolina businesses and communities through increased biogas resource
development.
Recommendations in support of the development of a comprehensive and implementable plan
for biogas utilization should include: Evaluation of the costs and benefits of establishing
renewable natural gas goals, requirements necessary for incorporation of such goals into local
distribution companies (“gas utilities”) service offerings, and options for cost recovery by gas
utilities for reasonable expenditures associated with any necessary infrastructure improvements
and/or costs associated with incorporating and procuring renewable natural gas derived from in-
state resources.
C. Expand evaluation and development of biogas resource utilization to include the
diversion of food waste and other organics from landfills and beneficial use of
biogas generated by municipal wastewater treatment plants.
The EPA Landfill Methane Outreach Program (LMOP) lists 123 active landfills serving North
Carolina, with 31 active landfill gas systems and 11 candidate landfills. LMOP estimates that
more than 84 MW of electricity-generating potential is being utilized from landfills in North
Carolina. Three of the North Carolina landfills are designated to produce renewable natural
gas32, six are designated to provide landfill gas directly to a consumer for heat or off-grid use,
and the remaining 22 are producing electricity. All other landfills without a current or planned
landfill gas utilization project represent great opportunity for further development of bioenergy
resources within North Carolina.
As all of these landfills generate methane, the collection and use of landfill gas to generate
energy results in environmental benefits as well as emissions of carbon greenhouse gases,
especially for those landfills currently emitting gas to the atmosphere or which simply flare their
landfill gas. Capturing and reusing landfill gas in this manner reduces emissions of methane (a
potent greenhouse gas), non-methane volatile organic compounds regulated by the U.S. EPA,
and leachate production. The biogas potential from all open landfills in the state is estimated to
be ~12 billion cubic feet/year.
31 https://www.brainerddispatch.com/business/energy-and-mining/6273802-CenterPoint-proposes-renewable-natural-gas-service-
in-Minnesota.
32 At least two (2) additional landfill gas to pipeline renewable natural gas projects have been approved for interconnection
through the North Carolina Utilities Commission but are yet to be constructed.
34 | E P C B i e n n i a l R e p o r t 2 0 2 0
In addition to harvesting the landfill gas that is presently being produced from the state’s
landfills, which will likely yield appreciable biogas for thirty years, systems and programs
should be implemented to separate organic waste from other solid waste materials prior to
landfilling. Once separated, the organic waste should be redirected to anaerobic digesters.
Materials could be redirected to existing municipal wastewater plants or to merchant digesters,
such as the BioGas Corp food waste digester in Charlotte, North Carolina.
The U.S. EPA estimates, on average, that organic waste removal and recycling via energy
harvesting digester systems can reduce the amount of waste landfilled each year by 20% to 40%
(by volume). By reducing landfill inputs, the life of existing landfills can be appreciably
extended, as space once used to accept organic wastes can be reserved for disposal of non-
recyclable and/or inorganic wastes. Such an approach leverages existing assets in our State,
defers the costly process of siting, permitting, and constructing new landfills by extending the
life of the landfill, and protects land from development – all while supplying renewable and
reliable energy fuels for use in the State. Five states – namely, California, Connecticut,
Massachusetts, Rhode Island, and Vermont – have adopted laws to require producers of organic
food wastes of a certain amount and greater (typically, 1 ton per week or more) to divert those
organics to an alternate management facility instead of a landfill.33 In these states, several
merchant digester facilities have been constructed, providing biogas for electricity generation
and increasing landfill life in those states.
North Carolina has already recognized the value of organics diversion through previous
enactment of a ban on landfilling yard debris. An analysis of organic waste from the top eight
industrial food production sectors has suggested that more than 850,000 tons per year of
industrial food waste including fats, oils and grease (FOG) could be available for anaerobic
digestion in the state. Biogas production from these industrial sectors could be a promising and
impactful start for a food diversion program.
Given the environmental and economic benefits related to the increased incorporation of
bioenergy – and namely biogas – resources from landfills into the state’s energy profile and
considering existing landfill biogas resource potential, North Carolina is well positioned to
realize diverse economic gains and environmental benefits through the diversion of food waste
and organics from landfills.
D. Develop support programs, such as grant and loan programs, to aid North
Carolina’s smaller municipalities and smaller farming operations in implementing
33 E. Broad Leib, K. Sandson, L. Macaluso and C. Mansell, BioCycle Connect, “Organic Waste Bans and Recycling Laws to
Tackle Food Waste”, Sept. 2018 at https://www.biocycle.net/2018/09/11/organic-waste-bans-recycling-laws-tackle-food-waste/.
In addition, at least six municipalities across the U.S. have enacted similar food diversion requirements, including Austin, TX;
Boulder, CO; New York City; San Francisco, CA; Seattle, WA; and Portland, OR. Id.; see also Harvard Law School Food Law
& Policy Clinic and Center for EcoTechnology, Bans and Beyond: Designing and Implementing Organic Waste Bans and
Mandatory Organics Recycling Laws, July 2019 at https://www.chlpi.org/wp-content/uploads/2013/12/Organic-Waste-
Bans_FINAL-compressed.pdf.
35 | E P C B i e n n i a l R e p o r t 2 0 2 0
systems and processes to produce renewable natural gas from organic wastes for
the 2022 plan.
While North Carolina has rich bioenergy resources with respect to biogas, those resources are
widely distributed across the state from feedstocks produced on small farms, small communities
and towns, food producers and processors, and other facilities that manage organics, such as
wastewater treatment plants. Often, the costs associated with utility interconnection are among
the greatest barriers to market participation, aside from the economies of scale that help larger
projects justify investments in biogas generating technology and equipment. To address these
barriers, North Carolina should explore and develop grant and loan programs to support market
participation by smaller contributors who, collectively, provide the greater pool of biogas
resources available to the state.
E. Examine existing General Statutes, Rules, and Policies regarding, affecting, and/or
creating barriers to the use of bioenergy resources.
Many of the current policies, rules, and regulations regarding the combustion of energy fuels
were adopted by the State over forty years ago, at a time when little thought was given to
managing the carbon emissions associated with the use of fossil fuels, while the potential use of
bioenergy resources, including but not limited to biogas, for supplying our state’s energy needs
was altogether overlooked. As such, many of the state’s environmental policies and regulations
were created to manage emissions from fossil-derived fuels, and may be inequitable, if not
inapplicable, relative to the use of bioenergy fuels stemming from our state’s rich biogas
resources. As our state currently imports all fossil fuels from out of state suppliers, we import a
significant amount of emission-creating materials. To support our current needs and to support a
growing population and manufacturing sector, we continue to invest in expensive infrastructure
projects to bring in out-of-state energy resources to serve our in-state markets.
Alternately, repurposing North Carolina’s undervalued or wasted organic resources diversifies
our energy portfolio, reduces reliance on out-of-state suppliers, and reduces existing in-state
emissions, as well as displaces the use of imported fossil fuels which, in turn, further reduces the
state’s emissions. As such, the policies, rules, and regulations that govern or impact the use of
the state’s bioenergy resources, and specifically its biogas and renewable natural gas resources,
should be examined for consistency with the intent and benefits of using this rich in-state
resource. This examination should identify policy and regulatory changes that should be enacted
by 2022 capable of fully supporting the development of North Carolina’s biogas resources.
Clean Energy
North Carolina should invest in the State’s carbon-free future. 2019 was the second hottest year
on record, second only to 2016, which was the hottest on record. Even more alarming, the five
hottest years on record have all occurred in the last five years.34 In 2018, the Intergovernmental
Panel on Climate Change (IPCC) reported that we only have until 2030 to make drastic changes
34 Copernicus: https://climate.copernicus.eu/copernicus-2019-was-second-warmest-year-and-last-five-years-were-warmest-record
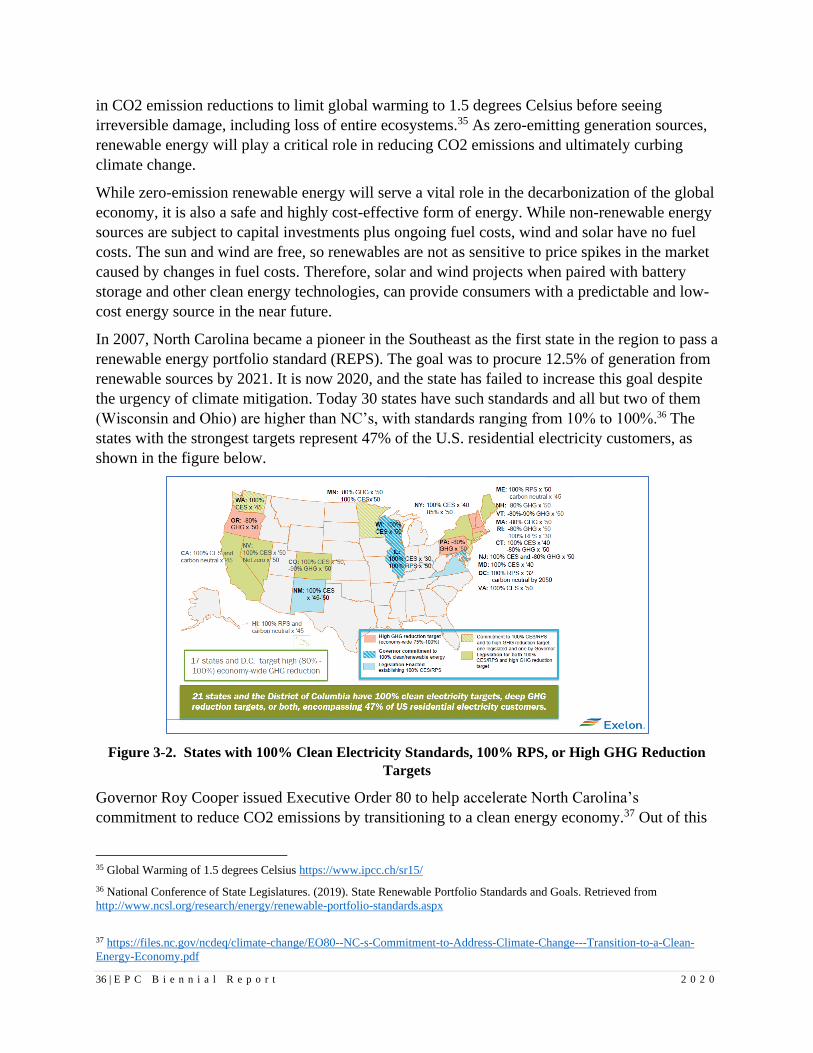
36 | E P C B i e n n i a l R e p o r t 2 0 2 0
in CO2 emission reductions to limit global warming to 1.5 degrees Celsius before seeing
irreversible damage, including loss of entire ecosystems.35 As zero-emitting generation sources,
renewable energy will play a critical role in reducing CO2 emissions and ultimately curbing
climate change.
While zero-emission renewable energy will serve a vital role in the decarbonization of the global
economy, it is also a safe and highly cost-effective form of energy. While non-renewable energy
sources are subject to capital investments plus ongoing fuel costs, wind and solar have no fuel
costs. The sun and wind are free, so renewables are not as sensitive to price spikes in the market
caused by changes in fuel costs. Therefore, solar and wind projects when paired with battery
storage and other clean energy technologies, can provide consumers with a predictable and low-
cost energy source in the near future.
In 2007, North Carolina became a pioneer in the Southeast as the first state in the region to pass a
renewable energy portfolio standard (REPS). The goal was to procure 12.5% of generation from
renewable sources by 2021. It is now 2020, and the state has failed to increase this goal despite
the urgency of climate mitigation. Today 30 states have such standards and all but two of them
(Wisconsin and Ohio) are higher than NC’s, with standards ranging from 10% to 100%.36 The
states with the strongest targets represent 47% of the U.S. residential electricity customers, as
shown in the figure below.
Figure 3-2. States with 100% Clean Electricity Standards, 100% RPS, or High GHG Reduction
Targets
Governor Roy Cooper issued Executive Order 80 to help accelerate North Carolina’s
commitment to reduce CO2 emissions by transitioning to a clean energy economy.37 Out of this
35 Global Warming of 1.5 degrees Celsius https://www.ipcc.ch/sr15/
36 National Conference of State Legislatures. (2019). State Renewable Portfolio Standards and Goals. Retrieved from
http://www.ncsl.org/research/energy/renewable-portfolio-standards.aspx
37 https://files.nc.gov/ncdeq/climate-change/EO80--NC-s-Commitment-to-Address-Climate-Change---Transition-to-a-Clean-
Energy-Economy.pdf

37 | E P C B i e n n i a l R e p o r t 2 0 2 0
Executive Order, the Department of Environmental Quality convened a robust stakeholder
process in 2019 to develop a comprehensive Clean Energy Plan for North Carolina. A critical
component of the plan, and the greater goal of climate change mitigation, is to initiate a rapid
deployment of renewable energy resources.
Due to strong solar resource, a renewable energy portfolio standard, and an attractive PURPA
market, North Carolina currently ranks 2nd in installed solar generating capacity in the country
with over 6GW installed.38 North Carolina’s solar industry has created 42,000 jobs and over $14
billion of revenue, with the majority of those investments in rural communities.39
Not only is solar a carbon-free resource, but it is also cost effective. According to Lazard,
onshore wind and utility-scale solar are two of the lowest-cost sources of energy with a levelized
cost of $28MWh and $36MWh respectively.40 The cost of solar is continuing to decline so
rapidly that according to Wood Mackenzie Senior Solar Analyst, Tom Heggarty, by 2023 solar
will be ‘cheaper than natural gas in almost everywhere in the world’.41 Also, combining utility-
scale solar with storage will continue to reduce costs while providing round the clock power.
Although a much more nascent industry in North Carolina, onshore wind also provides cheap
carbon-free energy. Despite a strong wind resource along the coast, North Carolina only has one
utility-scale onshore wind farm which is located in Perquimans and Pasquotank Counties. Just
over 200MW, the Amazon wind farm provides $1M to the local economy annually and will
provide almost $400M of total investment into this rural community.42 Similar to solar,
combining this carbon-free resource with storage can provide the state with cheap round the
clock power.
Despite strong solar and wind resources, North Carolina is coming to the end of its existing
REPS goal, and in 2017 North Carolina’s PURPA model was significantly changed in HB589
creating a less attractive PURPA market.
Therefore, without a strong clean energy strategy, North Carolina will begin to lose its coveted
position as a renewable energy leader in the South, and certainly in the United States. In the last
year alone, nine states have passed 100% clean energy standards including our neighbor to the
north, Virginia. Virginia passed a bill this session requiring the state to obtain 100% of its energy
from carbon-free sources by 2050.43 100% clean energy legislation would provide North
Carolina with: (1) the least expensive generation mix, as the cost of renewables has quickly
surpassed non-renewable forms of energy, like natural gas and coal, in levelized cost; (2) a
source of significant job and economic growth, per a recent DOE study found that wind turbine
technician is “the single fastest growing occupation in America” and that in 2016, “one out of
38 https://energync.org/clean-energy-numbers/ 39 https://energync.org/clean-energy-numbers/ 40 https://www.lazard.com/perspective/lcoe2019 41 https://www.greentechmedia.com/articles/read/solar-plants-cheaper-than-natural-gas-just-about-everywhere-by-2023-
woodmac 42 https://www.power-grid.com/2017/02/09/amazon-wind-farm-us-east-completed-in-north-carolina/#gref 43 https://lis.virginia.gov/cgi-bin/legp604.exe?201+sum+SB851

38 | E P C B i e n n i a l R e p o r t 2 0 2 0
every 50 new jobs created nationally came from solar”44; and (3) a leading position in the fight to
protect our coastlines and our entire way of life from the threat posed by climate change.
3.2 Energy Assurance Committee
According to the American Society of Civil Engineers’ (ASCE) 2017 Infrastructure Report
Card, North Carolina’s overall energy infrastructure is rated as “good” with a B+ score. ASCE
identified NC’s strengths in energy source: affordability, diversity and reliability. It stated that
North Carolina’s energy infrastructure’s foundation is able to support current and long-range (20
year) planning needs.45
Electric Power Grid Infrastructure
The North Carolina Transmission Planning Collaborative (NCTPC) was established to:
• Provide participants Duke Energy Carolinas (DEC), Duke Energy Progress (DEP), North
Carolina Electric Membership Corporation, and ElectriCities of North Carolina and other
stakeholders an opportunity to participate in the electric transmission planning process for the
areas of NC and SC served by the Participants;
• Preserve the integrity of the current reliability and least-cost planning processes;
• Expand the transmission planning process to include analysis of increasing transmission
access to supply resources inside and outside the Balancing Authority Areas (BAAs) of DEC
and DEP; and
• Develop a single coordinated transmission plan for the Participants that includes Reliability
and Local Economic Study Transmission Planning while appropriately balancing costs,
benefits and risks associated with the use of transmission and generation resources.
In its January 6, 2020 “Report on the NCTPC 2019-2029 Collaborative Transmission Plan”, the
NCTPC stated that “reliability study results affirmed that the planned DEC and DEP
transmission projects identified in the 2018 Plan continue to satisfactorily address the reliability
concerns identified in the 2019 Study for the near-term (5 year) and the long-term (10 year)
planning horizons.” Performed annually, the overall NCTPC process includes the Reliability
Planning and Local Economic Study Planning Processes, which are intended to be concurrent
and iterative. The overall process is designed to include considerable feedback and iteration
between the two processes as each effort’s solution alternatives affect the other’s solutions.46
44 https://www.energy.gov/eere/articles/5-fastest-growing-jobs-clean-energy 45 American Society of Civil Engineers’ (ASCE) 2017 Infrastructure Report Card. Retrieved February 5, 2020 from
https://www.infrastructurereportcard.org/state-item/north-carolina/ ] 46 North Carolina Transmission Planning Collaborative (NCTPC). Report on the NCTPC 2019-2029 Collaborative Transmission
Plan. 2020. Retrieved on February 6, 2020 from http://www.nctpc.org/nctpc/document/REF/2020-01-22/2019-
2029_NCTPC_Report_1_22_2020_FINAL.pdf

39 | E P C B i e n n i a l R e p o r t 2 0 2 0
Natural Gas and Petroleum Pipeline Infrastructure
North Carolina’s natural gas infrastructure, according to ASCE’s 2017 report, “is almost entirely
dependent on Transco Gas Pipeline for its natural gas requirements.”47 This single-source
delivery system has been cited as a reason for these active or proposed natural gas pipelines:
• The Atlantic Coast Pipeline, proposed in 2014 by Dominion Energy and Duke
Energy, was a 605-mile underground transmission pipeline planned to transport
natural gas from West Virginia to Virginia and eastern North Carolina locations,
ending in Robeson County, NC.48 Many federal and state permitting challenges
delayed the project. On June 15, 2020, the US Supreme Court ruled in favor of the
new pipeline regarding permitting to cross the Appalachian Trail. 49,50 However, on
July 5, 2020, Dominion Energy and Duke Energy announced the cancelation of the
Atlantic Coast Pipeline due to ongoing delays and increasing cost uncertainty that put
the project's economic viability into question.
• The Mountain Valley Pipeline Southgate project received Federal Energy Regulatory
Commission’s (FERC) order granting a Certificate of Public Convenience and
Necessity in 2017 and applied in 2018 to FERC for authorization to build the project.
The Southgate project consists of approximately 75.1 miles of natural gas pipeline
and associated aboveground facilities in Pittsylvania County, Virginia, and
Rockingham and Alamance Counties, North Carolina.51 On June 18, 2020, FERC
issued an order to construct and operate the 75.1 miles of natural gas pipeline. The
Southgate Project is designed to provide up to 375,000 dekatherms (Dth) per day of
firm transportation service.
• The Atlantic Sunrise Project, owned by Williams Transco, became operational in
October of 2018. It increased the pipeline capacity by about 12% and extended the
bi-directional flow coming directly from Marcellus natural gas supplies as far as
south as Alabama. According to NCUC’s Public Staff, no NC gas or electric utilities
are subscribers. Much of the capacity from both Mountain Valley and Atlantic
Sunrise is subscribed to by marketers and could (directly or indirectly) impact
availability and price for natural gas in North Carolina.52
North Carolina receives petroleum from the Colonial Pipeline and the Plantation Pipeline. The
two pipelines deliver refined products (gasoline, diesel fuel, kerosene, etc.) from the Gulf Coast
at several locations in the state and then to terminals in the Northeast. The Dixie Pipeline, which
supplies propane from refineries along the Gulf coast, serves NC and seven other southeastern
47 ASCE, ibid. [retrieved February 5, 2020 from https://www.infrastructurereportcard.org/state-item/north-carolina/ 48 Atlantic Coast Pipeline, 2020. Retrieved June 26, 2020 from https://atlanticcoastpipeline.com/default.aspx ] 49 Atlantic Coast Pipeline, 2020. Retrieved June 26, 2020 from https://atlanticcoastpipeline.com/default.aspx ] 50 The Progressive Pulse, 2020. Retrieved June 29, 2020 from http://pulse.ncpolicywatch.org/2020/06/16/us-supreme-court-
hands-win-to-atlantic-coast-pipeline-but-other-hurdles-remain-for-project/ 51 Mountain Valley Pipeline Southgate. 2018. Retrieved February 5, 2020 from http://www.mvpsouthgate.com/wp-
content/uploads/2018/11/News-Release-MVPSG-Application-Filing-FINAL.pdf 52 Atlantic Sunrise Project. 2018. Retrieved February 5, 2020 from https://www.williams.com/2018/10/06/atlantic-sunrise-
project-placed-into-full-service/
40 | E P C B i e n n i a l R e p o r t 2 0 2 0
states before terminating in Apex, NC, southwest of Raleigh. A small percentage of petroleum
products arrive at Port of Wilmington, NC. Over 80% of NC’s is consumed by the transportation
sector as motor gasoline and diesel fuel.53
Energy Assurance Issues and Challenges
Natural Gas and Petroleum Pipelines
Even though underground gas pipelines are shielded from most natural hazards, they may be
damaged or disrupted by weather-related events or caused by human errors that occur during
excavation. From 2017 to 2019, North Carolina had no significant gas transmission incidents
occur while only two significant gas distribution incidents occurred. 54 This low incident rate for
the State may be attributable (to some extent) to its continuing statewide promotion of the
national “811 Call Before You Dig” program. This federally designated call number raises
national awareness of underground utility (both gas and electric) line locations to prevent
accidents and disruptions.55
Electric Power
Since 2012, electric power generation has been North Carolina’s largest natural gas-consuming
sector, having increased from about 15% to 65% over the past ten years. In 2018, the electric
power sector used natural gas to generate about 33% its electricity. This one-third total surpassed
nuclear energy generation (at about 31%) for the first time ever, and outpaced coal-fired
generation of about 25%. The retirement of about 20 coal-fired units since 2011 and the addition
of almost 30 natural gas-fired plants since then has continued to drive-up North Carolina’s
demand for natural gas.56
A large majority of North Carolina’s electric power outages are weather-related, but the threat of
a human-caused physical (e.g., a high-altitude electromagnetic pulse-EMP) or cyber-attack
disruptions is expected to increase substantially. The North Carolina Energy Assurance Plan
contains contingency and emergency measures to protect the public from possible shortages of
energy.57 To address to the growing cyber-threat, the North American Electric Reliability
Corporation (NERC) designed GridEx, a biennial exercise to simulate a cyber/physical attack on
the electric grid and other critical infrastructures across North America. In November 2019,
NERC’s GridEx V (involving electric utilities, regional/Federal government agencies in law
enforcement, first responders, critical infrastructure partners, and supply chain stakeholders) was
53 U.S. Energy Information Administration (EIA), North Carolina State Energy Profile. 2020. Retrieved from
https://www.eia.gov/state/print.php?sid=NC
54 U.S. Department of Transportation, Pipeline and Hazardous Materials Safety Administration (PHMSA), Significant Incident
Consequences, https://portal.phmsa.dot.gov/analytics/saw.dll?Portalpages ]
55 811 "Call Before You Dig". 2020. Retrieved from , http://call811.com/
56 U.S. EIA, North Carolina State Energy Profile, 2019. Retrieved from https://www.eia.gov/state/?sid=NC
57 North Carolina Energy Office, North Carolina Energy Assurance Plan, 2019. Retrieved from
https://files.nc.gov/ncdeq/Energy%20Mineral%20and%20Land%20Resources/Energy/Energy%20Assurance%20Plan%202013.p
df

41 | E P C B i e n n i a l R e p o r t 2 0 2 0
successfully executed.58 Representatives of North Carolina’s Emergency Management Division
and Department of Environmental Quality’s State Energy Office participated in GridEx V.
An Electric Power Research Institute (EPRI) technical report presentation on its “High-Altitude
Electromagnetic Pulse (HEMP) and the Bulk Power System” to the June 12, 2019 NERC EMP
Task Force Meeting found potential HEMP impacts could disrupt or damage electric substation
electronics that may impact a large geographical area’s electrical connections. EPRI has now
initiated research/field trials on HEMP hardening with over 17 U.S. electric utilities and has
begun further assessment of HEMP on generation plants.59
3.3 Energy Efficiency Committee
Energy efficiency is a low-cost solution to reduce energy usage and emissions. It is a rapidly
growing field with creative new strategies implemented on a regular basis, resulting in many new
clean energy jobs in the State. Each incremental investment in energy efficiency provides
multiple benefits to consumers, including lower energy bills, increased grid reliability, and the
deferral of new generation, transmission and distribution infrastructure investments.
North Carolina has realized increasing annual incremental EE savings, exceeding 1,221 GWh in
2018.60 Currently, annual incremental EE savings from utility programs as a percentage of retail
sales for North Carolina is less than 1 percent, and there is potential for significant increase in
cost effective EE integration. Going forward, it will be vital for North Carolina to utilize new
energy efficiency policies, technologies, programs and strategies to reduce the state’s energy
usage, emissions, costs, and secure its energy independence. The NC Clean Energy Plan and the
Duke Nicholas Institute’s Energy Efficiency Roadmap provide guidance on EE measures that the
EE Committee should consider to pursue levelized demand, reduced pollution and achievement
of energy savings in our state’s economy and residents’ daily lives.
The EE Committee drew from these two plans to expand its recommendations in areas including:
• A diverse set of EE measures and policies that focus on areas such as: education, data,
technological innovation, building codes, etc.
• An emphasis on collaborative approaches such as working with ApprenticeshipNC to
launch an EE apprenticeship program for North Carolina workers with industry partners
and organizations, as well as enhancing existing collaborations with groups such as
utilities.
• Strategies that could improve energy efficiency programs and existing technologies to
reduce energy usage, especially in state-owned buildings.
58 North American Electric Reliability Corporation (NERC), GridEx V, 2019. Retrieved from
http://www.nerc.com/pa/CI/CIPOutreach/Pages/GridEX.aspx].
59 Electric Power Research Institute (EPRI), High-Altitude Electromagnetic Pulse (HEMP) and the Bulk Power System, 2019.
Retrieved from https://www.nerc.com/pa/Stand/EMPTaskForceDL/EPRI%206-12-19.pdf
60 North Carolina State Electricity Data, Energy Information Administration, Form EIA-861, “Annual Electric Power Industry
Report” for the years 2013–2018. Retrieved from https://www.eia.gov/electricity/data/eia861/

42 | E P C B i e n n i a l R e p o r t 2 0 2 0
• Recommendations to establish new ways to finance energy efficiency related projects,
programs, and activities such as creating a North Carolina -based Clean Energy Fund to
issue loans, provide credit enhancements, and invest in clean energy and EE projects, to
benefit North Carolina businesses, congregations, nonprofits, and consumers. It would
be established as an independent nonprofit organization to administer the program,
following examples in other states.
• Enact a statewide PACE program for commercial buildings to remove or greatly reduce
barriers to investing in EE or clean energy. PACE is already legislatively authorized in
North Carolina, but the state does not have any active programs due to: (1) local North
Carolina governments’ lack of familiarity with PACE financing, (2) lack of local
governments’ ability to delegate the administration and the financing mechanism of such
a program to a central third party, and (3) state-level approval required for all local debt.
The current legislation sunsets on July 1, 2020 for cities and towns is and July 1, 2022 for
counties.
• Support for new statewide carbon reduction and clean energy policies such as an EERS
standard.
The policy recommendations build upon existing goals, while also adding new ones that will
broaden the focus of energy efficiency in North Carolina and will require a mix of legislative,
administrative, regulatory, or non-policy action to achieve implementation.
Emission Reductions Due to EE Measures
As part of the annual report prepared by the NCUC pursuant to N.C.G.S. § 62-133.8(j), the DEQ
provides an environmental review of the implementation of the REPS program.61 This review
summarizes the level of air pollution avoided from EE certificates (EECs) issued for each year
using the North Carolina Renewable Energy Tracking System (NC RETS). 62 Table 3-1 shows the
number of EECs issued for each year from 2008 through 2019. In 2019, North Carolina issued
5,658,772 MWh of EECs, which reduced retail sales of electricity by approximately 4%. This is
the equivalent of a small coal utility power plant not operating.
61 Annual Reporting Regarding Renewable Energy and Energy Efficiency Portfolio Standard in North Carolina Required
Pursuant to N.C.G.S. 62-133.8(j), North Carolina Utilities Commission, October 1, 2018, Retrieved from
https://www.ncuc.net/reports/repsreport2018.pdf
62 North Carolina Renewable Energy Tracking System, http://www.ncrets.org/.

43 | E P C B i e n n i a l R e p o r t 2 0 2 0
Table 3-1. Energy Efficiency Certificates Issued and
Estimated Avoided Air Pollution Emissions
Year
EECs
Or Avoided
Generation
(MWh)
CO2
Not Emitted
(tons)
NOx
Not Emitted
(tons)
SO2
Not Emitted
(tons)
2008 22,907 13,696 10 46
2009 80,008 46,266 29 79
2010 504,289 297,798 212 481
2011 1,134,040 634,228 476 836
2012 1,288,141 680,137 537 671
2013 2,119,916 1,078,895 807 917
2014 2,722,860 1,333,839 937 937
2015 6,218,251 2,871,549 1,937 1,761
2016 4,069,988 1,765,237 1,136 906
2017 4,812,048 2,005,437 1,304 931
2018 5,572,279 2,227,719 1,466 917
2019 5,658,772 2,262,298 1,488 931
The data in Table 3-1 show the maximum reduction in air emissions due to EE savings achieved
through REPS. In 2019, EE measures avoided 1,488 tons of nitrogen oxide (NOx) emissions and
931 tons of sulfur dioxide (SO2) emissions from being emitted. The carbon dioxide (CO2)
emissions not released into the atmosphere due to EE measures is approximately 2.3 million tons,
which is 4.5% of the total CO2 emitted by power plants in North Carolina. This analysis shows
that EE measures resulting from the REPS are significantly decreasing air pollution emitted in
North Carolina and neighboring states.

44 | E P C B i e n n i a l R e p o r t 2 0 2 0
4. North Carolina’s Energy Profile
4.1 State Energy Statistics
Demographics63, 64
Population
Share of U.S.
State Ranking
Rural Population
2018
2018
2018
2010
10.4 million
3.2%
9th most populous
34% of state’s residents, largest in the U.S.
Economics65,66
Gross Domestic Product
Per Capita Personal Income
2018
2018
$566 billion (11th largest)
$45,834
Energy Consumption67, 68,
Total Energy Consumed
National Ranking
Amount Energy Imported
Total Consumption per Capita
2017 2,500 trillion Btu (2.6% of U.S. total)
12th highest
74%
244 million Btu
Residential = 649 trillion Btu
Commercial = 567 trillion Btu
Industrial = 562 trillion Btu
Transportation = 725 trillion Btu,
11th highest vehicle miles traveled
in U.S.
63 North Carolina Budget and Management, Facts and Figures. Retrieved from https://www.osbm.nc.gov/facts-figures 64 U.S. Census Bureau, 2010 Census (2010). 65 Steven Pennington, NC Annual Economic Report: Gross Domestic Product, NC Department of Commerce, November 4, 2019.
Retrieved from https://www.nccommerce.com/blog/2019/11/04/nc-annual-economic-report-gross-domestic-product 66 North Carolina Department of Commerce, Labor and Economic Analysis Division, North Carolina Annual Economic Report
(2019). 67 U.S. States Profiles and Energy Estimates, U.S. Energy Information Administration, 2017. Retrieved from
https://www.eia.gov/state/seds/data.php? incfile= /state/seds/sep_ fuel/html/fuel_ te.html&sid= US
68 U.S. EIA, State Energy Data System, Table C3, Primary Energy Consumption Estimates, 2018.

45 | E P C B i e n n i a l R e p o r t 2 0 2 0
North Carolina Energy Consumption by Fuel Type, 2018
Energy Source Used for Home Heating (% of households in 2018)
Electricity 63.6%
Natural Gas 24.7%
Liquefied Gases 6.7%
Fuel Oil 2.8%
Other/None 2.2%
ELECTRICITY
CONSUMED FOR
TRANSPORTATION
Year MWh
2002 NA
2003 0
2004 0
2005 36
2006 31
2007 22
2008 5,098
2009 6,695
2010 7,050
2011 7,212
2012 7,124
2013 7,405
2014 8,670
2015 8,651
2016 6,402
2017 3,540
2018 12,988
VEHICLE FUELING69
Motor Gasoline Stations
Propane Stations
Electricity Stations
E85 Station
Compressed Nat’l Gas and
other
2017
2020
2020
2020
2020
4,857 stations (4.0% of U.S.)
66 stations (2.3% of U.S.)
633 stations (2.6% of U.S.)
78 stations (2.2% of U.S.)
33 stations (2.8% of U.S.)
PRICES70
Natural Gas – City Gate
Natural Gas – Residential
Feb
2020
$2.79/1000 cf (US avg. = $3.09)
$11.68/1000 cf (US avg. = $9.26)
Electricity – Residential
Electricity – Commercial
Electricity – Industrial
Feb
2020
$11.48 cents/kWh (US avg. = 12.85)
$8.63 cents/kWh (US avg. = 10.36)
$5.89 cents/kWh (US avg. = 6.42)
69 Petroleum Industry Preparation, Response & Recovery to Hurricane Florence, presented by David McGowan, NC Petroleum
Council, NC Energy Policy Council Meeting, Archdale Building, February 20, 2019 meeting, Raleigh, NC. Retrieved from
https://files.nc.gov/ncdeq/Energy%20Mineral%20and%20Land%20Resources/Energy/Energy%20Policy%20Council/EPC-
Combined-Presentations.pdf 70 U.S. EIA, North Carolina State Profile and Energy Estimates, Profile Data. https://www.eia.gov/state/data.php?sid=NC
0 100 200 300 400 500 600
Coal
Natural Gas
Motor Gasoline excl. Ethanol
Distillate Fuel Oil
Jet Fuel
HGL
Residual Fuel
Other Petroleum
Nuclear Electric Power
Hydroelectric Power
Biomass
Other Renewables
Net Interstate Flow of Electricity
Energy Consumption (Trillion Btu)

46 | E P C B i e n n i a l R e p o r t 2 0 2 0
ENERGY BURDEN
Population and Poverty Trends in North Carolina from 2010 to 2018
• State population has grown by 8.45 % since 2010.
• The percentage of persons living in poverty has remained between 14-16 % of the total population. In 2018,
North Carolina had an overall poverty rate of 14.7 %, representing nearly 274,000 households or 1.5 million
people living at or below the federal poverty level (FPL).
• The federal poverty guidelines in the United States are set by the U.S. DHHS. In 2019 equaled $25,750 for
a family of four which is 51% of the North Carolina median household income of $49,822.
• The Covid-19 emergency is expected to significantly affect the state’s poverty figures.
Average Home Energy Burden for North
Carolina Residents, 2018
• Households in North Carolina spend a disproportionate
amount of annual household income on home energy bills,
referred to as energy burden.
• For those living with incomes below 50% of the Federal
Poverty level, 33% of their annual income is spent on
energy bills.
• Energy burden is the percentage of a household's annual
income that is spent on energy bills.
• The U.S. Department of Health and Human Services
(DHHS) classifies an energy burden of 6 % or higher as
“unaffordable”.
• Energy burden is primarily driven by a household’s
poverty status, but factors such as home energy efficiency,
housing type, quality of housing stock, and home
ownership status contribute to the burden experienced by
low income households.
Energy Burden by Fuel Type for Those at or below Federal Poverty Level, 2018

47 | E P C B i e n n i a l R e p o r t 2 0 2 0
ELECTRICITY PROFILE71, 72
Electricity Capacity by Source (2018)
Planned Capacity (MW)
2020 2022
Natural Gas 13,700 14,244
Solar 4,959 5,069.2
Primary
Resource Type
Number
of Plants
2018
Nameplate
Capacity
(MW)
Nuclear 3 5,395
Coal 9 11,167
Natural Gas 17 13,050
Petroleum 41 527
Hydroelectric 40 1,889
Solar 529 4,008
Wind 1 208
Wood 4 287
Other Biomass 22 98
Other 1 1
Grand Total 36,630
Pumped Storage 1 95
Electricity Generation by Source (2018)
Generation (MWh)
Resource Type 2018
Coal 31,510,194
Hydroelectric Conventional 6,592,491
Natural Gas 43,219,397
Nuclear 42,076,949
Other 301,639
Other Biomass 580,388
Other Gases 0
Petroleum 611,416
Solar Thermal and Photovoltaic 5,998,634
Wind 542,772
Wood and Wood Derived Fuels 694,532
Grand Total 132,128,412
71 Source: EIA Form 923 Preliminary Data for 2019 https://www.eia.gov/electricity/data/eia923/ 72 Source: EIA Detailed State Data, https://www.eia.gov/electricity/data/state/
Nuclear32%
Coal24%
Natural Gas33%
Petroleum0%
Hydroelectric5%
Solar PV5%
Wind0%
Wood 1%
Other Biomass0%
Other0%

48 | E P C B i e n n i a l R e p o r t 2 0 2 0
2019 Generation by Resource and Ownership in MWh
Total Generation 129,971,057
Duke Energy 104,405,484 80%
Non-Duke Energy 25,565,573 20%
Total Fossil Generation 72,428,690 56%
Duke Energy 62,393,016 86%
Non-Duke Energy 10,035,674 14%
Total RE Generation 14,014,121 11%
Duke Energy 96,863 1%
Non-Duke Energy 13,917,258 99%
Total Biofuel Generation 1,287,720 1%
Duke Energy 0 0%
Non-Duke Energy 1,287,720 100%
Change in RE Electricity Generation from 2007 to 2019 in thousand MWh73
Net Generation from Renewable Sources (thousand MWh)
Source 2007 2009 2011 2013 2015 2017 2018 2019*
Hydroelectric 3,121 5,214 3,893 6,901 4,742 3,818 4,993 6,199
Solar PV 0 5 17 345 1,374 5,114 6,997 7,292
Wind 0 0 0 0 0 471 543 523
Biomass 1,585 1,757 1,953 2,200 2,045 2,117 849 841
Biogas 87 131 375 410 544 695 501 447
Total 4,793 7,108 6,239 9,855 8,705 12,215 13,883 15,302
* Preliminary data in 2019
73 EIA Form https://www.eia.gov/electricity/data/eia923/

49 | E P C B i e n n i a l R e p o r t 2 0 2 0
EMISSIONS PROFILE74, 75
Electricity Generation CO2 Emissions
2005 2019 2005 2019
Percent
Change
in CO2
2005 2019
Fuel Type*
Net
Generation
(MWh)
Net
Generation
(MWh)
CO2
Emissions
(MMT)
CO2
Emissions
(MMT)
CO2
Intensity
Factor
kg/MWh
CO2
Intensity
Factor
kg/MWh
Coal 77,994,318 30,596,331 71.43 28.59 -60%
Natural Gas 3,142,892 41,611,919 1.45 16.89 1062%
Diesel Fuel 246,883 220,440 0.24 0.18 -26%
Total Fossil Fuel 81,384,094 72,428,690 73.12 45.66 -38% 898.50 630.35
Total Non-Emitting 44,655,954 55,929,726 0 0 0 0
Total Biofuel 459,903 1,287,720 NA NA NA NA
Total - All
Resources 126,499,951 129,646,135 73.12 45.66 578.05 352.15
* Does not include "other", non-fossil fuel CO2-emitting resources
Change in Fossil Fuel Use and CO2 Emissions by Entity
2005 2019 2005 2019
Fuel Type
Fuel
Consumption
(MMBtu)
Fuel
Consumption
(MMBtu)
CO2
Emissions
(MMT)
CO2
Emissions
(MMT)
Percent
Change
Coal 765,793,732 306,484,922 71.43 28.59 -60%
Duke Energy 734,981,560 304,265,323 68.56 28.38 -59%
Non-Duke Energy 30,812,172 2,219,599 2.87 0.21 -93%
Natural Gas 27,387,595 318,315,771 1.45 16.89 1062%
Duke Energy 21,092,029 244,222,281 1.12 12.96 1058%
Non-Duke Energy 6,295,566 74,093,490 0.33 3.93 1077%
Diesel Fuel 3,203,742 2,384,933 0.24 0.18 -26%
Duke Energy 2,923,625 1,736,542 0.22 0.13 -41%
Non-Duke Energy* 280,117 648,391 0.02 0.05 131%
Total 796,385,068 627,185,626 73.12 45.66 -38%
Duke Energy 758,997,214 550,224,146 69.89 41.47 -41%
Non-Duke Energy* 37,387,854 76,961,480 3.23 4.19 30%
* Increase in diesel fuel use by "State Fuel Increment", which is an EIA estimate of fuel use for non-reporting generators
74 Source: EIA Form 923, EPA CO2 Emission Factor
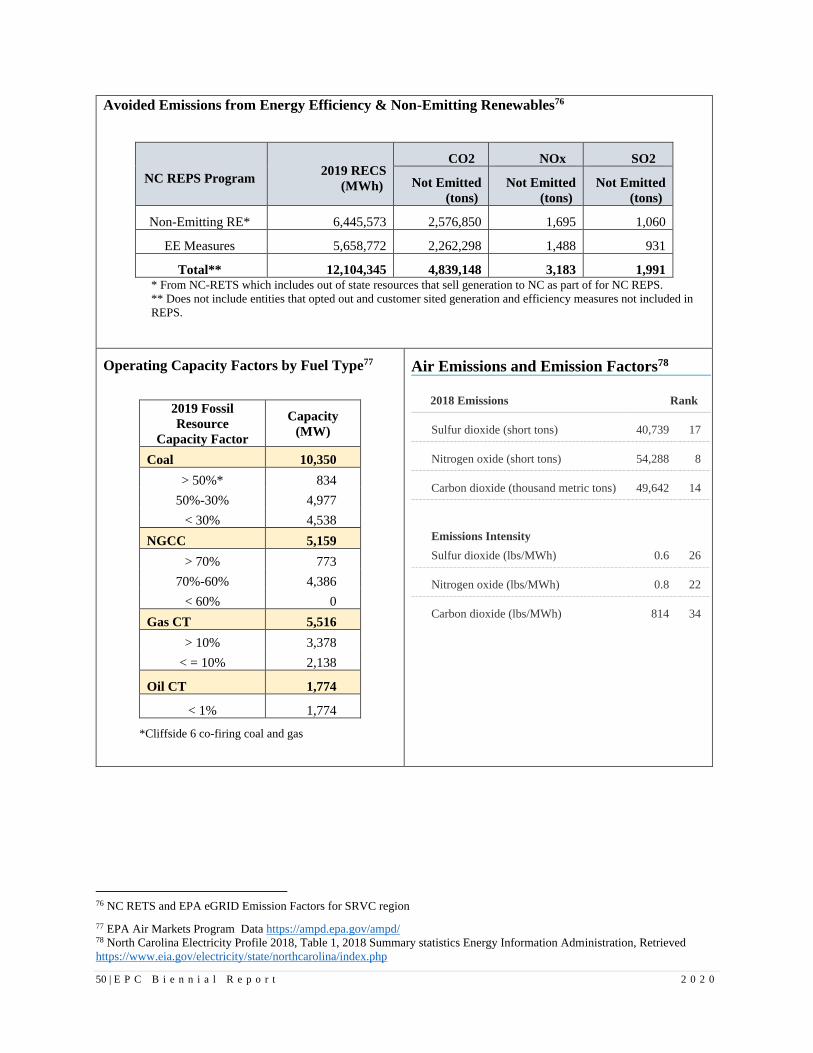
50 | E P C B i e n n i a l R e p o r t 2 0 2 0
Avoided Emissions from Energy Efficiency & Non-Emitting Renewables76
NC REPS Program 2019 RECS
(MWh)
CO2 NOx SO2
Not Emitted
(tons)
Not Emitted
(tons)
Not Emitted
(tons)
Non-Emitting RE* 6,445,573 2,576,850 1,695 1,060
EE Measures 5,658,772 2,262,298 1,488 931
Total** 12,104,345 4,839,148 3,183 1,991 * From NC-RETS which includes out of state resources that sell generation to NC as part of for NC REPS.
** Does not include entities that opted out and customer sited generation and efficiency measures not included in
REPS.
Sou
Operating Capacity Factors by Fuel Type77
2019 Fossil
Resource
Capacity Factor
Capacity
(MW)
Coal 10,350
> 50%* 834
50%-30% 4,977
< 30% 4,538
NGCC 5,159
> 70% 773
70%-60% 4,386
< 60% 0
Gas CT 5,516
> 10% 3,378
< = 10% 2,138
Oil CT 1,774
< 1% 1,774
*Cliffside 6 co-firing coal and gas
Air Emissions and Emission Factors78
2018 Emissions Rank
Sulfur dioxide (short tons) 40,739 17
Nitrogen oxide (short tons) 54,288 8
Carbon dioxide (thousand metric tons) 49,642 14
Emissions Intensity
Sulfur dioxide (lbs/MWh)
0.6
26
Nitrogen oxide (lbs/MWh) 0.8 22
Carbon dioxide (lbs/MWh) 814 34
76 NC RETS and EPA eGRID Emission Factors for SRVC region
77 EPA Air Markets Program Data https://ampd.epa.gov/ampd/ 78 North Carolina Electricity Profile 2018, Table 1, 2018 Summary statistics Energy Information Administration, Retrieved
https://www.eia.gov/electricity/state/northcarolina/index.php
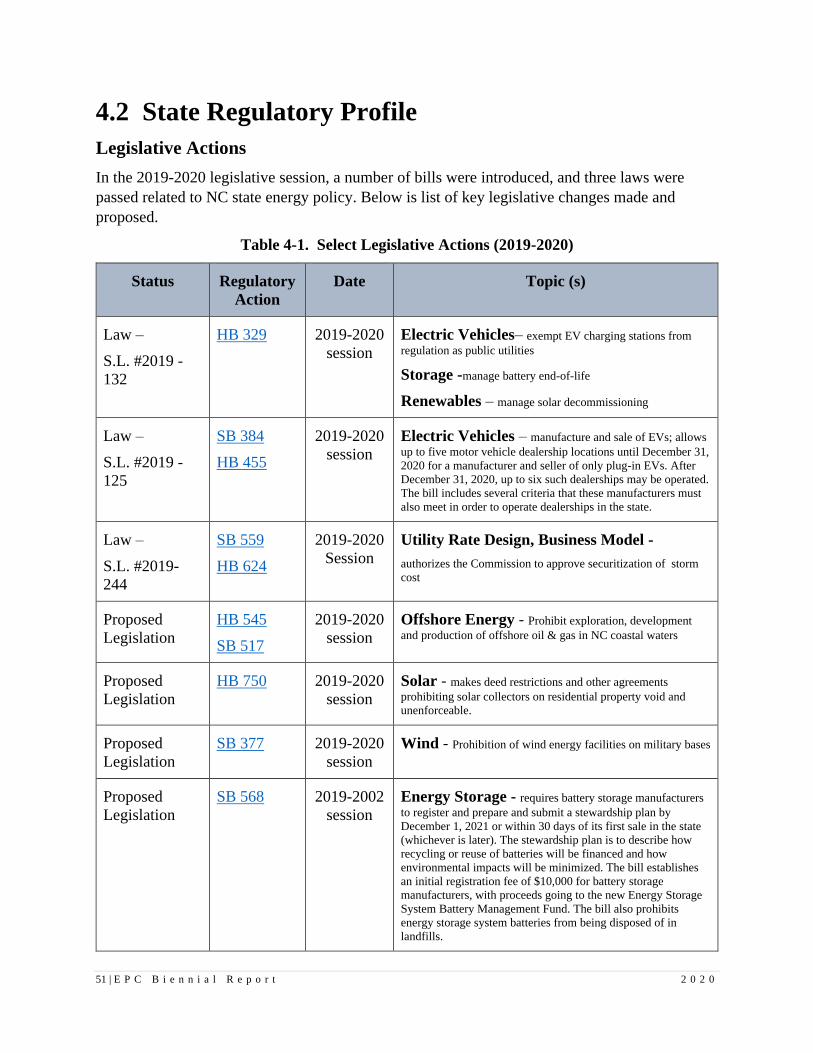
51 | E P C B i e n n i a l R e p o r t 2 0 2 0
4.2 State Regulatory Profile
Legislative Actions
In the 2019-2020 legislative session, a number of bills were introduced, and three laws were
passed related to NC state energy policy. Below is list of key legislative changes made and
proposed.
Table 4-1. Select Legislative Actions (2019-2020)
Status Regulatory
Action
Date Topic (s)
Law –
S.L. #2019 -
132
HB 329 2019-2020
session
Electric Vehicles– exempt EV charging stations from
regulation as public utilities
Storage -manage battery end-of-life
Renewables – manage solar decommissioning
Law –
S.L. #2019 -
125
SB 384
HB 455
2019-2020
session
Electric Vehicles – manufacture and sale of EVs; allows
up to five motor vehicle dealership locations until December 31,
2020 for a manufacturer and seller of only plug-in EVs. After
December 31, 2020, up to six such dealerships may be operated.
The bill includes several criteria that these manufacturers must
also meet in order to operate dealerships in the state.
Law –
S.L. #2019-
244
SB 559
HB 624
2019-2020
Session
Utility Rate Design, Business Model -
authorizes the Commission to approve securitization of storm
cost
Proposed
Legislation
HB 545
SB 517
2019-2020
session
Offshore Energy - Prohibit exploration, development
and production of offshore oil & gas in NC coastal waters
Proposed
Legislation
HB 750 2019-2020
session
Solar - makes deed restrictions and other agreements
prohibiting solar collectors on residential property void and
unenforceable.
Proposed
Legislation
SB 377 2019-2020
session
Wind - Prohibition of wind energy facilities on military bases
Proposed
Legislation
SB 568 2019-2002
session
Energy Storage - requires battery storage manufacturers
to register and prepare and submit a stewardship plan by
December 1, 2021 or within 30 days of its first sale in the state
(whichever is later). The stewardship plan is to describe how
recycling or reuse of batteries will be financed and how
environmental impacts will be minimized. The bill establishes
an initial registration fee of $10,000 for battery storage
manufacturers, with proceeds going to the new Energy Storage
System Battery Management Fund. The bill also prohibits
energy storage system batteries from being disposed of in
landfills.

52 | E P C B i e n n i a l R e p o r t 2 0 2 0
Status Regulatory
Action
Date Topic (s)
Proposed
Legislation
HB330 2019-2020
session
Utility Savings Initiative (state buildings) - Increases Utility Savings Initiative goal from 30% to 40%
reduction in energy consumption per gross square foot by 2025
Proposed
Legislation
HB 958 2019-2020
session
Regional Transmission Organization - Authorizes the Commission to require any utility serving at least
150,000 customers to file an application with FERC for
establishing or joining a regional transmission entity. In making
its decision, the Commission must determine that participation
in a regional transmission entity is in the public interest.
Regulatory Actions
In response to North Carolina’s implementation of REPS, HB 589 and the pursuant energy
storage study, the PUC opened a variety of dockets and responded to various components of
previous orders and legislation. In October 2019, Governor Cooper issued Executive Order 80
and state agencies have conducted work under that order including the Clean Energy Plan, Zero
Emissions Vehicle Plan, and a Workforce Assessment. Below is a summary of regulatory actions
since the 2018 EPC Biennial Report.
Table 4-2. Select North Carolina Energy Regulatory Actions (2018-2020)
Topic/Driver Overview Status Docket
Number
Date
Resolved
HB 589
implementation
Duke Energy community solar
program plan
Plan approved E-2 Sub
1169
4/4/19
HB 589
implementation
Community solar program terms
for implementation
Rules adopted E-100
Sub 155
1/26/18
HB 589
implementation
Competitive Procurement of
Renewable Energy (CPRE)
Program
Order approving
CPRE program
Proceeding
remains ongoing.
E-2 Sub
1159
E-7 Sub
1156
2/21/18
HB 589
implementation
Green Source Advantage Program
modifications and compliance
Order approving
program
E-2 Sub
1170 E-7
Sub 1169
2/1/19
HB 589
implementation
Duke Energy application to
become a commercial solar lessor
Order approving
Duke Energy’s
application
EGL-2
Sub 0 12/17/18

53 | E P C B i e n n i a l R e p o r t 2 0 2 0
Topic/Driver Overview Status Docket
Number
Date
Resolved
HB 589
implementation
Modification of REPS swine and
poultry waste set-aside
Order for all
electric utilities
E-100
Sub 113
1/8/18
Energy
Storage,
Renewable
Energy
Rules for integration of solar
qualifying facilities with energy
storage
Order adopting
standard rates
and contract
terms
E-100
Sub 158 4/15/20
Energy Storage Investigation to prepare for
increased storage deployment
Educational
presentations
E-100
Sub 164 N/A
Energy
Storage,
Renewable
Energy
Interconnection Standards Order approving
rule revisions.
Proceeding
remains ongoing.
E-100
Sub 101 6/14/19
Renewable
Energy,
Energy Storage
Duke Energy Hot Springs
Microgrid Solar and Battery project
proposal
Order approving
project, subject
to ancillary
service study
requirements
E-2 Sub
1185 May
2019
Grid
Modernization
Smart Meter Usage App pilots
(Duke)
Order approving
pilot
E-7 Sub
1209 9/5/19
Renewable
Energy, Grid
Modernization
Integrated Resource Plans and
Smart Grid Technology Plans
(Duke and Dominion).
Development of Integrated System
and Operations Planning (ISOP)
process (Duke)
IRPs accepted
Smart Grid Plans
accepted
E-100
Sub 157 8/27/19
7/22/19
Grid
Modernization
Rules for third-party access to
customer data for Duke, Dominion
Ongoing E-100
Sub 161 N/A
Grid
Modernization,
Rate case
Duke Energy rate cases for
compliance, grid modernization,
and optimization of customer
experience. Data access, electric
transportation and energy storage
plans.
Ongoing E-2 Sub
1219
E-7 Sub
1214
N/A

54 | E P C B i e n n i a l R e p o r t 2 0 2 0
Topic/Driver Overview Status Docket
Number
Date
Resolved
Rate Case Duke Energy Carolinas rate case,
including PowerForward grid
modernization plan. Dynamic
pricing pilots proposed, pursuant to
NCUC order.
Order approved
AMI investment,
but denied
remainder of the
PowerForward
plan
E-7 Sub
1146 6/22/18
Rate Case Dominion rate case including
proposed increase on residential
charges
Resolved with
partial rate
increase, but full
fixed charge
increase
E-22 Sub
562 2/24/20
Rate Design Public Staff recommendation on
standard methods for NC IOUs to
set fixed monthly customer charges
Report and
Recommendation
E-100
Sub 162 3/28/19
REPS
compliance
REPS compliance plans, Smart
Grid Technology Plans, AMI
analysis and data access plans
(Duke)
Order accepting
plans
E-100
Sub 147 4/16/18
REPS
implementation
Allowable use of RNG in Piedmont
Natural Gas pilot program
Order accepting
revision
G-9 Sub
698
1/11/19
Transportation
Electrification
Three-year pilot program proposed
by Duke Energy. Includes
incentives for residential charging
equipment, fleet charging
equipment, transit bus charging
equipment, electric school buses,
deployment of utility-owned
charging equipment at multi-family
properties and charging equipment
for public use.
Ongoing E-7 Sub
1195
E-2 Sub
1197
N/A

Appendix Pg. 1
Appendices
A. List of EPC Committee Meetings
Energy Assurance Committee
November 14, 2019
February 5, 2020
April 27, 2020
May 6, 2020
Energy Efficiency Committee
February 19, 2020
November 18, 2019
May 15, 2019
Energy Infrastructure Committee
February 19, 2020
August 21, 2019
May 15, 2019
February 20, 2019
Appendix Pg. 2
B. Staff to the Council
Department of Environmental Quality
State Energy Office
Sushma Masemore
Lori Collins
Star Hodge
Russell Duncan
Jeannette Martin
Cynthia Moseley
Matthew Davis
Peggy Walker
Kevin Martin (former)
Maurice McKinney (former)
Holly Samaha (former)
Maye Hickman
Robert Bennett

Appendix Pg. 3
C. Public Comments
This report has undergone a public review process before adoption and before discussion by the full
Energy Policy Council. A draft of the 2020 Energy Policy Council’s Biennial Report was posted on
the North Carolina Department of Environmental Quality’s website from July 10, 2020 to August 9,
2020 for public comments. Comments were received from six different individuals or
organizations. The table below shows the individual or organization that submitted comments, a
summary of their comments, and the actions taken by the Energy Policy Council or changes that
were made in the report in response to the comments. Following the table are the full comments
from the individuals and organizations.
Commenter Summary of Comment Response to Comment
Steve Cavanaugh,
Cavanaugh Solutions
Strong support for the
continued development of the
NC Biogas resources. The
work that the Energy Policy
Council is doing to continue
to advance this critical
resource is ground breaking. I
fully support the
recommendations in the
report.
The EPC acknowledges this
comment.
Unofficial Public
Commenter
Could not tell if the Energy
Infrastructure Committee had
spent any time understanding
what Duke is working to
accomplish through its
Integrated Systems &
Operations Project (ISOP)
initiative but the outputs of
that effort may go a long way
in supporting the future
which the EPC is
considering. If they have not
already done so, it might be a
subject the council gets some
exposure to. Also, it would
give Duke a boost to move
forward in a timely and
effective manner.
In future meetings, the EPC
recommends an Integrated
Systems & Operations Project
(ISOP) presentation/overview
from Duke Energy to the
entire EPC. The presentation
will provide a better
understanding of the new
approach used to integrate
distribution system planning
alongside of traditional
generation and transmission
planning.
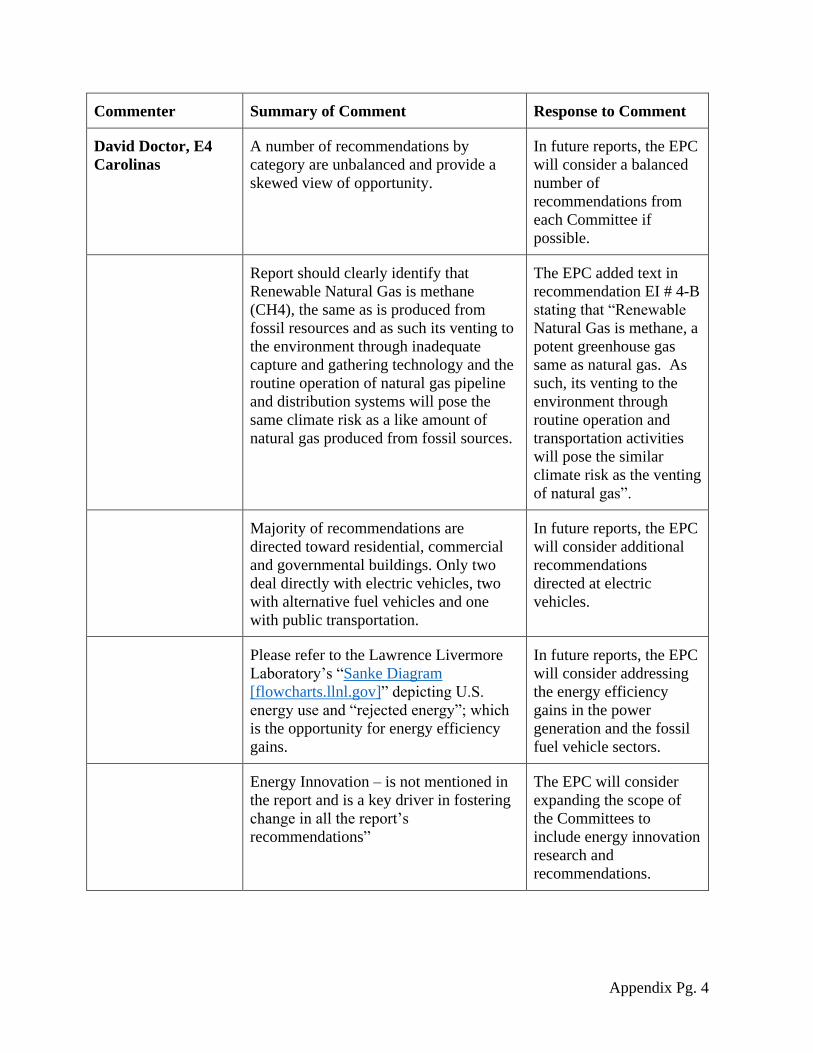
Appendix Pg. 4
Commenter Summary of Comment Response to Comment
David Doctor, E4
Carolinas
A number of recommendations by
category are unbalanced and provide a
skewed view of opportunity.
In future reports, the EPC
will consider a balanced
number of
recommendations from
each Committee if
possible.
Report should clearly identify that
Renewable Natural Gas is methane
(CH4), the same as is produced from
fossil resources and as such its venting to
the environment through inadequate
capture and gathering technology and the
routine operation of natural gas pipeline
and distribution systems will pose the
same climate risk as a like amount of
natural gas produced from fossil sources.
The EPC added text in
recommendation EI # 4-B
stating that “Renewable
Natural Gas is methane, a
potent greenhouse gas
same as natural gas. As
such, its venting to the
environment through
routine operation and
transportation activities
will pose the similar
climate risk as the venting
of natural gas”.
Majority of recommendations are
directed toward residential, commercial
and governmental buildings. Only two
deal directly with electric vehicles, two
with alternative fuel vehicles and one
with public transportation.
In future reports, the EPC
will consider additional
recommendations
directed at electric
vehicles.
Please refer to the Lawrence Livermore
Laboratory’s “Sanke Diagram
[flowcharts.llnl.gov]” depicting U.S.
energy use and “rejected energy”; which
is the opportunity for energy efficiency
gains.
In future reports, the EPC
will consider addressing
the energy efficiency
gains in the power
generation and the fossil
fuel vehicle sectors.
Energy Innovation – is not mentioned in
the report and is a key driver in fostering
change in all the report’s
recommendations”
The EPC will consider
expanding the scope of
the Committees to
include energy innovation
research and
recommendations.
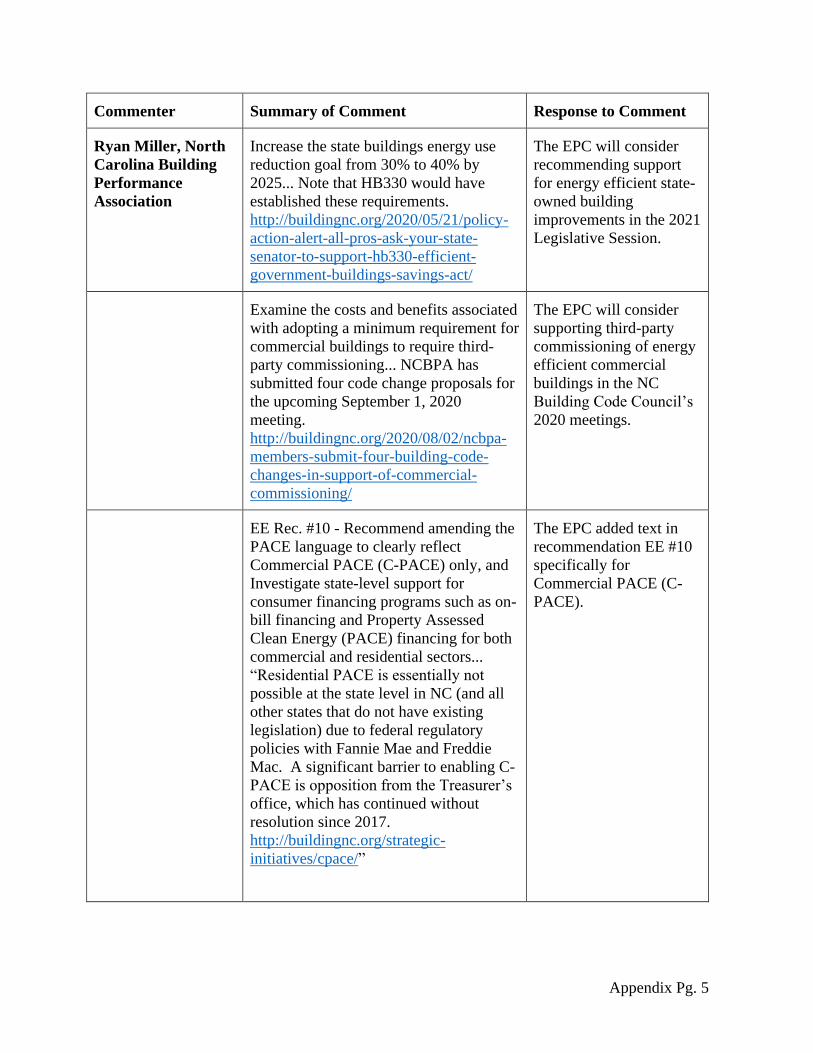
Appendix Pg. 5
Commenter Summary of Comment Response to Comment
Ryan Miller, North
Carolina Building
Performance
Association
Increase the state buildings energy use
reduction goal from 30% to 40% by
2025... Note that HB330 would have
established these requirements.
http://buildingnc.org/2020/05/21/policy-
action-alert-all-pros-ask-your-state-
senator-to-support-hb330-efficient-
government-buildings-savings-act/
The EPC will consider
recommending support
for energy efficient state-
owned building
improvements in the 2021
Legislative Session.
Examine the costs and benefits associated
with adopting a minimum requirement for
commercial buildings to require third-
party commissioning... NCBPA has
submitted four code change proposals for
the upcoming September 1, 2020
meeting.
http://buildingnc.org/2020/08/02/ncbpa-
members-submit-four-building-code-
changes-in-support-of-commercial-
commissioning/
The EPC will consider
supporting third-party
commissioning of energy
efficient commercial
buildings in the NC
Building Code Council’s
2020 meetings.
EE Rec. #10 - Recommend amending the
PACE language to clearly reflect
Commercial PACE (C-PACE) only, and
Investigate state-level support for
consumer financing programs such as on-
bill financing and Property Assessed
Clean Energy (PACE) financing for both
commercial and residential sectors...
“Residential PACE is essentially not
possible at the state level in NC (and all
other states that do not have existing
legislation) due to federal regulatory
policies with Fannie Mae and Freddie
Mac. A significant barrier to enabling C-
PACE is opposition from the Treasurer’s
office, which has continued without
resolution since 2017.
http://buildingnc.org/strategic-
initiatives/cpace/”
The EPC added text in
recommendation EE #10
specifically for
Commercial PACE (C-
PACE).
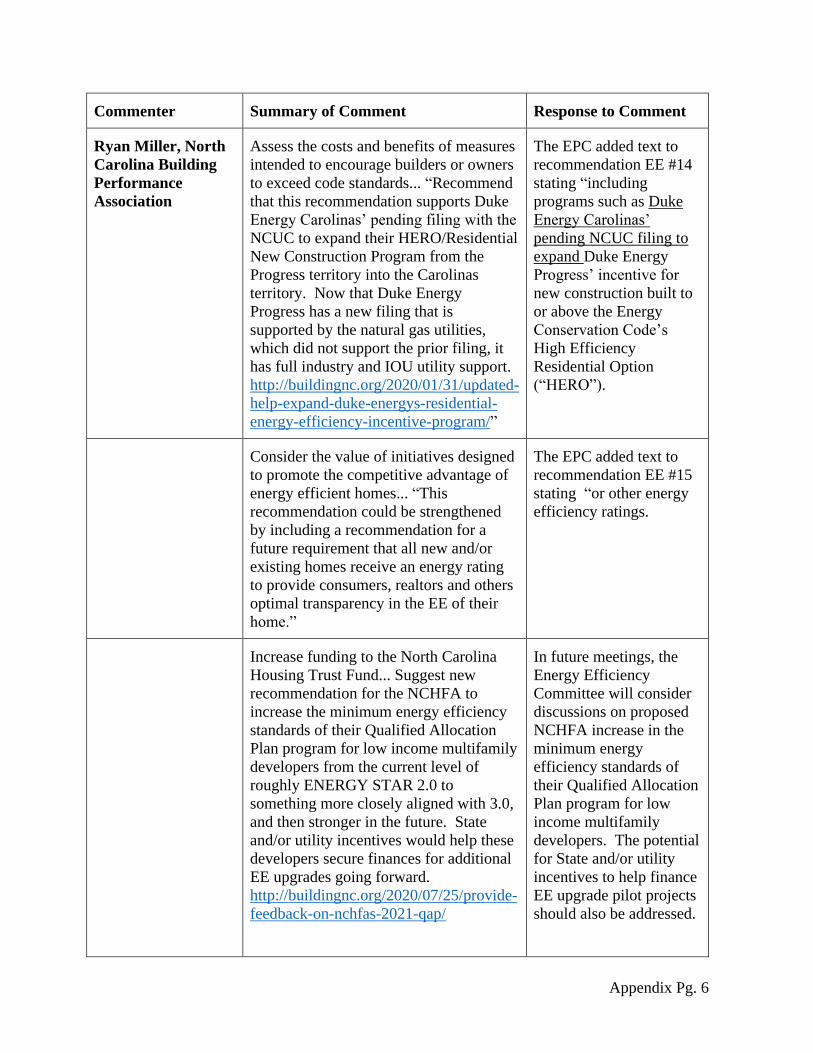
Appendix Pg. 6
Commenter Summary of Comment Response to Comment
Ryan Miller, North
Carolina Building
Performance
Association
Assess the costs and benefits of measures
intended to encourage builders or owners
to exceed code standards... “Recommend
that this recommendation supports Duke
Energy Carolinas’ pending filing with the
NCUC to expand their HERO/Residential
New Construction Program from the
Progress territory into the Carolinas
territory. Now that Duke Energy
Progress has a new filing that is
supported by the natural gas utilities,
which did not support the prior filing, it
has full industry and IOU utility support.
http://buildingnc.org/2020/01/31/updated-
help-expand-duke-energys-residential-
energy-efficiency-incentive-program/”
The EPC added text to
recommendation EE #14
stating “including
programs such as Duke
Energy Carolinas’
pending NCUC filing to
expand Duke Energy
Progress’ incentive for
new construction built to
or above the Energy
Conservation Code’s
High Efficiency
Residential Option
(“HERO”).
Consider the value of initiatives designed
to promote the competitive advantage of
energy efficient homes... “This
recommendation could be strengthened
by including a recommendation for a
future requirement that all new and/or
existing homes receive an energy rating
to provide consumers, realtors and others
optimal transparency in the EE of their
home.”
The EPC added text to
recommendation EE #15
stating “or other energy
efficiency ratings.
Increase funding to the North Carolina
Housing Trust Fund... Suggest new
recommendation for the NCHFA to
increase the minimum energy efficiency
standards of their Qualified Allocation
Plan program for low income multifamily
developers from the current level of
roughly ENERGY STAR 2.0 to
something more closely aligned with 3.0,
and then stronger in the future. State
and/or utility incentives would help these
developers secure finances for additional
EE upgrades going forward.
http://buildingnc.org/2020/07/25/provide-
feedback-on-nchfas-2021-qap/
In future meetings, the
Energy Efficiency
Committee will consider
discussions on proposed
NCHFA increase in the
minimum energy
efficiency standards of
their Qualified Allocation
Plan program for low
income multifamily
developers. The potential
for State and/or utility
incentives to help finance
EE upgrade pilot projects
should also be addressed.

Appendix Pg. 7
Commenter Summary of Comment Response to Comment
Ryan Miller, North
Carolina Building
Performance
Association
Monitor developments at the NC
Building Code Council (NCBCC),
particularly those that consider balancing
issues of cost and policy in advancing
energy efficient residential construction...
“We recommend an amendment to this
recommendation that puts the focus on
“balancing issues of the up-front costs of
minimum energy efficiency requirements
in residential construction with the long-
term value and total cost of ownership, to
ensure that homeowners and renters can
capitalize on a lifetime of monthly utility
bill savings that cost the builder around
$500 up-front and only increase in value
over time as utility rates increase.”
The EPC added text to
recommendation EE #18
stating “because of the
benefits to homeowners
and renters.”
Improve the NCBCC by adding energy
efficiency expertise to the Council’s
makeup... “We recommend including a
recommendation for the addition of an
Energy seat that would be positioned to
represent the EE and RE industries in
code matters. There is a significant gap
in education and experience in this area,
which is only becoming greater as our
energy codes become more complicated
and the market demand for EE and RE
continues to increase in and out of the
code environment.”
The EPC added text to
recommendation EE #20
stating “One additional
energy expert to represent
the EE, RE and EV
markets should be added
to the Council’s makeup.”
Support the burgeoning electric vehicle
(EV) industry in the transportation sector
of the North Carolina economy... “We
also recommend referencing a prior
recommendation for an Energy seat being
added to the NC Building Code Council
that would be formally tasked with
representing the EV market in code
discussions and decisions. That role does
not exist for EE, RE, EVs or Storage.”
The EPC added text to
recommendation EE #22
stating “The additional
energy expert referred to
in Recommendation #EE
20 will also represent the
EV market.”

Appendix Pg. 8
Commenter Summary of Comment Response to Comment
Ryan Miller, North
Carolina Building
Performance
Association
NCUC should commence a study on EE
cost-effectiveness testing and select a
consultant to analyze opportunities to
improve EE program participation using
current or new cost-effectiveness testing
regulations and protocols... “Duke Energy
is likely transitioning from the Total
Resource Cost Test (TRC) to the Utility
Cost Test (UCT) for their cost
effectiveness testing protocols at the end
of this year, which would make the
inclusion of non-energy benefits available
for new programs for the 2022 calendar
year. There is an active filing with the
NCUC that makes this filing. Our
industry supports this action fully.
http://buildingnc.org/2020/01/26/ncbpa-
releases-report-detailing-improvements-
with-duke-energys-energy-efficiency-
programs/”
The EPC will monitor
Duke Energy’s likely
transition to the Utility
Cost Test.
RTI International The RTI, Duke University & East
Carolina University Biogas Opportunities
& Impacts Analysis Research Team
offered comments about its forthcoming
biogas report on: determining NC’s
biogas potential; modeling the
technological and economic feasibility of
developing NC’s biogas resources; and
the value of a biogas analysis.
The planned (October, 2020) report will
address: NC’s biomethane potential;
locations of biomethane feedstocks;
amounts, types and the ability to develop
feedstocks; costs of development to
determine if it is a realistic option; and
effects of biogas development on
communities, the environment and the
economy.
In the future, the EPC
will review the final
Report by the RTI, Duke
University & East
Carolina University
Biogas Opportunities &
Impacts Analysis
Research Team. The EPC
will consider requesting a
presentation and
overview of the findings
in this report during a
regularly scheduled EPC
meeting. The findings in
the preliminary Report
addressing North
Carolina’s biogas
potential, economic and
technical feasibility, and
an analysis of biogas’s
value will be a beneficial
resource for the EPC.
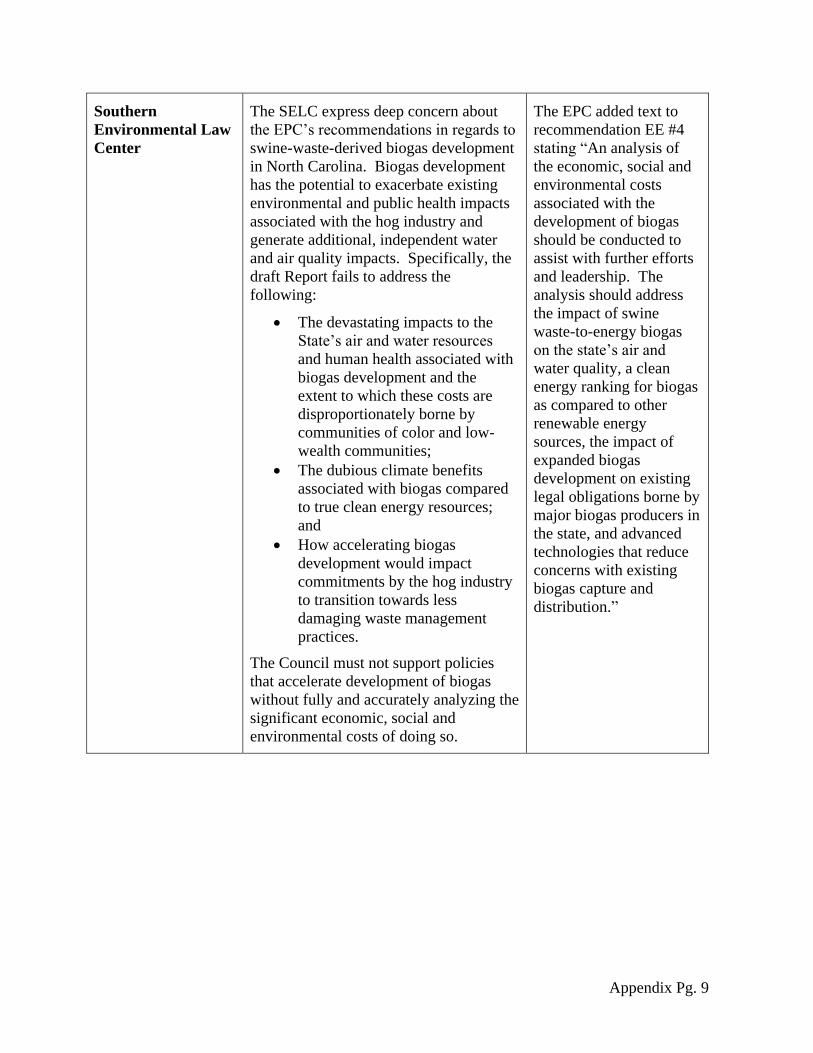
Appendix Pg. 9
Southern
Environmental Law
Center
The SELC express deep concern about
the EPC’s recommendations in regards to
swine-waste-derived biogas development
in North Carolina. Biogas development
has the potential to exacerbate existing
environmental and public health impacts
associated with the hog industry and
generate additional, independent water
and air quality impacts. Specifically, the
draft Report fails to address the
following:
• The devastating impacts to the
State’s air and water resources
and human health associated with
biogas development and the
extent to which these costs are
disproportionately borne by
communities of color and low-
wealth communities;
• The dubious climate benefits
associated with biogas compared
to true clean energy resources;
and
• How accelerating biogas
development would impact
commitments by the hog industry
to transition towards less
damaging waste management
practices.
The Council must not support policies
that accelerate development of biogas
without fully and accurately analyzing the
significant economic, social and
environmental costs of doing so.
The EPC added text to
recommendation EE #4
stating “An analysis of
the economic, social and
environmental costs
associated with the
development of biogas
should be conducted to
assist with further efforts
and leadership. The
analysis should address
the impact of swine
waste-to-energy biogas
on the state’s air and
water quality, a clean
energy ranking for biogas
as compared to other
renewable energy
sources, the impact of
expanded biogas
development on existing
legal obligations borne by
major biogas producers in
the state, and advanced
technologies that reduce
concerns with existing
biogas capture and
distribution.”

Appendix Pg. 10
Steve Cavanaugh, Cavanaugh Solutions
To Whom It May Concern:
Thank you for the opportunity to review the Energy Policy Council 2020 Biennial Report. I want to
voice my strong support for the continued development of the NC Biogas resources. The work that
the Energy Policy Council is doing to continue to advance this critical resource is ground breaking.
I fully support the recommendations in the report.
Sincerely,
Steve Cavanaugh
______________________________________________________________________________
Unofficial Public Commenter
Could not tell if the Energy Infrastructure Committee had spent any time understanding what Duke
is working to accomplish through its Integrated Systems & Operations Project (ISOP) initiative but
the outputs of that effort may go a long way in supporting the future which the EPC is considering.
If they have not already done so, it might be a subject the council gets some exposure to. Also, it
would give Duke a boost to move forward in a timely and effective manner.
______________________________________________________________________________
David Doctor, E4 Carolinas
Committee Members:
The comments herein are those of E4 Carolinas’ President & CEO and do not represent the
comments of E4 Carolinas Board of Directors or its individual members. Generally, the report is
well written and the recommendations are well conceived. My comments below represent minor
adjustments to make the report even more impactful.
• The number of recommendations by category are unbalanced and provide a skewed view of
opportunity. For example, Energy Infrastructure (EI) has five recommendations; Energy
Assurance (EA) has two; and Energy Efficiency (EE) has thirty-seven, consuming 8 pages
of the report. Were the opportunities described for Energy Infrastructure and Energy
Assurance disaggregated to the discrete level of the Energy Efficiency recommendations, I
believe each would likewise have as many recommendations. I suggest that either the 37 EE
recommendations be consolidated to represent groups of opportunity comparable to EI and
EA or the other be disaggregated to provide balance.
• Recommendation EI 4: Renewable Natural Gas – be clear that I support this
recommendation. However, I believe to “get ahead” of critics the report should clearly
identify that Renewable Natural Gas is methane (CH4), the same as is produced from fossil
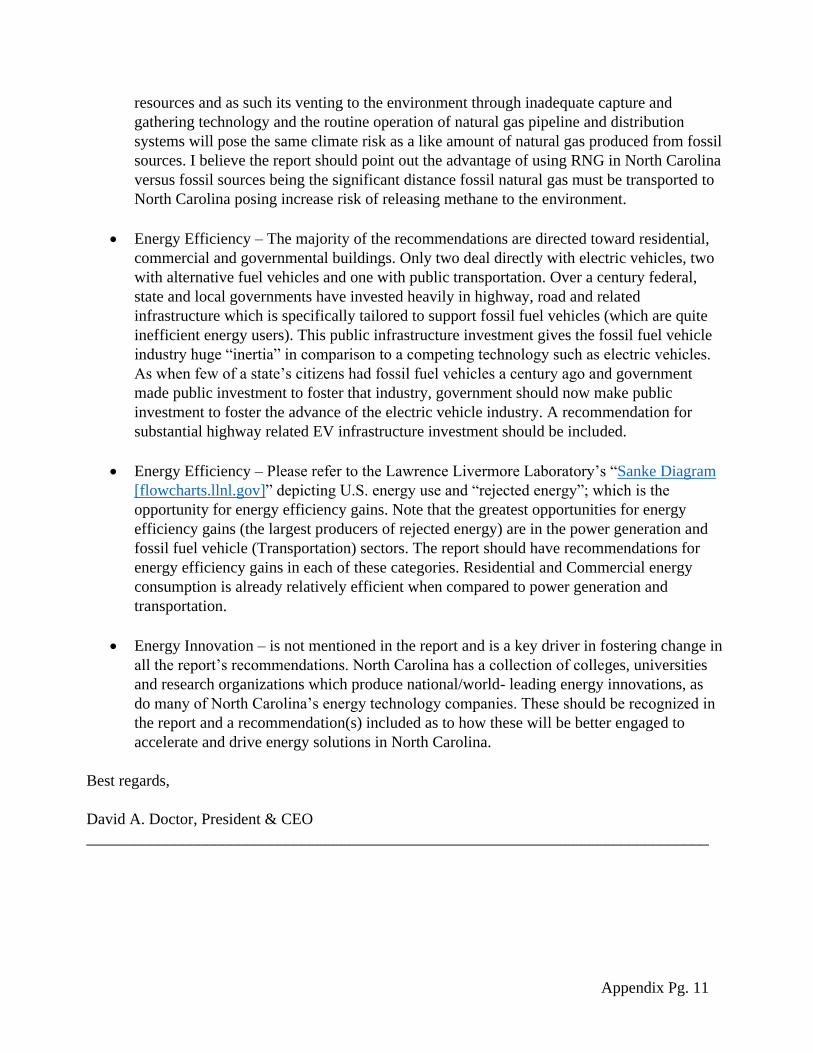
Appendix Pg. 11
resources and as such its venting to the environment through inadequate capture and
gathering technology and the routine operation of natural gas pipeline and distribution
systems will pose the same climate risk as a like amount of natural gas produced from fossil
sources. I believe the report should point out the advantage of using RNG in North Carolina
versus fossil sources being the significant distance fossil natural gas must be transported to
North Carolina posing increase risk of releasing methane to the environment.
• Energy Efficiency – The majority of the recommendations are directed toward residential,
commercial and governmental buildings. Only two deal directly with electric vehicles, two
with alternative fuel vehicles and one with public transportation. Over a century federal,
state and local governments have invested heavily in highway, road and related
infrastructure which is specifically tailored to support fossil fuel vehicles (which are quite
inefficient energy users). This public infrastructure investment gives the fossil fuel vehicle
industry huge “inertia” in comparison to a competing technology such as electric vehicles.
As when few of a state’s citizens had fossil fuel vehicles a century ago and government
made public investment to foster that industry, government should now make public
investment to foster the advance of the electric vehicle industry. A recommendation for
substantial highway related EV infrastructure investment should be included.
• Energy Efficiency – Please refer to the Lawrence Livermore Laboratory’s “Sanke Diagram
[flowcharts.llnl.gov]” depicting U.S. energy use and “rejected energy”; which is the
opportunity for energy efficiency gains. Note that the greatest opportunities for energy
efficiency gains (the largest producers of rejected energy) are in the power generation and
fossil fuel vehicle (Transportation) sectors. The report should have recommendations for
energy efficiency gains in each of these categories. Residential and Commercial energy
consumption is already relatively efficient when compared to power generation and
transportation.
• Energy Innovation – is not mentioned in the report and is a key driver in fostering change in
all the report’s recommendations. North Carolina has a collection of colleges, universities
and research organizations which produce national/world- leading energy innovations, as
do many of North Carolina’s energy technology companies. These should be recognized in
the report and a recommendation(s) included as to how these will be better engaged to
accelerate and drive energy solutions in North Carolina.
Best regards,
David A. Doctor, President & CEO
______________________________________________________________________________

Appendix Pg. 12
D. Ryan Miller, NC Building Performance Association
In response to Recommendation EE #1 - Note that HB330 from 2019, which passed the House 110-
2, was not heard in the Senate during the 2020 legislative session due to opposition from Sen. Paul
Newton. The bill would have established these requirements.
http://buildingnc.org/2020/05/21/policy-action-alert-all-pros-ask-your-state-senator-to-support-
hb330-efficient-government-buildings-savings-act/
In response to Recommendation EE #2, EE #3, EE #4, EE #5, EE #6, EE #7, EE #8, EE #11, EE
#12, EE #13, EE #17, EE #19, EE #21, EE #23, EE #24, EE #25, EE #26, EE #32, EE #33, EE #34,
EE #35, EE #36 - NCBPA supports this recommendation fully.
In response to Recommendation EE #9 - NCBPA has submitted four code change proposals for the
upcoming September 1, 2020 meeting. One of the proposals includes the recommendation for
third-party commissioning. If the proposal makes it through the NC Building Code Council
process, this recommendation will be adopted, in part. If not, we may seek legislative action to
override the NCBCC’s denial of the proposal. http://buildingnc.org/2020/08/02/ncbpa-members-
submit-four-building-code-changes-in-support-of-commercial-commissioning/
In response to Recommendation EE #10 - Recommend amending the PACE language to clearly
reflect Commercial PACE (C-PACE) only, as Residential PACE is essentially not possible at the
state level in NC (and all other states that do not have existing legislation) due to federal regulatory
policies with Fannie Mae and Freddie Mac. A significant barrier to enabling C-PACE is opposition
from the Treasurer’s office, which has continued without resolution since 2017.
http://buildingnc.org/strategic-initiatives/cpace/
In response to Recommendation EE #14 - Recommend that this recommendation supports Duke
Energy Carolinas’ pending filing with the NCUC to expand their HERO/Residential New
Construction Program from the Progress territory into the Carolinas territory. The filing has been
underway for more than a year and the new version should be reviewed by the NCUC in the coming
weeks. Now that Duke Energy Progress has a new filing that is supported by the natural gas
utilities, which did not support the prior filing, it has full industry and IOU utility support.
http://buildingnc.org/2020/01/31/updated-help-expand-duke-energys-residential-energy-efficiency-
incentive-program/
In response to Recommendation EE #15 - This recommendation could be strengthened by including
a recommendation for a future requirement that all new and/or existing homes receive an energy
rating to provide consumers, realtors and others optimal transparency in the EE of their home.
In response to Recommendation EE #16 - Suggest new recommendation somewhat related to this
that recommends the NCHFA to increase the minimum energy efficiency standards of their
Qualified Allocation Plan program for low income multifamily developers from the current level of
roughly ENERGY STAR 2.0 to something more closely aligned with 3.0, and then stronger in the
future. State and/or utility incentives to help these developers finance the first one or two projects
with additional EE upgrades would help secure them in all developments going forward.
http://buildingnc.org/2020/07/25/provide-feedback-on-nchfas-2021-qap/
Appendix Pg. 13
In response to Recommendation EE #18 - We recommend an amendment to this recommendation
that puts the focus on “balancing issues of the up-front costs of minimum energy efficiency
requirements in residential construction with the long-term value and total cost of ownership, to
ensure that homeowners and renters can capitalize on a lifetime of monthly utility bill savings that
cost the builder around $500 up-front and only increase in value over time as utility rates increase.”
In response to Recommendation EE #20 - We recommend including a recommendation for the
addition of an Energy seat that would be positioned to represent the EE and RE industries in code
matters. There is a significant gap in education and experience in this area, which is only becoming
greater as our energy codes become more complicated and the market demand for EE and RE
continues to increase in and out of the code environment.
In response to Recommendation # 22 - NCBPA supports this recommendation fully.
We also recommend referencing a prior recommendation for an Energy seat being added to the NC
Building Code Council that would be formally tasked with representing the EV market in code
discussions and decisions. That role does not exist for EE, RE, EVs or Storage.
In response to Recommendation #37 - Duke Energy is likely transitioning from the Total Resource
Cost Test (TRC) to the Utility Cost Test (UCT) for their cost effectiveness testing protocols at the
end of this year, which would make the inclusion of non-energy benefits available for new
programs for the 2022 calendar year. There is an active filing with the NCUC that makes this
filing. Our industry supports this action fully. http://buildingnc.org/2020/01/26/ncbpa-releases-
report-detailing-improvements-with-duke-energys-energy-efficiency-programs/
D. Ryan Miller, NC Building Performance Association
________________________________________________________________________________
To: NC Energy Policy Council
From: RTI International (RTI), on behalf of the RTI, Duke University and East Carolina
University Biogas Opportunities and Impacts Analysis Research Team1
Date: August 8, 2020
Re: Comments to the Draft 2020 EPC Biennial Report
In the 2018 report, the NC Energy Policy Council (EPC) recognized North Carolina’s considerable
biogas resource potential and discussed the benefits of its use in terms of providing a
renewable energy resource, providing economic and environmental benefits and mitigating
greenhouse gas (GHG) emissions. It then recognized that despite this considerable potential,
the state’s biogas resources and the options for their use are not adequately understood,
which, in turn, impedes the appropriate development of biogas resources and can hamper
policy makers in the implementation of effective measures to support the appropriate and
maximum development of biogas resources in ways that enhance beneficial economic,
environmental and community outcomes related to biogas development.
To address this information gap and help the state in better integrating biogas resources into its
energy and climate strategies while maximizing and/or mitigating the economic and, ultimately,
“promote and develop North Carolina’s bioenergy resources and deployment”2, environmental
and community benefits and impacts of biogas development, the EPC made a series of
recommendations in its 2018 Biennial Report designed to establish an accurate assessment of
the state’s full biogas resource potential (in other words, an up-to-date biogas resource
inventory) considering currently available end uses for biogas (including fueling public
transportation fleets); based on the identification of end uses and the technological and
economic factors associated with achieving those end uses, a determination of the state’s
realistic biogas production potential; and identification of the environmental, economic and
community consequences associated with biogas development by end use. In turn, the EPC
sought recommendations for maximizing biogas use, all of which was to be incorporated into
the EPC’s 2020 report and recommendations.3
1 RTI wishes to acknowledge the generous support of Duke Energy in funding this analysis. 2 EPC 2018 Biennial Report. Note that although the term “bioenergy” includes all energy derived from organic materials, regardless of production method or feedstock, this analysis focuses only on biomethane, which is derived from the anaerobic digestion of organic materials, including but not limited to a variety of organic waste materials. 3 The recommendations included:
1. Developing a bioenergy resource inventory and economic impact analysis; establish goals for the capture
and refining of biogas into renewable natural gas for distribution; and goals for incorporation of biogas-
derived natural gas into the State’s transportation fuels program for State fleets and public
transportation.
Appendix Pg. 14

These comments include a report of the results of the tasks completed thus far in fulfillment of
the EPC’s 2018 recommendations and a description of the work still underway, the results of
which are expected to be published this October after appropriate peer review.4 These
comments therefore include only those portions of the analysis that have been thoroughly
scrutinized by the full research team as well as appropriate stakeholders and peer reviewers.
I. Determining North Carolina’s Total Biogas Potential5
Regarding the bioenergy resources of the state related to biogas, findings thus far include:
• The total biogas generation potential in North Carolina is approximately 105 billion cubic
feet per year, with a total heating value of 63 trillion BTU and a power capacity of 2.1 GW.
• The total associated emissions reduction potential in equivalent CO2 from using biogas
for North Carolina is estimated at 5.2 million metric tons carbon dioxide equivalents
(MMTCO2e) annually.
• Biogas using animal waste as feedstock accounts for 53% of the total biogas potential in
North Carolina (see Exhibit 1), with swine waste making up the largest animal waste
feedstock resource.
• The five counties with the highest biogas potential are Sampson, Duplin, Bladen, Wayne,
and Robeson (see Exhibit 2), where most of the pork production occurs.
With respect to biomethane sources, feedstocks can be broken down into seven source
categories, as depicted below in Exhibit 1. Exhibit 1 underscores that biomethane produced
from swine waste feedstocks is by far the largest source category, followed by crop waste and
waste from poultry operations.
2. Conducting [an] economic impact analysis including analyses of environmental and community benefits
and impacts, for the beneficial and optimum utilization of the State’s bioenergy resources.
3. Creating a bioenergy resource inventory for North Carolina based on input from industry, regulatory, and
academic sources that are current and specific to North Carolina.
4. Completing and summarizing the results of this work in the 2020 Biennial report of this Council.
4 See Footnote 2 of the 2020 Draft EPC Biennial Report. Pursuant to the EPC’s 2018 recommendations stated in Footnote 3, the research team will provide a complete report of its findings on or before October 31, 2020, which it will submit to the EPC for publication and consideration in its future activities and recommendations and which it will submit to the Department of Environmental Quality in its role in supporting the EPC and with respect to its role related to setting the state’s clean energy plan, which anticipates relying on the final biogas analysis in setting the state’s clean energy policy related to biogas. Note that disruptions resulting from the COVID-19 pandemic have delayed execution of portions of the analysis, particularly completion of the economic, environmental and community impacts analysis. 5 This data will be made visible to the public.
Appendix Pg. 15

Exhibit 1. Biogas total potential annual production in North Carolina by feedstock (2019 data, except wastewater treatment plants 2015)
Mapping North Carolina’s total biomethane potential shows a concentration of biogas potential
in five Coastal Plain counties, including Sampson and Duplin with the highest biomethane
potential, followed by Bladen, Wayne, and Robeson Counties (see Exhibit 2). Mapping biogas
potential by county reinforces swine waste’s lead in biomethane production potential, as the
five counties match the counties with the highest pork production, which collectively are home
to the majority of North Carolina’s 2,100+ swine farms. As part of the forthcoming economic,
environmental and community impacts analysis, the team will consider the feedstock/biogas
production potential of each of North Carolina’s counties and feedstock potential by local
distribution company (LDC) territory which the team expects will aid in the development of
statewide policy to encourage biogas development, such as a renewable natural gas (RNG)
standard or low carbon fuel standard, as recommended by the EPC in the draft 2020 biennial
report.
Appendix Pg. 16
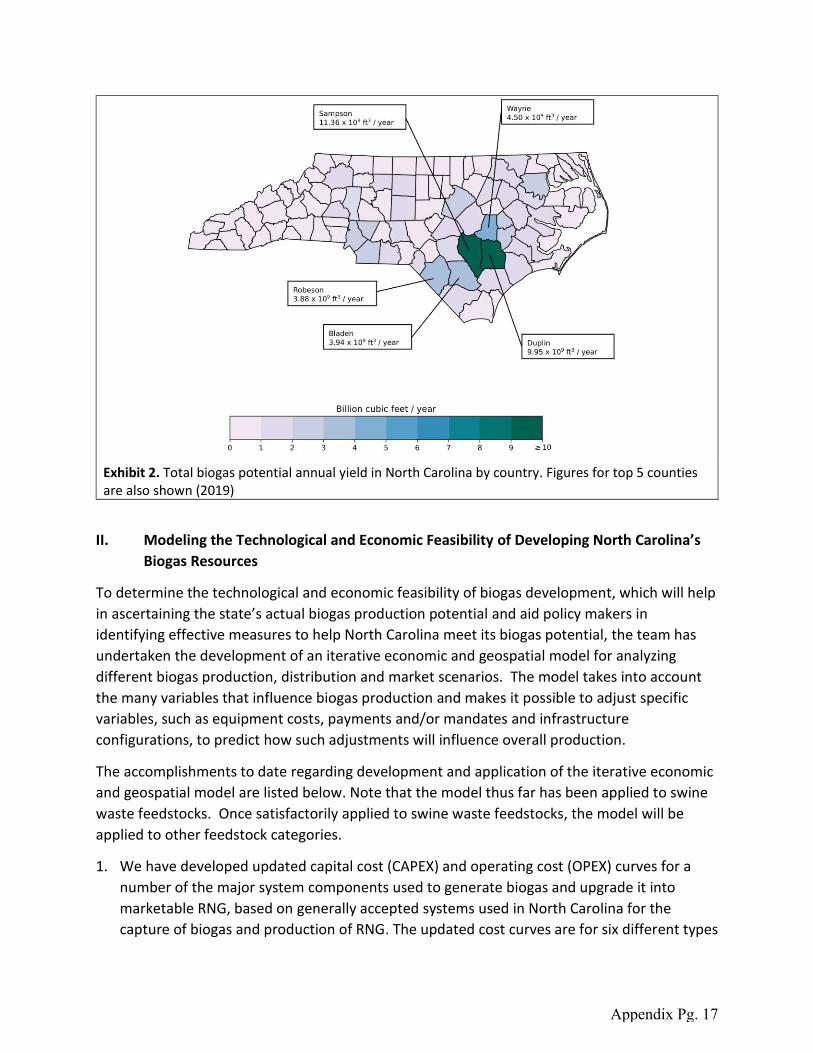
Exhibit 2. Total biogas potential annual yield in North Carolina by country. Figures for top 5 counties are also shown (2019)
II. Modeling the Technological and Economic Feasibility of Developing North Carolina’s
Biogas Resources
To determine the technological and economic feasibility of biogas development, which will help
in ascertaining the state’s actual biogas production potential and aid policy makers in
identifying effective measures to help North Carolina meet its biogas potential, the team has
undertaken the development of an iterative economic and geospatial model for analyzing
different biogas production, distribution and market scenarios. The model takes into account
the many variables that influence biogas production and makes it possible to adjust specific
variables, such as equipment costs, payments and/or mandates and infrastructure
configurations, to predict how such adjustments will influence overall production.
The accomplishments to date regarding development and application of the iterative economic
and geospatial model are listed below. Note that the model thus far has been applied to swine
waste feedstocks. Once satisfactorily applied to swine waste feedstocks, the model will be
applied to other feedstock categories.
1. We have developed updated capital cost (CAPEX) and operating cost (OPEX) curves for a
number of the major system components used to generate biogas and upgrade it into
marketable RNG, based on generally accepted systems used in North Carolina for the
capture of biogas and production of RNG. The updated cost curves are for six different types
Appendix Pg. 17
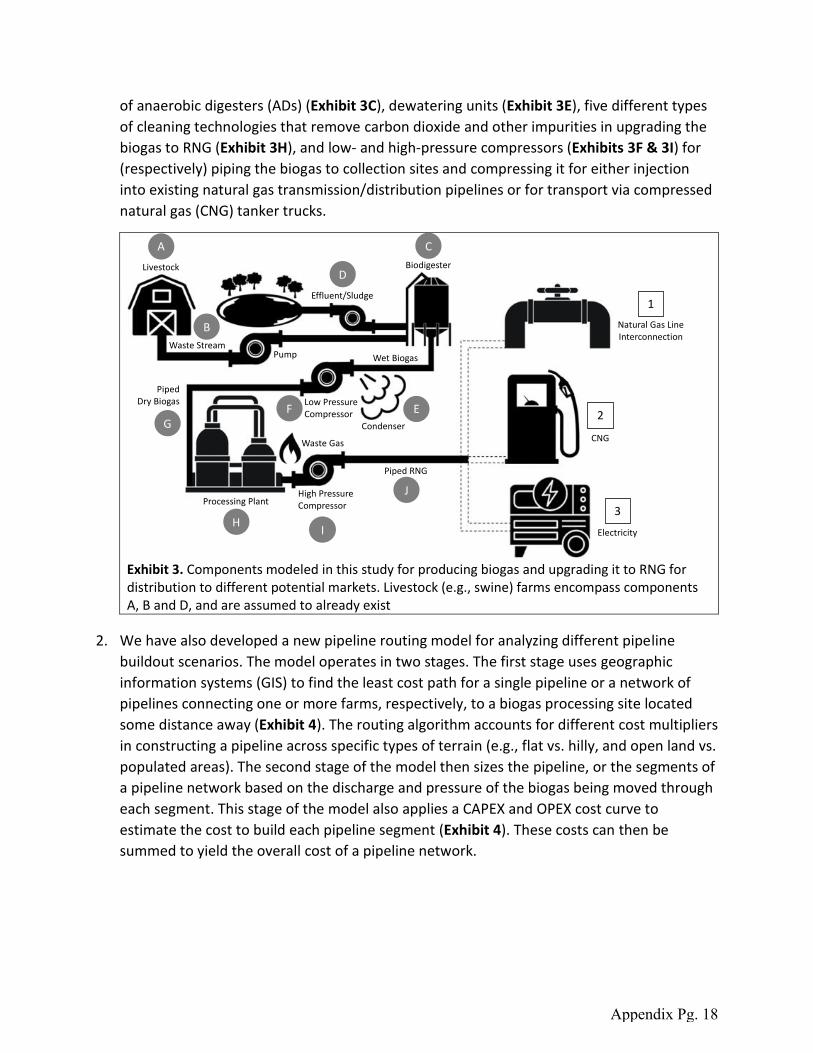
of anaerobic digesters (ADs) (Exhibit 3C), dewatering units (Exhibit 3E), five different types
of cleaning technologies that remove carbon dioxide and other impurities in upgrading the
biogas to RNG (Exhibit 3H), and low- and high-pressure compressors (Exhibits 3F & 3I) for
(respectively) piping the biogas to collection sites and compressing it for either injection
into existing natural gas transmission/distribution pipelines or for transport via compressed
natural gas (CNG) tanker trucks.
Exhibit 3. Components modeled in this study for producing biogas and upgrading it to RNG for distribution to different potential markets. Livestock (e.g., swine) farms encompass components A, B and D, and are assumed to already exist
2. We have also developed a new pipeline routing model for analyzing different pipeline
buildout scenarios. The model operates in two stages. The first stage uses geographic
information systems (GIS) to find the least cost path for a single pipeline or a network of
pipelines connecting one or more farms, respectively, to a biogas processing site located
some distance away (Exhibit 4). The routing algorithm accounts for different cost multipliers
in constructing a pipeline across specific types of terrain (e.g., flat vs. hilly, and open land vs.
populated areas). The second stage of the model then sizes the pipeline, or the segments of
a pipeline network based on the discharge and pressure of the biogas being moved through
each segment. This stage of the model also applies a CAPEX and OPEX cost curve to
estimate the cost to build each pipeline segment (Exhibit 4). These costs can then be
summed to yield the overall cost of a pipeline network.
Livestock
Waste Stream
Effluent/Sludge
Biodigester
Wet Biogas
Condenser
PipedDry Biogas
Pump
Piped RNG
Natural Gas LineInterconnection
CNG
Electricity
Waste Gas
A
B
C
D
EG
Processing Plant
H
J
Low PressureCompressorF
High PressureCompressor
I
1
2
3
Appendix Pg. 18

Exhibit 4. Example output of the pipeline routing model developed for this project. The model minimizes pipeline networking costs using GIS and commonly used gas pipeline design equations. The model is being used to explore different pipeline routing scenarios, two of which are illustrated here: (1) All swine farms shown (blue circles) are networked (tan lines) to a single interconnection site with an existing natural gas pipeline through the area (green line), and (2) farms are broken into smaller networks that link to the natural gas pipeline at multiple interconnection sites (blue lines)
Appendix Pg. 19

3. We have modularized our modeling of the biogas components and integrated these with
the two-stage pipeline model to simulate and analyze different biogas and RNG production
scenarios in North Carolina. Specific examples of the scenarios we are exploring are
schematized in Exhibit 5. They range from modeling RNG production onsite at each farm to
networking farms in different configurations so that we can identify economic tradeoffs
between the configurations. For example, one comparison we are working on now is the
cost effectiveness of dewatering the biogas at each farm before piping it under higher
pressure to a central cleaning facility versus piping the biogas while it is still wet under
lower pressures to the facility where it would be dewatered before cleaning. The former
case allows for the use of smaller diameter, lower cost pipelines but requires a costly
dewatering unit at each farm, while in the latter case, there would be only one dewatering
unit per multiple farms, but the pipelines from these farms would need to be larger
diameter and thus higher cost.
Exhibit 5. Types of biogas/RNG production scenarios being analyzed. Letters in each scenario correspond to the production steps illustrated in Exhibit 3. Single = RNG production at each farm; Roving = Production of dry biogas at each farm combined with a truck-mounted cleaning unit for producing compressed RNG; Hub & Spoke = Dedicated pipeline carrying dry biogas from each farm to a central cleaning and pipeline interconnection site; Networked = pipeline network with segments that merge to carry dry biogas from each farm to a central cleaning and natural gas pipeline interconnection site.
Preliminary results from our analysis indicates that producing RNG at all individual farms is not
an economically viable strategy. Results for the single scenario, i.e., production of RNG at each
farm followed by compression to >3,000 psi for offsite transport in tanker trucks, are
summarized in the stacked marginal supply curves shown in Exhibit 6. This scenario can have
several applications including the use of RNG as a transportation fuel in the form of compressed
Single
A J
Hub & Spoke
A F
A F
G G
G
A F
H J
Networked
Roving
H J
A F A F
A F A F
A F A F
A F
A F
A F
H J
G
Appendix Pg. 20
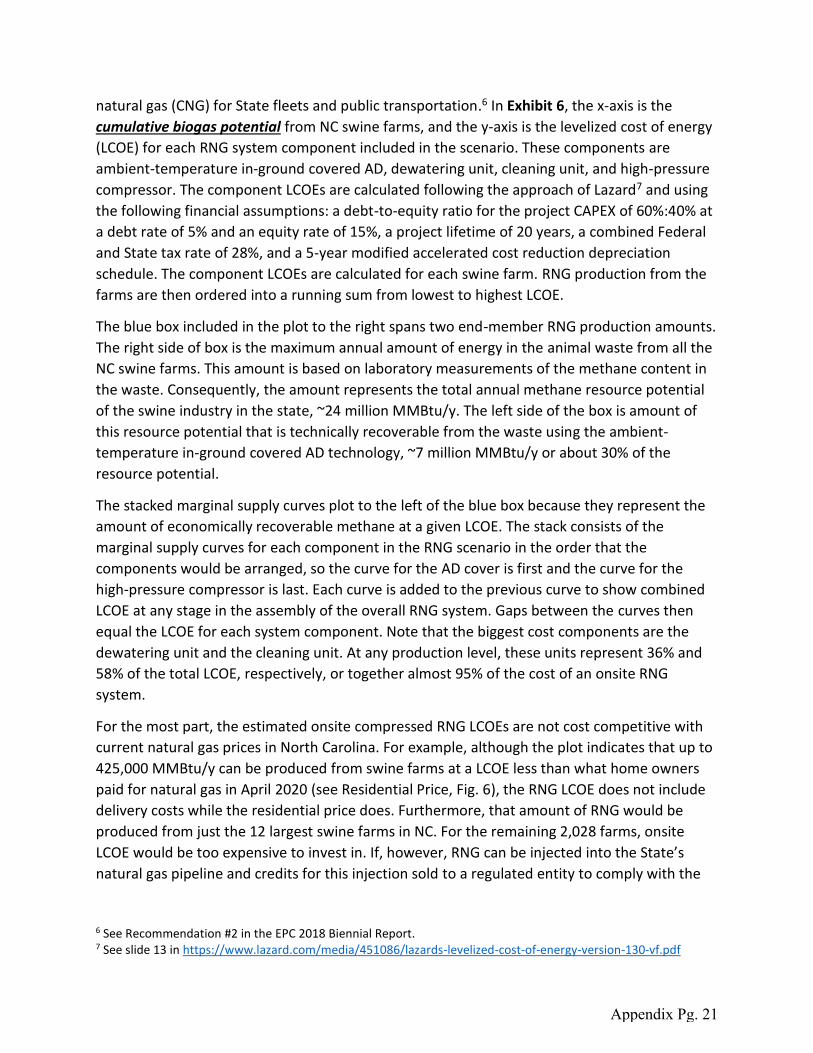
natural gas (CNG) for State fleets and public transportation.6 In Exhibit 6, the x-axis is the
cumulative biogas potential from NC swine farms, and the y-axis is the levelized cost of energy
(LCOE) for each RNG system component included in the scenario. These components are
ambient-temperature in-ground covered AD, dewatering unit, cleaning unit, and high-pressure
compressor. The component LCOEs are calculated following the approach of Lazard7 and using
the following financial assumptions: a debt-to-equity ratio for the project CAPEX of 60%:40% at
a debt rate of 5% and an equity rate of 15%, a project lifetime of 20 years, a combined Federal
and State tax rate of 28%, and a 5-year modified accelerated cost reduction depreciation
schedule. The component LCOEs are calculated for each swine farm. RNG production from the
farms are then ordered into a running sum from lowest to highest LCOE.
The blue box included in the plot to the right spans two end-member RNG production amounts.
The right side of box is the maximum annual amount of energy in the animal waste from all the
NC swine farms. This amount is based on laboratory measurements of the methane content in
the waste. Consequently, the amount represents the total annual methane resource potential
of the swine industry in the state, ~24 million MMBtu/y. The left side of the box is amount of
this resource potential that is technically recoverable from the waste using the ambient-
temperature in-ground covered AD technology, ~7 million MMBtu/y or about 30% of the
resource potential.
The stacked marginal supply curves plot to the left of the blue box because they represent the
amount of economically recoverable methane at a given LCOE. The stack consists of the
marginal supply curves for each component in the RNG scenario in the order that the
components would be arranged, so the curve for the AD cover is first and the curve for the
high-pressure compressor is last. Each curve is added to the previous curve to show combined
LCOE at any stage in the assembly of the overall RNG system. Gaps between the curves then
equal the LCOE for each system component. Note that the biggest cost components are the
dewatering unit and the cleaning unit. At any production level, these units represent 36% and
58% of the total LCOE, respectively, or together almost 95% of the cost of an onsite RNG
system.
For the most part, the estimated onsite compressed RNG LCOEs are not cost competitive with
current natural gas prices in North Carolina. For example, although the plot indicates that up to
425,000 MMBtu/y can be produced from swine farms at a LCOE less than what home owners
paid for natural gas in April 2020 (see Residential Price, Fig. 6), the RNG LCOE does not include
delivery costs while the residential price does. Furthermore, that amount of RNG would be
produced from just the 12 largest swine farms in NC. For the remaining 2,028 farms, onsite
LCOE would be too expensive to invest in. If, however, RNG can be injected into the State’s
natural gas pipeline and credits for this injection sold to a regulated entity to comply with the
6 See Recommendation #2 in the EPC 2018 Biennial Report. 7 See slide 13 in https://www.lazard.com/media/451086/lazards-levelized-cost-of-energy-version-130-vf.pdf
Appendix Pg. 21

California Low Carbon Fuel Standard mandate, then, assuming a 10% profit margin, we
estimate that it would be economic for 1,547 NC swine farms to produce RNG onsite.
In many respects, the results highlighted in Exhibit 6 represent the highest cost scenario for
RNG production in the State. By networking farms and directing their biogas production to
centrally located cleaning station sites where the biogas can be upgraded into RNG,
compressed and directly injected into existing gas pipelines, economies of scale would be
achieved that could significantly reduce the overall LCOE for RNG, though with some amount
offset due to the added cost of the pipeline network. Determining what these cost reductions
might be is what we are working on now. However, even at this point, it is clear that if the State
were to help subsidize either the overall cost of RNG production, or even just a component of
it, such as the cost to interconnect with an existing natural gas pipeline, the economics and
potential growth of RNG production in the state would receive a significant boost.
Exhibit 6. Stacked marginal supply curves for system components for producing RNG onsite at every NC swine farm and compressing it to > 3000 psi for transport offsite in CNG tanker trucks. Farm production calculated from allowable animal counts for each farm based on its regulated activity (e.g., farrow-to-wean, feeder-to-finish, etc.). State natural gas prices demarcated along the left side of the figure are from the United States Energy Information Administration for April 2020,8 while the California Low Carbon Fuel Standard price is for the week of July 20-26, 2020.9 See text for further details.
8 Retrieved from https://www.eia.gov/dnav/ng/ng_pri_sum_dcu_SNC_m.htm 9 Retrieved from https://ww3.arb.ca.gov/fuels/lcfs/credit/lrtweeklycreditreports.htm
Appendix Pg. 22
To make realistic predictions of what the state could expect to produce for the various
feedstock categories identified in the inventory, beyond swine waste, and what payments and
incentives would be needed to induce further production, the team will compare production
costs to available payments for biogas, as described above and also including payments for
electricity pursuant to North Carolina’s Renewable Energy and Energy Efficiency Portfolio
Standard, payments for carbon reductions associated with the biogas produced, either folded
into the price of the biogas or RNG, as is the case with the California Low Carbon Fuel Standard
(via a carbon intensity score) or available as a separate payment for carbon offsets, payments
pursuant to the federal Renewable Fuel Standard program, and/or payments for use as a
transportation fuel (see EPC 2018 Bioenergy Recommendation #2). The team will also consider
other uses for biogas beyond energy-related uses.
Led by East Carolina University, the team will complete its economic, environmental and
community impact analysis to determine the effects of the various biogas production options
identified by the model and overall analysis. Finally, the results of the various components of
the analysis will be used to identify goals related to biogas development, such as for the
capture and refining of biogas into RNG for distribution, the use of biogas as a renewable
transportation fuel for state fleets and/or for public transportation use, and on-site uses for
biogas where distribution is not feasible.
III. Value of the Biogas Analysis
Fully understanding North Carolina’s biomethane potential, the options for its use and the
economic, environmental and community effects related to its development is extremely
important, particularly considering the significant amount of biogas the state could produce
and the mitigating effects biogas development could have on the state’s greenhouse gas
emissions and renewable energy goals. With such information, state policy makers can
appreciate how biomethane fits into the state’s energy and climate planning processes as well
as supports those goals and how to match biogas to its best and highest uses. Furthermore,
knowing where biomethane feedstocks are located, how much, which types and the ability to
develop them, also helps policymakers, feedstock producers, developers and those entities that
will be relied upon to process and transport the gas (including, but not limited to, local
distribution companies) and the entities responsible for regulating them, leads to better long-
term planning and more efficient results. In addition, accurate information related to biogas
development costs can help feedstock owners understand whether biogas development is a
realistic option and, if so, what development will entail. Finally, knowledge about the effects of
biogas development on communities, the environment and the economy can address
uncertainties about the efficacy of biogas development and aid in abating any potential risks,
which in turn paves the way for more effective and harmonious resource use.
The research team appreciates the opportunity to comment to the draft 2020 biennial report
and looks forward to submitting its full biogas report by the end of October 2020.
Appendix Pg. 23

August 7, 2020
Via E-Mail
North Carolina Energy Policy Council 217 West Jones Street Raleigh, NC 27603 [email protected]
RE: Comments on the North Carolina Energy Policy Council’s draft 2020 Biennial Report
Dear North Carolina Energy Policy Council Members:
The Southern Environmental Law Center submits these comments on behalf of the Rural
Empowerment Association for Community Help (“REACH”), Center for Biological Diversity,
Coastal Carolina Riverwatch, Crystal Coast Waterkeeper, Food & Water Watch, North Carolina
Conservation Network, North Carolina Environmental Justice Network, Sound Rivers, Inc.,
Waterkeeper Alliance, Winyah Rivers Alliance, and White Oak-New Riverkeeper Alliance
regarding the North Carolina Energy Policy Council’s (“EPC” or “Council”) draft 2020 Biennial
Report (“the Draft Report”). The undersigned write to express deep concern regarding the Draft
Report’s recommendations related to swine-waste derived biogas development in North
Carolina. We urge the Council to revisit these recommendations and commit to fully studying
the impacts that swine waste-to-energy biogas (“biogas”) development and distribution would
have on the environment and public health of communities in North Carolina prior to pursuing
policies that would accelerate biogas development.1
1 The Southern Environmental Law Center and several of the undersigned groups submitted comments expressing concern regarding the inclusion of biogas in North Carolina’s draft Clean Energy Plan on July 30, 2019 (Attachment
Appendix Pg. 24

As an initial matter, the Draft Report puts the cart before the horse, recommending the
adoption of policies that accelerate biogas development before fully considering the costs and
benefits of such an undertaking.2 In particular, the Draft Report assumes the existence of and
recommends quantifying environmental and economic benefits associated with biogas
development, but fails to recommend further research into or consideration of the serious and
well-documented environmental and public health impacts associated with proposed biogas
development in North Carolina.
As described in detail below, the Draft Report fails to take into account three important
considerations:
the devastating impacts to the State’s air and water resources and human health
associated with biogas development and the extent to which these costs are
disproportionately borne by communities of color and low-wealth communities;
the dubious climate benefits associated with biogas compared to true clean
energy resources; and
how accelerating biogas development would impact commitments by the hog
industry to transition towards less damaging waste management practices.
Biogas development has potential to exacerbate existing environmental and public health
impacts associated with the hog industry and generate additional, independent water and air
quality impacts. The Council must not support policies that accelerate development of biogas
1). Many of the undersigned groups also authored a 2018 Biogas Position Statement taking the position that all swine-derived biogas operations must adopt environmentally superior technologies (Attachment 2). 2 ENERGY POLICY COUNCIL 2020 BIENNIAL REPORT: DRAFT FOR PUBLIC COMMENT 13 (July 2020) [hereinafter “Draft Report”] (“The following actions are recommended to further and more comprehensively develop the State’s biogas resource potential”).
Appendix Pg. 25
without fully and accurately analyzing the significant economic, social, and environmental costs
of doing so.
I. Any environmental benefits from biogas production and distribution areoutweighed by significant environmental and public health impacts
The Draft Report discusses at length the “potential environmental benefits” of biogas
production, but altogether fails to consider potential environmental costs.3 The Draft Report’s
sole mention of negative environmental and public health impacts comes in a footnote, where
stakeholders’ concerns about air and water pollution are summarily dismissed with a vague
reference to “add-on treatment technologies” that could be used to mitigate these impacts.4
Given the serious and well-documented environmental and public health impacts caused by
swine-derived biogas development and the lagoon and sprayfield system on which it relies, and
the fact that these impacts disproportionately affect communities of color and low wealth
communities, the Draft Report’s failure to meaningfully consider the costs of biogas
development is unjustifiable.
A. The lagoon and sprayfield system imposes significant environmental and publichealth impacts on North Carolina communities
Biogas is produced at industrial hog operations by installing covers—most commonly
anaerobic digesters—over existing hog waste lagoons.5 In North Carolina, these lagoons are part
of the outdated and environmentally unsustainable lagoon and sprayfield system used for animal
waste management. Under this system, hog feces and urine are stored in often unlined and open-
air pits and the liquid waste is subsequently sprayed onto nearby cropland. This waste
3 See Draft Report at 14, 27-30. 4 Id. at 28, n. 16. 5 See, e.g., AgSTAR: Livestock Anaerobic Digester Database, EPA (Jan. 2019), https://www.epa.gov/agstar/livestock-anaerobic-digester-database (noting that of the 10 voluntarily reported biogas projects in North Carolina, six use covered lagoon technology).
Appendix Pg. 26
management system pollutes the State’s waterways, air, and the ecosystems that rely on them;
harms the public health of communities that live nearby or downstream of industrial hog
operations; and creates noxious odors that impact the livelihoods of people living near these
operations, with a disproportionate impact on Native Americans, Latinx, and Black Americans.6
Liquid swine waste can intrude into groundwater via cracks in lined lagoons, or by
seeping directly through lagoons.7 When wastewater from hog waste lagoons is sprayed on
fields, over-application or improper irrigation techniques can result in nutrient-laden swine waste
discharging directly into nearby streams and rivers.8 Once hog waste infiltrates surface or
groundwater, the large amounts of nitrogen and phosphorus contained in the waste can wreak
ecological havoc and cause harmful algal blooms; fish kills; acidification of soils and aquatic
ecosystems; heavy metal accumulation in sediments, aquatic life, and plant and animal tissue;
excessive salt buildup; eutrophication of rivers and estuaries; and consequent species and
ecological community changes.9
The human health impacts of the lagoon and sprayfield waste management system are
similarly devastating. A 2018 study published in the North Carolina Medical Journal found that
6 Letter from Lilian Dorka, Director of External Civil Rights Compliance with U.S. Envtl. Protection Agency, to William Ross, Acting Secretary of N.C. DEQ (Jan. 12, 2017), https://www.epa.gov/sites/production/files/2018-05/documents/letter_of_concern_to_william_g_ross_nc_deq_re_admin_complaint_11r-14-r4_.pdf (expressing “deep concern about the possibility that African Americans, Latinos, and Native Americans have been subjected to discrimination as the result of NC DEQ’s” permitting system for industrial hog operations) [hereinafter “Letter from Lilian Dorka”); See ROBBIN MARKS, NAT. RES. DEF. COUNCIL, CESSPOOLS OF SHAME: HOW FACTORY FARM
LAGOONS AND SPRAYFIELDS THREATEN ENVIRONMENTAL AND PUBLIC HEALTH 33 (2001), https://www.nrdc.org/sites/default/files/cesspools.pdf; see also Steve Wing et al., Environmental Injustice in North Carolina’s Hog Industry, 108 ENVTL. HEALTH PERSP. 225, 225 (2000) (noting that this is a particular problem in eastern North Carolina, where a high water table allows for easy groundwater intrusion). In fact, just a couple months ago 3.5 million gallons of hog waste spilled from a hog lagoon in Sampson County. Lisa Sorg, Partial hog lagoons breach spills 3 million gallons of feces, urine in Sampson County, N.C. POLICY WATCH (June 15, 2020) http://pulse.ncpolicywatch.org/2020/06/15/partial-hog-lagoon-breach-spills-3-million-gallons-of-feces-urine-in-sampson-county/. 7 See MARKS, supra note 7, at 28; see also Wing, supra note 6. 8 MARKS, supra note 7, at 28.
9 Id.
Appendix Pg. 27
residents who live near industrial hog operations in eastern North Carolina that use the lagoon
and sprayfield system have higher death rates from causes such as anemia, kidney disease,
tuberculosis, and low birth weight than residents who live further away from such operations.10
Researchers noted that these impacts are not a result of multiple demographic, behavioral, or
socioeconomic factors present, but rather are “due to the additional impact of multiple industrial
hog facilities located in this area.”11 Other research found that the same heavy metal and salt
accumulation that affects wildlife can cause cancer, hair loss, liver dysfunction, and anemia in
humans.12 Ammonia emissions from lagoons cause eye irritation and are partially responsible
for noxious smell.13 Gaseous hydrogen sulfide also causes eye irritation, in addition to irritation
of the nose and throat, as well as loss of consciousness, seizures, and even death.14 Airborne
particulate matter and swine waste effluent are also associated with a host of respiratory
ailments.15 Near constant exposure to pollution and odors are linked to mental health impacts,
such as greater levels of self-reported depression and anxiety among residents living near these
facilities.16
10 Julia Kravchenko et al., Mortality and Health Outcomes in North Carolina Communities Located in Close Proximity to Hog Concentrated Animal Feeding Operations, 79 N.C. MED. J. 278, 278 (2018). 11 Id. at 286. 12 MARKS, supra note 7, at 32–33. 13 Id. at 18. As mentioned below, there is evidence that the anaerobic digestion required to produce biogas increases output of ammonia from waste lagoons. 14 Id. 15 See, e.g., Peter S. Thorne, Environmental Health Impacts of Concentrated Animal Feeding Operations: Anticipating Hazards--Searching for Solutions, 115(2) ENVTL. HEALTH PERSP. 296, 296–97 (2007). 16 Susan S. Schiffman et al., The Effect of Environmental Odors Emanating from Commercial Swine Operations on the Mood of Nearby Residents, 37(4) BRAIN RES. BULL. 369, 371 (1995). Communities located near hog operations also experience social and economic burdens. In a Letter of Concern sent to North Carolina’s Department of Environmental Quality in 2017, the United States Environmental Protection Agency (“EPA”) noted lost opportunities for recreation in and around nearby ponds streams; a “loss of community” as young people leave their blighted hometowns and do not and return; and the lost enjoyment of outdoor gatherings and celebrations as people are increasingly forced to move their lives indoors to avoid overwhelming, nauseating odors from nearby hog operations. Letter from Lilian Dorka, supra note 6.
Appendix Pg. 28

B. Swine-waste derived biogas development will exacerbate the lagoon andsprayfield system’s environmental and public health impacts
Biogas development will only exacerbate the environmental and public health issues
discussed above. Biogas is produced from animal waste lagoons through the process of
anaerobic digestion, which causes methane to build up under a lagoon cover.17 Hog waste
lagoon covers cause the liquid manure stored in a covered facility to have 3.5 times more
nitrogen compared to manure slurry in an open lagoon.18 This means that less liquid waste from
a covered lagoon is needed to fertilize crops relative to an uncovered lagoon.19 When a covered
lagoon’s contents are subsequently sprayed onto fields, the risk of over-application of nitrogen is
heightened, increasing the risk of excess pollution in nearby surface waters and groundwater.
Furthermore, the risks posed by leakage from both lined and unlined lagoons increase as the
waste within the lagoons becomes increasingly concentrated by anaerobic digestion.
At best, capping hog waste lagoons for biogas production may marginally reduce the
odors which stem from hog waste lagoons. However, none of the other air quality impacts of the
lagoon and sprayfield system would be mitigated by capping lagoons. Confinement barns,
where swine are raised, will continue to emit airborne contaminants, including gases, odors and
microorganisms stemming from manure decomposition even when lagoons are capped with
17 Anaerobic Digestion and its Applications, U.S. ENVTL. PROTECTION AGENCY (Oct. 2015), https://www.americanbiogascouncil.org/pdf/AD%20and%20Applications-finalcls.pdf; How Does Anaerobic Digestion Work?, U.S. ENVTL. PROTECTION AGENCY, AGSTAR, https://www.epa.gov/agstar/how-does-anaerobic-digestion-work. 18 S.G. LUPIS, N. EMBERTSON & J.G. DAVIS, COLORADO STATE UNIVERSITY EXTENSION, BEST MANAGEMENT
PRACTICES FOR REDUCING AMMONIA EMISSIONS, https://extension.colostate.edu/topic-areas/agriculture/best-management-practices-for-reducing-ammonia-emissions-lagoon-covers-1-631b/. 19 Joe H. Harrison et al., Transformation and Agronomic Use of Nutrients from Digester Effluent, EXTENSION.ORG (May 17, 2013), http://articles.extension.org/pages/67900/transformation-and-agronomic-use-of-nutrients-from-digester-effluent.
Appendix Pg. 29

anaerobic digesters.20 Odors from the land application of swine waste will also continue to pose
the same risks to human health when lagoons are covered.
Without the inclusion of additional technology—such as advanced denitrification systems
or barn scrapers, for example—covering hog waste lagoons does not improve, and will in fact
exacerbate and entrench the lagoon and sprayfield system’s devastating environmental and
public health impacts.
C. Biogas upgrading and transport infrastructure negatively impacts air and waterquality
Biogas infrastructure poses distinct risks to air and water quality above and beyond those
generated by the hog industry’s waste management practices. Both biogas upgrading facilities,
which process the methane from individual hog operations, and individual hog operations emit
significant quantities of SO2,21 a precursor to the formation of fine particulate matter, or
PM2.5.22 PM2.5 can be harmful to children, people with asthma,23 and those with compromised
respiratory systems.24 These impacts are especially alarming in this age of widespread
respiratory illness. Research shows that people who live for years in counties with high levels
of fine particulate matter pollution are more likely to experience respiratory health problems, and
more likely to die from COVID-19, than people who live in regions with even slightly reduced
20 See, e.g., Kristen James et. al., Characterizing Ammonia Emissions From a Commercial Mechanically Ventilated Swine Finishing Facility and an Anaerobic Waste Lagoon in North Carolina, 3 ATMOSPHERIC POLLUTION
RESEARCH 279, 283–84 (2012).
21 See, e.g., BF Grady Rd. Revised Air Quality Permit Application, App. B at 5 (“Form B”) (Feb. 26, 2020) (detailing the facility’s expected and potential emissions of criteria air pollutants). 22 “Sulfur Dioxide Basics,” EPA, https://www.epa.gov/so2-pollution/sulfur-dioxide-basics#effects. 23 See S. Envtl. Law Ctr., Comments on Draft Air Quality Permit Number 10644R00 for Align Renewable Natural Gas, LLC Grady Road Upgrading Facility, at 30 (June 16, 2020) [on file with SELC]. 24 CARRIE HRIBAR, NAT’L ASSOC. OF LOCAL BDS. OF HEALTH, UNDERSTANDING CONCENTRATED ANIMAL FEEDING
OPERATIONS AND THEIR IMPACT ON COMMUNITIES 6 (2010) (“There is consistent evidence suggesting that factory farms increase asthma in neighboring communities.”).
Appendix Pg. 30

PM2.5 emissions.25 Furthermore, biogas development is North Carolina would be located in
predominantly communities of color, potentially further compromising air quality for
populations that are already vulnerable to respiratory disease.26
In addition, pipelines used to transport raw biogas and processed natural gas may have
significant local water quality impacts. Biogas development projects require the construction of
miles of pipeline to transport biogas from individual hog facilities to upgrading facilities and
from upgrading facilities to existing natural gas distribution networks.27 These pipelines will
necessarily cross streams and headwater areas. Stream crossings and impacts to streambanks and
upland areas from pipeline and access road construction can cause substantial erosion and
sedimentation, increase turbidity, and harm aquatic life.28 Natural gas pipeline construction and
operation may also compromise important wetland functions, lead to contamination of
waterways due to petroleum product spills, alter ground and surfacewater flow, and cause
exposed rocks to leach acid or metals into waterways.29
25 Air Pollution Linked With Higher COVID-19 Death Rates, HARV. T.H. CHAN SCH. OF PUB. HEALTH (updated May 5, 2020), https://www.hsph.harvard.edu/news/hsph-in-the-news/air-pollution-linked-with-higher-covid-19-death-rates/. This concern is underscored by the fact that Duplin and Sampson Counties have COVID-19 infection rates that are far higher than the North Carolina average. Duplin County’s rate is 206.5 per 10,000 people and Sampson County’s rate is 122.6 per 10,000. For frame of reference, Mecklenberg County, which has been considered the epicenter of the disease in North Carolina, has an infection rate of only 65.9 per 10,000 people. Adam Wagner and David Raynor, “The White House is worried about COVID-19 in these North Carolina counties,” THE NEWS &OBSERVER (Raleigh) (June 10, 2020), https://www.newsobserver.com/news/coronavirus/article243421351.html. 26 See Gregorio A. Millett et al., Assessing differential impacts of COIVD-19 on black communities, Annals of Epidemiology, 37-44 (July 2020) https://www.sciencedirect.com/science/article/pii/S1047279720301769?via%3Dihub. 27 See, e.g. Order Approving Participation in Pilot Program with Conditions, N.C. Utilities Comm., Dkt. No. G-9, Sub 764 at 2 (Apr. 3, 2020) (explaining that the Align RNG Grady Road biogas project would require 30 miles of gathering pipeline to interconnect each participating hog operation to the centralized gas upgrading facility). 28 Meghan Betcher et al, PIPELINE IMPACTS TO WATER QUALITY: DOCUMENTED IMPACTS AND RECOMMENDATIONS
FOR IMPROVEMENTS 1-3 (Aug. 21, 2019) https://www.tu.org/wp-content/uploads/2019/10/Pipeline-Water-Quality-Impacts-FINAL-8-21-2019.pdf. 29 Id.
Appendix Pg. 31

The Draft Report does not consider any of these additional ways in which biogas
development would adversely impact the environment and public health of communities in North
Carolina.
II. Swine-waste based biogas development is not a climate change solution
Climate change is a pressing issue which requires a rapid transition to zero-emission
energy.30 Biogas development, however, produces potent greenhouse gasses (“GHGs”), further
entrenches agricultural practices that are a significant driver of climate change, and is
substantially more expensive and less scalable than true clean energy resources. Therefore,
contrary to the Draft Report’s suggestion,31 swine-derived biogas development cannot be relied
on to reduce North Carolina’s GHG emissions.
The Draft Report acknowledges that biogas is predominately made up of methane,32 a
potent GHG that contributes significantly to climate change.33 Covered animal waste lagoons
may produce methane at a higher rate than uncovered lagoons.34 Up to 3.1% of methane buildup
under these covers is lost to the atmosphere, severely limiting, if not eliminating, biogas’s
supposed climate benefits.35 Furthermore, adding a cover to a waste lagoon may increase the
30 See IPCC Special Report: Global Warming at 1.5 C, 12 (Oct. 2018) https://www.ipcc.ch/sr15/ (discussing range of dates by which net zero carbon emissions must be achieved to limit global temperature rise to 1.5 degrees Celsius). 31 Draft Report at 27. 32 Id. 33 EPA, Overview of Greenhouse Gases; EARTHJUSTICE & SIERRA CLUB, RHETORIC VS. REALITY: THE MYTH OF
‘RENEWABLE NATURAL GAS’ FOR BUILDING DECARBONIZATION 5 (July 2020) [hereinafter “Building Decarbonization Report]. 34 See DARMAWAN PRASODJO ET AL., NICHOLAS INST. OR ENVTL. POLICY SOLUTIONS, A SPATIAL-ECONOMIC
OPTIMIZATION STUDY OF SWINE WASTE-DERIVED BIOGAS INFRASTRUCTURE DESIGN IN NORTH CAROLINA A-34 (2013). 35 See, e.g., Thomas K. Flesch, Raymond L. Desjardins, & Devon Worth, Fugitive Methane Emissions from an Agricultural Biodigester, 35 BIOMASS & BIOENERGY 3927, 3927 (2011). This figure only captures leakage from anaerobic digesters alone, and does not include any additional leakage associated with the transport and storage of biogas.; see William H. Schlesinger, “Natural Gas or Coal: It’s All About the Leak Rate,” NATURE.ORG (June 24, 2016), https://blog.nature.org/science/2016/06/24/natural-gas-coal-leak-rate-energy-climate/ (explaining that “any leakage rate above about 1 percent of gross production negates the advantages of [using methane versus coal] with
Appendix Pg. 32

amount of methane being produced and then leaks some percentage of that greater amount of
methane into the atmosphere, contributing to climate change.36 Methane leaks occur throughout
the natural gas supply chain, which suffers a total leakage rate of 2.3%.37 Researchers have
found that regulators and the natural gas industry consistently underestimate or under-measure
the methane leakage rate.38
Moreover, the Draft Report’s claim that biogas is “particularly important for controlling
greenhouse gas (GHG) emissions and meeting carbon reduction goals because its capture avoids
the release of GHGs that would otherwise occur during the breakdown of organic waste and
other organic matter” is misleading.39 Emissions from industrial hog farms at their present scale
are not inevitable or indispensable—different waste management practices could potentially
eliminate or mitigate the emissions produced by current industry practices.40 For example,
operators could maintain herds at more manageable levels, avoid producing waste in excess of
agronomic rates for nearby crops, maintain pasture-based operations, or use dry handling of
animal waste. All of these approaches could avoid methane emissions in the first instance. The
Draft Report’s assumption that current, emissions-heavy waste-management practices will
remain, potentially produce more methane by capping existing lagoons, and then be credited for
somewhat mitigating their destructive practices through GHG capture is not a climate solution.
respect to mitigating climate change” primarily due to the higher global warming potential of methane.). Ammonia (NH3) emissions also increase during the process of anaerobic digestion. Michael A. Holly et al., Greenhouse Gas and Ammonia Emissions From Digested and Separated Dairy Manure During Storage and After Land Application, 239 AGRIC., ECOSYSTEMS, & ENVT. 410, 418 (2017). “[anaerobic digestion] could also significantly increase NH3 emissions from manure . . .”). 36 See PRASODJO, supra note 34, at A-33-34. 37 Building Decarbonization Report, supra note 33, at 5. 38 Id. 39 Id. 40 Id.
Appendix Pg. 33
Finally, biogas development is not competitive with true clean energy resources in terms
of potential to reduce emissions or scalability. Even according to the natural gas industry, just
13% of total natural gas demand could be met by renewable natural gas.41 Biogas is
prohibitively expensive for home use compared to both other sources of natural gas.42
Livestock-derived biogas is up to four times as expensive as landfill biogas and as much as
twenty times more expensive than shale gas.43 Thus, any development of natural gas
infrastructure subsidizes and further entrenches reliance on environmentally destructive fracked
natural gas.44 Research indicates that moving away from fuel combustion and towards
widespread electrification of buildings—powered by true clean energy resources like solar and
wind—is a far more cost-effective and long-term climate solution.45 While the Draft Report
evaluates the carbon intensity of various energy fuels, it never compares the effectiveness, from
an emissions reduction perspective, of biogas relative to solar or wind energy.46 Before
endorsing biogas development, the Council should consider whether greater investment in solar
and wind energy would more effectively and efficiently meet the State’s carbon reduction goals.
III. Any state policies supporting biogas development must be contingent upon theadoption of Environmentally Superior Technologies (“ESTs”)
Any policies the EPC recommends to accelerate development of biogas must not
exacerbate, and certainly not add, to the environmental and public health impacts caused by the
41 See AM. GAS. FOUND., RENEWABLE SOURCES OF NATURAL GAS: SUPPLY AND EMISSIONS REDUCTION
ASSESSMENT 2 (Dec. 2019). The report describes a “high resource” scenario as producing 3,780 trillion Btu annually. Misleadingly, it expresses this as a percentage of U.S. residential natural gas demand, which has averaged 4,846 Btu over the last 10 years. But EPA estimates total U.S. natural gas consumption at approximately 31,000 Btu as of 2018. “Natural Gas Explained,” U.S. ENERGY INFO. ADMIN. https://www.eia.gov/energyexplained/natural-gas/use-of-natural-gas.php. 42 Building Decarbonization Report, supra note 33, at 13. 43 See id. (noting approximate shale gas costs of $2/Btu, landfill gas costs of $10–20/Btu, and dairy biogas costs of $40/Btu). 44 Id. at 18-24. 45 Id.; see Goskin Kavlak et al., Evaluating the Causes of Cost Reduction in Photovoltaic Modules, 123 ENERGY
POL’Y 700, 708. 46 Draft Report at 29.
Appendix Pg. 34
hog industry.47 Therefore, any incentives for biogas development must be contingent upon
adoption of ESTs—waste management technologies that eliminate, or at least substantially
mitigate, the environmental and public health burdens that the lagoon and sprayfield system
disproportionately imposes on communities of color and low-wealth communities.48
Furthermore, policies related to biogas development must not compromise the binding
commitments Smithfield Foods, Inc. (“Smithfield”) has already made to eliminate its reliance on
primitive lagoon and sprayfield waste management practices.49 Smithfield-owned facilities
would be significant contributors to North Carolina’s biogas footprint,50 but Smithfield has yet to
satisfy the terms of the 2000 Smithfield Agreement in which it promised to adopt cleaner waste
management technologies—Environmentally Superior Technologies (“ESTs”).51 Allowing
Smithfield and its subsidiaries to alter their waste management practices to accommodate biogas
production without adopting cleaner waste management technologies—and in fact worsening air
and water impacts—would undermine the Smithfield Agreement and exacerbate the
environmental and public health impacts the Agreement was intended to address.
Requiring biogas operations to adopt ESTs could make biogas production less harmful to
the environment and to communities. For example, barn-scraper technology used by Smithfield
in other states could reduce reliance on the lagoon and sprayfield system, decrease odor, and
47 See supra Part I. 48 See supra note 1, Community Biogas Position Statement. 49 See Agreement between the Atty. Gen. of N. Carolina and Smithfield Foods, Inc., and Subsidiaries, at 5–6 (July 25, 2020) (binding Smithfield to “propose[] measures for closure of the lagoons on Company-owned Farms”) [hereinafter “Smithfield Agreement”]. 50 John Downey, How Dominion Energy, Smithfield Foods plan to make NC a leader in renewable natural gas, CHARLOTTE BUS. J. (Dec. 2, 2019) https://www.bizjournals.com/charlotte/news/2019/12/02/how-dominion-energy-smithfield-foods-plan-to-make.html. 51 Smithfield Agreement, supra note 49, at 7–12.
Appendix Pg. 35
increase the quality of biogas produced.52 The State of Missouri required Smithfield to install
barn scrapers in all of its Class A barns in the state by 2012.53 Since barn scraper technology
was installed on Smithfield’s Missouri barns, the state’s hog population has continued to grow,
demonstrating that widespread adoption of this technology is not only possible, but potentially
economically feasible.54 Smithfield itself has since described scrapers as key to its biogas
operations in Missouri.55 Though the barn scraper technology has not been considered or
adopted as an EST under the Smithfield Agreement, its successful widespread adoption in
Missouri is instructive. Barn scrapers have already been installed at Storms Farms, a hog
operation in North Carolina, which has cut its lagoon footprint from six lagoons to just one after
installing barn scrapers.56
To be clear, Smithfield—not its contract farmers or North Carolina taxpayers—are
responsible for financing the adoption of ESTs for hog operations being retrofitted for biogas
production. Smithfield—not its contract farmers—agreed to adopt ESTs in 2000.57 Smithfield
must not be allowed to pass the costs of complying with its contractual commitments onto the
people of North Carolina.
52 TENG TEEH LIM & DAVID B. PARKER, AN AUTOMATED SCRAPER SYSTEM FOR SWINE CONFINEMENT FACILITIES 1 (October 2011); see also Melissa Dewey Brumback, “Turning Manure into Megawatts,” Construction Law in North Carolina (Dec. 17, 2014), https://constructionlawnc.com/2014/12/17/manure-into-megawatts/; SMITHFIELD FOODS,INC., ANNUAL REPORT 29 (2012), https://www.smithfieldfoods.com/pdf/past-reports/smithfield-integrated-report-2012.pdf (“Our new barn scraper technology produces hog manure highly suitable for conversion to energy due to its reduced water content, making our farms attractive partners for energy developers.”). 53 “Missouri Farm Advances Next Generation Technology,” NAT’L HOG FARMER (Jan. 13, 2011), https://www.nationalhogfarmer.com/environmental-stewardship/missouri-farm-advances-next-generation-0113. 54 Christopher Walljasper, Large animal feeding operations on the rise, MIDWEST CENTER FOR REPORTING (June 7, 2018) https://investigatemidwest.org/2018/06/07/large-animal-feeding-operations-on-the-rise/. 55 See “Missouri Farm Advances Next Generation Technology”, supra note 53. 56 Scott Bigelow, “Farm finds power in hogs,” Bladen Journal/Civitas Media (April 28, 2017), https://www.bladenjournal.com/news/11803/farm-finds-power-in-hogs. 57 Smithfield Agreement, supra note 44, at 3 (differentiating between Smithfield—a party to the Agreement—and Company-owned Farms and Contract Farms, which Smithfield controls).
Appendix Pg. 36

IV. Conclusion
The undersigned appreciate this opportunity to provide comments on the draft Biennial
Report. The North Carolina Legislature is the “trustee for future generations,” responsible for
“assur[ing] that an environment of high quality will be maintained for the health and well-being
of all.”58 With this responsibility in mind, and because biogas development would further
entrench industry practices that harm the environment and public health of North Carolinians
while failing to make significant progress towards addressing the climate crisis, we urge the
Council to reconsider its recommendations regarding biogas development and fully evaluate the
economic, environmental, and social costs of biogas development.
Sincerely,
Blakely Hildebrand Maia Hutt Staff Attorney Associate Attorney
Southern Environmental Law Center
Submitted on behalf of:
Devon Hall, Executive Director, Rural Empowerment Association for Community Help Hannah Connor, Senior Attorney, Center for Biological Diversity Lisa Rider, Executive Director, Coastal Carolina Riverwatch Larry Baldwin, Waterkeeper, Crystal Coast Waterkeeper Krissy Kasserman, Factory Farm Organizing Manager, Food & Water Watch Sherri White-Williamson, Environmental Justice Policy Director, North Carolina Conservation Network Acadia Cadogan, Communications Manager, North Carolina Environmental Justice Network Jillian Howell, Pamlico Tar-Riverkeeper, Sound Rivers Matthew Starr, Upper Neuse Riverkeeper, Sound Rivers Katy Hunt, Lower Neuse Riverkeeper, Sound Rivers Will Hendrick, Senior Attorney, Waterkeeper Alliance Christine Ellis, Executive Director, Winyah Rivers Alliance Larry Baldwin, Advocacy Director, White Oak-New Riverkeeper Alliance
58 State Environmental Policy Act § 3, N.C. GEN. STAT. § 113A-3.
Appendix Pg. 37

Attachment 1
Appendix Pg. 38

July 30, 2019
Via email Sushma Masemore Deputy Assistant Secretary for Environment & State Energy Director N.C. Department of Environmental Quality217 West Jones StreetRaleigh, NC [email protected]
Re: Comments Regarding the Inclusion of Swine Waste-to-Energy in the State Clean Energy Plan
Dear Ms. Masemore,
The undersigned organizations offer these comments to the N.C. Department of Environmental Quality (“DEQ” or “agency”) opposing the inclusion of biogas1 that is the product of swine waste-to-energy projects that fail to meet environmental performance criteria2 necessary to address longstanding environmental, public health, and racial equity concerns about swine waste management in the N.C. Clean Energy Plan (“CEP” or “the Plan”). Thank you for the opportunity to offer these public comments.
DEQ has articulated a vision for an energy system that is “clean, equitable, modern, resilient, and efficient; in addition to being safe, affordable, and reliable.”3 In describing specific components of the CEP, DEQ suggested that renewable biogas—which inaccurately describes,
1 Biomethane is also under consideration for inclusion in the CEP. For the purposes of this letter, “biogas” refers to both biogas and biomethane and is specific to swine waste-to-energy. 2 State law currently prohibits the construction of new industrial swine operations or the modification of existing industrial swine operations unless the new or modified operations meet environmental performance standards. See N.C. Gen. Stat. § 143-215.10I(b). These standards require operations to eliminate the following: discharges of waste to surface water through direct discharges or through groundwater, atmospheric emission of ammonia, emissions of odors, the release of disease causing vectors and pathogens, and nutrient and heavy metal contamination of soil and groundwater. Id. Anaerobic digesters on their own do not meet these environmental performance standards. See, e.g., Dr. C.M. Williams, Presentation: Technology Options for Capturing Greenhouse Gases and DestroyingPathogens in the AFO/CAFO Waste Stream (Oct. 27-28, 2016) https://ehs.duke.edu/2016/wp-content/uploads/sites/3/2016/09/Williams.pdf (describing several technologies that meet theenvironmental performance standards and noting that anaerobic digestion, on its own, does not meet theperformance standards).3 N.C. Dep’t of Envt’l Quality, North Carolina Clean Energy Plan Workshop 5 Presentation at 9 (June 26,2019) https://files.nc.gov/ncdeq/climate-change/clean-energy-plan/CEP-Combined-Workshop-5-powerpoint.pdf (listing the vision, pathway, and definition of clean energy).
Appendix Pg. 39
Ms. Sushma Masemore July 30, 2019 Page 2
but may be interpreted to include swine waste-to-energy—may be part of the CEP if it is a “lower carbon alternative” that is recovered with “environmentally sustainable management practices.”4 Biogas does not fit within the State’s articulated vision for the CEP because it is neither clean nor equitable nor resilient. Moreover, biogas is not a “lower carbon alternative” that is recovered with “environmentally sustainable management practices.” To the contrary, the most widely-used biogas technology relies on the primitive lagoon and sprayfield waste management system at industrial hog operations, which has a devastating impact on the environment and public health for communities living nearby and downstream from industrial hog operations. In this letter, we highlight ways in which biogas production is inconsistent with DEQ’s vision for the CEP and detail the ways in which it intensifies environmental harms.
Indeed, while we appreciate Governor Cooper’s efforts to respond to the challenges presented by climate change, we urge the State to address these challenges by encouraging investment in clean energy technology that addresses—rather than exacerbates—environmental and public health harms. Growth in biogas production has the potential to further entrench the use of the outdated lagoon and sprayfield system as a mainstay of North Carolina agriculture—a system that exacerbates environmental, civil rights and public health harms. For all of the reasons discussed below, the State should exclude biogas from the CEP where inadequate environmental protections are in place to address the myriad problems identified with the lagoon and sprayfield system.
I. The Lagoon and Sprayfield System Harms Communities and the Environment
The lagoon and sprayfield waste management system is a system whereby hog feces and urine are stored in often unlined pits and the liquid waste is subsequently sprayed onto nearby cropland. This waste management system pollutes our streams, waterways, and the ecosystems that rely on them; harms the public health of communities that live nearby or downstream of industrial hog operations; and creates noxious odors that impact the livelihoods of people living near these operations, with a disproportionate racial impact on Native Americans, Latinx, and African Americans.5 The primary means of producing biogas at industrial hog operations is the installation of anaerobic digesters over hog waste lagoons.6
4 N.C. Dep’t of Envt’l Quality, Clean Energy Plan Stakeholder Workshop 5 Overview of Clean Energy Plan Vision and Guiding Structure video, https://deq.nc.gov/energy-climate/climate-change/nc-climate-change-interagency-council/climate-change-clean-energy-12 (last visited July 25, 2019) [hereinafter CEP Workshop 5 video). 5 Letter from Lilian Dorka, Director of External Civil Rights Compliance with U.S. Envt’l Protection Agency, to William Ross, Acting Secretary of N.C. DEQ (Jan. 12, 2017), https://www.epa.gov/sites/production/files/2018-05/documents/letter_of_concern_to_william_g_ross_nc_deq_re_admin_complaint_11r-14-r4_.pdf (expressing “deep concern about the possibility that African Americans, Latinos, and Native Americans
Appendix Pg. 40

Ms. Sushma Masemore July 30, 2019 Page 3
The lagoon and sprayfield waste management system fails to meet statutory environmental performance standards required for all new or modified industrial hog operations in the State; these performance standards require facilities to eliminate air and water pollution, noxious odors, and other harmful impacts of this waste management system.7 Liquid swine waste can intrude into groundwater via cracks in lined lagoons, or by seeping directly through unlined lagoons.8 When lagoon wastewater is sprayed on agricultural fields, over-application or improper techniques can result in nutrient-laden swine waste discharging directly into nearby streams and rivers.9 Once hog waste infiltrates surface or groundwater, the large amounts of nitrogen and phosphorus contained in the waste can wreak ecological havoc and cause harmful algal blooms; fish kills; acidification of soils and aquatic ecosystems; heavy metal accumulation in sediments, aquatic life, and plant and animal tissue; excessive salt buildup; eutrophication of rivers and estuaries; and consequent species and ecological community changes.10
The human impacts of the lagoon and sprayfield waste management system are similarly devastating. A 2018 study published in the North Carolina Medical Journal found that residents who live near industrial hog operations that use the lagoon and sprayfield system have higher death rates from causes such as anemia, kidney disease, tuberculosis and low birth weight than residents who live further away from such operations.11 The study also found higher rates of low birth weight and infant hospitalization among residents who live near industrial hog operations.12 Duke researchers noted that these impacts are not the cause of multiple demographic, behavioral, or socioeconomic factors present, but rather are “due to the additional impact of multiple industrial hog facilities located in this area.”13 Other research found that the same heavy metal and salt accumulation that affects wildlife can cause cancer, hair loss, liver dysfunction, and anemia.14 Ammonia emissions from lagoons cause eye irritation and are partially responsible for
have been subjected to discrimination as a result of the NC DEQ’s” permitting system for industrial hog operations). 6 See, e.g., AgSTAR: Livestock Anaerobic Digester Database, EPA (Jan. 2019), https://www.epa.gov/agstar/livestock-anaerobic-digester-database (noting that of the 10 voluntarily reported biogas projects in North Carolina, six use covered lagoon technology). 7 See N.C. Gen. Stat. § 143-215.10I(b). 8 See Robbin Marks, Cesspools of Shame: How Factory Farm Lagoons and Sprayfields Threaten Environmental and Public Health, NAT. RESOURCE DEF. COUNCIL 33 (2001), https://www.nrdc.org/sites/default/files/cesspools.pdf.; see also Steve Wing, Environmental Injustice in North Carolina’s Hog Industry, 108 ENV’T HEALTH PERSP. 225, 225 (2000). (noting that this is a particular problem in eastern North Carolina, where a high water table allows for easy groundwater intrusion). 9 Marks, supra note 8, at 29. 10 Id. 11 Julia Kravchenko et al., Mortality and Health Outcomes in North Carolina Communities Located in Close Proximity to Hog Concentrated Animal Feeding Operations, 79 N.C. MED. J. 278 (2018). 12 Id. 13 Id. 14 Marks, supra note 8, at 32–33.
Appendix Pg. 41
Ms. Sushma Masemore July 30, 2019 Page 4
noxious smell.15 Gaseous hydrogen sulfide also causes eye irritation, in addition to irritation of the nose and throat, as well as loss of consciousness, seizures, and even death.16 Airborne particulate matter and swine waste effluent are associated with respiratory ailments.17 Near constant exposure to pollution and odors are linked to mental health impacts, such as greater levels of self-reported depression and anxiety among residents living near these facilities.18 As this dizzying (and uncomprehensive) list of ecological and human impacts indicates, swine waste lagoons and sprayfield techniques are inherently unsustainable.
II. Biogas Does Not Fit DEQ’s Vision for a Clean Energy Future
DEQ’s comments at the fifth CEP Stakeholder Workshop indicated that biogas will be considered a “lower carbon alternative” to traditional generation resources “when recovered via environmentally sustainable management practices,” which are practices that “minimize environmental harm and creates (sic) a lower carbon [alternative].”19 However, biogas production should not be conflated with sustainable environmental management practices. To the contrary, biogas production is counter to such practices. While biogas production may reduce methane emissions from industrial hog operations, this alone does not render the technology sustainable or clean.
Research has yielded several pertinent insights about swine waste biogas that render it ineligible for inclusion in the CEP. Biogas production does not reduce the volume or management of manure or waste that is created and stored,20 and thereby, cannot remedy many of the harms associated with lagoon and sprayfield practices discussed above. Biogas production has also been found to increase ammonia emissions by 46 percent compared to conventional farms without biogas production technologies.21
The climate benefits from capping hog waste lagoons are far from certain. While it is true that biogas systems do capture methane – a greenhouse gas that has 86 times the global
15 Id. at 18. 16 Id. 17 See, e.g., Peter S. Thorne, Environmental Health Impacts of Concentrated Animal Feeding Operations: Anticipating Hazards--Searching for Solutions, 115(2) ENV’T HEALTH PERSP. 296, 296–97 (2007). 18 Susan S. Schiffman et al., The Effect of Environmental Odors Emanating from Commercial Swine Operations on the Mood of Nearby Residents, 37(4) BRAIN RES. BULL. 369 (1995). 19 CEP Workshop 5 video, supra note 4.We assume that the designation of “lower carbon alternative” is inclusive of alternatives that lower other potent greenhouse gas emissions, such as methane and nitrous oxide. 20 See Anaerobic Digestion: Biogas Production and Odor Reduction, PENN. ST. EXTENSION, https://extension.psu.edu/anaerobic-digestion-biogas-production-and-odor-reduction (last visited July 29, 2018) (“Anaerobic digestion does not reduce the volume or nutrient value of manure. If dilution water is added to the system, the volume of material to handle is increased.”). 21 L.A. Harper et al., The Effect of Biofuel Production on Swine Farm Methane and Ammonia Emissions, 39(6) J. ENV’T QUALITY 1984, 1984 (2010).
Appendix Pg. 42
Ms. Sushma Masemore July 30, 2019 Page 5
warming potential of carbon dioxide on a 20 year timescale–methane leakage involved the transport, storage, and distribution of biogas using existing infrastructure may diminish climate benefits from capping hog waste lagoons.22 Scientists also disagree about whether biogas technology can reduce the nitrous oxide emissions (N2O) associated with swine waste storage and application to soil. Even more potent than methane, N2O has approximately 300 times the global warming potential of CO2,
23 and is produced naturally by bacteria found in animal
manure. Some studies have indicated that the anaerobic digestion process reduces N2O emissions compared to pre-digested waste when applied as a soil amendment,24 while others showed increases in N2O releases when applied to crops.25 Whether N2O emissions are reduced or increased may depend on the ability of crops to uptake nitrogen, and many models that predict N2O emissions will be reduced by digestion presume that waste is applied at agronomic rates.26 This is a discouraging prospect given that nitrogen overloading on agricultural lands is a well-recognized and growing ecological problem.27
Further, biogas production will exacerbate an already dire water pollution problem in rivers and streams in eastern North Carolina, which are overloaded with pollution from industrial
22 Experts studying natural gas and coal have pointed out that natural gas infrastructure is at risk for significant leakage; directed biogas may rely on the same infrastructure for transport, storage, and distribution. See, e.g., William H. Schlesinger, Natural Gas or Coal: It’s All About the Leak Rate, NATURE.ORG (June 24, 2016) https://blog.nature.org/science/2016/06/24/natural-gas-coal-leak-rate-energy-climate/ (noting that ““any leakage rate above 1 percent of gross production negates the advantages of natural gas with respect to mitigating climate change” primarily due to the high global warming potential of methane); see also Thomas K. Flesch, Raymond L. Desjardins, & Devon Worth, Fugitive Methane Emissions from an Agricultural Biodigester, 35 BIOMASS & BIOENERGY 3927, 3927 (2011). 23 Greenhouse Gas Emissions: Overview of Greenhouse Gases, EPA, https://www.epa.gov/ghgemissions/overview-greenhouse-gases (last visited July 29, 2019). 24 See A. Vallejo et al., Nitrogen Oxides Emission from Soils Bearing a Potato Crop as Influenced by Fertilization with Treated Pig Slurries and Composts, 38 SOIL BIOLOGY AND BIOCHEMISTRY 2782, 2782 (2006); see also H. P. COLLINS ET AL., APPLICATION OF AD DAIRY MANURE EFFLUENTS TO FIELDS AND
ASSOCIATED IMPACTS (CSANR Res. Rep. 2010 – 001) (noting a 50 percent N2O reduction in digested material after one year that tapered off dramatically the following year). 25 See S. Wulf, M. Maeting & J. Clemens, Application Technique and Slurry Co-Fermentation Effects on Ammonia, Nitrous Oxide, and Methane Emissions after Spreading: II. Greenhouse Gas Emissions, 31 J. ENV’T QUALITY 1795, 1795 (2002) (measuring higher nitrous emissions in digested material on grasslands, while observing the opposite on arable land); see also B. Amon, V. Kryvoruchko, et al., Methane, Nitrous Oxide and Ammonia Emissions During Storage and After Application of Dairy Cattle Slurry and Influence of Slurry Treatment, 112 AGRIC., ECOSYSTEMS & ENV’T 153, 153 (2006) (finding higher nitrous emissions from digested dairy manure compared to undigested manure). 26 A. LEIP ET AL., EVALUATION OF THE LIVESTOCK SECTOR’S CONTRIBUTION TO THE EU GREENHOUSE
GAS EMISSIONS (GGELS) –FINAL REPORT 100-01 (Eur. Commission, Joint Res. Ctr. 2010). 27 See, e.g., Laura Lynch, Farms, Factories, and a Dangerous Nitrogen Overload, PRI.ORG, Jan. 26, 2012, https://www.pri.org/stories/2012-01-26/farms-factories-and-dangerous-nitrogen-overload.
Appendix Pg. 43

Ms. Sushma Masemore July 30, 2019 Page 6
hog operations. Anaerobic digestion makes nutrients more readily available for plants,28 meaning that less liquid waste is needed to adequately fertilize crops. Thus, the risk of over-application and runoff of nutrient-laden wastewater is substantial.29
The installation of anaerobic digesters over hog waste lagoons does not address the significant risk of pollution from industrial hog operations during major rain events, which are becoming more frequent and intense because of climate change. The lagoon and sprayfield system is extremely vulnerable to flooding during major rain events, which was evident during Hurricane Matthew in 2016 and Hurricane Florence in 2018, during which dozens of hog waste lagoons were inundated, overflowed, or breached.30 Covered lagoons are just as vulnerable to inundation as uncovered lagoons, and sprayfields remain equally susceptible to flooding during major storm events. DEQ has committed to promoting resiliency as it charts a clean energy future for the State, and including biogas technology as part of the CEP is inconsistent with this stated goal.31
III. Conclusion
For almost three decades, swine lagoons and sprayfields have been a tremendous threat to the health and wellbeing of our environment and North Carolina’s most vulnerable communities. Over 20 years ago, a Blue Ribbon Commission declared that the reliance on this system threatens North Carolina’s waterways and should be discontinued.32 Unless combined with a move away from lagoons and sprayfields, expanded biogas production offers at best very few remedies or mitigating effects, and at worst, the potential to exacerbate the harms described above. Biogas production is ill-suited to minimizing environmental damages without any accompanying
28 Joe H. Harrison et al., Transformation and Agronomic Use of Nutrients from Digester Effluent, EXTENSION.ORG (May 17, 2013), http://articles.extension.org/pages/67900/transformation-and-agronomic-use-of-nutrients-from-digester-effluent. 29 Over-application of nutrients may go unnoticed for years, as soil samples are only required once every three years and groundwater sampling is only required under limited circumstances. See N.C. Gen. Stat. 143.215.10C(3)(6); see also Swine Waste Management System General Permit (2019), https://files.nc.gov/ncdeq/Water%20Resources/General-Permit---Swine-2019.pdf. 30 See e.g., Kendra Pierre-Louis, Lagoons of Pig Waste Are Overflowing After Florence. Yes, That’s as Nasty as It Sounds, NY TIMES (Sept. 19, 2018) https://www.nytimes.com/2018/09/19/climate/florence-hog-farms.html (noting that at the time of writing, 110 hog waste lagoons had released or were imminently going to release hog waste into rivers and streams in eastern North Carolina). 31 In an effort to mitigate the impacts of systems vulnerable to the effects of climate change, the State has invested in a buyout program to remove lagoons from the 100-year floodplain. DEQ should not contradict the policy objective of that program by inviting additional investment in facilities that pose an elevated risk to water quality. 32 Blue Ribbon Study Commission on Agricultural Waste, Report to the 1995 General Assembly of N.C. 1996 Regular Session 29 (May 16, 1996), https://ncleg.net/Library/studies/1996/st10736.pdf (emphasis added).
Appendix Pg. 44
Ms. Sushma Masemore July 30, 2019 Page 7
requirements for the use of environmentally superior technologies. Yet, nothing in the current regulatory framework for biogas production requires such a transition.
For these reasons, swine waste biogas should not be counted among North Carolina’s clean energy options or among the low greenhouse gas alternatives. The undersigned respectfully request that DEQ exclude biogas that is the product of swine waste-to-energy projects that fail to meet environmental performance criteria from the CEP. We are particularly concerned that biogas projects will compound the burden already disproportionately borne by people of color, who are statistically more likely to reside near permitted swine operations.
Thank you for consideration of these comments. We look forward to reviewing the draft Clean Energy Plan in the coming weeks and submitting additional comments at that time. Should you have any questions or wish to discuss these comments further, please do not hesitate to contact me at 919-967-1450 or [email protected].
Sincerely,
Blakely E. Hildebrand Staff Attorney Southern Environmental Law Center
North Carolina Environmental Justice Network Rural Empowerment Association for Community Help (REACH) Waterkeeper Alliance Winyah Rivers Foundation Cape Fear River Watch Sound Rivers, Inc. Coastal Carolina Riverwatch Crystal Coast Waterkeeper White Oak Riverkeeper Alliance Center for Biological Diversity North Carolina Conservation Network Yadkin Riverkeeper, Inc. Lawyers Committee for Civil Rights Under Law - Regional Office Natural Resources Defense Council
CC:
Michael Regan, Secretary, N.C. Department of Environmental Quality
Appendix Pg. 45

Attachment 2
Appendix Pg. 46

Rural Empowerment Association for Community Help (REACH) * NC Environmental Justice Network * Waterkeeper Alliance * Crystal Coast Waterkeeper * Coastal Carolina Riverwatch *
Winyah Rivers Foundation * White Oak-New Riverkeeper Alliance * Southern Environmental Law Center * NC Conservation Network
Biogas Position Statement:
We stand for the health, well-being and fair treatment of our communities. We have waited more than two decades for the promised end to the lagoon and sprayfield system of swine waste management and will wait no more. All swine operations-- including biogas projects that rely on swine waste-- must transition to environmentally superior technologies.
Background: Animal Waste Management in North Carolina
When searching for an animal waste management solution, it is important to remember the problem one hopes to solve. In North Carolina, the country’s second-largest producer of pork, community residents and environmental advocates have long demanded solutions to the problem of outdated animal waste management technology. This problem arose as a direct consequence of the consolidation and concentration of pork production in the state, especially over the final two decades of the 20th century. In 1982, there were more than 11,000 swine farms in North Carolina. By 1998, that number had dropped below 3,000. Yet, over the same time period, North Carolina swine production increased and accounted for 95% of the increase in swine production nationally. Farmers had traditionally applied waste to land to fertilize crops; now there is too little land and the amount of waste far exceeds what is needed as fertilizer.
The increased concentration of hog farms across eastern North Carolina has myriad adverse environmental and public health impacts, including but not limited to harmful algal blooms, fish kills, and eutrophication of rivers and estuaries; respiratory ailments; excessive noxious odors; and eye, nose, and throat irritation.
Unfortunately, waste management technology has not advanced at the rapid pace of the industry’s evolution. Instead, pork producers continue to rely on the outdated lagoon and sprayfield system. Swine waste is flushed from confinement structures into unlined earthen pits and then sprayed, using what amounts to industrial sprinklers, onto nearby cropland.
In 1995, a lagoon breach allowed 25 million gallons of hog waste to spill into the New River. The following year, an additional, 1.8 million gallon hog waste spill was triggered by Hurricane Bertha; and in 1999, Hurricane Floyd descended on eastern North Carolina, causing at least five swine waste lagoons to burst and flooding an additional forty-seven.
Appendix Pg. 47

It did not take long for the threats to public health and natural resources posed by this archaic system to motivate a response from state government. Then-Governor Jim Hunt created a Blue Ribbon Commission to study the effect of agricultural waste management on air and water quality and propose solutions. In 1996, the Commission produced a report with a host of regulatory, policy, research, and legislative recommendations as well as the observation that “[i]n the intermediate to long run, exclusive reliance upon lagoon technology as the permitted method of animal waste disposal is not prudent.” The Commission encouraged the State to incentivize the “evaluation of new and innovative animal waste management technologies.”
The N.C. General Assembly also responded. First, it moved to keep the problem from worsening. In 1997, the legislature enacted a moratorium on the use of the lagoon and sprayfield system at any new or expanded hog operation. The same bill directed the Department of Agriculture to “develop a plan to phase out” lagoons and sprayfields. This functional moratorium, initially limited in duration, was made permanent in 2007. At the same time, the N.C. General Assembly created the Methane Capture Pilot Program.
In 2000, the Attorney General and Smithfield Foods, the largest pork producer in the world, signed the Smithfield Agreement, under which Smithfield committed to funding research for developing new technologies for waste management and promised to implement new technologies at its facilities in North Carolina.
Under the moratorium, new or expanding swine facilities were required to employ waste management technology to address what were by then well-recognized failings of the lagoon and sprayfield system. These environmentally superior technologies (ESTs) were defined as those that would
(1) Eliminate the discharge of animal waste to surface water and groundwaterthrough direct discharge, seepage, or runoff;
(2) Substantially eliminate the atmospheric emission of ammonia;
(3) Substantially eliminate the emission of odor that is detectable beyond theboundaries of the parcel or tract of land on which the swine farm is located;
(4) Substantially eliminate the release of disease-transmitting vectors andairborne pathogens; and
(5) Substantially eliminate nutrient and heavy metal contamination of soil andgroundwater.
Since 2007, multiple environmentally superior technologies have been tested on North Carolina swine farms and proven capable of meeting these standards. But the swine industry has refused to install this advanced technology, even when heavily subsidized by North Carolina taxpayers, as through the now-defunct Lagoon Conversion Program.
Appendix Pg. 48
Background: North Carolina’s Renewable Energy Portfolio Standard
At the same time, the legislature was trying to clean up hog farms, it was also busy trying to solve the problem of the State’s over-reliance on coal-fired power plants. In August 2007, the North Carolina General Assembly enacted the Renewable Energy Portfolio Standard (REPS), which requires, among other provisions, that 0.2% of the state’s electricity come from swine waste. The legislature provided a long-term compliance schedule to meet this requirement: 0.07% by 2018-2019, 0.14% by 2020-2021, 0.20% by 2022 and thereafter. The N.C. Utilities Commission has delayed these deadlines six times.
In North Carolina, anaerobic digesters remain the predominant technology used for the production of biogas derived from swine waste. An anaerobic digester is simply a lagoon covered with an impermeable layer of material to create the requisite anaerobic conditions. An anaerobic digester requires no change to the existing lagoon and sprayfield system and is therefore relatively inexpensive to implement and manage. However, compared to more advanced technology, anaerobic digesters have relatively inefficient energy generation. Anaerobic digesters can curb, but not eliminate, noxious odors, and lead to some climate benefits. Anaerobic digesters may also produce methane at higher rates than uncovered swine waste lagoons, and any methane leakage from digestion, transport, and storage might rapidly diminish any associated climate benefits. Moreover, the use of anaerobic digesters may lead to increases in ammonia and nitrous oxide emissions on hog farms.
Background: Technological Differences for WTE and ESTs
Decision-makers should not conflate waste-to-energy technology with environmentally superior technologies. The renewable energy law was designed to diversify the sources of energy in the state, utilize local energy resources, encourage investment in renewable energy and energy efficiency, and generally improve air quality. N.C. Gen. Stat. § 62-2(10). REPS, at its core, was not intended to address environmental and public health harms associated with industrial hog farming. Instead, it focused on problems from another industry altogether. Consider the following Venn Diagram:
Appendix Pg. 49
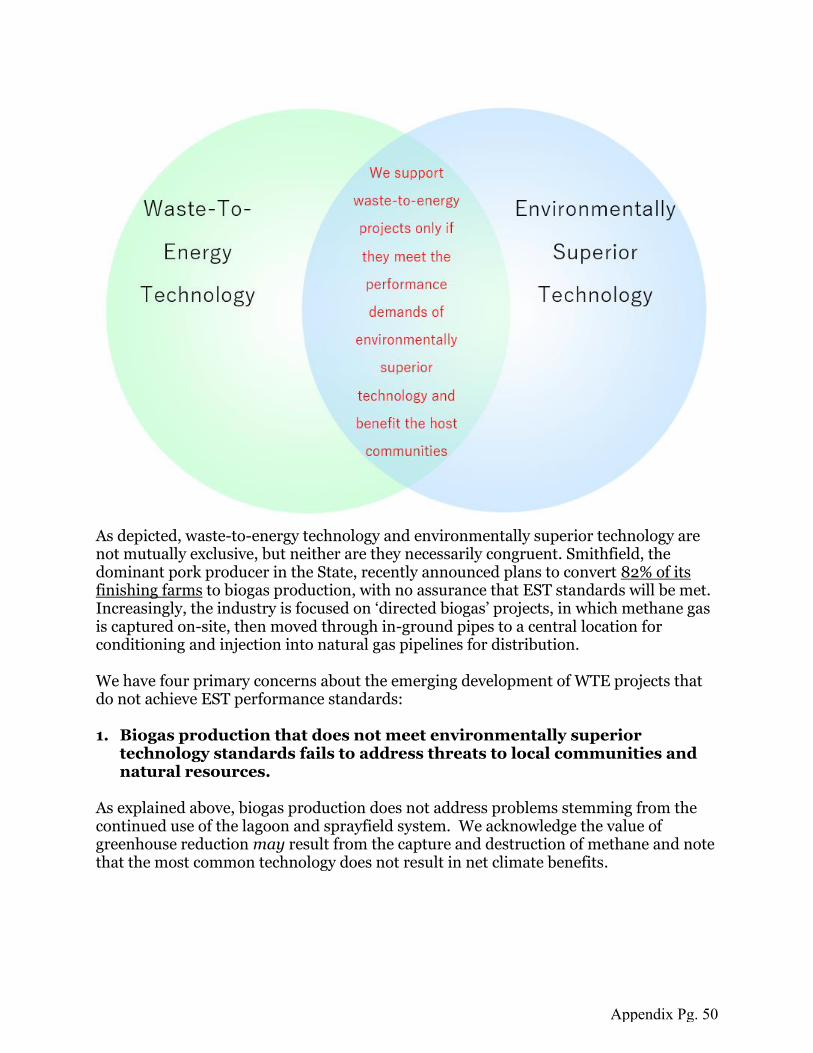
As depicted, waste-to-energy technology and environmentally superior technology are not mutually exclusive, but neither are they necessarily congruent. Smithfield, the dominant pork producer in the State, recently announced plans to convert 82% of its finishing farms to biogas production, with no assurance that EST standards will be met. Increasingly, the industry is focused on ‘directed biogas’ projects, in which methane gas is captured on-site, then moved through in-ground pipes to a central location for conditioning and injection into natural gas pipelines for distribution.
We have four primary concerns about the emerging development of WTE projects that do not achieve EST performance standards:
1. Biogas production that does not meet environmentally superiortechnology standards fails to address threats to local communities andnatural resources.
As explained above, biogas production does not address problems stemming from the continued use of the lagoon and sprayfield system. We acknowledge the value of greenhouse reduction may result from the capture and destruction of methane and note that the most common technology does not result in net climate benefits.
Appendix Pg. 50
Similarly, WTE technology alone fails to address odors emanating from swine production facilities. At best, odors stemming from lagoon off-gassing may be reduced; but swine operations emit numerous airborne contaminants including gases, odor, dust, and microorganisms from manure decomposition in confinement houses and during land application. Odor and other pollution from confinement houses and sprayfields are not addressed by methane capture technologies.
Biogas technology does not address the public health and environmental harms inherent in industrial-scale hog farming because it relies on the lagoon and sprayfield system that creates these harms. For this reason, we can support only those projects that reduce adverse impacts and qualify as ESTs.
2. WTE technology that fails to meet the EST standards may make impactsof the lagoon and sprayfield system worse.
Although covering lagoons to capture methane may reduce lagoon odor, covers may ultimately exacerbate adverse effects by increasing the nitrogen content in the effluent. Without a nitrification/denitrification component, biogas technologies increase the likelihood of nutrient contamination of soil and groundwater as well as the atmospheric emission of ammonia.
Communities are best served by requiring environmentally superior technologies on all hog farms in the State. Requiring industry to meet those standards would curb the industry’s practice of externalizing waste management costs to the already vulnerable and disproportionately non-white communities living closest to swine operations. These costs include but are not limited to health impacts, loss of property value, and impacts on local environmental quality.
3. Distribution of biogas will impose additional disproportionate burdenson communities of color.
Swine operations are already disproportionately located in communities of color. Residents currently complain about pollution stemming from the shipment of hogs to/from the farm. If waste is trucked through communities to provide feedstock for digesters, these burdens will escalate.
It is more likely, however, that a vast network of in-ground pipelines will be necessary to distribute biogas. For instance, to transmit gas from five farms to the Optima KV project required almost 8 miles (42,000 feet) of in-ground piping, even though the facility was constructed in an area of highly concentrated swine operations. Concerns about the pipeline distribution network include potential leakage or rupture that would add to existing pollution issues in already overburdened communities.
Because the collection of biogas will impose a suite of new harms on these existing communities, there really is no reason for residents to welcome WTE unless an accompanying transition to EST reduces the heavy burdens they already experience.
Appendix Pg. 51

4. Decisions to permit WTE projects currently fail to consider communityinput/impacts.
Communities most impacted by WTE projects are not part of the permitting process for WTE facilities. Involving the local community in the decision-making process for WTE projects is critical, as is evaluating the additional cumulative adverse impacts of swine production caused by WTE projects that fail to employ ESTs. To date, proponents of WTE have focused on REPS compliance and economic benefits of WTE and ignored the burdens industrial swine operations on local communities.
Although N.C. Department of Environmental Quality (“DEQ”) issues “innovative waste management” permits authorizing WTE projects, the permitting process often excludes important features and allows for public input only at the discretion of the Director of the Division of Water Resources. DEQ should commit to hold public hearings and seek community input as a default for WTE projects.
In addition, in keeping with basic principles of environmental justice, DEQ must commit to weighing communities’ cumulative burdens when permitting WTE. Prior to permitting WTE projects, DEQ should conduct an equity analysis to consider the degree to which issuing the permit would compound or ameliorate existing impacts in communities. Where WTE projects include EST components, this analysis would likely support permit issuance given the requisite pollution reduction. We note that DEQ recently created an Environmental Justice and Equity Advisory Board to offer guidance to the Secretary, and we believe that Board should advise DEQ on how to address these concerns.
5. Biogas projects must be designed to benefit communities.
Communities near swine operations have suffered for years due to the externalization of waste management costs. As explained above, WTE projects that do not employ ESTs will continue to impose similar costs on surrounding communities. We encourage developers and utilities to implement strategies that equitably distribute economic benefits to local communities. For instance, local energy distribution through microgrids may enable provision of electricity generated from the waste in a community to help power that same community. Ultimately, however, we cannot lose sight of the primary goal of implementing ESTs to better manage swine waste. No financial or energy-related benefit is sufficient to overcome our opposition to WTE projects that fail to employ environmentally superior technology.
Conclusion
More than a decade before the enactment of REPS spurred investment in waste-to-energy technology, North Carolina’s communities and the environment were suffering the impacts of industrial-scale hog farming. Though many see the volume of animal waste in North Carolina as an untapped fuel source, without better management, that waste will continue to jeopardize our natural resources and communities. We support
Appendix Pg. 52

technological improvements that enable pork production without harming North Carolinians. We oppose all projects that fail to address the harms this industry causes to our health, quality of life and environment. Therefore, we oppose biogas projects that fail to meet environmentally superior technology standards, and support projects that not only comply with those standards but also confer an economic benefit to the impacted communities.
Appendix Pg. 53


