
Endowment BoardUniversity of North Carolina
WilmingtonApril 3, 2014
1

Endowment BoardUniversity of North Carolina Wilmington
Welcome
Ms. Wendy Murphy
Approve Minutes of October 24, 2013 Ms.
Wendy Murphy
Results of FY 2013 NACUBO Endowment Study Ms. Roberta LaSure
Endowment Portfolio at February 28, 2014 (unaudited) Ms. Roberta LaSure
Endowment Performance Returns through February 28, 2014 Ms. Roberta LaSure
Request for Proposal: Investment Consulting Services Mr. Charles
Maimone/Dr. Rick Whitfield
Update: BOG Approval of UNCW Request of a For-Profit Associated Entity
Mr. Rob Hoon/Mr. Charles Maimone
Closed Session
Mr. Charles Maimone
Adjournment
Ms. Wendy Murphy
Thursday, April 3, 2014 at 3:00 pmMasonboro Island Room, Fisher Student Center
Agenda
2

2013 NACUBO Endowment StudyFor the Year Ended June 30, 2013
3

NACUBO Endowment Study Overview• 835 U.S. endowments and affiliated foundations participated in the 2013
NACUBO-Commonfund Study of Endowments (NCSE)• All data is through June 30, 2013• The breakdown of participating institutions is by size below
4
10%8%
31%20%
15%
16%
Percent of total respondents
Over $1 billion
$501 million to $1 billion
$101-$500 million
$51-$100 million
$25-$50 million
Under $25 million
71.6%
11.0%
13.2%
2.7%1.1%0.4%
Percent of total endowment dollars
Over $1 billion
$501 million to $1 billion
$101-$500 million
$51-$100 million
$25-$50 million
Under $25 million
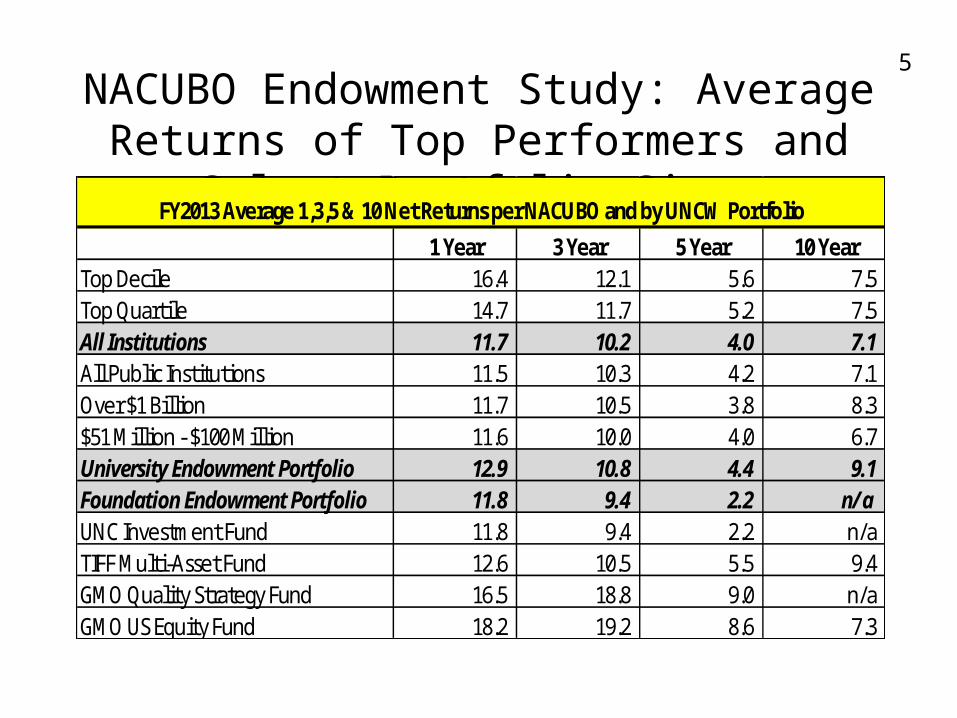
NACUBO Endowment Study: Average Returns of Top Performers and Select Portfolio Sizes
5
1 Year 3 Year 5 Year 10 YearTop Decile 16.4 12.1 5.6 7.5 Top Quartile 14.7 11.7 5.2 7.5 All Institutions 11.7 10.2 4.0 7.1 All Public Institutions 11.5 10.3 4.2 7.1 Over $1 Billion 11.7 10.5 3.8 8.3 $51 Million - $100 Million 11.6 10.0 4.0 6.7 University Endowment Portfolio 12.9 10.8 4.4 9.1 Foundation Endowment Portfolio 11.8 9.4 2.2 n/aUNC Investment Fund 11.8 9.4 2.2 n/aTIFF Multi-Asset Fund 12.6 10.5 5.5 9.4 GMO Quality Strategy Fund 16.5 18.8 9.0 n/aGMO US Equity Fund 18.2 19.2 8.6 7.3
FY2013 Average 1,3,5 & 10 Net Returns per NACUBO and by UNCW Portfolio

NACUBO Endowment Study: Asset Allocation of Top Performers and Select Portfolio Sizes
6
Domestic Equities Fixed Income Int'l Equities
Alternative Strategies
S-T Securitites/ Cash/Other
Top Decile 28 10 18 40 4 Top Quartile 22 9 19 46 4 All Institutions 16 10 18 53 3 All Public Institutions 19 12 19 47 3 Over $1 Billion 13 8 17 59 3 $51 Million - $100 Million 33 20 20 23 4 University Endowment Portfolio 34 6 12 41 7 Foundation Endowment Portfolio 12 2 8 61 16 UNC Investment Fund 14 2 10 71 2 TIFF Multi-Asset Fund 28 17 27 16 2 GMO Quality Strategy Fund 86 13 1 GMO US Equity Fund 100
FY2013 Asset Allocations per NACUBO and per UNCW
* dollar weighted

NACUBO Endowment Study: Spending Policy and Long-Term Return Objectives
7
numbers in percent (%)Total
Institutions Over $1 Billion $51 - $100 MillionPercentage of moving average 77 60 83Average Percentage 4.7 4.7 4.8
Spending Policy for FY2013
numbers in percent (%)Total
Institutions Over $1 Billion $51 - $100 MillionHave return objectives 72 61 75Less than 5% 2 1 15.0% - 5.9% 9 6 106.0% - 6.9% 7 5 77.0% - 7.9% 17 12 188.0% - 8.9% 30 30 309% and over 7 7 9Do not have return objectives 13 12 10No answer/uncertain 15 27 15
Long-Term Return Objectives

NACUBO Endowment Study: Internal Chief Investment Officer
8
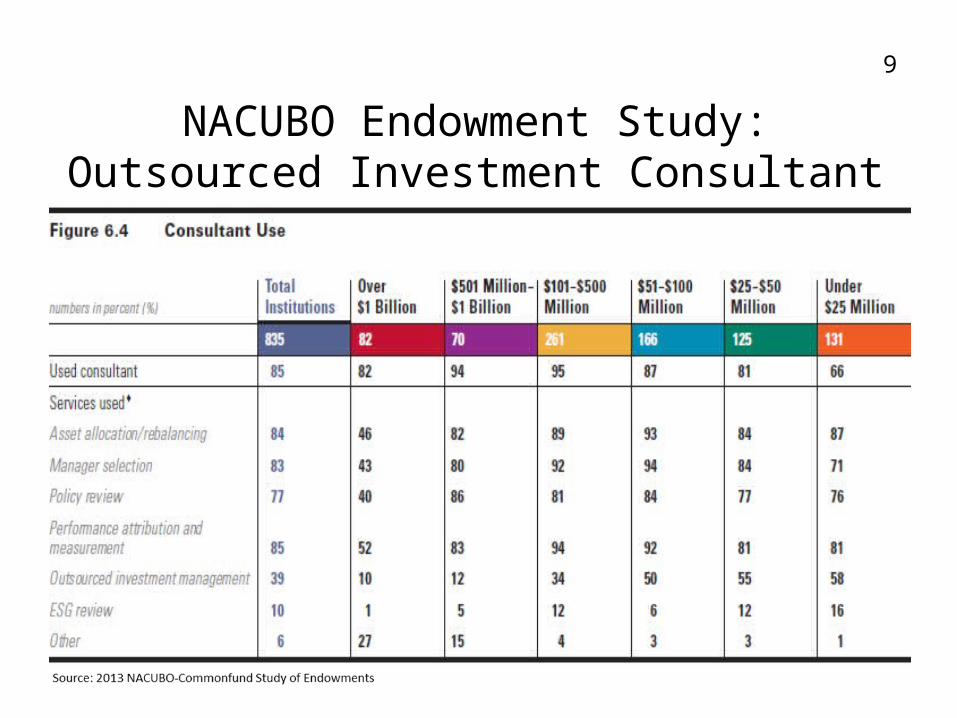
NACUBO Endowment Study: Outsourced Investment Consultant
9

ENDOWMENT PORTFOLIO INVESTMENT
STATEMENT
At February 28, 2014
10

Consolidated Endowment Investment Activity thru February 28, 2014
11
*** Includes $1,370,478 not managed by Board but by students as part of student managed investment portfolio
Total Endowment Funds University Endowments Foundation Endowments ***
Fiscal Year To-Date Fiscal Year To-Date Fiscal Year To-Date7/1/13 -2/28/14 7/1/13 - 2/28/14 7/1/13 -2/28/14
BEGINNING MARKET VALUE 76,009,323$ 72,283,342$ 3,725,981$
RECEIPTS Donor Contributions 3,818,828 3,816,318 2,510 Match from General Administration 167,000 167,000 Repurposing of gifts by donors (55,112) (20,866) (34,246) TOTAL RECEIPTS 3,930,716$ 3,962,452$ (31,736)$
EARNINGS Interest and Dividends 503,674 481,896 21,778 Realized Gains /Losses 4,818,384 4,785,144 33,240 Unrealized Gains /Losses 2,166,953 1,845,977 320,976 TOTAL EARNINGS 7,489,011$ 7,113,017$ 375,994$
DISBURSEMENTS Annual endowment distributions (2,275,653) (2,207,146) (68,507) Annual administrative fees (575,983) (558,911) (17,072) Investment Fund Fees (149,110) (141,908) (7,202) TOTAL DISBURSEMENTS (3,000,746)$ (2,907,965)$ (92,781)$
ENDING MARKET VALUE 84,428,304$ 80,450,846$ 3,977,458$

University’s Endowment Investment Activity thru February 28, 2014
12
Total University
Endowment Investments
Total Pooled Endowment Investments
UNC Investment
FundTIFF Multi-Asset Fund
GMO Quality Fund
GMO US Equity Fund
State Treasurer's S/T
Investment Fund
Note Receivable
from Foundation
Total Non-Pooled
Endowment Investments
Real Estate Properties
Non-Pooled Endowed
Scholarship
Life Insurance
GiftBEGINNING MARKET VALUE 72,283,342$ 69,724,700$ 37,008,371$ 14,189,239$ 9,960,075$ 5,202,875$ 2,085,695$ 1,278,445$ 2,558,642$ 2,531,832$ 11,008$ 15,802$ % of Endowment Investments 100.0% 53.0% 20.4% 14.3% 7.5% 3.0% 1.8% 100.0% 99.0% 0.4% 0.6%
RECEIPTS Donor Contributions 3,816,318 3,816,318 - - - - 3,816,318 - - Match from General Administration 167,000 167,000 167,000 Repurposing of gifts by donors (20,866) (20,866) (20,866) - - Transfers - - (1,000,000) (1,307,403) 2,307,403 - TOTAL RECEIPTS 3,962,452$ 3,962,452$ (1,000,000)$ (1,307,403)$ -$ -$ 6,269,855$ -$ - -$ -$ -$
EARNINGS Interest and Dividends 481,896 481,896 - 122,524 214,226 133,198 11,948 - - - - Realized Gains /Losses 4,785,144 4,785,144 537,538 1,307,403 966,389 1,973,483 331 - - - - Unrealized Gains /Losses 1,845,977 1,845,977 3,364,090 (49,889) (462) (1,467,762) - - - - - TOTAL EARNINGS 7,113,017$ 7,113,017$ 3,901,628$ 1,380,038$ 1,180,153$ 638,919$ 12,279$ -$ -$ -$ -$ -$
DISBURSEMENTS Annual endowment distributions (2,207,146) (2,207,146) - - - - (2,207,146) - - - - Annual administrative fees (558,911) (558,911) (558,911) - Investment Fund Fees (141,908) (141,908) (141,908) - - - Promissory note payments - - 1,278,445 (1,278,445) - Purchase of real estate - (2,013,366) (2,013,366) 2,013,366 2,013,366 TOTAL DISBURSEMENTS (2,907,965) (4,921,331) (141,908) - - - (3,500,978) (1,278,445) 2,013,366 2,013,366 - -
ENDING MARKET VALUE 80,450,846$ 75,878,838$ 39,768,091$ 14,261,874$ 11,140,228$ 5,841,794$ 4,866,851$ -$ 4,572,008$ 4,545,198$ 11,008$ 15,802$ % of Endowment Investments 100% 52.4% 18.8% 14.7% 7.7% 6.4% 0.0% 100.0% 99.5% 0.2% 0.3%
ENDOWMENT REAL ESTATE & OTHER ASSETSPOOLED ENDOWMENT INVESTMENTSFISCAL YEAR TO-DATE THRU FEBRUARY 28, 2014

Foundation’s Endowment Investment Activity thru February 28, 2014
13
Student Managed Endowment
Total Foundation Endowment Investments
UNC Investment
FundState Treasurer's S/T
Investment Fund TD Ameritrade
BEGINNING MARKET VALUE 3,725,981$ 2,127,090$ 351,834$ 1,247,057$ % of Endowment Investments 100.0% 57.1% 9.4% 33.5%
RECEIPTS Contributions 2,510 - 2,510 - Transfers (34,246) (47,296) 47,296 (34,246) TOTAL RECEIPTS (31,736)$ (47,296)$ 49,806$ (34,246)$
EARNINGS Interest & Dividends 21,778 - 488 21,290 Realized Gains (Losses) 33,240 14,164 19,076 Unrealized Gains (Losses) 320,976 203,675 117,301 TOTAL EARNINGS 375,994$ 217,839$ 488$ 157,667$
DISBURSEMENTS Annual endowment distributions (68,507) - (68,507) - Annual administrative fees (17,072) (17,072) Investment Funds Fees (7,202) (7,202) - - TOTAL DISBURSEMENTS (92,781)$ (7,202)$ (85,579)$ -$
ENDING MARKET VALUE 3,977,458$ 2,290,431$ 316,549$ 1,370,478$ % of Endowment Investments 100.0% 57.5% 8.0% 34.5%
FISCAL YEAR TO-DATE THRU FEBRUARY 28, 2014
Board Managed Endowments

ENDOWMENT INVESTMENT PERFORMANCE
RETURNS
Through February 28, 2014
14

Endowment Portfolio Returns @ February 28, 2014 15
Return since Date Portfolio vs. Benchmarks 1 YR 3 YR 5 YR 10 YR inception of inception
UNCW Endowment Portfolio 14.3% 9.4% 10.8% 8.2% 7.7% 07/01/87CPI + 4.5% (spend rate) 5.6% 6.5% 6.5% 6.9% 7.2%
CPI +5.75% (spend rate + admin fee) 6.9% n/a n/a n/a 8.4%
Annualized Net Returns @ February 28, 2014
1 YR 3 YR 5 YR 10 YR0.0%
2.0%
4.0%
6.0%
8.0%
10.0%
12.0%
14.0%
16.0%14.2%
9.4%10.8%
8.2%
5.6%6.5% 6.5% 6.9%6.9%
n/a n/a n/a
UNCW Endowment Return vs. Benchmarks
UNCW Endowment Portfolio CPI + 4.5% (spend rate) CPI +5.75% (spend rate + admin fee)

Endowment Fund Manager Returns @ February 28, 2014 16
Investment Manager Allocations
Date DateUNCW Fund of UNCW of Fund's
Investment Name 1 YR 3 YR 5 YR 10 YR Inception Inception Inception InceptionUNC Investment Fund, net return 14.5% 8.8% 9.1% n/a 9.3% 9.3% 08/01/03 01/01/03Strategic Investment Policy Portfolio (SIPP) n/a n/a n/a n/a n/a n/a
TIFF Multi Asset Fund (MAF), net return 12.2% 7.9% 16.6% 8.6% 7.3% 8.5% 03/20/06 03/31/95Constructed Index 8.3% 5.8% 14.6% 6.7% 7.7%
GMO Quality Fund , net return 18.4% 15.1% 18.4% 6.4% 16.8% 6.3% 04/30/09 02/06/04S&P 500 25.4% 14.4% 23.0% 7.2% 19.5% 7.2%
GMO US Equity, net return 18.3% 15.1% 19.9% 5.9% 16.8% 11.3% 04/01/09 09/18/85S&P 500 25.4% 14.4% 23.0% 7.2% 19.5% 11.1%
Annualized Net Returns @ February 28, 2014
UNC Invest. Fd 52.4%$39.8M
TIFF18.8%
$14.3M
GMO22.4%
$17.0M STIF6.4%
$4.9M
Investment Manager Allocations

INVESTMENT COMMITTEE INTIATIVES
17

Background: Investment Committee Initiatives
• Results of combined efforts of Endowment & Foundation Investment Committees over past few years:
1. Updated and revised Investment Policy Statement (IPS)2. Systematic review of asset allocation at portfolio level3. Refined Investment Performance Report against benchmarks
• Committees recommended UNCW staff’s next project be an assessment of our current investment management structure relative to spectrum of services offered in marketplace
18

UNCW Endowment at a Glance
Endowment• Total investable assets of $76M for University and $3M for Foundation• Currently utilizing “hybrid” approach
Two outsourced CIO managed funds – UNCMC and TIFF, representing 73% of assets• UNCW is “little fish in big pond” – receive little attention from managers• Structure of each managed pool is a “fixed menu” – no customization
Two direct mutual fund investments with GMO, representing 23% of assets
Endowment Board• 7 Trustees• Quarterly meetings
UNCW Staff• VC of Business Affairs, Associate VC Finance & Director of Endowment Accounting
19
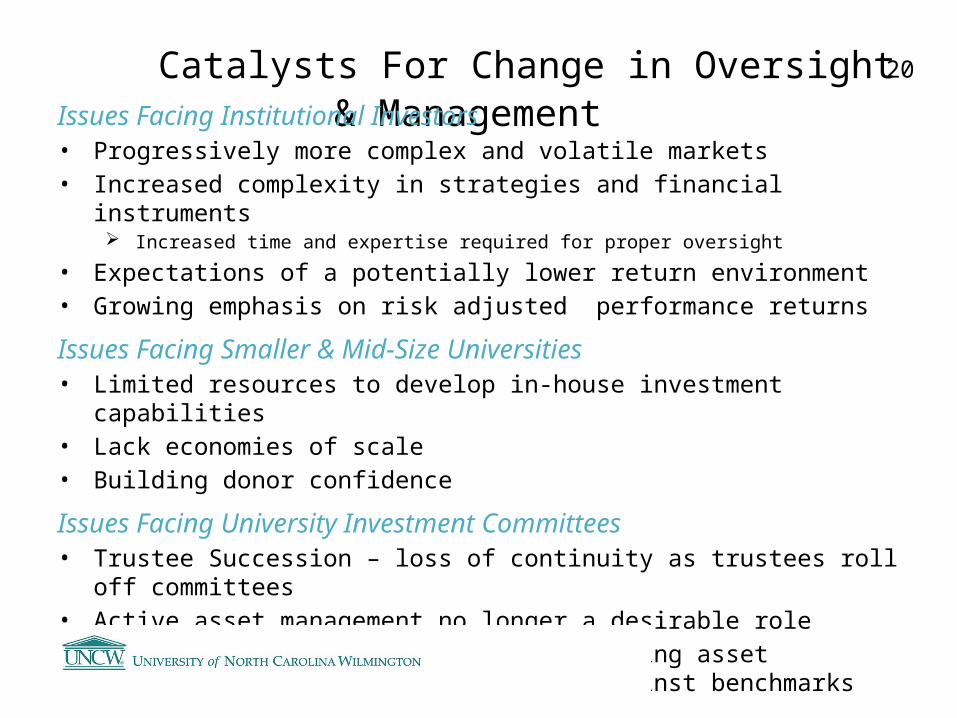
Catalysts For Change in Oversight & Management Issues Facing Institutional Investors• Progressively more complex and volatile markets• Increased complexity in strategies and financial instruments
Increased time and expertise required for proper oversight
• Expectations of a potentially lower return environment • Growing emphasis on risk adjusted performance returns
Issues Facing Smaller & Mid-Size Universities• Limited resources to develop in-house investment capabilities• Lack economies of scale• Building donor confidence
Issues Facing University Investment Committees• Trustee Succession – loss of continuity as trustees roll off committees• Active asset management no longer a desirable role• Focus on governance and policy; reviewing asset allocation and performance
returns against benchmarks
20

Participants in Process • Endowment & Foundation Board member participants in this process:
Britt Preyer
Edward Alexander Steve Warwick Hank Miller Jason Wheeler Chad Paul David Hartness Charles Mattox Robert Keith
• UNCW Staff participants in this process: Vice Chancellor for Business Affairs Associate Vice Chancellor for Finance Director of Endowment Accounting
21
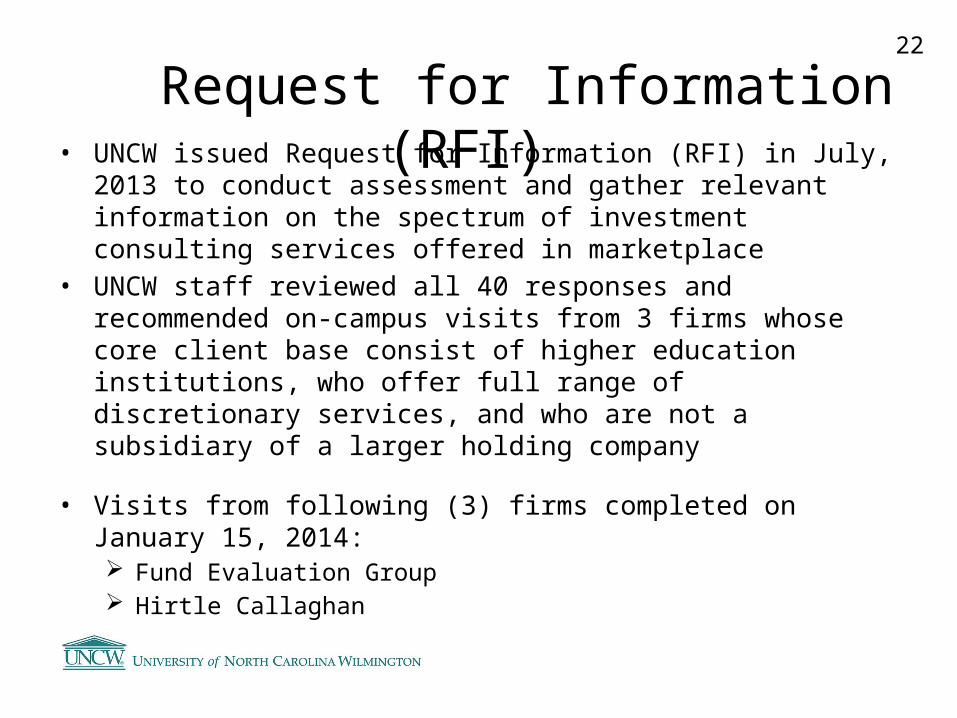
Request for Information (RFI) • UNCW issued Request for Information (RFI) in July, 2013 to conduct
assessment and gather relevant information on the spectrum of investment consulting services offered in marketplace
• UNCW staff reviewed all 40 responses and recommended on-campus visits from 3 firms whose core client base consist of higher education institutions, who offer full range of discretionary services, and who are not a subsidiary of a larger holding company
• Visits from following (3) firms completed on January 15, 2014: Fund Evaluation Group Hirtle Callaghan Cambridge Associates
22

kkkkkkkkk
23

Multiple direct investmentsSingle commingled fund
Ex: UNCMC, TIFF
Multiple commingled funds
Three Common OCIO Models
Not Customized Fully Customized
No ownership of managers
Complex administration
Cash in / cash out
24

Next Steps: Request for Proposal
• Investment committee members and other Board participants recommended issuing a Request for Proposal for outsourced Chief Investment Officer (CIO) services with full discretion
25
Endowment BoardUniversity of North Carolina Wilmington
Welcome
Ms. Wendy Murphy
Approve Minutes of October 24, 2013 Ms.
Wendy Murphy
Results of FY 2013 NACUBO Endowment Study Ms. Roberta LaSure
Endowment Portfolio at February 28, 2014 (unaudited) Ms. Roberta LaSure
Endowment Performance Returns through February 28, 2014 Ms. Roberta LaSure
Request for Proposal: Investment Consulting Services Mr. Charles
Maimone/Dr. Rick Whitfield
Update: BOG Approval of UNCW Request of a For-Profit Associated Entity
Mr. Rob Hoon/Mr. Charles Maimone
Closed Session
Mr. Charles Maimone
Adjournment
Ms. Wendy Murphy
Thursday, April 3, 2014 at 3:00 pmMasonboro Island Room, Fisher Student Center
Agenda
26

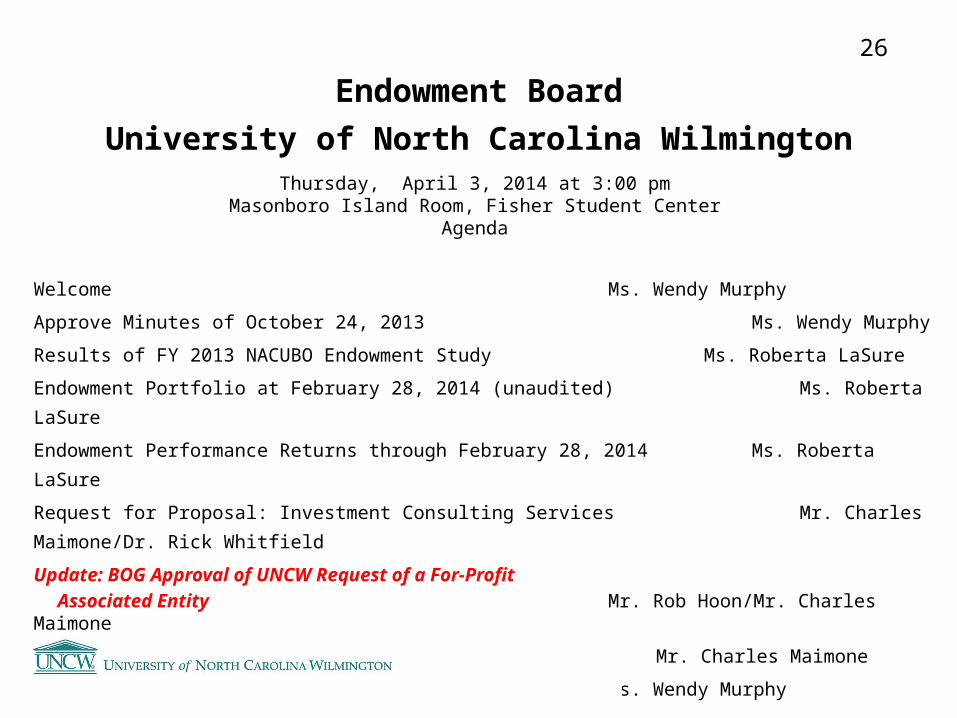
Endowment BoardUniversity of North Carolina Wilmington
Welcome
Ms. Wendy Murphy
Approve Minutes of October 24, 2013 Ms.
Wendy Murphy
Results of FY 2013 NACUBO Endowment Study Ms. Roberta LaSure
Endowment Portfolio at February 28, 2014 (unaudited) Ms. Roberta LaSure
Endowment Performance Returns through February 28, 2014 Ms. Roberta LaSure
Request for Proposal: Investment Consulting Services Mr. Charles
Maimone/Dr. Rick Whitfield
Update: BOG Approval of UNCW Request of a For-Profit Associated Entity
Mr. Rob Hoon/Mr. Charles Maimone
Closed Session
Mr. Charles Maimone
Adjournment
Ms. Wendy Murphy
Thursday, April 3, 2014 at 3:00 pmMasonboro Island Room, Fisher Student Center
Agenda
27


