
Employment Sector Employment Working Paper No. 54 2010
Trade contraction in the global crisis:
Employment and inequality effects in India and South Africa
David Kucera (ILO)
Leanne Roncolato (American University) and
Erik von Uexkull (ILO)
Policy Integration Department Trade and Employment Program

ii
Copyright © International Labour Organization 2010
First published 2010
Publications of the International Labour Office enjoy copyright under Protocol 2 of the Universal Copyright Convention. Nevertheless, short
excerpts from them may be reproduced without authorization, on condition that the source is indicated. For rights of reproduction or translation, application should be made to ILO Publications (Rights and Permissions), International Labour Office, CH-1211 Geneva 22,
Switzerland, or by email: [email protected]. The International Labour Office welcomes such applications.
Libraries, institutions and other users registered with reproduction rights organizations may make copies in accordance with the licences issued to them for this purpose. Visit http://www.ifrro.org to find the reproduction rights organization in your country.
ILO Cataloguing in Publication Data
Kucera, David; Roncolato, Leanne; von Uexkull, Erik
Trade contraction in the global crisis : employment and inequality effects in India and South Africa / David Kucera, Leanne Roncolato and
Erik von Uexkull ; International Labour Office, Employment Sector, Policy Integration Department, Trade and Employment Programme. -
Geneva: ILO, 2010 1 v. (Employment working paper ; No.54)
ISBN: 9789221240372;9789221240389 (web pdf)
International Labour Office; Employment Sector
trade / employment / household income / income distribution / economic recession / India / South Africa R
09.05.1 ILO Cataloguing in Publication Data
The designations employed in ILO publications, which are in conformity with United Nations practice, and the presentation of material
therein do not imply the expression of any opinion whatsoever on the part of the International Labour Office concerning the legal status of
any country, area or territory or of its authorities, or concerning the delimitation of its frontiers.
The responsibility for opinions expressed in signed articles, studies and other contributions rests solely with their authors, and publication does not constitute an endorsement by the International Labour Office of the opinions expressed in them.
Reference to names of firms and commercial products and processes does not imply their endorsement by the International Labour Office,
and any failure to mention a particular firm, commercial product or process is not a sign of disapproval.
ILO publications and electronic products can be obtained through major booksellers or ILO local offices in many countries, or direct from
ILO Publications, International Labour Office, CH-1211 Geneva 22, Switzerland. Catalogues or lists of new publications are available free
of charge from the above address, or by email: [email protected]
Visit our website: http://www.ilo.org/publns
Printed in Switzerland

iii
Preface
The primary goal of the ILO is to contribute, with member States, to achieve full and
productive employment and decent work for all, including women and young people, a goal
embedded in the ILO Declaration 2008 on Social Justice for a Fair Globalization, and1
which has now been widely adopted by the international community.
In order to support member States and the social partners to reach the goal, the ILO
pursues a Decent Work Agenda which comprises four interrelated areas: Respect for
fundamental worker‟s rights and international labour standards, employment promotion,
social protection and social dialogue. Explanations of this integrated approach and related
challenges are contained in a number of key documents: in those explaining and elaborating
the concept of decent work2, in the Employment Policy Convention, 1964 (No. 122), and in
the Global Employment Agenda.
The Global Employment Agenda was developed by the ILO through tripartite
consensus of its Governing Body‟s Employment and Social Policy Committee. Since its
adoption in 2003 it has been further articulated and made more operational and today it
constitutes the basic framework through which the ILO pursues the objective of placing
employment at the centre of economic and social policies.3
The Employment Sector is fully engaged in the implementation of the Global
Employment Agenda, and is doing so through a large range of technical support and
capacity building activities, advisory services and policy research. As part of its research
and publications programme, the Employment Sector promotes knowledge-generation
around key policy issues and topics conforming to the core elements of the Global
Employment Agenda and the Decent Work Agenda. The Sector‟s publications consist of
books, monographs, working papers, employment reports and policy briefs.4
The Employment Working Papers series is designed to disseminate the main findings
of research initiatives undertaken by the various departments and programmes of the
Sector. The working papers are intended to encourage exchange of ideas and to stimulate
debate. The views expressed are the responsibility of the author(s) and do not necessarily
represent those of the ILO.
1 See http://www.ilo.org/public/english/bureau/dgo/download/dg_announce_en.pdf
2 See the successive Reports of the Director-General to the International Labour Conference: Decent
work (1999); Reducing the decent work deficit: A global challenge (2001); Working out of poverty
(2003).
3 See http://www.ilo.org/gea. And in particular: Implementing the Global Employment Agenda:
Employment strategies in support of decent work, “Vision” document, ILO, 2006.
4 See http://www.ilo.org/employment.
José Manuel Salazar-Xirinachs
Executive Director
Employment Sector


v
Contents
Page
Preface ...................................................................................................................................................... iii
Contents ..................................................................................................................................................... v
Abstract .................................................................................................................................................... vi
1. Introduction ..................................................................................................................................... 1
2. Trade policy and patterns ................................................................................................................ 3
3. Method ............................................................................................................................................ 4
4. Employment results ......................................................................................................................... 6
4.1. Country-level results ................................................................................................................ 6
4.2. Industry-level results ................................................................................................................ 8
4.3. Gender and skills bias results ................................................................................................. 10
5. Income inequality results .............................................................................................................. 11
6. Comparison with actual changes in employment and Government crisis responses .................... 12
7. Concluding remarks ...................................................................................................................... 15
Appendix: Data sources and notes .......................................................................................................... 17
Tables ...................................................................................................................................................... 19
References ............................................................................................................................................... 35
Employment Working Papers ................................................................................................................. 41
Employment Sector ................................................................................................................................. 49

vi
Abstract
The paper estimates the effects of the 2008-09 trade contraction on employment and
incomes in India and South Africa, using social accounting matrices (SAMs) in a Leontief
multiplier model. Employment results are presented at aggregate and industry levels and
examine gender and skills biases. Income results examine inequality at the level of rural
and urban household income quintiles. The most notable finding is that India and South
Africa experienced substantial employment and income declines as a result of trade
contraction with the EU and the US. A large share of these declines occurred in the non-
tradeable sector and resulted from income-induced effects, illustrating how a shock
originated in the tradeable goods sector had strong ripple effects throughout India and
South Africa.

1
1. Introduction
“For most nations in the world...this is not a financial crisis – it is a trade crisis” – Richard
Baldwin (2009a)
Even as the global crisis of 2008-09 was ravaging financial institutions in the U.S. and
Europe, high-level Government officials in India and South Africa expressed confidence that their
countries could escape relatively unscathed (Kuruvilla, 2008; Marais, 2009; Nachane, 2009).
Their confidence was not unfounded, based as it was on their financial institutions being well
regulated and supervised and also based on an appreciation of the channels through which the
effects of other recent financial crises had been transmitted across borders. Indeed the effects of
the global crisis would have undoubtedly been much worse in India and South Africa had their
financial institutions not been as well run.
But the global crisis of 2008-09 was unprecedented in the role that trade played as a
transmission channel, a result of what has been referred to as “The Great Trade Collapse”
(Baldwin, 2009a). As Baldwin writes, “A few facts justify the label: The Great Trade
Collapse”:
Global trade has dropped before – three times since WWII – but this is by far the largest
[drop since WWII].... The great trade collapse is not as large as that of the Great Depression, but
it is much steeper. It took 24 months in the Great Depression for world trade to fall as far as it fell
in the 9 months from November 2008.... [I]mports and exports collapsed for the EU27 and 10
other nations that together account for three-quarters of world trade; each of these trade flows
dropped by more than 20 percent from 2008Q2 to 2009Q2; many fell 30 percent or more. World
trade in almost every product category was positive in 2008Q2, almost all were negative in
2008Q4 and all where negative in 2009Q1 (ibid., p. 1-3).
That global trade would have fallen alongside global output is unremarkable. Yet real global
output is estimated to have declined by 2.2 percent in 2009 and real global trade by 12.2 percent
(World Bank, 2010; WTO, 2010). That global trade declined over five times more than global
output is remarkable, unforeseen not just by the Governments of India and South Africa but also
by economists.
The ex post facto efforts of a number of economists to come to terms with the causes of the
“Great Trade Collapse” resulted in an edited volume of this name (Baldwin, 2009b). Baldwin‟s
introductory chapter argues that there is an emerging consensus on the importance of the
“compositional effect” and the “synchronicity effect.” The “compositional effect” describes how
the demand shock associated with the crisis focused on “postponeable” consumer durable and
investment goods, including electrical and non-electrical machinery, transport equipment,
chemicals, steel and other metal products and raw materials. Since these goods make up a much
larger share of traded goods than GDP, a given change in the demand for them would have a
much larger effect on trade than on GDP.5 The “synchronicity effect” describes how the
expansion of global production networks – characterized by just-in-time supply of intermediate
inputs – caused the effects of falling export demand to be rapidly transmitted across borders.
Opposite to the “synchronicity effect” and influential in the early days of the crisis is the
notion of “decoupling,” based on evidence that patterns of cyclic volatility in developed and
emerging economies had become increasingly independent (Kose et al., 2008). While the
5 Cf. Levchenko et al., 2009 and Francois and Woerz, 2009 for supporting empirical evidence for the U.S.
and China.

2
evidence on cyclic volatility has been called into question in its own right (Wälti, 2009),
additional evidence shows the extent to which trade and investment between developed and
emerging economies have become increasingly interdependent, consistent with the expansion of
global production networks (Athukorala and Kohpaiboon, 2009; Kim et al., 2009; Pula and
Peltonen, 2009). Rather than decoupling, in other words, this evidence argues in favour of
“recoupling.”
In a speech given in February 2009, the Governor of the Reserve Bank of India Duvvuri
Subbarao provided a vivid sense of the disjuncture between the anticipated and actual effects of
the crisis in India:
There is, at least in some quarters, dismay that India has been hit by the crisis. This dismay
stems from two arguments. The first argument goes as follows. The Indian banking system has
had no direct exposure to the sub-prime mortgage assets or to the failed institutions. It has very
limited off-balance sheet activities or securitized assets. In fact, our banks continue to remain safe
and healthy. So, the enigma is how can India be caught up in a crisis when it has nothing much to
do with any of the maladies that are at the core of the crisis. The second reason for dismay is that
India's recent growth has been driven predominantly by domestic consumption and domestic
investment. External demand, as measured by merchandize exports, accounts for less than 15 per
cent of our GDP. The question then is, even if there is a global downturn, why should India be
affected when its dependence on external demand is so limited? (Subbarao, 2009).
As to why India was hit hard by the crisis in spite of mitigating factors, Subbarao cited
globalization, in particular India‟s increased openness with respect to foreign investment and
trade. The point is elaborated by Kumar and Alex, who write, “Indian exports fell in line with
global trade flows. This should firmly dismiss the decoupling myth for the Indian economy.
Collapsing foreign trade, capital flows, and exchange rate movements all transmitted negative
impacts to the India economy” (2009, p. 221).
World trade began to recover in late-2009, and the WTO projects it will grow by 9.5
percent in 2010 (Baldwin, 2009a; WTO, 2010). It might be thought, in this regard, that studying
the effects of trade contraction in the crisis is of only passing concern. Yet even short-lived
shocks may have long-lasting consequences, so-called “scarring effects.” This is all the more so
in countries like India and South Africa where large numbers of people have limited means to
cope with temporary losses of work and income. Such losses may mean that some families are
unable to keep their children in school, lowering long-run educational attainment in the country
(ILO, 2010). They may mean home mortgage foreclosures or the inability to maintain premium
payments for social insurance (Cameron, 2010). There is also evidence that the trade collapse
weakened the bargaining positions of workers as well as of developing country governments with
respect to natural resource concession agreements, both having potential long-run implications
(Jansen and von Uexkull, 2010). More generally, studying the effects of the trade shock can
provide a fuller appreciation of the potential costs associated with greater trade openness, which
policymakers can set against the gains from trade.
The paper estimates the effects of trade contraction in the global crisis on employment and
incomes in India and South Africa, using social accounting matrices (SAMs) in a Leontief
multiplier model in which the change in demand is represented by the change in exports from
India and South Africa to the EU and US. This modelling approach provides a ceterus paribus
result, for which the effects of trade contraction are to a large extent isolated from other
simultaneous events, both potentially negative (e.g., foreign investment) and positive (e.g.,
Government crisis responses). This can facilitate a clearer sense of the relative importance of the
various transmission channels of the global crisis, with estimated employment changes resulting
from trade contraction providing a useful point of comparison with actual employment changes
during the crisis.
Different industries and types of workers may have been differently affected by trade
contraction, and such distinctions can usefully inform Government crisis responses. As such, this
paper evaluates employment impacts at aggregate and industry levels, with breakdowns by gender

3
and skills, and evaluates income effects for rural and urban households by income quintiles.
These results are discussed with reference to trade policy and patterns in India and South Africa
as well as actual changes in employment in the two countries during the crisis, along with aspects
of Government crisis responses.
2. Trade policy and patterns
Both India and South Africa are noteworthy for their rapid pace of trade liberalization and
because they figure importantly in debates on the role of trade liberalization in economic
development.6 Regarding India, Kumar and Mishra write that “the 1991 trade
reform...represented one of the most dramatic trade liberalizations ever attempted in a developing
country” (2005, p. 4). Trade liberalization in India began in the mid-1980s and accelerated after
the balance-of-payments crisis of 1990-91. In response to the crisis, the India Government
requested stand-by assistance from the International Monetary Fund (IMF) and a structural
adjustment loan from the World Bank. IMF and World Bank support was made conditional on a
wide range of economic reforms, including trade liberalization as embodied in the Government‟s
Export-Import Policy of 1992-97 (Toplova, 2005; Menon and Rogers, 2008). Between 1990 and
2000, the share of imports subject to non-tariff barriers declined from 82 to 17 percent and
average tariffs for manufactured goods declined from 117 to 39 percent (Kumar and Mishra,
2005, p. 4). By 2005, average tariffs in India had declined to 19 percent for all goods, 38 for
agricultural goods, and 16 percent for non-agricultural goods (UNCTAD/WTO, 2007).
Regarding South Africa, Qualmann writes that the country “has rapidly opened up its
domestic markets over the past decade, both by eliminating non-tariff barriers and by
substantially lowering nominal tariffs” (2008, p. 23). A turning point was the election of the
African National Congress (ANC) in 1994 and the Government‟s desire to re-enter the global
stage after years of increasing isolation under apartheid. Trade liberalization was manifested in
the country‟s signing of the Marrakesh Agreement of the General Agreement on Tariffs and
Trade (GATT) in 1994 and becoming – along with India – a founding member of the World
Trade Organization (WTO) in 1995. Trade liberalization was also a key component of the
Government‟s Growth, Employment and Redistribution (GEAR) strategy, in place from 1996 to
2006 (Hayter et al., 2001; Qualmann, 2008). Between 1992 and 2000, average tariffs declined
from 28 to 7 percent and peak tariffs declined from 1,390 to 55 percent (Qualmann, 2008, p. 37).
As of 2006, average tariffs in South Africa were 8 percent for all goods, 9 for agricultural goods,
and 8 percent for non-agricultural goods (UNCTAD/WTO, 2007).
Shown in Figure 1 for the two countries is total trade (exports plus imports) of goods and
services as a percentage of GDP – that is, de facto trade openness. By this measure, India had
been much less open than South Africa, yet there was convergence between the countries up to
the early-1990s, after which openness increased in both countries, from about 20 to 45 percent in
India and 40 to 65 percent in South Africa. That is, both countries saw a 25 percentage point
increase in de facto trade openness in just a decade and a half, indicating a dramatic change in
their engagement with the world economy.
During this period of rapid increase in trade openness, India‟s and South Africa‟s global
trade balances also worsened, with net exports of goods and services turning negative for both
countries, as shown in Figure 2. Even before the crisis, in other words, India‟s and South Africa‟s
trade patterns gave cause for concern. There were, at the same time, important differences
between the countries, with India‟s trade balance with both developed and developing countries
having worsened in recent years and with South Africa‟s trade balance having worsened with
6 See, for example, Rodrik and Subramanian (2005), Rodrik (2008), and Krueger (2008) for competing
views on the role of trade liberalization in economic development in India and South Africa.

4
developing countries but improved with developed countries (UN Comtrade, 2007). Moreover,
India relied more on domestic inputs and South Africa more on imported inputs for export
production, differences that would shape how trade contraction affected them (Frye, 2009; Kumar
and Vashisht, 2009).
Because of the limited availability of recent export data at a detailed industry level for India
and South Africa, our study is based on mirror data on imports from the two countries reported by
the EU and US. Yet these are important markets for Indian and South African exports and so
provide a useful if partial account of the effects of the crisis through trade contraction. Regarding
South Africa, the point is made by Marais as follows: “Ultimately, a recovery depends primarily
on developments in South Africa‟s main trading partners in Europe and North America” (2009, p.
3).7 The Rand also appreciated strongly against the Euro and US Dollar during the crisis, and
exchange rate policy was widely debated in the country (Marais, 2009; SAPA, 2010). Shown in
Figures 3 and 4 are exports (in constant prices) from India and South Africa to the EU and US
from January 2003 to April 2009, the latter coinciding with the end of “The Great Trade
Collapse.” For India, there was a substantial decline in exports from early 2008 on, driven more
by trade with the US; for South Africa, the decline was sharper, driven more by trade with the
EU. These differences in export patterns with respect to the EU and US are reflected, we will see,
in our employment results.
3. Method
A social accounting matrix (SAM) is a representation of national accounts showing the two-
way flows of economic transactions in a country. SAMs for India and South Africa – for 2003/4
and 2000, respectively – are used in a Leontief multiplier model to estimate the effects of the
2008-09 trade contraction. The analysis was conducted using both Type I and Type II multipliers,
though the presentation focuses more on results using Type II multipliers. Type I multipliers
address the direct effects of trade contraction on incomes and employment as well as indirect
effects through forwards and backwards production (input-output) linkages. In addition to these
direct and indirect effects, Type II multipliers address income-induced effects resulting from
changes in household expenditures.
For employment, the Leontief multiplier model is defined as:
L = E [(I-A)
-1T],
where,
L = the vector of changes in industry-level employment associated with the changes in
trade, expressed as full-time equivalent (FTE) jobs lasting one year, E = the diagonal matrix of industry-level labour coefficients (employment per unit of
output),
I = the identity matrix,
A = the average propensity to spend matrix, and
T = the industry-level export demand vector.
Because the SAMs for India and South Africa provide separate commodity accounts
(including imports) and production accounts (excluding imports), T enters the model through the
commodity account and impacts the domestic economy (i.e., domestic incomes and employment)
through the production account.
7 Similarly, Assubuji and Luckscheiter write: “How the recession in South Africa further develops will
depend on the economic performance of its key trading partners such as the United States, the European
Union and China” (2009, p. 1).

5
T is constructed in two ways. T1 is defined for each industry as the difference in exports
between early-2008 and early-2009, coinciding with “The Great Trade Collapse.” More
specifically, T1 represents the annualized difference in exports between the three-month period
from February-April of these years, shown by the shaded bars in Figures 3 and 4. Because
industry values for T1 are mainly negative, using T1 in the Leontief multiplier model yields
estimates of what we define as “jobs lost” during the crisis as a result of trade contraction. T2 is
constructed by assuming that were it not for the crisis, exports would have continued to grow at
the same rate to February-April of 2009 as they had in previous years. We base this on industry-
level export growth for the years 2004 to 2006 and exclude the years 2007 to 2008 to filter out
possible effects of commodity and food price shocks during this latter period. T2 is then defined
for each industry as the annualized difference between this hypothetical level of endpoint exports
and actual exports in February-April of 2008. As with T1, industry values for T2 are for the most
part negative, resulting from most industries‟ favourable export growth prior to the crisis,
particularly in India. In this sense, using T2 in the model yields estimates of what we define as
“jobs not created” during the crisis as a result of trade contraction.8
Results are presented according to two scenarios based on T1 and T2:
Scenario A refers to estimated “jobs lost” (based on T1 by itself).
Scenario B refers to the estimated sum of “jobs lost” and “jobs not created” (based on T1 plus
T2).
Income inequality results too are presented in terms of scenarios A and B, on the
understanding that these results are defined with respect to household income rather than jobs.
Studies using similar methods to estimate the effects of trade on employment and incomes
generally construct a trade demand vector based not on changes in exports but rather on changes
in net exports (exports minus imports) relative to domestic production or domestic production for
final demand plus imports (or plus net imports) (e.g. Sachs and Shatz, 1994; Wood, 1994; Kucera
and Milberg, 2003). In other words, these studies estimate the effects of a changing structure of
trade. It might be argued, on these grounds, that we overestimate the effects of the crisis, since
imports into India and South Africa also declined during the period we evaluate.
We do not expect this to be a concern for scenario A, since these earlier studies were
evaluating the employment impact of trend changes in the structure of trade. Trend changes in the
structure of imports could be expected to have predictable effects on domestic income and
employment because of substitutions between imported and domestically-produced goods. But
this would not hold for an import shock, given the associated instability and uncertainty and the
fact that import declines were driven by a reduction in total demand rather than substitutions
between imports and domestically-produced goods. Unlike scenario A, however, scenario B is
based on extrapolating a trend from a period in which net exports declined markedly in both India
and South Africa, as shown in Figure 2, and where export growth is consistent with job loss
resulting from trade expansion (Kucera and Roncolato, forthcoming). In this sense, results based
on T2 could be regarded as gross jobs not created rather than net jobs not created. On these
grounds, we regard scenario A results as more definitive and rely more on them in our
presentation.
T1 and T2 are constructed from exports from India and South Africa to the EU and the US.
In addition to the breakdowns between scenarios A and B and between exports to the EU and the
8 Note that our method differs from that of an UNCTAD study for India also using input-output analysis
(UNCTAD, 2009). The UNCTAD study uses export data for 2006-07 and 2007-08 to estimate employment
projections for 2008-09, 2009-10 and 2010-11.

6
US, employment results are further broken down between male and female workers and between
more and less educated workers. In this sense, the paper evaluates the effects of trade expansion
on employment inequality as well as income inequality. We use data on less educated workers as
a proxy for less skilled workers, with less educated workers defined as those having no more than
lower secondary education, equivalent to eight years of education in India and nine years in South
Africa.
Though the Leontief multiplier model has been widely used in the literature on trade and
employment, it nonetheless has well-known limitations, in particular that it is linear and non-
dynamic. This study does not, for example, address positive dynamic effects through economic
growth or negative dynamic effects through trade-induced labour-displacing technical change
(Jonsson and Subramanian, 2001; Wood 1995). Yet we do not regard these as serious limitations
on our estimates, given the short time frame considered and the contractionary effects of the crisis
more generally. Note also that E is based on employment and output data for SAMs base years,
which precede the crisis by several years. Given trends towards labour-displacing technical
change (more output with less employment), this suggests that our employment estimates are
somewhat overestimated in this regard.
The scope of the study is necessarily limited by the databases used in the analysis. The
SAMs and labour force surveys used cover both formal and informal establishments and workers,
and in this sense are comprehensive. But our trade data for the EU (from Eurostat) and the US
(US International Trade Commission) do not include trade in services. From 1990 to 2006, trade
in services increased as a percentage of GDP from 3 to 15 percent in India and 5 to 10 percent in
South Africa (WB/WDI, 2009). While trade in services during the crisis has been referred to as
“the collapse that wasn‟t,” service exports did decline substantially for India, though not as much
as merchandise exports (Borchert and Mattoo, 2009; Kumar and Alex, 2009). In this sense, our
study underestimates the effects of trade contraction in the crisis. Our study does, however,
address the indirect and income-induced effects of trade contraction on service industries, which
turn out to be substantial. For the sake of expediency, we define tradeable goods industries as
those for which we have trade data and define all other industries as non-tradeable, including
service industries. These are delineated below in industry-level results.
Further notes on data sources and definitions as well as data cleaning procedures for the
construction of T1 and T2 are provided in an appendix, and export demand vectors (for the EU
and US), labour coefficients (relative to the country average), Type II income multipliers, and
industry-level data on output, employment and trade openness are shown in Appendix Table 1.
4. Employment results
4.1. Country-level results
In developing countries with extensive informal employment and underemployment, the
estimation of changes in employment via changes in production is not straightforward. This holds
particularly for India, where as of 1999-2000, the vast majority of workers were in the
“unorganized” sector – 77 percent in urban areas and 95 percent in rural areas (Sakthivel and
Joddar, 2006). In this sense, what we refer to as employment declines may in fact translate into
movements from formal into informal employment or increases in underemployment, but in any
case means a negative impact for workers on average through some combination of employment
declines and losses of income. For example, a study of 41 middle-income countries (including
South Africa but not India) finds that workers in most of these countries were affected more

7
through earnings than employment (Khanna, et al., 2010).9 These qualifications should be born in
mind when considering the following results.
Country-level employment results based on Type II multipliers are presented in absolute and
relative terms in Table 1 for scenarios A and B, respectively. That is, this table shows the number
of FTE jobs and the number of such jobs as a percentage of SAMs base year employment, broken
down between trade with the EU and US and between what we define as tradeable goods and
non-tradeable industries, based on the availability of trade data.
For India taking trade with the EU and US together, employment declines are estimated to
be 3.9 million FTE jobs for all industries based on scenario A and 10.1 million based on scenario
B – equivalent to 1.1 and 3.2 percent of base year employment. That is, trade contraction during
the crisis is estimated to have resulted in 3.9 million “jobs lost” and an additional 6.2 million
“jobs not created,” as we have defined these. The large estimate for “jobs not created” reflects the
rapid growth of exports from India prior to the crisis. Employment declines are driven more by
trade with the US than the EU. Estimated employment declines for non-tradeable industries are
substantial, even though these do not include direct trade effects for these industries. These are
equivalent to 17.6 and 19.1 percent of estimated employment losses for all industries based on
scenarios A and B respectively.
For South Africa taking trade with the EU and US together, employment declines for all
industries are estimated to be 886,000 FTE jobs based on scenario A and 963,000 based on
scenario B. That is, trade contraction is estimated to have resulted in 886,000 million “jobs lost”
and an additional 77,000 “jobs not created.” Though absolute employment declines are much
lower for South Africa than India, relative declines are much higher, equivalent to 7.2 and 7.8
percent of base year employment based on scenarios A and B respectively. In contrast with India,
employment declines are driven more by trade with the EU than the US. Estimated employment
declines for non-tradeable industries are also relatively higher for South Africa, equivalent to 41.3
and 42.5 percent of estimated employment declines for all industries based scenarios A and B
respectively.
How important were income-induced effects versus direct and indirect effects in accounting
for these findings? Results based on Type I multipliers are presented in absolute and relative
terms in Table 2 for scenario A. Additionally presented are Type I multiplier employment effects
as a share of Type II multiplier employment effects, shown in the bottom panel. Income induced
employment effects as a percentage of total employment effects (based on Type II multipliers) are
therefore equal to 100 minus the percentage shown in this bottom panel. For India, taking EU and
US trade together, the share of total employment effects resulting from income-induced effects is
about one-half for tradeable goods industries, two-thirds for non-tradeable industries, and one-
half for all industries; for South Africa, the comparable shares are about one-third for tradeable
goods industries, two-thirds for non-tradeable industries (essentially the same as for India), and
just over 40 percent for all industries.
Income induced effects play an important role in accounting for employment declines
resulting from trade contraction in the crisis. It is worth noting, in this regard, that income
9 This overall pattern did not hold, however, for South Africa, which had similar percentage declines in the
wage bill and employment, along with the sixth highest percentage decline in employment among the 41
countries (Khanna et al., 2010). Note also that for South Africa, the share of informal employment declined
overall between the second quarter of 2008 and the third quarter of 2009, with the informal sector
accounting for a higher share of job losses until the third quarter of 2009, when this pattern reversed
(Verick, 2010). As Verick writes, “This suggests that adjustment in the informal sector has been more rapid
while employers in the formal sector are only more recently resorting to layoffs to cope with reduced
demand” (ibid., p. 5).

8
induced effects likely make up a higher share of total effects in poorer countries, a result of the
combination of Engel‟s Law (with high shares of income spent on food) and low labour
productivity in agriculture. For this we provide further detail in our discussion of agriculture in
industry-level results. The implication is that analyses relying only on Type I multipliers provide
a systematically less complete picture of total effects in poorer than richer countries. Also worth
remark is the much lower share of Type I multiplier employment estimates in tradeable goods
industries resulting from indirect effects in India (27 percent) than South Africa (53 percent). This
is consistent with India‟s greater reliance on domestic inputs for export production and South
Africa‟s greater reliance on imported inputs.
In sum, we estimate that India and South Africa experienced sizeable employment declines
as a result of trade contraction with the EU and US during the 2008-09 global crisis, even based
on our more conservative scenario A. In India and especially South Africa, a large share of these
employment declines occurred in non-tradeable industries through indirect and income-induced
effects originating from tradeable goods industries. Income-induced effects also accounted for
sizeable shares of estimated employment losses in tradeable goods industries. An important
policy consideration is that even if a country‟s financial institutions were relatively protected
from the turmoil of the crisis, employment and incomes may be hit hard nonetheless through
resulting trade contraction, with strong ripple effects throughout the economy.
4.2. Industry-level results
Country studies evaluating the industry-level effects of trade liberalization on employment
commonly find patterns of winning and losing industries. Such patterns are consistent with the
playing out of differences – within and among countries – in industry competitiveness in the face
of market opening. Which will be a country‟s winning and losing industries is a central question
of trade theory. As the WTO‟s World Trade Report 2008 puts it, “[m]ost trade models are
designed to answer two closely related questions: what goods do countries trade and why” (WTO,
2008, p. 27).
Yet “The Great Trade Collapse” is a fundamentally different phenomenon than trade
liberalization, and there is less of a foundation for developing theoretical priors about industry-
level effects. The “compositional effect” can provide useful guidance in this regard, however,
describing as it does particularly rapid trade declines for “postponeable” consumer durable and
investment goods (Baldwin, 2009a). Trade patterns for India and South Africa provide some
support for the “compositional effect.” For example, the three industries with the greatest drop in
exports to the EU and US (taken together) can be classified as “postponeable” consumer durable
and investment goods (Appendix Table 1, based on scenario A). Indeed these are the same three
industries in both countries: iron, steel and non-ferrous metals; non-electrical machinery; and
misc. manufacturing (the last including jewelry and precision instruments). Yet not all industries
fit neatly into this pattern, for there were increases in exports of chemicals for both India and
South Africa, and large declines in exports of agriculture and manufactured food products for
India. Moreover, the effect of industry-level changes in exports on industry-level changes in
employment is somewhat roundabout, mediated as it is by indirect and income-induced effects as
well as by differences in the labour-intensity of production across industries.
Industry-level results based on Type II multipliers are shown for India and South Africa in
tables 3 and 4 respectively, expressed in absolute terms for trade with the EU and US separately
and together and in relative terms for the EU and US together. Also shown are percentages of
female and less-educated workers in SAMs base years. The upper panel of these tables show
tradeable goods industries, with manufacturing industries shaded, and the lower panel shows non-
tradeable industries. For the sake of brevity, we focus on scenario A results, with scenario B
results shown in Appendix Tables 2 and 3.
For India looking at trade with the EU and US together, only two of 37 industries (23 of
these tradeable goods industries) are estimated to gain employment: fishing and rail equipment

9
and other transport equipment, with estimated increases of about 18,000 and 12,000 jobs
respectively, small in comparison to overall estimated employment declines.
In absolute terms, agriculture had far and away the largest estimated employment declines,
accounting for 2.2 million of the estimated 3.9 million jobs lost economy wide. As noted above,
given extensive informal employment and also subsistence agriculture in India, these estimated
job losses would be made manifest in a combination of job loss and loss of income. Because the
agricultural sector in India is so large, however, estimated employment declines from trade
contraction relative to 2003/4 employment are actually somewhat smaller than for the economy as
a whole (1.07 versus 1.10 percent).
Note that these results are based on a Type II multiplier, which accounts for income induced
effects on top of direct and indirect effects. Applying a Type I multiplier indicates that 780,000 of
the 2.2 million estimated employment decline in agriculture results from direct and indirect
effects, with the difference of 1.4 million resulting from income induced effects. For the economy
as a whole, applying a Type I multiplier indicates that 1.9 million of the 3.9 million estimated
employment decline results from direct and indirect effects, with the difference of 2.0 million
resulting from income induced effects (Table 2). Focusing on income induced effects, comparing
the 1.4 million for agriculture with 2.0 million for the economy as a whole means that about 70
percent of economy-wide income induced effects is accounted for by the agriculture alone. This
supports the notion that income induced effects make up a higher share of total effects in poorer
countries, a result of a combination of Engel‟s Law and low labour productivity in agriculture.
Note that in both India and South Africa, the labour intensity of agriculture was five times higher
than for the economy as a whole (Appendix Table 1).
In relative terms, the industries with the largest estimated employment declines in India are
misc. manufacturing, which includes gems and jewelry (7.8 percent of 2003/04 employment),
jute, hemp and mesta textiles (4.3 percent, though with small absolute declines), iron, steel and
non-ferrous metals (3.9 percent), non-electrical machinery (3.2 percent), furniture and wood
products (3.2 percent) and metal products (3.1 percent). Some of these industries are of a similar
type, such as iron, steel and non-ferrous metals, metal products and non-electrical machinery, all
metal-based heavy industries. But these industries vary in other respects. For example, while
furniture and wood products is labour-intensive and reliant on less educated workers, non-
electrical machinery is capital-intensive and skills-intensive (Table 2, Appendix Table 1).
For South Africa, only construction had estimated employment gains, with a small increase
of 4,000 jobs. As with India, agriculture (grouped together with hunting, forestry and fishing) had
the largest absolute employment declines, with an estimated 241,000 jobs lost, equivalent to 11.6
percent of 2000 employment. In contrast with India, however, there was an increase in agriculture
exports to the EU and US, taken together (Appendix Table 1, scenario A).10
Using a Type I
multiplier indicates that 145,000 of the estimated jobs lost in agriculture result from (positive)
direct and (negative) indirect effects, with the difference of 96,000 resulting from (negative)
income induced effects. For the economy as a whole, 511,000 of the 886,000 estimated jobs lost
result from direct and indirect effects and the balance of 375,000 from income induced effects
(Table 2). So about one-fourth of economy-wide income induced employment declines result
from agriculture, a sizeable share but less than the comparable figure of 70 percent for India.
10 Note that there was also an increase in exports from the food processing and beverages and tobacco
product industries to the EU and US, taken together, which relied heavily on inputs from agriculture
(Appendix Table 1, Scenario A). These positive trade effects were more than offset by negative trade
effects from the textiles, rubber and plastic products, and furniture industries, which also relied heavily on
inputs from agriculture.

10
In relative terms, the industries with the largest estimated employment declines are wood
products (an impossibly high 141.5 percent of 2000 employment11
), glass products (60.9 percent),
printing and publishing (35.5 percent) and metal products (29.6 percent). As with India, these
industries vary widely in terms of their labour-intensity and skills-intensity. For example, wood
products is labour-intensive and reliant on less educated workers whereas metal products is
capital-intensive and skills-intensive (Table 3, Appendix Table 1).12
4.3. Gender and skills bias results
There are large literatures on skills and gender biases of trade liberalization (e.g, WTO,
2008; van Staveren et al., 2007). Much of the skills bias literature is motivated by the Heckscher-
Ohlin theorem regarding relative factor endowments as determinants of comparative advantage,
with developing countries generally posited to have a comparative advantage in unskilled labour-
intensive goods with respect to developed country trading partners. The question of gender bias
too can be motivated along these lines, for women are commonly overrepresented among less
educated workers as well as in such export-oriented labour-intensive industries as clothing and
footwear.13
In India and South Africa, women and less educated workers are indeed
disproportionately concentrated in labour intensive industries. More specifically, there are
positive correlations between labour coefficients and the percentages of female and less-educated
workers, though with generally weaker relationships for India than South Africa, as shown in
Table 5. In the context of the crisis, the “compositional effect” may also come into play,
depending on the representation of women and less-educated workers in “postponeable”
consumer durable and investment goods industries. For example, the percentage of female and
less-educated workers is lower than average in the non-electrical machinery and iron, steel and
non-ferrous metal industries in both India and South Africa (Tables 3 and 4).
We evaluate the extent of gender and skills bias by comparing the percentages of female and
less-educated workers in the SAMs base years with the percentages of female and less-educated
workers estimated to have lost jobs as a result of trade contraction in the crisis. Breakdowns
between male and female and more and less educated workers are based on the assumption that
employment changes are proportionate to actual shares of employment in the SAMs base years.14
Regarding employees, for example, we assume that employers do not make distinctions by gender
or education in the face of employment changes, maintaining the same proportions of men and
women and more and less educated workers. This is, of course, a rather strong assumption, and
there is a literature on how firms‟ hiring and firing patterns may differ for men and women and
more and less skilled workers over economic fluctuations (e.g., Rubery, 1988; Kucera, 2001;
11 Such a result can arise from the heterogeneous nature of the wood products industry and a subsequent
mismatch between the labour intensity of production for export to the EU and US compared with the
average labour intensity of production in the industry. In addition, the number of workers in the industry
may have increased between 2000 (the year of the South Africa SAM) and the crisis.
12 With respect to the labour intensity of production, one way of addressing this is by looking at the
correlation between export demand vectors and labour coefficients, that is, between T and the diagonal
elements of E . For India, there is effectively no correlation between these variables, with a Pearson
correlation coefficient of 0.07, based on scenario A for exports to the EU and US together. For South
Africa, there is also effectively no correlation, with a comparable Pearson correlation coefficient of 0.16.
13 In India, 94 percent of women have no more than lower secondary education, compared with 87 percent
of men as of 2003/04; in South Africa, the figures for women and men are nearly equal, with 43 percent of
women and 42 percent of men having no more than lower secondary education as of 2000.
14 E.g., if trade contraction is estimated to have resulted in a loss of 500 jobs in an industry in which one-
fourth of workers are female, these 500 jobs are broken down into 375 male and 125 female jobs.

11
Leung et al., 2009). In this sense, a precise interpretation of our results on gender and skills bias
is that they illustrate whether industries in which women and less educated workers are
disproportionately represented are particularly affected by job loss as a result of trade contraction
in the crisis.
Results are shown in Figure 5 regarding gender bias and Figure 6 regarding skills bias. We
present results based on scenario A for all industries and for EU and US trade together. Regarding
gender bias for India, an identical percentage of women workers, 27.9 percent, is estimated to
have lost jobs as the actual percentage of women workers in 2003/04. That is, there effects of the
crisis through the channel of trade contraction are estimated to be gender neutral.
For South Africa a somewhat lower percentage of women workers is estimated to have lost
jobs than the actual percentage of women workers in 2000, 40.7 to 43.1 percent. For the economy
as a whole, then, there is a gender bias in favour of women workers as a result of trade
contraction in the crisis. That is, industries in which women were disproportionately concentrated
were less affected by the decline in exports to the EU and US. Though the difference of 2.4
percentage points is not large, it is consistent with the results of two prior studies assessing the
effects of the crisis on employment in South Africa using labour force survey data (Leung et al.,
2009; Verick, 2010).
Regarding skills bias for India, a slightly higher percentage of less educated workers is
estimated to have lost jobs than the actual percentage of less educated workers in 2003/04, 89.6 to
88.7 percent. This might indicate a small bias against less educated workers as a result of trade
contraction in the crisis, but we regard this finding as inconclusive given the magnitude of the gap
and the absence of corroborating studies.
For South Africa, a higher percentage of less educated workers is estimated to have lost jobs
than the actual percentage of less skilled workers in 2000 in these industries, 47.6 to 42.6 percent.
That is, industries in which less educated workers were disproportionately concentrated were hit
harder by trade contraction in the crisis. As with the finding on gender bias, this is consistent with
the results of two other studies (Leung et al., 2009; Verick, 2010).
In sum, for India we estimate that there was no gender or skills bias in employment resulting
from trade contraction in the crisis. In South Africa, there was somewhat of a gender bias in
favour of women workers and a stronger bias against less educated workers. The result on gender
bias in favour of women workers during the crisis is usefully set against a prior study‟s findings
of gender bias against women workers during the period of trade liberalization from 1993 to 2006
(Kucera and Roncolato, forthcoming). An important determinant of the gender bias against
women workers prior to the crisis was the large numbers of jobs lost in the clothing industry as a
result of trade expansion with developing countries, combined with the high share of women
workers in the industry. This same study also found no skills bias against less educated workers
during the period of trade liberalization prior to the crisis. In this sense, both the gender and skills
biases observed in South Africa as a result of the 2008-09 trade contraction represent breaks from
previous trends.
5. Income inequality results
Shown in Figures 7 and 8 for India and South Africa, respectively, are the estimated impacts
of trade contraction on household income distribution relative to SAMs base year incomes, based
on scenario A. Scenario B results shown in Appendix Figures 1 and 2 and are similar to scenario
A results in terms of distribution, but are higher by factors of about 2.5 for India and 1.1 for South
Africa. The larger difference for India results from its more rapid export growth prior to the crisis.
Breakdowns are shown within urban and rural areas by household income quintiles as well as for
between urban and rural areas more broadly, as well as between EU and US trade.
For India, there is little difference between rural and urban areas as well as for households
within these areas, with trade contraction with the EU and US estimated to have reduced income

12
by between 0.7 to 0.8 percent relative to 2003/04 income. Consistent with employment results,
income effects are driven more by trade with the US than the EU.
For South Africa, there is also little difference between rural and urban areas. But the effects
of trade contraction on incomes are consistently weaker for lower income quintiles, indicating
that world trade acted to reduce income inequality in the sense that poorer households lost less.
For the poorest income quintiles, trade contraction with the EU and US is estimated to have
reduced incomes by 3.1 percent in rural areas and 3.6 percent in urban areas, relative to 2000
income; for wealthiest incomes quintiles, the respective figures are 4.8 and 4.9 percent.
Consistent with employment results, income effects are driven more by trade with the EU than
the US.
Worth remarking is the similar effect in rural and urban areas of trade contraction on
household incomes.15
As with the large employment effects in both tradeable goods and non-
tradeable industries, this illustrates the wide-ranging impact of the crisis in India and South Africa
through the channel of trade contraction.
6. Comparison with actual changes in employment and Government crisis responses
“The Great Trade Collapse” may have been the most important transmission through which
India and South Africa were affected by the crisis, but it was not the only channel. Foreign capital
flows and exchange rates also came into play, and conversely the negative effects of all
transmission channels were offset to an extent by Government crisis responses (Alex and Kumar,
2009; Leung et al., 2009). Our employment estimates are based on the effects of trade contraction
only, further limited to trade with the EU and the US. In this sense, comparing our estimated
changes in employment with actual changes in employment is an incomplete exercise. It can be a
useful exercise, nonetheless, in providing a consistency check on directions of change and orders
of magnitude. Already noted, in this regard, is the consistency between our results for South
Africa on gender and skills bias and findings of other studies on the overall impacts of the crisis
on employment (Leung et al., 2009; Verick, 2010).
We have also noted that – especially for India – our estimated employment declines may in
reality mean movements from formal to informal employment or increases in underemployment.
Strikingly, for South Africa the share of informal employment declined overall between the
second quarter of 2008 and the third quarter of 2009, with the informal sector accounting for a
higher share of job losses until the third quarter of 2009, when this pattern reversed (Verick,
2010). As Verick writes, “This suggests that adjustment in the informal sector has been more
rapid while employers in the formal sector are only more recently resorting to layoffs to cope
with reduced demand” (ibid., p. 5).
For India, comprehensive labour force surveys for the period of the global crisis were not
available as of mid-2010, making it difficult to have a definitive sense of overall employment
changes. The Government did carry out establishment surveys in eight industries that reportedly
account for 60 percent of India‟s GDP as of 2007-08, though these were “quick” small sample
surveys addressing mainly formal employment (Government of India; ILO, 2010b). Notably, the
15 For South Africa, this finding may seem surprising in light of the estimates of larger than average relative
employment losses in agriculture resulting from trade contraction (Table 4). However, there is a
compositional difference between rural household incomes and agriculture, defined by non-farm rural
employment as well as income earned by members of rural households in urban areas. Perhaps more
fundamentally, any given change in agricultural income has a disproportionately large employment effect,
given the sector‟s relatively high labour intensity (Appendix Table 1).

13
surveys did not include agriculture, which accounted for 57 percent of employment in India as of
2005 (NSSO, 2006). Based on these surveys, there were estimated employment declines in the
second quarter of 2009 of 131,000 workers for the eight industries taken together. Yet
employment increased overall in these industries by 1,060,000 workers between the first quarters
of 2009 and 2010. Worth noting in this regard is that while India‟s exports to the world declined
precipitously during “The Great Trade Collapse,” they began to pick up after the second quarter
of 2009 (Kumar and Alex, 2009).
Results of the government survey are shown in Table 6 as average monthly percent changes
at the industry-level and for the eight industries together. For the first two quarters of 2009,
survey results are broadly consistent with our employment estimates for leather, metals, and
transport, with employment declines in both the Government surveys and our estimates, and for
automobiles (grouped with rail and other transport equipment in our estimates), with employment
gains in both the Government surveys and our estimates. The remaining four industries show
employment gains in the Government surveys and employment declines in our estimates,
matching with the most closely corresponding industries (e.g., gems and jewelry are a component
of misc. manufacturing). This discrepancy could be partially accounted for by our finding for
India that “jobs not created” as a result of the global crisis was a more important factor than “jobs
lost” (Table 1). In other words, even though employment grew in these sectors, it may have
grown by less than it would have had there been no global crisis.
The Indian Government‟s crisis response was informed by the Indian Labour Conference
held in February of 2009 with representatives of the Government, workers and employers
organizations, and a Tripartite Expert Group was established as a follow-up. The Government
initiated three fiscal stimulus packages between December 2008 and February 2009, but these
were relatively small, totalling less than one percent of the country‟s GDP (ILO, 2010b). In
addition to public works, specifically transport and electrical power infrastructure, policies
included tax reductions and measures to ease credit constraints. Industries targeted for support
included banking and finance, information technology, automobiles, food processing, textiles,
handloom, carpets, handicrafts leather, jewelry and seafood products (ILO, 2009; ILO, 2010b).
These industries overlapped to a large extent with those in the Government‟s “quick”
establishment survey.
An important complement to the Government‟s crisis response was the National Rural
Employment Guarantee Act (NREGA), adopted in 2005, which guaranteed to poor rural
households a minimum of 100 days of paid employment. The NREGA is relevant not only for the
large number of workers in agriculture estimated to have lost employment and income as a result
of the crisis. As an ILO source puts it, the NREGA “provided employment for some of those
migrating from urban to rural areas as a result of job losses in export industries” (ILO, 2010b, p.
3).
One potential problem with industry-level crisis responses is that they may focus unduly on
industries more directly affected by the crisis, and in general, the Indian Government‟s industry-
level policies did indeed focus on such industries. As we have observed, though, some of the
largest estimated employment declines as a result of trade contraction occurred in non-tradable
industries that were not targets of Government support. These include wholesale and retail trade,
transport services, and other services, with employment declines in these industries resulting from
the indirect and income-induced effects of trade contraction (Table 3).16
South Africa undertakes quarterly labour force surveys and publishes them shortly after the
survey itself. Year-on-year changes for periods ending with the third and fourth quarters of 2009
16 For some other assessments of the Indian Government‟s crisis response, see Bhaskaran and Ghosh, 2010;
Ghosh and Chandrasekhar, 2009; ILO, 2009; Khatiwada, 2009; Nachane, 2009 and Rakshit, 2009.

14
and first quarter of 2010 show overall employment declines of 770,000, 833,000 and 870,000
respectively (Stats SA). These figures are similar to our estimated employment declines of
886,000 based on scenario A and 963,000 based on scenario B. Because of the qualifications
noted above, there is an element of happenstance in this similarity, but it nevertheless suggests
that our estimates are of a reasonable order of magnitude.
Industry-level survey results are shown in Table 7 as year-on-year and quarter-to-quarter
percent changes. These are available at a less disaggregated level in the published Quarterly
Labour Force Survey (SAQLS) than in our results. For example, most of our industry breakdowns
are within manufacturing, which is treated as one industry in the SAQLS. Consistent with our
findings are employment declines in agriculture, mining, manufacturing, trade and transport, with
agriculture being particularly hard hit. At odds with our findings are employment declines in
construction (for which we estimate essentially no change in employment) and employment gains
in finance (for which we estimate employment declines). That employment in finance grew in
South Africa is suggestive of the sector‟s robustness in the face of the crisis.
The automobile and mining industries in South Africa merit additional discussion as they are
reported to have been particularly hard hit by the crisis and yet our estimates show that relative
employment losses are lower than average (-1.5 percent for gold mining and other mining and -
3.1 percent for vehicles, compared to -7.2 percent for all industries, as shown in (Table 4) (Gabru,
2009; SARW, 2009). For the automobile industry, much of this discrepancy can be accounted by
the fact that half of the industry‟s exports (as of 2003) were to Japan (35 percent) and Australia
(15 percent), which are not included in our analysis (ECDC, 2005). Similarly for the mining
industry, two of the largest export markets are China and Japan, also not included in our analysis
(SARW, 2009). These two industry examples illustrate that our estimates of employment losses
must be read as referring exclusively to trade with the EU and US and that the effects of global
trade contraction would seem to be much more severe.
The South African Government‟s crisis response has been referred to as a “mega-stimulus
package,” equivalent to about one-fourth of the country‟s GDP with the largest share spent on
public works (Kumar and Vashisht, 2009, p. 4; ILO, 2010c). Though some of these policies were
initiated prior to the crisis, they were embodied in the Framework for South Africa’s response to
the international crisis of February 2009 as well as the Progress report of December 2009
(NEDLAC, 2009a, 2009b). The Framework was developed by the National Economic
Development and Labour Council (NEDLAC), comprised of representatives of the Government,
workers, employers and community organizations. The Framework is both ambitious and wide-
ranging, addressing transport and electrical power infrastructure, macroeconomic, trade and
industrial policies, job training and policies to avoid job cuts, social policies, and global
coordination. This was complemented by the Government‟s 2010/11 – 2012/13 Industrial Action
Policy Plan of February 2010 (SA, 2010a).
Worth noting is that the Framework aims to not only provide support to such traceable good
industries as “clothing, textiles and footwear, mining and the auto and capital equipment sectors,”
but also to “retail, housing construction and private services” (NEDLAC, 2009a, p. 9). In this
sense, the Government‟s crisis response is broadly consistent with the results of both our analysis
as well as with the SAQLS. Conspicuous by its absence from the Framework is agriculture, yet a
“Comprehensive Rural Development Programme” was approved by the Government in August
2009 (SA, 2010b).17
The crisis responses of the Governments of India and South Africa differed in scale and
scope, partly reflecting the different challenges these countries faced. For example, real GDP in
17 For some other assessments of the “Framework” and its implementation, see Frye, 2009; ILO, 2009;
ILO, 2010c; Khatiwada, 2009; Marais, 2009; SEG/ILO, 2010.

15
India grew by 5.7 percent in 2009, down from 9.4 percent in 2007 and 7.3 percent in 2008, but
still respectable nonetheless. In contrast, real GDP shrank in South Africa by -1.8 percent in 2009,
compared to growth rates of 5.5 percent in 2007 and 3.7 percent in 2008 (IMF, 2010). The two
countries faced more similar challenges, though, when it came to employment. This is suggested
by the considerably less favorable employment growth rates for the first quarter of 2010 than the
fourth quarter of 2009 for both countries. For India, the average monthly growth rate of
employment was 1.7 percent in the fourth quarter of 2009 but only 0.2 percent in the first quarter
of 2010, for the eight industries surveyed (Table 6). For South Africa, the quarter-to-quarter
growth rate of employment was 0.7 percent in the fourth quarter of 2009 after three quarters of
negative growth, but was -1.3 percent in the first quarter of 2010 (Table 7). With respect to the
effects of the global crisis on employment, the Governments of both India and South Africa faced
pressing challenges into 2010.
7. Concluding remarks
Earning the appellation “The Great Trade Collapse,” trade contraction was a more important
cross-border transmission channel in the global crisis of 2008-09 than in any previous post-World
War II crisis (Baldwin, 2009a). This development caught many policy-makers off-guard, who had
reasonably focused their concerns on financial transmission channels. The magnitude of trade
contraction during the crisis arguably resulted from “compositional” and “synchronicity” effects,
manifestations of our current wave of globalization very much at odds with the notion of
“decoupling.”
This study finds that declining exports to the EU and US during “The Great Trade Collapse”
had substantial negative effects on employment and incomes in India and, more so, South Africa.
The effects of trade contraction swept widely across these countries. The vast majority of
industries are estimated to experience employment declines as a result of trade contraction, in
both tradeable and non-tradeable sectors. Even though the shock originated in the tradeable goods
sector, a large share of total estimated employment declines result from ripple effects in non-
tradeable industries. Moreover, a large share of estimated employment declines are income-
induced, for which we argue an important determinant is a combination of Engel‟s Law (with
higher shares of income spent on food in poorer countries) and low labour productivity in
agriculture in India and South Africa.
Also illustrating the sweeping effects of “The Great Trade Collapse” is that households in
rural and urban areas are similarly affected by income losses. Consistent with this, agriculture is
estimated to be the hardest hit of all industries in terms of absolute employment declines.18
At the
same time, there are some notable differences between India and South Africa regarding the
pattern of employment declines across industries. For example, indirect employment effects
within the tradeable goods sector (resulting from production linkages) are a good deal more
important in India than South Africa, consistent with India‟s greater reliance on domestic inputs
for export production. For South Africa, we find that industries with higher shares of unskilled
and male workers are disproportionately affected by employment declines, while no such
evidence of skills or gender bias is found for India.
The importance of trade as a transmission channel has particular bearing on countries like
India and South Africa that have rapidly opened up to international trade in recent years.
International trade is arguably a necessity for developing countries aiming to narrow the
technology gap with developed countries, for it enables them to earn foreign currency and
purchase foreign technology. Yet the global crisis also reveals how greater trade openness can be
18 As suggested by our estimates of agriculture having the largest absolute employment declines, with this
being manifested in a combination of employment and income declines.

16
a source of vulnerability in a volatile global economy, presenting a significant challenge to
policy-makers.

17
Appendix: Data sources and notes
I. Data sources
Trade data. EU: Eurostat; US: US International Trade Commission. Monthly import data
from India and South Africa at the Harmonized System (HS) eight-digit level.
Social accounting matrices. India: Saluja, M.R.; Yadav, B. 2006. Social Accounting Matrix
for India 2003-04, (Haryan, India Development Foundation); South Africa: Thurlow, J. 2005.
South African Social Accounting Matrices for 1993 and 2000, (Washington, D.C., International
Food Policy Research Institute).
Employment data (including by gender and years of education). India: National
Sample Survey Organisation (NSSO). 2006. National Sample Survey: Employment-
Unemployment NSS 61st Round, July 2004-June 2005 (New Delhi, Government of India National
Sample Survey Organisation); South Africa: Statistics South Africa (Stats SA). 2003. Revised
estimates Labour Force Survey September 2000 (Pretoria, Statistics South Africa).
II. Data notes
Because of differences in industry classifications and levels of aggregation, it was not
always possible to perfectly match the above data sources at the industry level. Whenever
possible, the social accounting matrices provided the industry classifications to which other data
were adapted. Documentation describing exceptions and anomalies is available from the authors
upon request.
II. A. Trade data preparation
1. Data was downloaded going back to the SAMs base years, 2003/4 for India and 2000 for South
Africa.
2. The constant price for each product at the HS eight-digit level was calculated as the unit value in
the base year. When there were no data for the base year, data for the nearest available year were
used, affecting data accounting for 25 percent of the total trade to the EU and US from India and
South Africa. If no data were reported for the product for any year prior to 2008, current values
were used, affecting data accounting for 3 percent of the total trade.
3. Data were converted to Rupees and Rand using the average exchange rate in the base year.
4. Data were aggregated from the HS eight-digit level to the level of aggregation used in the SAMs.
II. B. Trade data cleaning
As is common when dealing with unit values based on trade data, the initial data preparation
led to substantial problems with outliers. The following cleaning steps were applied. The
procedure was fine-tuned by carefully reviewing fluctuations at the product-level and sectoral-
level, and – whenever possible – comparing the fluctuations in unit values with fluctuations in
international commodity prices reported by the Global Economic Monitor (World Bank).
1. Most outliers resulted from unit values calculated based on very small trade flows. Therefore, for
the purpose of calculating the unit values, trade flows were omitted if:
a. The quantity (in whichever unit it is measured) was below 1;
b. Non-zero trade flows were reported for less than 3 months in a given year;
c. Trade flows in a given year added up to less than 1/15 of total trade for the product over
the entire period of observation.
18
As a result of this procedure, when a year other than the base year was used for the calculation
of the unit values, the share of affected data increased from 25 to 42 percent of total trade to the EU
and the US from India and South Africa, and when current values were used for the calculation of
unit values, the share of affected data increased from 3 to 25 percent of total trade.
2. To avoid a strong impact of the few remaining outliers, a maximum of 5 and a minimum of 1/5
were imposed on the deviation of the constant price value from the current price value for any
given month. This affected less than 1 percent of total trade.
3. Two ad-hoc cleaning steps were undertaken for industries where data was considered inconsistent
or not credible. In these cases, the current instead of the constant values were used.
a. South Africa: Exports to the US of leather Products (accounting for less than 0.5 percent of total
exports to the US).
b. India: Exports to the EU of misc. manufacturing (accounting for 9 percent of total exports to the
EU).

19
Tables
Table 1: Country-Level Employment Effects from Trade (Type II multiplier)
Scenario A
Number of jobs (FTE)
India South Africa
EU US EU&US EU US EU&US
Tradeable goods industries -1'163'804 -2'088'266 -3'252'070 -354'302 -166'124 -520'426
Non-tradeable industries -195'327 -496'734 -692'061 -266'992 -99'068 -366'060
All industries -1'359'131 -2'585'000 -3'944'131 -621'294 -265'192 -886'486 Number of jobs as a % of SAMs base year employment
India South Africa
EU US EU&US EU US EU&US
Tradeable goods industries -0.46 -0.82 -1.28 -8.30 -3.89 -12.19
Non-tradeable industries -0.19 -0.48 -0.66 -3.32 -1.23 -4.56
All industries -0.38 -0.72 -1.10 -5.05 -2.16 -7.21
Scenario B
Number of jobs (FTE)
India South Africa
EU US EU&US EU US EU&US
Tradeable goods industries -3'741'618 -4'400'303 -8'141'920 -369'835 -183'822 -553'657
Non-tradeable industries -845'412 -1'076'805 -1'922'217 -298'954 -110'290 -409'245
All industries -4'587'030 -5'477'108 -10'064'137 -668'789 -294'113 -962'902 Number of jobs as a % of SAMs base year employment
India South Africa
EU US EU&US EU US EU&US
Tradeable goods industries -1.47 -1.73 -3.20 -8.66 -4.31 -12.97
Non-tradeable industries -0.81 -1.03 -1.84 -3.72 -1.37 -5.09
All industries -1.28 -1.53 -2.81 -5.44 -2.39 -7.83

20
Table 2: Country-Level Employment Effects from Trade (Type I multiplier)
Scenario A
Number of jobs (FTE)
India South Africa
EU US EU&US EU US EU&US
Tradeable goods industries -690'242 -938'041 -1'628'284 -245'740 -126'787 -372'527
Non-tradeable industries -66'781 -184'512 -251'292 -100'173 -38'621 -138'794
All industries -757'023 -1'122'553 -1'879'576 -345'913 -165'408 -511'321
Number of jobs as a % of SAMs base year employment
India South Africa
EU US EU&US EU US EU&US
Tradeable goods industries -0.27 -0.37 -0.64 -5.76 -2.97 -8.72
Non-tradeable industries -0.06 -0.18 -0.24 -1.25 -0.48 -1.73
All industries -0.21 -0.31 -0.52 -2.81 -1.34 -4.16
Type I multiplier jobs as a % of Type II multiplier jobs
India South Africa
EU US EU&US EU US EU&US
Tradeable goods industries 59.3 44.9 50.1 69.4 76.3 71.6
Non-tradeable industries 34.2 37.1 36.3 37.5 39.0 37.9
All industries 55.7 43.4 47.7 55.7 62.4 57.7

Table 3: Industry-Level Employment Effects from Trade for India: Scenario A (Type II multiplier)
Number of jobs (FTE) No. jobs as % of 2003/4 empl.
% of 2003/4 empl.
EU US EU & US EU & US Female Less Educ.
Tra
dea
ble
go
od
s in
du
stri
es
1 Agriculture -910'021 -1'290'224 -2'200'245 -1.07 35.0 95.6
2 Forestry and logging -5'797 -8'066 -13'864 -1.40 37.5 95.8
3 Fishing 9'540 8'281 17'821 1.39 12.6 97.3
4 Coal and lignite, crude petroleum and natural gas 2'539 -11'420 -8'881 -1.15 5.3 72.0
5 Iron ore and other minerals -21'201 -14'865 -36'065 -2.38 21.3 96.5
6 Manufacture of food products -32'047 -27'014 -59'061 -1.47 23.1 85.7
7 Beverages and tobacco products -9'434 -18'245 -27'679 -0.74 70.6 97.5
8 Cotton textiles -18'712 -42'312 -61'024 -2.43 31.1 90.3
9 Wool synthetic and silk fiber textiles -15'392 -23'242 -38'634 -2.01 27.7 94.2
10 Jute, hemp and mesta textiles -2'629 -5'113 -7'742 -4.30 21.2 92.4
11 Textile products 45'891 -197'926 -152'035 -2.75 33.1 91.2
12 Furniture and wood products -71'170 -98'209 -169'379 -3.16 20.3 95.5
13 Paper, paper products, printing and publishing -2'607 -8'786 -11'392 -0.90 10.7 64.6
14 Leather products -1'044 -18'962 -20'006 -1.35 15.6 86.8
15 Rubber and plastic products, petroleum products and coal tar products 4'888 -11'276 -6'388 -0.81 10.5 70.9
16 Chemicals -8'298 -600 -8'897 -0.52 37.3 68.6
17 Other non-metallic mineral products and cement -18'837 -23'463 -42'300 -1.11 24.1 93.9
18 Iron, steel and non-ferrous metals -18'329 -45'459 -63'788 -3.91 2.6 76.4
19 Metal products -17'620 -29'763 -47'383 -3.06 5.2 83.7
20 Non-electrical machinery -21'575 -14'483 -36'058 -3.18 4.2 60.2
21 Electrical machinery -15'131 -16'980 -32'111 -1.70 3.7 67.6
22 Rail equipment and other transport equipment 53'046 -41'247 11'799 0.36 1.5 80.6
23 Misc. manufacturing -89'864 -148'894 -238'758 -7.82 15.3 87.2
No
n-t
rad
eab
le in
du
stri
es
24 Construction -5'907 -14'341 -20'248 -0.09 9.9 94.3
25 Electricity and gas -3'361 -8'781 -12'142 -1.35 4.5 58.1
26 Water supply -177 -622 -799 -0.43 4.6 83.4
27 Railway transport services -3'400 -8'587 -11'986 -1.26 3.4 60.9
28 Other transport services -30'754 -76'045 -106'799 -0.83 1.3 88.1
29 Storage and warehousing -221 -552 -773 -0.93 0.0 75.6
30 Communication -4'430 -9'545 -13'975 -0.86 12.4 52.5
31 Trade -84'773 -211'284 -296'058 -0.94 11.5 78.9
32 Hotels and restaurants -10'160 -24'824 -34'984 -0.71 17.9 90.1
33 Banking -6'310 -16'319 -22'629 -1.15 13.5 29.8
34 Insurance -1'290 -3'364 -4'654 -0.90 14.1 16.2
35 Education and research -13'321 -32'292 -45'613 -0.46 39.2 23.1
36 Medical and health -5'913 -14'379 -20'292 -0.66 36.9 43.6
37 Other services -25'310 -75'800 -101'109 -0.74 31.5 82.1
38 All industries -1'359'131 -2'585'000 -3'944'131 -1.10 27.5 87.9

Table 4: Industry-Level Employment Effects from Trade for South Africa: Scenario A (Type II multiplier)
Number of jobs (FTE)
No. jobs as % of 2000 empl. % of 2000 empl.
EU US EU &US EU&US Female Less
Educ.
Tra
dea
ble
go
od
s in
du
stri
e
1 Agriculture, hunting, forestry and fishing -155'049 -85'990 -241'038 -11.62 44.69 74.88
2 Coal mining -2'230 -775 -3'004 -4.03 2.08 60.04
3 Gold mining and other mining -6'214 -1'678 -7'893 -1.49 3.00 52.13
4 Food processing -10'215 -3'873 -14'088 -6.38 32.11 38.10
5 Beverages and tobacco products -3'397 -1'367 -4'764 -6.50 36.80 42.99
6 Textiles -1'635 -2'182 -3'817 -4.22 64.50 36.56
7 Clothing -7'969 -2'477 -10'447 -4.60 82.92 45.02
8 Leather products -80 -194 -273 -1.80 37.74 25.04
9 Footwear -1'552 -541 -2'093 -6.29 52.07 46.08
10 Wood products -72'933 -55'986 -128'919 -141.45 16.22 49.83
11 Paper products -3'254 -848 -4'102 -13.07 30.57 30.99
12 Printing and publishing -21'087 -2'039 -23'126 -35.46 29.97 17.31
13 Petroleum products -926 -324 -1'249 -5.19 12.31 10.07
14 Chemicals -2'445 -922 -3'367 -5.79 28.10 15.79
15 Rubber and plastic products -2'260 -922 -3'181 -5.31 33.34 24.24
16 Glass products -16'333 5'992 -10'342 -60.93 22.07 40.67
17 Non-metal minerals -648 -849 -1'497 -1.90 23.58 58.89
18 Iron, steel and non-ferrous metals -6'211 -1'419 -7'630 -8.05 10.99 35.86
19 Metal products -33'584 -7'819 -41'403 -29.59 8.93 37.35
20 Non-electrical machinery -1'417 -410 -1'827 -3.12 18.94 29.54
21 Electrical machinery -710 -261 -971 -2.15 21.72 13.82
22 Communications equipment -106 -33 -140 -1.60 51.53 15.35
23 Scientific equipment -125 -46 -171 -2.94 45.58 19.36
24 Vehicles -1'964 -378 -2'342 -3.13 19.01 24.10
25 Transport equipment -52 -16 -68 -1.51 4.75 43.50
26 Furniture -936 -390 -1'326 -3.85 21.35 36.60
27 Misc. manufacturing -970 -377 -1'348 -3.51 39.32 44.46
No
n-t
rad
eab
le in
du
stri
es
28 Electricity, gas and water -2'430 -1'527 -3'958 -4.21 15.57 34.34
29 Construction 5'387 -1'267 4'121 0.60 7.28 58.51
30 Trade services, hotels and catering -129'280 -47'090 -176'370 -7.42 47.79 34.55
31 Transport and communication services -17'994 -4'340 -22'334 -3.82 14.89 34.03
32 Financial and business services -28'124 -11'607 -39'730 -4.02 39.88 10.92
33 Human health, veterinary and social work -18'417 -7'320 -25'738 -4.49 75.86 25.75
34 Education, other services and other activities n.e.c. -75'743 -25'689 -101'433 -4.65 69.16 44.75
35 Government services -391 -227 -618 -0.11 30.46 18.36
36 All industries -621'294 -265'192 -886'486 -7.21 43.05 42.61
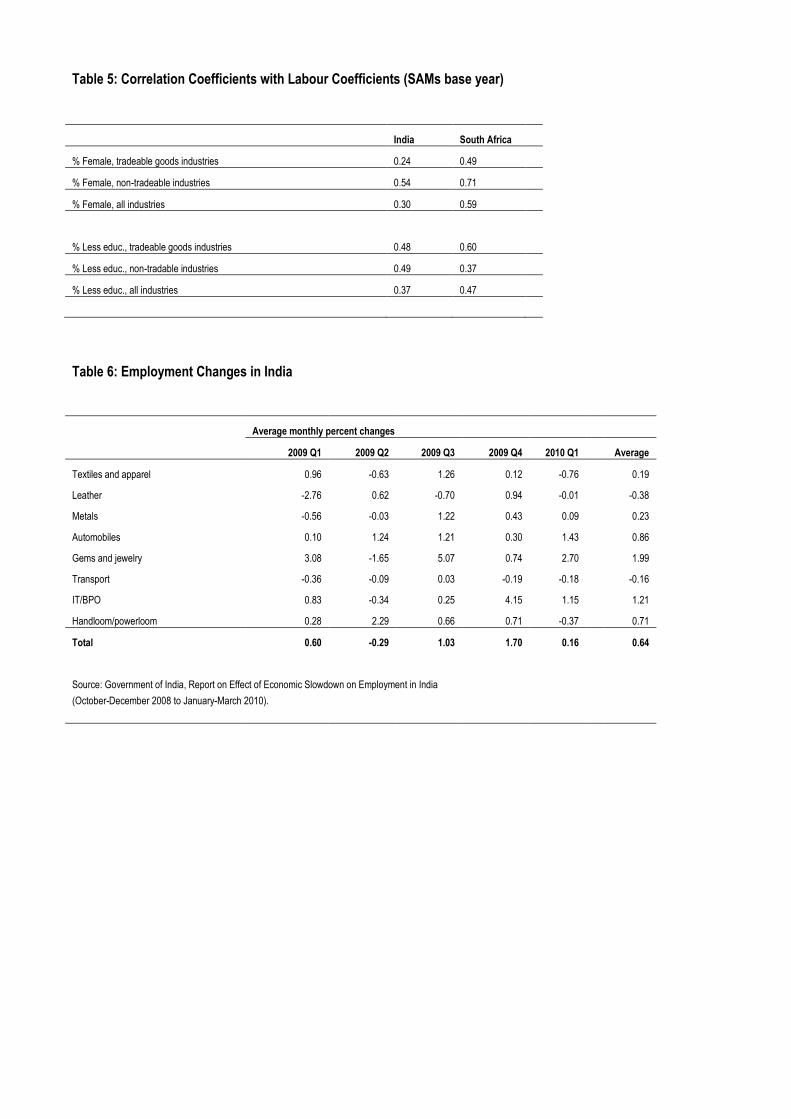
Table 5: Correlation Coefficients with Labour Coefficients (SAMs base year)
India South Africa
% Female, tradeable goods industries 0.24 0.49
% Female, non-tradeable industries 0.54 0.71
% Female, all industries 0.30 0.59
% Less educ., tradeable goods industries 0.48 0.60
% Less educ., non-tradable industries 0.49 0.37
% Less educ., all industries 0.37 0.47
Table 6: Employment Changes in India
Average monthly percent changes
2009 Q1 2009 Q2 2009 Q3 2009 Q4 2010 Q1
Average
Textiles and apparel 0.96 -0.63 1.26 0.12 -0.76
0.19
Leather -2.76 0.62 -0.70 0.94 -0.01
-0.38
Metals -0.56 -0.03 1.22 0.43 0.09
0.23
Automobiles 0.10 1.24 1.21 0.30 1.43
0.86
Gems and jewelry 3.08 -1.65 5.07 0.74 2.70
1.99
Transport -0.36 -0.09 0.03 -0.19 -0.18
-0.16
IT/BPO 0.83 -0.34 0.25 4.15 1.15
1.21
Handloom/powerloom 0.28 2.29 0.66 0.71 -0.37
0.71
Total 0.60 -0.29 1.03 1.70 0.16 0.64
Source: Government of India, Report on Effect of Economic Slowdown on Employment in India
(October-December 2008 to January-March 2010).

Table 7: Employment Changes in South Africa
Year-on-year percent changes
2009 Q1 2009 Q2 2009 Q3 2009 Q4 2010 Q1 Average
Agriculture -7.6 -10.1 -14.9 -19.5 -11.9 -12.8
Mining 0.0 -7.8 -4.8 -7.8 -11.1 -6.3
Manufacturing -5.3 -4.8 -10.1 -10.4 -9.2 -8.0
Utilities 5.3 -4.1 -18.2 14.0 -30.0 -6.6
Construction 1.3 -1.8 -4.1 -8.9 -9.3 -4.6
Trade -4.3 -4.6 -10.2 -9.2 -6.5 -7.0
Transport 1.3 -6.1 -4.2 -4.5 1.3 -2.4
Finance 3.5 1.4 3.1 7.5 -5.3 2.0
Community and social services 3.4 1.1 0.9 -1.2 0.2 0.9
Total 0.1 -2.6 -5.6 -6.3 -6.1 -4.1
Quarter-to-quarter percent changes
2009 Q1 2009 Q2 2009 Q3 2009 Q4 2010 Q1 Average
Agriculture -3.4 -3.8 -8.0 -5.8 5.7 -3.1
Mining 3.7 -4.2 -6.3 -1.0 0.0 -1.6
Manufacturing -3.2 -0.5 -8.0 1.1 -1.9 -2.5
Utilities 16.3 -7.0 -12.9 21.0 -28.6 -2.2
Construction -5.5 -0.8 -5.4 2.6 -5.9 -3.0
Trade -4.5 -2.0 -3.7 0.7 -1.7 -2.2
Transport -2.2 -4.0 1.4 0.3 3.8 -0.1
Finance 5.4 -0.9 -1.6 4.6 -7.2 0.1
Community and social services -0.4 0.5 -1.4 0.0 1.1 0.0
Total -1.5 -2.0 -3.6 0.7 -1.3 -1.5
Source: Statistics South Africa, Quarterly Labour Force Survey (Quarter 1, 2009 to Quarter 1, 2010).

25
Appendix Table 1: Trade demand vectors and other industry-level data, India
Export demand vectors (in 2003/04 Rupees)
Scenario A Scenario B Trade Openness1
EU US EU US (X+M/Output)
Output (2003/04, in 2003/04 Rupees, lakhs)
Employment (2003/04)
Labour Coefficient (2003/04, rel. to avg.)
Income Multipler (Type II)
Agriculture -7'107'214'460 -3'111'736'075 -10'997'328'375 -4'172'180'815 3.8 67'461'718 205'076'487 5.60 38.07
Forestry and logging -841'084'344 -540'547'158 -878'002'564 -1'391'469'224 14.0 2'968'800 990'055 0.61 3.87
Fishing 3'156'188'550 3'635'734'760 1'729'745'916 4'378'717'185 15.5 3'167'200 1'285'097 0.75 3.37
Coal and lignite, crude petroleum and natural gas 3'248'678 0 3'682'228 0 130.4 6'504'200 770'568 0.22 5.44
Iron ore and other minerals -5'256'199'934 -1'526'938'399 -5'593'769'740 -1'492'178'025 259.5 1'467'700 1'517'992 1.90 1.64
Manufacture of food products -12'354'879'747 -3'681'023'455 -16'898'422'990 -6'603'468'370 12.2 20'905'354 4'024'149 0.35 12.20
Beverages and tobacco products -186'787'650 264'748'063 -379'616'743 311'924'661 1.0 6'204'518 3'763'220 1.12 5.14
Cotton textiles -5'188'456'330 -1'083'767'070 -6'415'712'259 -1'193'876'635 15.0 6'908'655 2'506'482 0.67 5.91
Wool synthetic and silk fiber textiles -3'738'908'026 -1'216'355'639 -4'237'960'758 -1'478'479'341 22.4 3'730'466 1'917'877 0.95 3.55
Jute, hemp and mesta textiles -829'157'431 -263'793'942 -668'591'377 -225'762'919 26.2 506'326 180'198 0.66 2.37
Textile products 8'255'057'471 -24'526'228'364 -17'229'663'526 -62'494'987'320 49.8 6'250'338 5'537'224 1.63 4.10
Furniture and wood products -1'457'252'179 -1'503'196'779 -2'292'575'227 -2'878'572'632 8.8 1'620'211 5'365'221 6.10 2.97
Paper, paper products, printing and publishing 246'868'000 -780'865'054 -867'786'935 -905'957'668 52.3 4'677'914 1'270'760 0.50 4.21
Leather products 39'749'055 -1'218'836'030 -4'620'575'659 -1'736'128'896 46.4 1'678'410 1'483'528 1.63 2.93 Rubber and plastic products, petroleum products and coal tar products 23'979'880'462 -21'518'572'927 -4'717'477'751 -26'025'711'301 16.1 24'476'318 788'369 0.06 13.10
Chemicals -5'238'101'925 16'287'909'280 -27'917'534'669 -22'152'447'451 38.5 21'807'480 1'706'108 0.14 12.19
Other non-metallic mineral products and cement -2'736'166'258 -2'867'675'248 -4'947'490'818 -5'722'469'073 74.4 5'908'883 3'805'059 1.19 2.90
Iron, steel and non-ferrous metals -5'476'681'870 -23'941'843'386 -50'919'657'727 -55'734'070'216 30.4 19'154'309 1'631'677 0.16 9.29
Metal products -4'577'719'605 -5'179'097'683 -7'275'196'414 -6'301'984'877 25.0 4'085'337 1'546'798 0.70 3.29
Non-electrical machinery -22'778'614'907 -12'224'943'829 -39'748'655'130 -28'839'158'341 62.1 8'182'869 1'133'599 0.25 3.20
Electrical machinery -8'563'547'733 -7'970'921'069 -21'143'183'341 -17'951'587'441 63.4 8'965'653 1'890'295 0.39 3.43
Rail equipment and other transport equipment 17'556'077'382 -9'537'651'396 6'907'106'188 -16'503'701'622 13.0 10'136'379 3'274'241 0.59 4.29
Misc. manufacturing -35'997'063'072 -57'885'305'091 -47'819'074'846 -72'045'974'627 89.4 8'231'662 3'051'896 0.68 3.60
Construction N/A N/A
N/A N/A N/A 38'408'700 22'325'425 1.07 4.73
Electricity and gas N/A N/A
N/A N/A N/A 13'501'235 898'739 0.12 10.72
Water supply N/A N/A
N/A N/A N/A 960'065 186'421 0.36 2.30
Railway transport services N/A N/A
N/A N/A N/A 4'256'267 948'540 0.41 4.07
Other transport services N/A N/A
N/A N/A N/A 33'581'098 12'850'267 0.70 17.29
Storage and warehousing N/A N/A
N/A N/A N/A 253'934 82'802 0.60 2.13

26
Export demand vectors (in 2003/04 Rupees)
Scenario A Scenario B Trade Openness1
EU US EU US (X+M/Output)
Output (2003/04, in 2003/04 Rupees, lakhs)
Employment (2003/04)
Labour Coefficient (2003/04, rel. to avg.)
Income Multipler (Type II)
Communication N/A N/A N/A N/A N/A 5'815'013 1'616'377 0.51 4.87
Trade N/A N/A N/A N/A N/A 42'830'337 31'361'699 1.35 21.10
Hotels and restaurants N/A N/A N/A N/A N/A 7'931'804 4'930'116 1.14 5.60
Banking N/A N/A N/A N/A N/A 18'265'163 1'975'962 0.20 11.94
Insurance N/A N/A N/A N/A N/A 3'823'881 515'730 0.25 3.78
Education and research N/A N/A N/A N/A N/A 13'981'500 9'826'241 1.29 6.15
Medical and health N/A N/A N/A N/A N/A 10'010'300 3'077'439 0.57 6.16
Other services N/A N/A N/A N/A N/A 15'753'554 13'632'895 1.59 8.71

27
Appendix Table 1: Trade demand vectors and other industry-level data, South Africa
Export demand vectors (in 2000 Rand)
Scenario A Scenario B Trade
Openness1
EU US EU US (X+M/Output)
Output (2000, in
2000 Rand, millions)
Employment (2000)
Labour Coefficient (2000, rel. to avg.)
Income Multipler (Type II)
Agriculture, hunting, forestry and fishing 518'144'898 -84'162'931 545'784'725 -123'368'942 18.9 53'402 2'075'212 5.06 12.79
Coal mining 759'874'328 0 793'207'075 0 46.5 20'176 74'536 0.48 4.11
Gold mining and other mining2 -1'343'342'315 -629'692'683 -2'100'936'846 -648'610'651 140.6 82'403 529'111 0.84 5.49
Food processing -63'463'346 464'620'325 23'878'384 353'050'161 19.8 67'744 220'884 0.42 15.11
Beverages and tobacco products 961'543'345 -56'107'714 1'051'169'810 -176'618'927 14.2 28'326 73'246 0.34 6.66
Textiles -69'344'086 -56'042'085 -31'473'676 -58'316'774 49.1 12'533 90'412 0.94 3.76
Clothing -19'285'359 -57'781'518 36'963'666 -7'847'999 30.8 8'773 227'049 3.37 2.45
Leather products -39'943'285 -40'515'903 -35'780'258 -91'408'874 84.8 2'409 15'163 0.82 2.29
Footwear 930'628 -578'823 3'312'609 -2'978'951 55.8 2'799 33'257 1.55 1.77
Wood products -30'008'308 -10'680'423 15'165'396 -6'274'573 32.1 10'382 91'138 1.14 3.53
Paper products 199'147'194 -12'334'457 250'908'447 -60'801'898 36.2 25'105 31'395 0.16 6.23
Printing and publishing -8'621'880 10'392'688 1'917'658 11'765'682 25.1 13'257 65'224 0.64 3.66
Petroleum products -79'867'783 -124'159'209 -289'157'485 -149'905'930 30.8 36'038 24'058 0.09 6.45
Chemicals 332'677'272 -263'609'734 275'670'237 -278'420'707 60.5 61'300 58'184 0.12 10.56
Rubber and plastic products -117'272'156 7'871'186 -80'038'110 4'360'688 38.0 16'150 59'933 0.48 3.95
Glass products 62'934'187 -16'131'898 55'898'937 -6'642'053 43.5 2'523 16'972 0.88 2.20
Non-metal minerals -116'455'226 -37'235'418 -201'411'947 -42'240'785 26.8 12'479 78'989 0.82 2.73
Iron, steel and non-ferrous metals -8'472'033'975 -6'607'051'391 -7'775'681'467 -7'218'369'260 59.9 57'856 94'792 0.21 6.92
Metal products -256'824'709 -123'702'362 -224'242'072 -143'378'756 26.0 26'758 139'919 0.68 4.22
Non-electrical machinery -5'334'461'255 -322'341'672 -6'064'748'374 -821'263'529 189.8 22'758 58'503 0.33 2.82
Electrical machinery -176'528'853 -43'327'737 -150'685'511 -95'477'292 59.1 14'280 45'232 0.41 2.97
Communications equipment -205'401'785 -77'043'877 -339'225'658 -90'086'281 284.8 5'228 8'717 0.22 1.60
Scientific equipment -20'331'491 -89'995'687 -29'882'937 -145'187'283 422.9 1'725 5'820 0.44 1.28
Vehicles -3'383'187'089 1'349'620'374 -3'902'024'219 1'819'744'598 71.7 57'897 74'844 0.17 6.31
Transport equipment -12'573'199 -93'852'980 115'999'304 -152'698'155 265.5 3'967 4'522 0.15 1.59
Furniture -751'914'668 -96'427'616 -530'218'467 -167'709'536 50.5 6'880 34'387 0.65 2.10
Misc. manufacturing -7'484'875'942 -1'642'839'392 -9'180'884'313 -1'573'945'281 103.9 6'609 38'433 0.76 2.07
Electricity, gas and water N/A N/A
N/A N/A
N/A 41'366 94'013 0.30 8.25
Construction N/A N/A
N/A N/A
N/A 75'856 692'124 1.19
3.83
Trade services, hotels and catering N/A N/A
N/A N/A
N/A 187'309 2'376'767 1.65
32.67
Transport and communication services N/A N/A
N/A N/A
N/A 144'770 585'062 0.53
18.44
Financial and business services N/A N/A
N/A N/A
N/A 247'025 988'649 0.52
31.36

28
Export demand vectors (in 2000 Rand)
Scenario A Scenario B Trade
Openness1
EU US EU US (X+M/Output)
Output (2000, in
2000 Rand, millions)
Employment (2000)
Labour Coefficient (2000, rel. to avg.)
Income Multipler (Type II)
Human health, veterinary and social work N/A N/A
N/A N/A
N/A 31'250 573'466 2.39
5.41
Education, other services and other activities n.e.c. N/A N/A
N/A N/A
N/A 48'613 2'181'860 5.85
7.70
Government services N/A N/A
N/A N/A
N/A 181'030 541'169 0.39
2.50
Note 1: Trade openness is construction from SAMs data on income from exports, expenditures on imports and output in SAMs base year.

29
Appendix Table 2: Industry-Level Employment Effects from Trade for India: Scenario B (Type II multiplier)
Number of jobs (FTE)
No. jobs as % of 2003/4 empl.
% of 2003/4 empl.
EU US EU & US EU & US Female Less Educ.
Tra
dea
ble
go
od
s in
du
stri
es
1 Agriculture -2'650'426 -2'765'788 -5'416'215 -2.64 35.0 95.6
2 Forestry and logging -13'956 -18'311 -32'267 -3.26 37.5 95.8
3 Fishing -4'267 4'347 81 0.01 12.6 97.3
4 Coal and lignite, crude petroleum and natural gas -13'694 -21'456 -35'150 -4.56 5.3 72.0
5 Iron ore and other minerals -34'584 -25'252 -59'836 -3.94 21.3 96.5
6 Manufacture of food products -67'886 -56'661 -124'548 -3.10 23.1 85.7
7 Beverages and tobacco products -36'964 -41'056 -78'020 -2.07 70.6 97.5
8 Cotton textiles -66'322 -96'323 -162'645 -6.49 31.1 90.3
9 Wool synthetic and silk fiber textiles -38'703 -48'820 -87'523 -4.56 27.7 94.2
10 Jute, hemp and mesta textiles -7'053 -11'359 -18'413 -10.22 21.2 92.4
11 Textile products -166'101 -493'198 -659'299 -11.91 33.1 91.2
12 Furniture and wood products -151'526 -190'748 -342'273 -6.38 20.3 95.5
13 Paper, paper products, printing and publishing -14'879 -18'288 -33'168 -2.61 10.7 64.6
14 Leather products -57'082 -31'199 -88'281 -5.95 15.6 86.8
15 Rubber and plastic products, petroleum products and coal tar products -11'039 -19'662 -30'700 -3.89 10.5 70.9
16 Chemicals -40'612 -42'635 -83'247 -4.88 37.3 68.6
17 Other non-metallic mineral products and cement -40'867 -47'915 -88'781 -2.33 24.1 93.9
18 Iron, steel and non-ferrous metals -73'391 -87'001 -160'391 -9.83 2.6 76.4
19 Metal products -45'416 -49'595 -95'011 -6.14 5.2 83.7
20 Non-electrical machinery -41'116 -33'043 -74'159 -6.54 4.2 60.2
21 Electrical machinery -39'845 -37'168 -77'013 -4.07 3.7 67.6
22 Rail equipment and other transport equipment 5'399 -74'717 -69'318 -2.12 1.5 80.6
23 Misc. manufacturing -131'287 -194'455 -325'742 -10.67 15.3 87.2
No
n-t
rad
eab
le in
du
stri
es
24 Construction -24'704 -31'136 -55'840 -0.25 9.9 94.3
25 Electricity and gas -14'879 -19'175 -34'054 -3.79 4.5 58.1
26 Water supply -1'094 -1'474 -2'568 -1.38 4.6 83.4
27 Railway transport services -14'464 -17'863 -32'327 -3.41 3.4 60.9
28 Other transport services -131'595 -167'620 -299'215 -2.33 1.3 88.1
29 Storage and warehousing -939 -1'195 -2'134 -2.58 0.0 75.6
30 Communication -17'679 -21'887 -39'566 -2.45 12.4 52.5
31 Trade -359'582 -457'811 -817'393 -2.61 11.5 78.9
32 Hotels and restaurants -43'037 -53'775 -96'812 -1.96 17.9 90.1
33 Banking -27'840 -35'573 -63'414 -3.21 13.5 29.8
34 Insurance -5'884 -7'462 -13'346 -2.59 14.1 16.2
35 Education and research -56'048 -69'759 -125'807 -1.28 39.2 23.1
36 Medical and health -24'996 -31'111 -56'107 -1.82 36.9 43.6
37 Other services -122'671 -160'961 -283'632 -2.08 31.5 82.1
38 All industries -4'587'030 -5'477'108 -10'064'137 -2.81 27.5 87.9
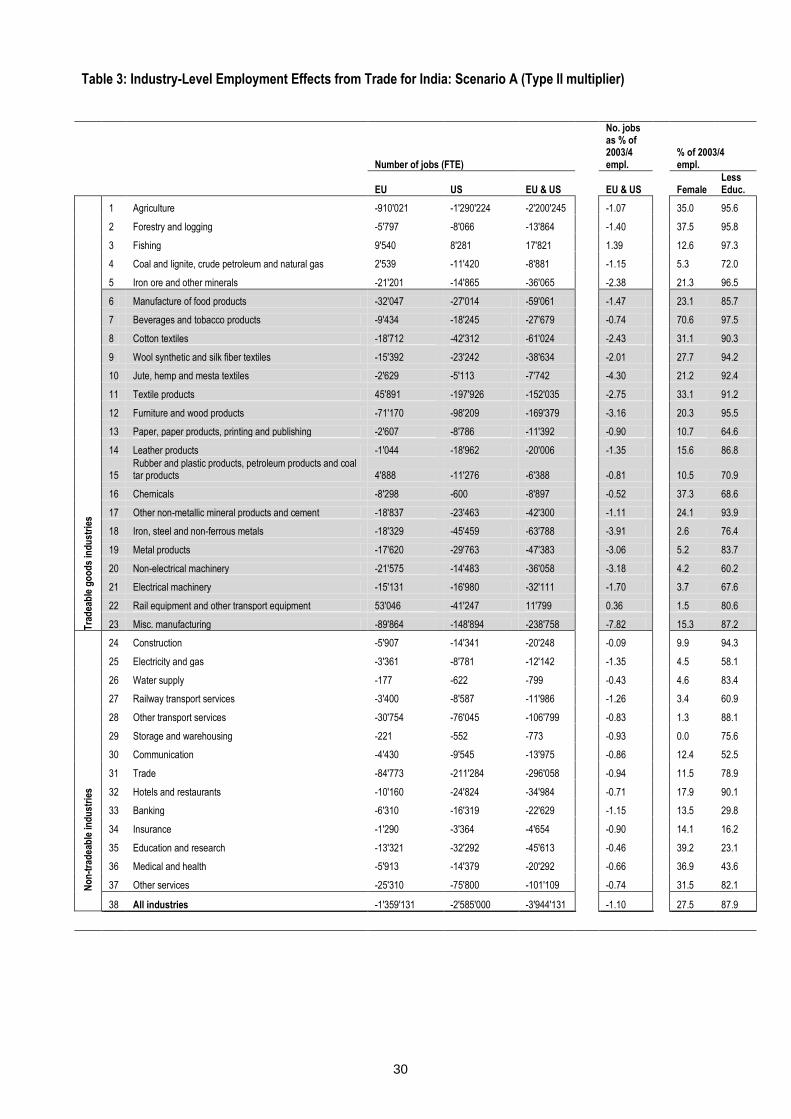
30
Table 3: Industry-Level Employment Effects from Trade for India: Scenario A (Type II multiplier)
Number of jobs (FTE)
No. jobs as % of 2003/4 empl.
% of 2003/4 empl.
EU US EU & US EU & US Female Less Educ.
Tra
dea
ble
go
od
s in
du
stri
es
1 Agriculture -910'021 -1'290'224 -2'200'245 -1.07 35.0 95.6
2 Forestry and logging -5'797 -8'066 -13'864 -1.40 37.5 95.8
3 Fishing 9'540 8'281 17'821 1.39 12.6 97.3
4 Coal and lignite, crude petroleum and natural gas 2'539 -11'420 -8'881 -1.15 5.3 72.0
5 Iron ore and other minerals -21'201 -14'865 -36'065 -2.38 21.3 96.5
6 Manufacture of food products -32'047 -27'014 -59'061 -1.47 23.1 85.7
7 Beverages and tobacco products -9'434 -18'245 -27'679 -0.74 70.6 97.5
8 Cotton textiles -18'712 -42'312 -61'024 -2.43 31.1 90.3
9 Wool synthetic and silk fiber textiles -15'392 -23'242 -38'634 -2.01 27.7 94.2
10 Jute, hemp and mesta textiles -2'629 -5'113 -7'742 -4.30 21.2 92.4
11 Textile products 45'891 -197'926 -152'035 -2.75 33.1 91.2
12 Furniture and wood products -71'170 -98'209 -169'379 -3.16 20.3 95.5
13 Paper, paper products, printing and publishing -2'607 -8'786 -11'392 -0.90 10.7 64.6
14 Leather products -1'044 -18'962 -20'006 -1.35 15.6 86.8
15 Rubber and plastic products, petroleum products and coal tar products 4'888 -11'276 -6'388 -0.81 10.5 70.9
16 Chemicals -8'298 -600 -8'897 -0.52 37.3 68.6
17 Other non-metallic mineral products and cement -18'837 -23'463 -42'300 -1.11 24.1 93.9
18 Iron, steel and non-ferrous metals -18'329 -45'459 -63'788 -3.91 2.6 76.4
19 Metal products -17'620 -29'763 -47'383 -3.06 5.2 83.7
20 Non-electrical machinery -21'575 -14'483 -36'058 -3.18 4.2 60.2
21 Electrical machinery -15'131 -16'980 -32'111 -1.70 3.7 67.6
22 Rail equipment and other transport equipment 53'046 -41'247 11'799 0.36 1.5 80.6
23 Misc. manufacturing -89'864 -148'894 -238'758 -7.82 15.3 87.2
No
n-t
rad
eab
le in
du
stri
es
24 Construction -5'907 -14'341 -20'248 -0.09 9.9 94.3
25 Electricity and gas -3'361 -8'781 -12'142 -1.35 4.5 58.1
26 Water supply -177 -622 -799 -0.43 4.6 83.4
27 Railway transport services -3'400 -8'587 -11'986 -1.26 3.4 60.9
28 Other transport services -30'754 -76'045 -106'799 -0.83 1.3 88.1
29 Storage and warehousing -221 -552 -773 -0.93 0.0 75.6
30 Communication -4'430 -9'545 -13'975 -0.86 12.4 52.5
31 Trade -84'773 -211'284 -296'058 -0.94 11.5 78.9
32 Hotels and restaurants -10'160 -24'824 -34'984 -0.71 17.9 90.1
33 Banking -6'310 -16'319 -22'629 -1.15 13.5 29.8
34 Insurance -1'290 -3'364 -4'654 -0.90 14.1 16.2
35 Education and research -13'321 -32'292 -45'613 -0.46 39.2 23.1
36 Medical and health -5'913 -14'379 -20'292 -0.66 36.9 43.6
37 Other services -25'310 -75'800 -101'109 -0.74 31.5 82.1
38 All industries -1'359'131 -2'585'000 -3'944'131 -1.10 27.5 87.9

31
Figure 1: Total Trade as a Percentage of GDP, 1960 – 2007 (X+M/GDP%)
Figure 2: Net Exports of Goods and Services, 1960 -2007 (X-M, current US$, ‘000)
-40,000,000
-30,000,000
-20,000,000
-10,000,000
0
10,000,000
20,000,000
Figure 2: Net Exports of Goods and Services, 1960-
2007(X-M, current US$, '000)
South Africa
India
Source: WB/WDI, 2009.
Figure 3: Indian exports to the EU and US in 2003

32
Figure 4: South African exports to the EU and US in 2000 Rand
Figure 5: Gender Bias from Trade Contraction, All Industries, Scenario A
Figure 6: Skills Bias from Trade Contraction, All Industries, Scenario A

33
Figure 7: Impact of Trade on incomes by Urban and Rural Household Income Quintiles, India, and Scenario
A (% 2003/04 income)
Figure 8: Impact of Trade on Incomes by Urban and Rural Household Income Quintiles, South Africa, Scenario
A (% 2000 income)

34
Appendix Figure 1: Impact of Trade on Incomes by Urban and Rural Household Income Quintiles, India,
scenario B (% 2003/04 income)
Appendix Figure 2: Impact of Trade on Incomes by Urban and Rural Household income Quintiles, South
Africa, Scenario B(% 2000 income)
35
References
International Labour Office (ILO). 2006. Implementing the Global Employment Agenda:
Employment strategies in support of decent work, “Vision” document (Geneva). Also
available at: http://www.ilo.org/gea [24 April 2008].
—. 2003. Working out of poverty, Report of the Director-General, International Labour
Conference, 91st Session, Geneva, 2003 (Geneva). Also available at:
http://www.oit.org/public/english/standards/relm/ilc/ilc91/pdf/rep-i-a.pdf [24 April
2008].
—. 2001. Reducing the decent work deficit: A global challenge, Report of the Director General,
International Labour Conference, 89th Session, Geneva, 2001 (Geneva). Also available
at: http://www.ilo.org/public/english/standards/relm/ilc/ilc89/rep-i-a.htm [24 April
2008].
—. 1999. Decent work, Report of the Director-General, International Labour Conference, 87th
Session, Geneva, 1999 (Geneva). Also available at:
http://www.ilo.org/public/english/standards/relm/ilc/ilc87/rep-i.htm [24 April 2008].
Assubuji, Paula; Luckscheiter, Jochen. 2009. “The global economic crisis and South Africa
(Dear Reader),” in Perspectives, No. 3, pp. 1-2.
Athukorala, Prema-chandra; Kohpaiboon, Archanun. 2009. “Intra-regional trade in East Asia:
The decoupling fallacy, crisis, and policy challenges”, in ADBI Working Paper No. 177
(Tokyo, Asian Development Bank Institute).
Baldwin, Richard. 2009a. “The great trade collapse: What caused it and what does it mean?”,
in Richard Baldwin (ed.): The great trade collapse: Causes, consequences and prospects
(London, Center for Economic Policy Research).
Baldwin, Richard (ed.). 2009b. The great trade collapse: Causes, consequences and prospects
(London, Center for Economic Policy Research).
Bhaskaran, Manu; Ghosh, Ritwick. 2010. “Impact and policy responses: India”, Report for
ADB Regional Forum on the Impact of the Global Economic and Financial Crisis, 14-15
January (Manila, Asian Development Bank).
Borchert, Ingo; Mattoo, Aaditya. 2009. “Services trade – the collapse that wasn‟t”, in Richard
Baldwin (ed.): The great trade collapse: Causes, consequences and prospects (London,
Center for Economic Policy Research).
Cameron, Bruce. 2010. “Concerns over life products for low earners are justified”, in Saturday
Star, May 15, p. 2.
ECDC. 2005. “An overview of the Eastern Cape automotive industry and its opportunities in
the South African context”, Eastern Cape Development Corporation.
Francois, Joseph; Woerz, Julia. 2009. “Follow the bouncing ball – trade and the great recession
redux”, in Richard Baldwin (ed.): The great trade collapse: Causes, consequences and
prospects (London, Center for Economic Policy Research).

36
Frye, Isobelle. 2009. “Responses and alternatives: South Africa‟s response to the crisis,” in
Perspectives, No. 3, pp. 8-12.
Gabru, Fatima. 2009. “Financial crisis batters SA‟s automotive industry”, in Creamer Media’s
Engineering News Online, 6 February.
Ghosh, Jayati; Chandrasekhar, C. P. 2009. “The costs of „coupling‟: The global crisis and the
Indian economy”, in Cambridge Journal of Economics, Vol. 33, No. 4, pp. 725-739.
Government of India. October-December 2008 to January-March 2010. Report on effect of
economic slowdown on employment in India (Chandigarh, Ministry of Labour and
Employment, Labour Bureau).
Hayter, Susan; Reinecke, Gerhard; Torres, Raymond. 2001. South Africa (Geneva,
International Labour Office).
ILO. 2009. “Review of sector-specific stimulus packages and policy responses to the global
economic crisis”, (Geneva, International Labour Organization, Sectoral Activities
Programme).
ILO. 2010a. Accelerating action against child labour (Geneva, International Labour
Organization).
ILO. 2010b. “India‟s response to the crisis”, G20 Country Briefs (Geneva, International Labour
Organization).
ILO. 2010c. “South Africa‟s response to the crisis”, G20 Country Briefs (Geneva, International
Labour Organization).
IMF. 2010. World economic outlook, April 2010: Rebalancing growth (Washington, DC,
International Monetary Fund).
Jansen, Marion; von Uexkull, Erik. 2010. Trade and employment in the global crisis (Geneva,
International Labour Organization).
Jonsson, Gunnar; Subramanian, Arvind. 2001. “Dynamic gains from trade: Evidence from
South Africa,” in IMF Staff Papers, Vol. 48, No. 1, pp. 197-224 (Washington, DC,
International Monetary Fund).
Khanna, Gaurav; Newhouse, David; Paci, Pierella. 2010. “Fewer jobs or smaller paycheck?
Labor market impacts of the recent crisis in middle-income countries”, in Poverty
Reduction and Economic Management Network (PREM) Paper No. 11 (Washington,
DC, World Bank).
Khatiwada, Sameer. 2009. “Stimulus packages to counter global economic crisis: A review”,
International Institute for Labour Studies Discussion Paper No. 196 (Geneva,
International Institute for Labour Studies).
Kim, Soyoung; Lee, Jong-Wha; Park, Cyn-Young. 2009. “Emerging Asia: Decoupling or
recoupling”, in ADB Working Paper Series on Regional Economic Integration, No. 31
(Manila, Asian Development Bank).

37
Kose, M. Ayhan; Otrok, Christopher; Prasad, Eswar. 2008. “Global business cycles:
Convergence or decoupling”, in NBER Working Paper Series No. 14292 (Cambridge,
MA, National Bureau of Economic Research).
Krueger, Anne. 2008. “The role of international economic policy in Indian economic
performance”, in Asian Economic Policy Review, Vol. 3, No. 2, pp. 266-285.
Kucera, David. 2001. Gender, growth and trade: The miracle economies of the postwar years
(London and New York, Routledge).
Kucera, David; Milberg, William. 2003. “Deindustrialization and changes in manufacturing
trade: Factor content calculations for 1978-1995”, in Review of World Economics, Vol.
139, No. 3, pp. 601-624.
Kucera, David; Roncolato, Leanne. Forthcoming. “Trade liberalization, employment and
inequality in India and South Africa”, in International Labour Review.
Kumar, Rajiv. 2009. “Global financial and economic crisis: Impact on India and policy
response”, in Global financial crisis: Impact on India’s poor (New Delhi, UNDP India).
Kumar, Rajiv; Alex, Dony. 2009. “The great recession and India‟s trade collapse”, in Richard
Baldwin (ed.): The great trade collapse: Causes, consequences and prospects (London,
Center for Economic Policy Research).
Kumar, Rajiv; Vashisht, Pankaj. 2009. “The global economic crisis: Impact on India and policy
responses”, in ADBI Working Paper No. 164 (Tokyo, Asian Development Bank
Institute).
Kumar, Utsav; Mishra, Prachi. 2005. “Trade liberalization and wage inequality: Evidence from
India”, IMF Working Paper No. 05/20 (Washington, DC, International Monetary Fund).
Kuruvilla, Benny. 2008. “Impacts of the global financial crisis on India”, in Voices from the
South: The impact of the financial crisis on developing countries (Sussex, Institute for
Development Studies, with contributions “compiled and analysed by the Globalisation
Team at the Institute for Development Studies”).
Leung, Ron; Stampini, Marco; Vencatachellum, Désiré. 2009. “Does human capital protect
workers against exogenous shocks? South Africa in the 2008-2009 crisis”, in IZA
Discussion Paper No. 4608 (Bonn, The Institute for the Study of Labor).
Levchenko, Andrei; Lewis, Logan; Tesar, Linda. 2009. “The collapse of US trade: In search of
the smoking gun”, in Richard Baldwin (ed.): The great trade collapse: Causes,
consequences and prospects (London, Center for Economic Policy Research).
Marais, Hein. 2009. “The impact of the global recession on South Africa”, ARI (Real Instituto
Elcano) Paper No. 114.
Menon, Nidhiya and Rodgers, Yana. 2009. “International trade and the gender wage gap: New
evidence from India‟s manufacturing sector”, in World Development, Vol. 37, No. 5, pp.
965-981.
Nachane, Dilip. 2009. “The fate of India unincorporated”, in Economic and Political Weekly,
Vol. XLIV, No. 13, pp. 115-121.

38
NEDLAC, 2009a. Framework for South Africa’s response to the international economic crisis
(South Africa National Economic Development and Labour Council).
NEDLAC, 2009b. Progress report to the President of the Republic of South Africa on the
implementation of the framework for South Africa’s response to the international
economic crisis (South Africa National Economic Development and Labour Council).
NSSO. 2006. National sample survey: Employment-unemployment NSS 61st Round, July 2004-
June 2005 (New Delhi, Government of India National Sample Survey Organisation).
Pula, Gabor; Peltonen, Tuomas. 2009. “Has emerging Asia Decoupled? An analysis of
production and trade linkages using the Asian international input-output table”, in
European Central Bank Working Paper No. 993 (Frankfurt am Main, European Central
Bank).
Qualmann, Regine. 2008. South Africa’s reintegration into world and regional markets: Trade
liberalization and emerging patterns of specialization in the post-apartheid era (Baden-
Baden, Nomos).
Rakshit, Mihir. 2009. “India amidst the global crisis”, in Economic and Political Weekly, Vol.
44, No. 13, pp. 94-106.
Rodrik, Dani. 2008. “Understanding South Africa‟s economic puzzles”, in Economics of
Transition, Vol. 16, No. 4, pp. 769-797.
Rodrik, Dani; Subramanian, Arvind. 2005. “From „Hindu Growth‟ to productivity surge: The
mystery of the Indian growth transition”, in IMF Staff Papers, Vol. 52, No. 2, pp. 193-
228.
Rubery, Jill (ed.). 1988. Women and recession (London and New York, Routledge & Kegan
Paul).
Sachs, Jeffrey; Shatz, Howard. 1994 “Trade and jobs in US manufacturing,” in Brookings
Papers in Economic Activity, Vol. 1, pp. 1-84.
SA. 2010a. Industrial policy action plan (Government of South Africa).
SA. 2010b. Department of rural development & land reform strategic plan, 2010-2013
(Government of South Africa).
SAPA. 2010. “Rand far too strong, and interest rates too high, says Vavi”, in The Sunday
Independent, May 11.
SARW. 2009. “Impact of the global financial crisis on mining in Southern Africa”, Southern
Africa Resource Watch.
Stats SA. Quarter 1, 2009 to Quarter 1, 2010. Quarterly labour force survey (Statistics South
Africa).
Sakthivel, S.; Joddar, P. 2006. “Unorganized sector workforce in India: Trends, patterns and
social security coverage”, in Economic and Political Weekly, Vol. 41, No. 21, pp. 2107-
2114.

39
SEG/ILO. 2010. Impact of the global economic crisis on selected SADC countries (SADC
Employers Group/International Labour Organization).
Subbarao, Duvvuri. 2009. “Impact of the global financial crisis on India: Collateral damage
and response”, speech delivered at the Symposium on "The Global Economic Crisis and
Challenges for the Asian Economy in a Changing World" organized by the Institute for
International Monetary Affairs, Tokyo (February 18).
Toplova, Petia. 2005. “Trade liberalization, poverty and inequality: Evidence from Indian
districts”, in NBER Working Paper Series No. 11614 (Cambridge, MA, National Bureau
of Economic Research).
UN Comtrade. 2007. United Nations commodity trade statistics database (New York, United
Nations). [Downloaded through World Integrated Trade Solution (WITS), client version
(6.0.209)]
UNCTAD. 2009. “Impact of global slowdown on India‟s exports and employment” (Draft for
comments), (New Delhi, UNCTAD India Team).
UNCTAD/WTO. 2007. World tariff profiles 2006 (Geneva, WTO Secretariat).
Van Staveren, Irene; Elson, Diane; Grown, Caren; Cagatay, Nilufer (eds.). 2007. The feminist
economics of trade (London, Routledge).
Verick, Sher. 2010. “Unravelling the impact of the global financial crisis on the South African
labour market”, in ILO Employment Sector Working Paper No. 48 (Geneva,
International Labour Organization).
Wälti, Sébastien. 2009. “The myth of decoupling”, in MPRA Working Paper No. 20870
(Munich, Munich Personal RePEc Archive).
Wood, Adrian. 1994. North-South trade, employment and inequality: Changing fortunes in a
skill-driven world (Oxford, Clarendon Press).
Wood, Adrian. 1995. “How trade hurt unskilled workers”, in Journal of Economic
Perspectives, Vol. 9, No. 3, pp. 57-80.
World Bank. 2010. Global economic prospects 2010: Crisis, finance, and growth
(Washington, DC, World Bank).
WTO. 2008. World trade report 2008: Trade in a globalizing world (Geneva, World Trade
Organization).
WTO. 2010. “Trade to expand by 9.5 percent in 2010 after a dismal 2009, WTO reports”,
WTO press release, PRESS/598 (Geneva, World Trade Organization).


41
Employment Working Papers
2008
1 Challenging the myths about learning and training in small and medium-sized enterprises:
Implications for public policy;
ISBN 92-2-120555-5 (print); 92-2-120556-2 (web pdf)
David Ashton, Johnny Sung, Arwen Raddon and Trevor Riordan
2 Integrating mass media in small enterprise development. Current knowledge and good
practices;
ISBN 92-2-121142-6 (print); 92-2-121143-3 (web pdf)
Gavin Anderson. Edited by Karl-Oskar Olming and Nicolas MacFarquhar
3 Recognizing ability: The skills and productivity of persons with disabilities.
A literature review;
ISBN 978-92-2-121271-3 (print); 978-92-2-121272-0 (web pdf)
Tony Powers
4 Offshoring and employment in the developing world: The case of Costa Rica;
ISBN 978-92-2-121259-1 (print); 978-92-2-121260-7 (web pdf)
Christoph Ernst and Diego Sanchez-Ancochea
5 Skills and productivity in the informal economy;
ISBN 978-92-2-121273-7 (print); 978-92-2-121274-4 (web pdf)
Robert Palmer
6 Challenges and approaches to connect skills development to productivity and employment
growth: India;
unpublished
C. S. Venkata Ratnam and Arvind Chaturvedi
7 Improving skills and productivity of disadvantaged youth;
ISBN 978-92-2-121277-5 (print); 978-92-2-121278-2 (web pdf)
David H. Freedman
8 Skills development for industrial clusters: A preliminary review;
ISBN 978-92-2-121279-9 (print); 978-92-2-121280-5 (web pdf)
Marco Marchese and Akiko Sakamoto
9 The impact of globalization and macroeconomic change on employment in Mauritius:
What next in the post-MFA era?;
ISBN 978-92-2-120235-6 (print); 978-92-2-120236-3 (web pdf)
Naoko Otobe

42
10 School-to-work transition: Evidence from Nepal;
ISBN 978-92-2-121354-3 (print); 978-92-2-121355-0 (web pdf)
New Era
11 A perspective from the MNE Declaration to the present: Mistakes, surprises and newly
important policy implications;
ISBN 978-92-2-120606-4 (print); 978-92-2-120607-1 (web pdf)
Theodore H. Moran
12 Gobiernos locales, turismo comunitario y sus redes
Memoria: V Encuentro consultivo regional (REDTURS);
ISBN 978-92-2-321430-2 (print); 978-92-2-321431-9 (web pdf)
13 Assessing vulnerable employment: The role of status and sector indicators in Pakistan,
Namibia and Brazil;
ISBN 978-92-2-121283-6 (print); 978-92-2-121284-3 (web pdf)
Theo Sparreboom and Michael P.F. de Gier
14 School-to-work transitions in Mongolia;
ISBN 978-92-2-121524-0 (print); 978-92-2-121525-7 (web pdf)
Francesco Pastore
15 Are there optimal global configurations of labour market flexibility and security?
Tackling the “flexicurity” oxymoron;
ISBN 978-92-2-121536-3 (print); 978-92-2-121537-0 (web pdf)
Miriam Abu Sharkh
16 The impact of macroeconomic change on employment in the retail sector in India:
Policy implications for growth, sectoral change and employment;
ISBN 978-92-2-120736-8 (print); 978-92-2-120727-6 (web pdf)
Jayati Ghosh, Amitayu Sengupta and Anamitra Roychoudhury
17 From corporate-centred security to flexicurity in Japan;
ISBN 978-92-2-121776-3 (print); 978-92-2-121777-0 (web pdf)
Kazutoshi Chatani
18 A view on international labour standards, labour law and MSEs;
ISBN 978-92-2-121753-4 (print);978-92-2-121754-1(web pdf)
Julio Faundez
19 Economic growth, employment and poverty in the Middle East and North Africa;
ISBN 978-92-2-121782-4 (print); 978-92-2-121783-1 (web pdf)
Mahmood Messkoub

43
20 Employment and social issues in fresh fruit and vegetables;
ISBN 978-92-2-1219415(print); 978-92-2-1219422 (web pdf)
Sarah Best, Ivanka Mamic
21 Trade agreements and employment: Chile 1996-2003;
ISBN 978-2-1211962-0 (print); 978-2-121963-7 (web pdf)
22 The employment effects of North-South trade and technological change;
ISBN 978-92-2-121964-4 (print); 978-92-2-121965-1 (web pdf)
Nomaan Majid
23 Voluntary social initiatives in fresh fruit and vegetables value chains;
ISBN 978-92-2-122007-7 (print); 978-92-2-122008-4 (web pdf)
Sarah Best and Ivanka Mamic
24 Crecimiento Económico y Empleo de Jóvenes en Chile. Análisis sectorial y proyecciones;
ISBN 978-92-2-321599-6 (print); 978-92-2-321600-9 (web pdf)
Mario D. Velásquez Pinto
25 The impact of codes and standards on investment flows to developing countries;
ISBN 978-92-2-122114-2 (print); 978-92.2.122115-9 (web pdf)
Dirk Willem te Velde
26 The promotion of respect for workers‟ rights in the banking sector:
Current practice and future prospects;
ISBN 978-92-2-122116-6 (print); 978-2-122117-3 (web pdf)
Emily Sims
2009
27 Labour Market information and analysis for skills development;
ISBN 978-92-2-122151-7 (print); 978-92-2-122152-4 (web pdf)
Theo Sparreboom and Marcus Powell
28 Global reach - Local relationships : Corporate social responsibility, worker‟s rights and
local development;
ISBN 978-92-2-122222-4 (print); 978-92-2-122212-5 (web pdf)
Anne Posthuma, Emily Sims

44
29 The use of ILS in equity markets: Investing in the work force social investors and
international labour standards;
ISBN 978-92-2-122288-0 (print); 978-92-2-122289-7 (web pdf)
Elizabeth Umlas
30 Rising food prices and their implications for employment, decent work and
poverty reduction;
ISBN 978-92-2-122331-3 (print); 978-92-2-122332-0 (web pdf)
Rizwanul Islam and Graeme Buckley
31 Economic implications of labour and labour-related laws on MSEs: A quick review of the
Latin American experience;
ISBN 978-92-2-122368-9 (print); 978-92-2-122369-6 (web pdf)
Juan Chacaltana
32 Understanding informal apprenticeship – Findings from empirical research in Tanzania;
ISBN 978-2-122351-1 (print); 978-92-2-122352-8 (web pdf)
Irmgard Nübler, Christine Hofmann, Clemens Greiner
33 Partnerships for youth employment. A review of selected community-based initiatives;
ISBN 978-92-2-122468-6 (print); 978-92-2-122469-3 (web pdf)
Peter Kenyon
34 The effects of fiscal stimulus packages on employment;
ISBN 978-92-2-122489-1 (print); 978-92-2-122490-7 (web pdf)
Veena Jha
35 Labour market policies in times of crisis;
ISBN 978-92-2-122510-2 (print); 978-92-2-122511-9 (web pdf)
Sandrine Cazes, Sher Verick
36 The global economic crisis and developing countries: Transmission channels, fiscal and
policy space and the design of national responses;
ISBN 978-92-2-122544-7 (print); 978-92-2-122545-4 (web pdf)
Iyanatul Islam
37 Rethinking monetary and financial policy:
Practical suggestions for monitoring financial stability while generating employment and
poverty reduction
ISBN 978-92-2-122514-0 (print); 978-92-2-122515-7 (web pdf)
Gerald Epstein

45
38 Promoting employment-intensive growth in Bangladesh: Policy analysis of the
manufacturing and service sectors;
ISBN 978-92-2-122540-9 (print); 978-92-2-122541-6 (web pdf)
Nazneen Ahmed, Mohammad Yunus, Harunur Rashid Bhuyan
39 The well-being of labour in contemporary Indian economy;
ISBN 978-92-2-122622-2 (print); 978-92-2-122623-9 (web pdf)
Praveen Jha
40 The global recession and developing countries;
ISBN 978-92-2-122847-9 (print); 978-92-2-122848-6 (web pdf)
Nomaan Majid
41 Offshoring and employment in the developing world: Business process outsourcing in the
Philippines;
ISBN 978-92-2-122845-5 (print); 978-92-2-122846-2 (web pdf)
Miriam Bird, Christoph Ernst
42 A survey of the Great Depression, as recorded in the International Labour Review, 1931-
1939;
ISBN 978-92-2-122843-1 (print); 978-92-2-122844-8 (web pdf)
Rod Mamudi
43 The price of exclusion:
The economic consequences of excluding people with disabilities from the world or work
ISBN 978-92-2-122921-6 (print); 978-92-2-122922-3 (web pdf)
Sebastian Buckup
44 Researching NQFs:
Some conceptual issues
ISBN 978-92-2-123066-3 (print), 978-92-2-123067-0 (web pdf)
Stephanie Allais, David Raffe, Michael Young
45 Learning from the first qualifications frameworks
ISBN 978-92-2-123068-7 (print), 978-92-2-123069-4 (web pdf)
Stepahnie Allais, David Raffe, Rob Strathdee, leesa Wheelahan, Michael Young
46 International framework agreements and global social dialogue: Lessons from the Daimler
case
ISBN 978-92-2-122353-5 (print); 978-92-2-122354-2 (web pdf)
Dimitris Stevis

46
2010
47 International framework agreements and global social dialogue: Parameters and prospects
ISBN 978-92-2-123298-8 (print); 978-92-2-122299-5 (web pdf)
Dimitris Stevis
48 Unravelling the impact of the global financial crisis on the South African labour market
ISBN 978-92-2-123296-4 (print; 978-92-2-123297-1 (web pdf)
Sher Verick
49 Guiding structural change
The role of government in development
ISBN 978-92-2-123340-4 (print); 978-92-2-123341-1 (web pdf)
Matthew Carson
50 Les politiques du marché du travail et de l'emploi au Burkina Faso
ISBN 978-92-2-223394-6 (print); 978-92-2-223395-3 (web pdf)
Lassané Ouedraogo et Adama Zerbo
51 Characterizing the school-to-work transitions of young men and women
Evidence from the ILO school-to-work transition surveys
ISBN 978-92-2-123396-1 (print); 978-92-2-123397-8 (web pdf)
Makiko Matsumoto and Sara Elder
52 Exploring the linkages between investment and employment in Moldova - A time-series
analysis
ISBN 978-92-2-122990-2 (print); 978-92-2-122991-9 (web pdf)
Stefania Villa
53 The crisis of orthodox macroeconomic policy
The case for a renewed commitment to full employment
ISBN 978-92-2-123512 (print); 978-92-2-123513 (web pdf)
Mohammed Muqtada
54 Trade contraction in the post-2007 crisis
Employment and inequality effects in India and South Africa
Forthcoming
Marion Jansen, Leanne Roncolato and Erik von Uexkull
47
55 The impact of crisis-related changes in trade flows on employment:
Incomes, regional and sectoral development in Brazil
Forthcoming
Scott McDonald, Marion Jansen and Erik von Uexkull
56 Envejecimiento y Empleo en América Latina y el Caribe
ISBN 978-92-2-323631-1 (print); 978-92-2-323632-8 (web pdf)
Jorge A. Paz
57 Demographic ageing and employment in China
ISBN 978-92-2-123580-4 (print); 978-92-2-123581-1 (web pdf)
Du Yang and Wrang Meiyan
58 Employment, poverty and economic development
in Madagascar
A microeconomic paper
ISBN 978-92-2-1233985 (print); 978-92-2-1233992 (web pdf)
Gerald Epstein, James Heintz, Léonce Ndikumana and Grace Change
59 The Korean labour market
Some historical macroeconomic perspectives
ISBN 978-92-2-123675-7 (print); 978-92-2-123676-4 (web pdf)
Anne Zooyob
60 Les accords de partenariat économique et le travail décent
Quels enjeux pour l‟Afrique de l‟ouest et l‟Afrique central ?
ISBN 978-92-2-223727-2 (print); 978-92-2-223728-9 (web pdf)
Eléonore d’Achon, Nicolas Gérand
61 The great recession of 2008-2009
Causes, consequences and policy responses
ISBN 978-92-2-123729-7 (print); 978-92-2-123730-3 (web pdf)
Iyanatul Islam and Sher Verick
62 Rwanda forging ahead
The challenge of getting everybody on board
ISBN 978-92-2-123771-6 (print); 978-92-2-123772-3(web pdf)
Per Ronna, Elina Scheja,Karl Backeus

48
63 Growth, economic policies and employment linkages in Mediterranean countries
The cases of Egypt, Israel, Morocco and Turkey
ISBN 978-92-2-123779-2 (print); 798-92-2-123780-8 (web pdf)
Gouda Abdel-Khalek
64 Labour market policies and institutions with a focus on inclusion, equal opportunities and
the informal economy
ISBN 978-92-2-123787-7 (print); 978-92-2-123788-4 (web pdf)
Mariangles Fortuny and Jalal Al Husseini
A complete list of previous working papers can be found on:
http://www.ilo.org/employment

49
Employment Sector
For more information visit our site: http://www.ilo.org/employment
International Labour Office Employment Sector 4, route des Morillons CH-1211 Geneva 22 Email: [email protected]


