EMORY UNIVERSITY FINANCIALS 2018 1
EMORY UNIVERSITY FINANCIALS 2018
CONSOLIDATED FINANCIAL STATEMENTSAND SUPPLEMENTARY INFORMATION
AUGUST 31, 2018 AND 2017(WITH INDEPENDENT AUDITORS’ REPORT THEREON)
EMORY UNIVERSIT Y
FINANCIALS
2018

2 EMORY UNIVERSITY FINANCIALS 2018
INDEPENDENT AUDITORS’ REPORT

EMORY UNIVERSITY FINANCIALS 2018 3
INDEPENDENT AUDITORS’ REPORT
4 EMORY UNIVERSITY FINANCIALS 2018
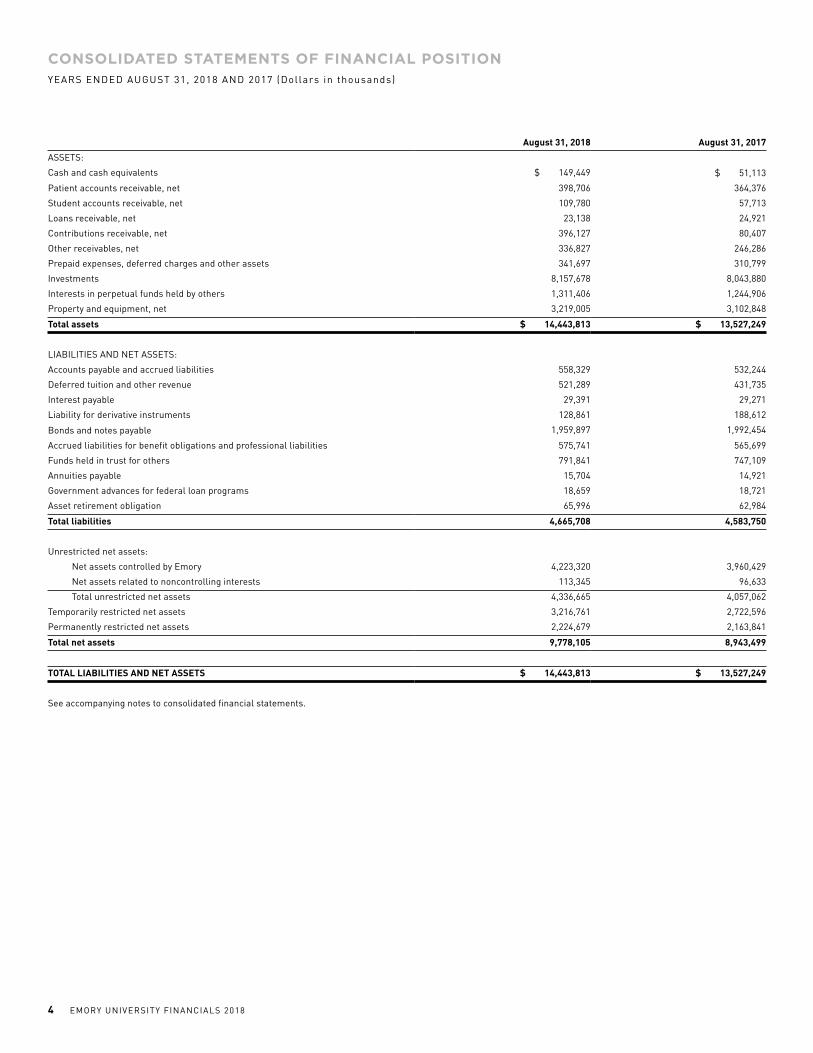
CONSOLIDATED STATEMENTS OF FINANCIAL POSITIONYEARS ENDED AUGUST 31, 2018 AND 2017 (Dollars in thousands)
August 31, 2018 August 31, 2017
ASSETS:
Cash and cash equivalents $ 149,449 $ 51,113
Patient accounts receivable, net 398,706 364,376
Student accounts receivable, net 109,780 57,713
Loans receivable, net 23,138 24,921
Contributions receivable, net 396,127 80,407
Other receivables, net 336,827 246,286
Prepaid expenses, deferred charges and other assets 341,697 310,799
Investments 8,157,678 8,043,880
Interests in perpetual funds held by others 1,311,406 1,244,906
Property and equipment, net 3,219,005 3,102,848
Total assets $ 14,443,813 $ 13,527,249
LIABILITIES AND NET ASSETS:
Accounts payable and accrued liabilities 558,329 532,244
Deferred tuition and other revenue 521,289 431,735
Interest payable 29,391 29,271
Liability for derivative instruments 128,861 188,612
Bonds and notes payable 1,959,897 1,992,454
Accrued liabilities for benefit obligations and professional liabilities 575,741 565,699
Funds held in trust for others 791,841 747,109
Annuities payable 15,704 14,921
Government advances for federal loan programs 18,659 18,721
Asset retirement obligation 65,996 62,984
Total liabilities 4,665,708 4,583,750
Unrestricted net assets:
Net assets controlled by Emory 4,223,320 3,960,429
Net assets related to noncontrolling interests 113,345 96,633
Total unrestricted net assets 4,336,665 4,057,062
Temporarily restricted net assets 3,216,761 2,722,596
Permanently restricted net assets 2,224,679 2,163,841
Total net assets 9,778,105 8,943,499
TOTAL LIABILITIES AND NET ASSETS $ 14,443,813 $ 13,527,249
See accompanying notes to consolidated financial statements.

EMORY UNIVERSITY FINANCIALS 2018 5
CONSOLIDATED STATEMENTS OF ACTIVITIESYEARS ENDED AUGUST 31, 2018 AND 2017 (Dollars in thousands)
UnrestrictedTemporarily
RestrictedPermanently
Restricted Total August 31, 2018 Total August 31, 2017
OPERATING REVENUES AND OTHER SUPPORT:
Tuition and fees $ 710,471 — — $ 710,471 $ 675,179
Less: scholarship allowances (276,305) — — (276,305) (253,897)
Net tuition and fees 434,166 — — 434,166 421,282
Endowment spending distribution 182,562 — — 182,562 179,696
Distribution from perpetual funds 35,377 — — 35,377 34,873
Other investment income designated for current operations 81,257 —
— 81,257 72,622
Gifts and contributions, net 43,656 12,404 — 56,060 44,550
Grants and contracts 470,924 — — 470,924 470,375
Indirect cost recoveries 144,026 — — 144,026 131,012
Net patient service revenue 3,404,004 — — 3,404,004 3,174,419
Medical services 336,141 — — 336,141 301,404
Sales and services of auxiliary enterprises 74,481 — — 74,481 74,464
Independent operations 24,348 — — 24,348 23,097
Other revenue 176,853 — — 176,853 163,133
Net assets released from restrictions 36,856 (13,149) — 23,707 29,384
Total operating revenues and other support 5,444,651 (745) — 5,443,906 5,120,311
OPERATING EXPENSES:
Salaries 2,703,393 — — 2,703,393 2,495,653
Fringe benefits 608,246 — — 608,246 559,474
Student financial aid 19,133 — — 19,133 13,159
Professional fees and purchased services 526,859 — — 526,859 503,309
Supplies and pharmaceuticals 827,657 — — 827,657 757,407
Other operating expenses 353,349 — — 353,349 341,749
Interest on indebtedness 77,103 — — 77,103 81,476
Depreciation 260,674 — — 260,674 247,302
Total operating expenses 5,376,414 — — 5,376,414 4,999,529
NET OPERATING ACTIVITIES: 68,237 (745) — 67,492 120,782
NONOPERATING ACTIVITIES, NET:
Investment return in excess of spending distribution for current operations 127,810
124,188
(3,316)
248,682 360,113
Change in undistributed income from perpetual funds held by others — —
26,880
26,880 74,558
Gifts and contributions 2,035 381,473 37,431 420,939 72,764
Loss on disposal of property and equipment (1,593) — — (1,593) (11,494)
Loss on defeasance of debt — — — — (8,659)
Change in fair value of derivative instruments 59,751 — — 59,751 80,123
Pension and postretirement benefit plans 28,461 — — 28,461 23,017
Other nonoperating items, net (3,100) 10,958 (157) 7,701 (4,885)
Net assets released from restrictions (1,998) (21,709) — (23,707) (29,384)
Total nonoperating activities, net 211,366 494,910 60,838 767,114 556,153
CHANGE IN NET ASSETS 279,603 494,165 60,838 834,606 676,935
Less change in net assets related to noncontrolling interests
16,712
—
—
16,712
15,360
CHANGE IN NET ASSETS CONTROLLED BY EMORY $ 262,891
$ 494,165 $ 60,838 $ 817,894 $ 661,575
See accompanying notes to consolidated financial statements.
6 EMORY UNIVERSITY FINANCIALS 2018
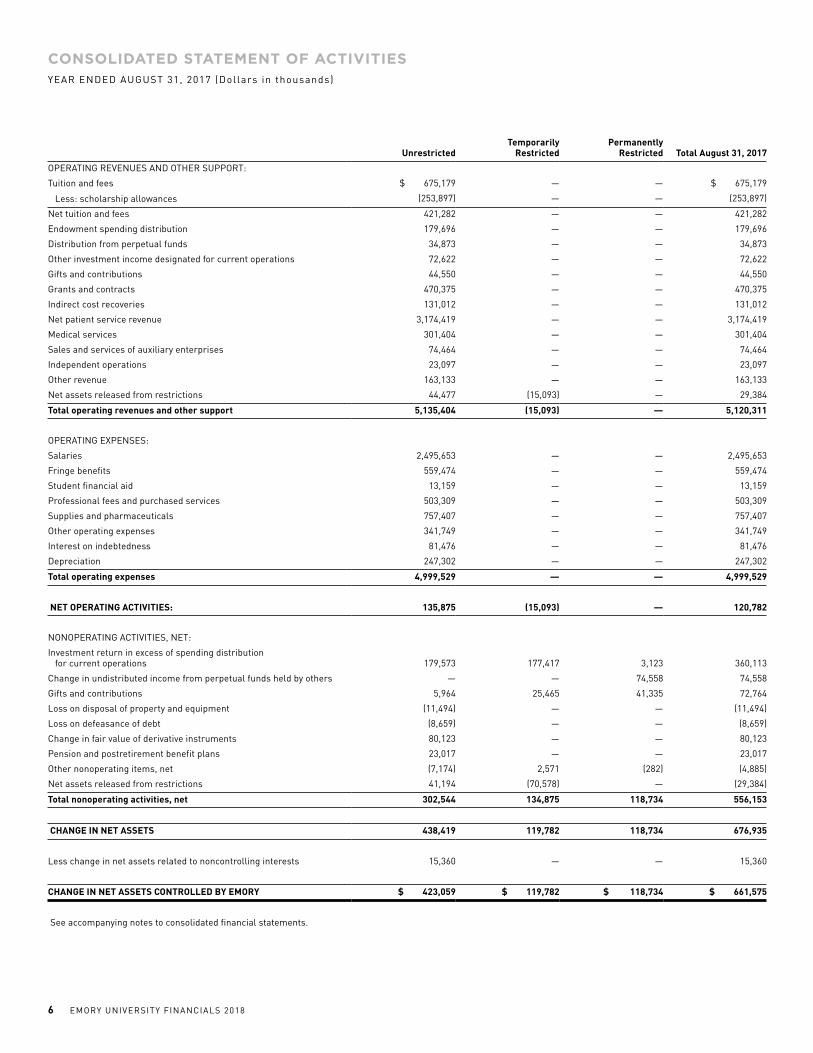
CONSOLIDATED STATEMENT OF ACTIVITIESYEAR ENDED AUGUST 31, 2017 (Dollars in thousands)
UnrestrictedTemporarily
Restricted Permanently
Restricted Total August 31, 2017
OPERATING REVENUES AND OTHER SUPPORT:
Tuition and fees $ 675,179 — — $ 675,179
Less: scholarship allowances (253,897) — — (253,897)
Net tuition and fees 421,282 — — 421,282
Endowment spending distribution 179,696 — — 179,696
Distribution from perpetual funds 34,873 — — 34,873
Other investment income designated for current operations 72,622 — — 72,622
Gifts and contributions 44,550 — — 44,550
Grants and contracts 470,375 — — 470,375
Indirect cost recoveries 131,012 — — 131,012
Net patient service revenue 3,174,419 — — 3,174,419
Medical services 301,404 — — 301,404
Sales and services of auxiliary enterprises 74,464 — — 74,464
Independent operations 23,097 — — 23,097
Other revenue 163,133 — — 163,133
Net assets released from restrictions 44,477 (15,093) — 29,384
Total operating revenues and other support 5,135,404 (15,093) — 5,120,311
OPERATING EXPENSES:
Salaries 2,495,653 — — 2,495,653
Fringe benefits 559,474 — — 559,474
Student financial aid 13,159 — — 13,159
Professional fees and purchased services 503,309 — — 503,309
Supplies and pharmaceuticals 757,407 — — 757,407
Other operating expenses 341,749 — — 341,749
Interest on indebtedness 81,476 — — 81,476
Depreciation 247,302 — — 247,302
Total operating expenses 4,999,529 — — 4,999,529
NET OPERATING ACTIVITIES: 135,875 (15,093) — 120,782
NONOPERATING ACTIVITIES, NET:
Investment return in excess of spending distribution for current operations 179,573
177,417 3,123
360,113
Change in undistributed income from perpetual funds held by others — — 74,558 74,558
Gifts and contributions 5,964 25,465 41,335 72,764
Loss on disposal of property and equipment (11,494) — — (11,494)
Loss on defeasance of debt (8,659) — — (8,659)
Change in fair value of derivative instruments 80,123 — — 80,123
Pension and postretirement benefit plans 23,017 — — 23,017
Other nonoperating items, net (7,174) 2,571 (282) (4,885)
Net assets released from restrictions 41,194 (70,578) — (29,384)
Total nonoperating activities, net 302,544 134,875 118,734 556,153
CHANGE IN NET ASSETS 438,419 119,782 118,734 676,935
Less change in net assets related to noncontrolling interests 15,360 — — 15,360
CHANGE IN NET ASSETS CONTROLLED BY EMORY $ 423,059 $ 119,782 $ 118,734 $ 661,575
See accompanying notes to consolidated financial statements.

EMORY UNIVERSITY FINANCIALS 2018 7
CONSOLIDATED STATEMENTS OF CASH FLOWSYEARS ENDED AUGUST 31, 2018 AND 2017 (Dollars in thousands)
2018 2017
CASH FLOWS FROM OPERATING ACTIVITIES:
Change in net assets $ 834,606 $ 676,935
Adjustments to reconcile change in net assets to net cash provided by operating activities:
Capital contributions from noncontrolling interests — 802
Contributions for endowment and capital projects (420,939) (17,000)
Net realized gains on sale of investments (197,789) (351,422)
Net unrealized gains on investments (275,657) (228,118)
Loss on disposal of property and equipment 1,633 11,494
Interests in perpetual funds held by others (26,880) (74,558)
Loss on defeasance of debt — 8,659
Depreciation and amortization 260,674 247,302
Provision for uncollectible accounts 247,732 244,836
Accretion/amortization of bond discounts/premiums and issuance costs (3,057) (2,627)
Actuarial adjustments for retiree pension and benefit plans (28,461) (23,017)
Change in fair value of derivative instruments (59,751) (80,123)
Decrease (increase) in operating assets:
Accounts and other receivables, net (424,670) (249,415)
Contributions receivable for operations 21,167 20,334
Prepaid expenses, deferred charges, and other assets (38,668) (29,243)
Increase (decrease) in operating liabilities:
Accounts payable, accrued liabilities, and interest payable 26,205 50,026
Asset retirement obligation 3,012 3,064
Accrued liabilities for benefit obligations and professional liabilities 38,503 (6,750)
Deferred tuition and other revenue 89,554 (37,078)
Net cash provided by operating activities 47,214 164,101
CASH FLOWS FROM INVESTING ACTIVITIES:
Disbursements for loans to students (2,713) (2,933)
Repayment of loans from students 4,496 4,684
Proceeds from sales and maturities of investments 7,653,840 8,437,212
Purchases of investments (7,294,192) (8,984,313)
Purchases of property, plant, and equipment (378,464) (347,145)
Increase in funds held in trust for others 44,732 81,894
Net cash provided by (used in) investing activities $ 27,699 $ (810,601)
(Continued)

8 EMORY UNIVERSITY FINANCIALS 2018
CONSOLIDATED STATEMENTS OF CASH FLOWSYEARS ENDED AUGUST 31, 2018 AND 2017 (Dollars in thousands)
2018 2017
CASH FLOWS FROM FINANCING ACTIVITIES:
Proceeds from contributions for endowment and capital projects $ 44,432 $ 15,933
Proceeds from bonds payable — 491,171
Principal repayments of bonds payable (29,500) (365,776)
Recovery of posted collateral for debt-related derivatives 7,770 66,502
Increase (decrease) in annuities payable 783 (658)
Decrease in government advances for federal loan programs (62) (3)
Bond issuance costs — (1,303)
Capital distributions to noncontrolling interests — (802)
Net cash provided by financing activities 23,423 205,064
Net increase (decrease) in cash and cash equivalents 98,336 (441,436)
Cash and cash equivalents at beginning of year 51,113 492,549
Cash and cash equivalents at end of year $ 149,449 $ 51,113
Supplemental disclosure:
Cash paid for interest $ 84,274 $ 83,455
Accrued liabilities for property, plant, and equipment purchases 10,836 10,477
See accompanying notes to consolidated financial statements.

EMORY UNIVERSITY FINANCIALS 2018 9
(1) OrganizationEmory University (the University or Emory) is a private, coeducation-
al, not-for-profit institution, located in Atlanta, Georgia. Founded in 1836, Emory owns and operates educational, research, and healthcare facilities to support its mission. Emory provides educational services to approximately 8,100 undergraduate students and 7,400 graduate and professional students within its nine schools and colleges.
Included within the University is the Emory Healthcare system, Emory Medical Care Foundation (EMCF), and Emory Innovations, LLC. The Emory Healthcare system (Emory Healthcare) consists of Emory Healthcare, Inc. (EHC) and its controlled operating compa-
nies, including Emory University Hospital Midtown (EUHM), Emory University Hospital (EUH), Emory Saint Joseph’s Hospital (ESJH), EHCA Johns Creek Hospital, LLC (EJCH), Emory Rehabilitation Hospital (ERH), The Emory Clinic, Inc. (TEC), Emory Specialty Associates, LLC (ESA), Emory Specialty Associates – Joint Operating Company (ESA JOC), Wesley Woods Center of Emory University, Inc. (WWC), and Clifton Casualty Insurance Company, Ltd. (CCIC). EUH, EUHM, EJCH, and ESJH are sometimes referred to herein, collectively, as “the Hospitals.” The consolidated financial statements include the University and all other entities in which Emory has significant financial interest and control. All significant inter-entity accounts and transactions have been eliminated in consolidation.
(2) Summary of Significant Accounting PoliciesThe following significant accounting policies are used in the prepara-
tion of the accompanying consolidated financial statements: The consolidated financial statements have been prepared on the accrual basis in conformity with U.S. generally accepted accounting principles (GAAP). Net assets and revenues, gains, and losses are classified based
on the existence or absence of externally imposed restrictions.
Accordingly, net assets of the University are classified and reported
as follows: Unrestricted Net Assets – Net assets that are not subject to
donor-imposed stipulations; certain unrestricted net assets are desig-
nated for specific purposes or uses under various internal operating and administrative arrangements of the University. Temporarily Restricted Net Assets – Net assets that are subject
to donor-imposed stipulations; that will be met either by actions of the University and/or the passage of time Permanently Restricted Net Assets – Net assets that are subject to donor-imposed restrictions that the University maintains permanently (note 7); generally, the donors of these assets permit the University to use all or part of the income earned and net appreciation on related investments for general or specific purposes. Revenues are reported as increases in unrestricted net assets unless their use is limited by donor-imposed restrictions. Expenses are reported as decreases in unrestricted net assets. Gains and losses
on investments and other assets or liabilities are reported as increases or decreases in unrestricted net assets unless their use is restricted by explicit donor stipulation or by law. Expirations of restrictions on net assets (i.e., the donor-stipulated purpose has been fulfilled and/or the stipulated time period has elapsed) are reported as net assets released from restrictions and shown as reclassifications among the applicable classes of net assets. Income and realized and unrealized gains on investments of permanently donor-restricted endowment net assets are reported
as follows:• As increases in permanently restricted net assets if the terms of
the gift require that they be added to the principal of a perma-
nent endowment fund• As increases in temporarily restricted net assets until appropriat-
ed for expenditure by the University and/or donor restrictions
are met Revenues earned, expenses incurred, and investment returns made available for the University’s operating purposes of teaching, re-
search, patient care, and other programs and services are components of the net operating revenues/expenses presented in the consolidated statements of activities. The University considers the following items to be nonoperating: gifts and contributions for capital and long-term investment and the related net assets released from restrictions, invest-
ment return in excess of spending distribution for current operations, change in fair value of derivative instruments, pension and postretire-
ment related changes other than net periodic cost, and other, net.
(a) Cash EquivalentsCash equivalents consist primarily of bank balances and short-term money market mutual funds and treasury bills with original matur-
ities of 90 days or less that are not invested as part of the long-term investment assets. These amounts are carried at cost, which approxi-
mates fair value. Cash and cash equivalents that are part of the long-
term pool are shown within investments as those funds generally are not used for daily operating purposes.
(b) Contributions ReceivableContributions of assets other than cash are recorded at their estimated fair value at the date of the gift. Contributions to be received after one year, net of an allowance for uncollectible amounts are discounted to their present value at credit-adjusted rates. Amortization of discounts is recorded as additional contribution revenue. An allowance for uncollectible contributions receivable is provided based on manage-
ment’s judgment, considering such factors as prior collection history, type of contribution, relationship with donor, and other relevant factors.
(c) Loans Receivable, NetEmory-funded loans to students are carried at estimated net realizable value. Loans receivable from students under certain governmental
NOTES TO CONSOLIDATED FINANCIAL STATEMENTSAUGUST 31, 2018 AND 2017

10 EMORY UNIVERSITY FINANCIALS 2018
loan programs, carried at cost, can only be assigned to the federal government or its designees. In addition to Federal Direct Loans (which are not reported in the financial statements), loans to qualified students are funded principally with government advances to Emory under the Perkins, Nursing and Health Professions Student Loan Programs.
(d) Other Receivables, NetOther receivables are recorded at net realizable value and include receivables under grants and contracts, medical services provided
to other organizations, and losses recoverable from reinsurers.
(e) InvestmentsInvestments in securities include U.S. and non-U.S. equities and fixed-income instruments, both publicly traded and privately held. Fair value for these investments is measured based on quoted prices in active markets, if available. If the market is inactive, fair value is de-
termined by underlying managers and reviewed by the University after considering various sources of information. Due to variations in trad-
ing volumes and the lack of quoted market prices for fixed income, the fair value of fixed income is normally derived through recent reported trades for identical or similar securities, making adjustments through the reporting date based on available market observable data. Investments in funds primarily include investments in commin-
gled equity and fixed-income funds and other investments in funds (public market investments, private market investments, real estate partnerships, and natural resources) and are reported at fair value, as determined by the University in accordance with the University’s valuation policies and procedures. The University has estimated the fair value of the majority of its investments in investment funds on the basis of the net asset value (NAV) per share of the investment (or its equivalent), as a practical expedient, if a) the underlying investment manager’s calculation of NAV is fair value based, b) the NAV has been
calculated by the fund manager or fund administrator as of the Uni-
versity’s fiscal year-end date, and c) the University does not currently have plans to sell the investment for an amount different from NAV. If the reported NAV is not as of the University’s fiscal year-end date or is not fair value based, the University will adjust the NAV, if deemed necessary. If the University determines it is not practicable to calcu-
late an adjusted NAV as of the University’s fiscal year-end date, the practical expedient will not be utilized and other valuation methodol-
ogies will be used. Typically, real estate partnerships and similar funds are valued based on appraisals of underlying properties held and conducted by third-party appraisers retained by the general partner or investment manager. General partners of oil and gas partnerships also use third-party appraisers to value properties. Valuations provided by the general partners and investment managers are evaluated by the Emory Investment Management Office and are believed to present reasonable estimates of fair value at August 31, 2018 and 2017. The University’s investments in investment funds are subject to
the terms of the respective funds’ agreements, private placement mem-
oranda, and other governing agreements of such funds. These terms are typical for hedge fund and private equity arrangements. The Uni-
versity’s investments are also subject to management and performance fees as specified in such funds’ agreements. Additionally, such funds in which the University invests may restrict both the transferability of the University’s interest and the University’s ability to withdraw. In light of such restrictions imposed, an investment in these funds is illiquid and subject to liquidity risk. Investment transactions are accounted for on the trade-date basis. Dividend income is recognized on the ex-dividend date, and interest income is recognized on the accrual basis. Realized gains and losses are determined by the specific identification method for investments in investment funds and average cost for investments in securities. Additionally, gains and losses from realized and unrealized changes in the fair value of investments are reported in the consolidat-
ed statements of activities as increases or decreases in unrestricted net assets, if there are no donor restrictions, or in temporarily restricted net assets, until amounts have been appropriated and the donor-im-
posed time restrictions have elapsed. Changes in the fair value of these instruments are recognized as nonoperating investment gains or losses in the consolidated statements of activities.
(f) Fair Value MeasurementsFair value measurements reflected in the consolidated financial state-
ments conceptually represent the price that would be received to sell an asset or paid to transfer a liability in an orderly transaction among market participants at the measurement date. GAAP provides a hier-
archy that prioritizes the inputs to fair value measurements based on the extent to which inputs to valuation techniques are observable in the marketplace. The hierarchy assigns a higher priority to observable inputs that reflect verifiable information obtained from independent sources and a lower priority to unobservable inputs that would reflect the University’s assumptions about how market participants would value an asset or liability based on the best information available. Fair value measurements must maximize the use of observable inputs and minimize the use of unobservable inputs. Assets and liabilities measured and reported at fair value are classified and disclosed within one of the following categories:
Level 1 – Valuations for assets and liabilities traded in active ex-
change markets as of the reporting date; valuations are obtained from readily available pricing sources for market transactions involving identical assets or liabilities.Level 2 – Valuations are determined through direct or indirect observations other than quoted market prices. The type of in-
vestments in Level 2 also includes certain positions in which the University is a unit of account holder within a fund or account that holds underlying assets that are traded in active exchange markets with readily available pricing.
NOTES TO CONSOLIDATED FINANCIAL STATEMENTSAUGUST 31, 2018 AND 2017
EMORY UNIVERSITY FINANCIALS 2018 11
Level 3 – Valuations for assets and liabilities that are unobserv-
able and derived from other valuation methodologies, including discounted cash flow models and similar techniques, and not based on market exchange, dealer, or broker-traded transactions; Level 3 valuations incorporate certain assumptions and projec-
tions in determining the fair value assigned to such assets
or liabilities.
The majority of the University’s investments are held through limited partnerships and commingled funds, for which fair value is estimated using the NAVs reported by the investment managers as a practical expedient. Such investments have not been categorized within the fair value hierarchy. Although a secondary market exists for these investments, the market is not active and individual transac-
tions are typically not observable. When transactions do occur in this limited secondary market, they may occur at discounts to the reported NAV. It is therefore reasonably possible that if the University were to sell these investments in the secondary market, a buyer may require a discount to the reported NAV, and that discount could be significant.
(g) Split-Interest Agreements The University’s split-interest agreements with donors consist pri-
marily of gift annuity agreements and irrevocable charitable remain-
der trusts for which the University serves as trustee. Assets held in the trusts are included in investments. Contribution revenues are recognized when trusts (or annuity agreements) are established, after recording liabilities for the present value of the estimated future pay-
ments to be made to beneficiaries. The liabilities are adjusted annually for changes in the value of assets, accretion of the discount, and other changes in the estimates of future benefits.
(h) Interests in Perpetual Funds Held by OthersThe University is also the beneficiary of certain perpetual funds held and administered by others. The value of the funds’ assets (or Emory’s share when there are other beneficiaries) is considered a reasonable estimate of the present value of the estimated future cash flows from these funds and is recognized in beneficial interest in perpetual funds and as contribution revenue at the date such funds are established. The largest fund of this type consists primarily of shares of common stock of The Coca-Cola Company. The carrying value of Emory’s interest is adjusted annually for changes in fair value.
(i) Property and Equipment, netLand, buildings, and equipment are recorded at cost at the date of acquisition or fair value at the date of gift to the University. Depreci-
ation expense is based on the straight-line method over the estimated useful lives of the assets. Useful lives are as follows: buildings – 10 to 60 years, land improvements and infrastructure – 5 to 40 years, movable equipment – 3 to 20 years, fixed equipment – 3 to 30 years, software and enterprise systems – 3 to 10 years, leasehold improve-
ments – term of the lease, and library books – 10 years. Certain assets totaling $107.1 million and $99.0 million, such as art, museum assets, and rare books, are included in property and equipment on August 31, 2018 and 2017, respectively, but are not depreciated.
(j) Net Tuition and FeesTuition and fees revenues are recognized in the period in which the academic services are rendered. Student tuition and fee receipts
received in advance of services are reported as deferred revenue.
Student financial aid provided by the University for tuition and fees
is reflected as a reduction of gross tuition and fees.
(k) Gifts and Contributions RevenueContributions, including unconditional promises to give, are recog-
nized as revenues in the period received. Unconditional promises to give, with payments due in future periods, are recorded as increases
in temporarily or permanently restricted assets at the estimated pres-
ent value of future cash flows, net of an allowance for uncollectible pledges. Donor-restricted contributions are reported as temporarily restricted or permanently restricted revenue that increases those net asset classes. Expirations of temporary restrictions on net assets, such as the donor stipulation being met or the passage of time, are reported as net assets released from restrictions and reflect reclassifications from temporarily restricted net assets to unrestricted net assets. If the donor stipulation for a temporarily restricted contribution is met in the year of the gift, the contribution is reflected in the unrestricted net asset class. Temporary restrictions on gifts to acquire long-lived assets are considered met in the period when the asset is placed in service. Conditional promises to give are not recognized until they become unconditional; that is, when the conditions on which they depend
are met.
(l) Grants and Contracts Revenue and Indirect Cost RecoveriesFunding from a federal agency, corporation, or private foundation (sponsor) is recorded as grants and contracts revenue when it is for a specified activity with a defined budget, period of performance, and scope of work undertaken by the University. The agreement with the sponsor may take the form of a contract, grant, or cooperative agree-
ment and is generally in direct support of the University’s mission. Sponsored program revenues and program income are earned when the University has substantially met its obligations and when the contractual performance measures have been completed. Revenue is recognized when services are rendered, or allowable expenditures are incurred as specified in the terms and conditions of the agreements, not necessarily when payments are received. Unearned revenue results when cash is received from sponsors in advance of revenue being earned. Unearned revenue is recorded as a liability (deferred revenue) until it is earned. Amounts recorded in grants and contracts receivable
NOTES TO CONSOLIDATED FINANCIAL STATEMENTSAUGUST 31, 2018 AND 2017

12 EMORY UNIVERSITY FINANCIALS 2018
are for services rendered or expenditures incurred in advance of the receipt of funds. Indirect cost recoveries are based on negotiated rates with grant-
or agencies and represent recoveries of facilities and administrative costs incurred under grants and contracts agreements.
(m) Net Patient Service RevenueNet patient service revenue is reported at the estimated net realiz-
able amounts due from patients, third- party payors, and others for services rendered, including estimated retroactive adjustments due to future audits, reviews, and investigations. Retroactive adjustments are considered in the recognition of revenue on an estimated basis in the period the related services are rendered, and such amounts are
adjusted in future periods as adjustments become known or as years are no longer subject to such audits, reviews, and investigations.
Emory Healthcare’s estimates in this area may differ from actual
experience, and those differences may be material. The Hospitals reserve for third-party payor cost report audits and anticipated settlements, through initial audit and final settlement of the cost reports. The Hospitals maintain estimates of third-party settlements for the Hospitals’ routine exposures in this area in recog-
nition of the complexity of relevant reimbursement regulations and the volatility of related settlement processes.
(n) Sales and Services of Auxiliary Enterprises and Independent OperationsAn auxiliary enterprise, as put forth by the National Association
of College and University Business Officers, is a nonacademic entity that exists predominantly to furnish goods and services to students, faculty, and staff. Auxiliary enterprises include residential halls, food services, a bookstore, and parking operations. Fee charges are directly related to the costs of services provided. Independent operations are activities, which are solely owned and/or controlled by the University but are unrelated or independent of its mission. Independent operations include an externally managed conference center, hotel, and a fitness center. Fee charges are based on market rates for the services provided.
(o) Income TaxesThe University is recognized as a tax-exempt organization as defined in Section 501(c)(3) of the U.S. Internal Revenue Code (the Code) and is generally exempt from the federal income taxes on related income pursuant to Section 501(a) of the Code. Accordingly, no provision for income taxes is made in the consolidated financial statements. Unre-
lated business income of the University is reported on Form 990-T. In December 2017, the Tax Cuts and Job Acts (the Act) was approved by the United States Congress. Emory is currently evaluating the impact of the Act.
(p) Derivative InstrumentsCertain investment strategies used by the University and its invest-
ment managers incorporate various derivative financial instruments
in order to reduce volatility, manage market risk, and enhance invest-
ment returns. Such instruments are reflected at fair value and included in investments. Changes in fair value of these instruments are recog-
nized as nonoperating investment gains or losses in the consolidated statements of activities. The University will, from time to time, utilize interest swap agreements to hedge interest rate market exposure of variable rate debt. The difference between amounts paid and received under such agreements is reported in interest expense. Changes in the fair value of these swap agreements are recognized as nonoperating changes in net assets in the consolidated statements of activities.
(q) Pension and Postretirement BenefitsThe University recognizes the funded status of its defined-benefit pension and postretirement benefit plans as an asset or liability and recognizes changes in funded status during the year in which the changes occur as changes in unrestricted net assets.
(r) ReclassificationsCertain amounts included in the accompanying 2017 consolidated statements of financial position have been reclassified to conform
with the 2018 presentation. The University reduced both the purchases and sales of invest-
ments, within the investing activities of the consolidated statement of cash flows in 2017, which reflects the netting of high volume cash activities within its investment pools.
(s) New Accounting PronouncementsIn May 2014, the Financial Accounting Standards Board (FASB) issued Accounting Standards Update (ASU) No. 2014-09, Revenue
from Contracts with Customers, which requires entities to recognize revenue to depict the transfer of promised goods or services to cus-
tomers in amounts that reflect the consideration expected in exchange for those goods or services. Entities should also disclose quantitative and qualitative information about the nature, amount, timing, and uncertainty of revenue and cash flows arising from contracts with cus-
tomers. ASU No. 2014-09 is effective for the University for FY 2019. In June 2018, the FASB issued ASU No. 2018-08, Clarifying
the Scope and Accounting Guidance for Contributions Received and
Contributions Made, which clarifies whether grant (or similar transac-
tions) should be accounted for as contributions or exchange transac-
tions. ASU No. 2018-08 is effective in FY 2019 for the University. In August 2016, the FASB issued ASU No. 2016-14, Presentation
of Financial Statements of Not-for-Profit Entities. ASU No. 2016-14 (1) reduces the number of net asset classes presented from three to two, (2) requires the presentation of expenses by functional and natural classification in one location, and (3) requires quantitative
NOTES TO CONSOLIDATED FINANCIAL STATEMENTSAUGUST 31, 2018 AND 2017

EMORY UNIVERSITY FINANCIALS 2018 13
and qualitative disclosures about liquidity and availability of financial assets. ASU No. 2016-14 is effective in FY 2019 for the University. In March 2017, the FASB issued ASU No. 2017-07, Improving
the Presentation of Net Periodic Pension Cost and Net Periodic Post-
retirement Benefit Cost, which requires the University to present the service cost component of net benefit cost within operating expenses and all other components of net benefit cost in nonoperating activi-
ties. The ASU is effective for the University in FY 2020. In February 2016, the FASB issued ASU No. 2016-02, Leases (Topic 842). ASU No. 2016-02 requires the recognition of right-of-use assets and lease liabilities by lessees for those leases classified as operating leases under the Accounting Standards Codification (ASC) Topic 840 – Leases. The accounting applied by a lessor under ASU No. 2016-02 is largely unchanged from that applied under ASC Topic 840. ASU No. 2016-02 is effective for the University in FY 2020.
(t) Use of EstimatesThe preparation of the consolidated financial statements in conformi-
ty with GAAP requires that management make estimates and assump-
tions affecting the reported amounts of assets, liabilities, revenues, and expenses, as well as disclosure of contingent assets and liabilities. Actual results could differ from those estimates. Significant items in the University’s consolidated financial state-
ments subject to such estimates and assumptions include valuations for certain investments without readily determinable fair values, the determination of the allowances for uncollectible accounts and con-
tractual adjustments, reserves for employee healthcare and workers’ compensation claims, accrued professional and general liability costs, estimated third-party settlements, and actuarially determined benefit liabilities.
(u) Conflict of Interest PoliciesUniversity trustees, directors, principal officers, and key employees may periodically be directly or indirectly associated with companies doing business with the University. The University requires annual disclosure of significant financial interests in, or employment or board service with, entities doing business with the University. The annual disclosures cover these key officials and their immediate family mem-
bers. When such relationships exist, measures are taken to appropri-
ately manage the actual or perceived conflict. The written conflict of interest policy for the University requires, among other things, that no member of a governing board may participate in any decision in which he or she (or an immediate family member) has a material financial interest.
(3) Contributions ReceivableContributions receivable as of August 31 consist of the following (in thousands):
2018 2017
UNCONDITIONAL PROMISES EXPECTED TO BE COLLECTED IN:
Less than one year $ 167,912 35,953
One year to five years 275,094 52,171
Over five years 2,983 3,671
Gross contributions receivable 445,989 91,795
Less:
Allowance for uncollectible amounts (10,581) (2,516)
Discount to present value (39,281) (8,872)
CONTRIBUTIONS RECEIVABLE, NET $ 396,127 80,407
At August 31, 2018 and 2017, the five largest outstanding donor pledge balances represented 90% and 42%, respectively, of Emory’s gross contributions receivable. Contributions receivable are discount-
ed at rates ranging from 1.83% to 9.24%. As of August 31, 2018, the University had received bequest intentions and conditional promises of approximately $27.0 million. These intentions to give are not recognized as assets or revenues and, if received, will generally be restricted for purposes stipulated by the donor.
(4) Business and Credit ConcentrationsEmory Healthcare grants credit to patients, substantially all of whom reside in the service areas. Emory Healthcare generally does not require collateral or other security in extending credit to patients; however, it routinely obtains assignment of (or is otherwise entitled to receive) patients’ benefits payable under their health insurance programs, plans, or policies (e.g., Medicare, Medicaid, Managed Care, capitated, and other preferred provider arrangements and commercial insurance policies). The composition of net receivables from patients and third-party payors follows:
2018 2017
Managed care and other third-party payors 56% 54%
Medicare 32 38
Patients 5 4
Medicaid 7 4
100% 100%
NOTES TO CONSOLIDATED FINANCIAL STATEMENTSAUGUST 31, 2018 AND 2017
14 EMORY UNIVERSITY FINANCIALS 2018
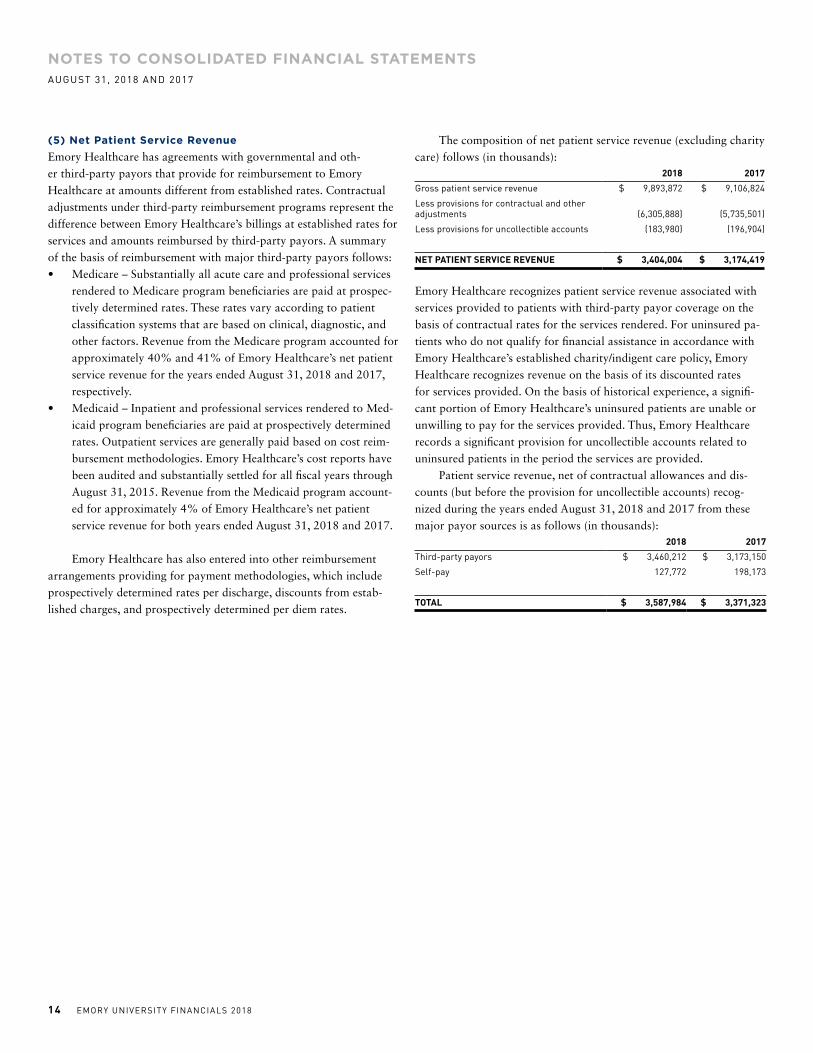
(5) Net Patient Service RevenueEmory Healthcare has agreements with governmental and oth-
er third-party payors that provide for reimbursement to Emory Healthcare at amounts different from established rates. Contractual adjustments under third-party reimbursement programs represent the difference between Emory Healthcare’s billings at established rates for services and amounts reimbursed by third-party payors. A summary of the basis of reimbursement with major third-party payors follows:• Medicare – Substantially all acute care and professional services
rendered to Medicare program beneficiaries are paid at prospec-
tively determined rates. These rates vary according to patient classification systems that are based on clinical, diagnostic, and other factors. Revenue from the Medicare program accounted for approximately 40% and 41% of Emory Healthcare’s net patient service revenue for the years ended August 31, 2018 and 2017, respectively.
• Medicaid – Inpatient and professional services rendered to Med-
icaid program beneficiaries are paid at prospectively determined rates. Outpatient services are generally paid based on cost reim-
bursement methodologies. Emory Healthcare’s cost reports have been audited and substantially settled for all fiscal years through August 31, 2015. Revenue from the Medicaid program account-
ed for approximately 4% of Emory Healthcare’s net patient service revenue for both years ended August 31, 2018 and 2017.
Emory Healthcare has also entered into other reimbursement arrangements providing for payment methodologies, which include prospectively determined rates per discharge, discounts from estab-
lished charges, and prospectively determined per diem rates.
The composition of net patient service revenue (excluding charity care) follows (in thousands):
2018 2017
Gross patient service revenue $ 9,893,872 $ 9,106,824
Less provisions for contractual and other adjustments (6,305,888) (5,735,501)
Less provisions for uncollectible accounts (183,980) (196,904)
NET PATIENT SERVICE REVENUE $ 3,404,004 $ 3,174,419
Emory Healthcare recognizes patient service revenue associated with services provided to patients with third-party payor coverage on the basis of contractual rates for the services rendered. For uninsured pa-
tients who do not qualify for financial assistance in accordance with Emory Healthcare’s established charity/indigent care policy, Emory Healthcare recognizes revenue on the basis of its discounted rates for services provided. On the basis of historical experience, a signifi-
cant portion of Emory Healthcare’s uninsured patients are unable or unwilling to pay for the services provided. Thus, Emory Healthcare records a significant provision for uncollectible accounts related to uninsured patients in the period the services are provided. Patient service revenue, net of contractual allowances and dis-
counts (but before the provision for uncollectible accounts) recog-
nized during the years ended August 31, 2018 and 2017 from these major payor sources is as follows (in thousands):
2018 2017
Third-party payors $ 3,460,212 $ 3,173,150
Self-pay 127,772 198,173
TOTAL $ 3,587,984 $ 3,371,323
NOTES TO CONSOLIDATED FINANCIAL STATEMENTSAUGUST 31, 2018 AND 2017
EMORY UNIVERSITY FINANCIALS 2018 15
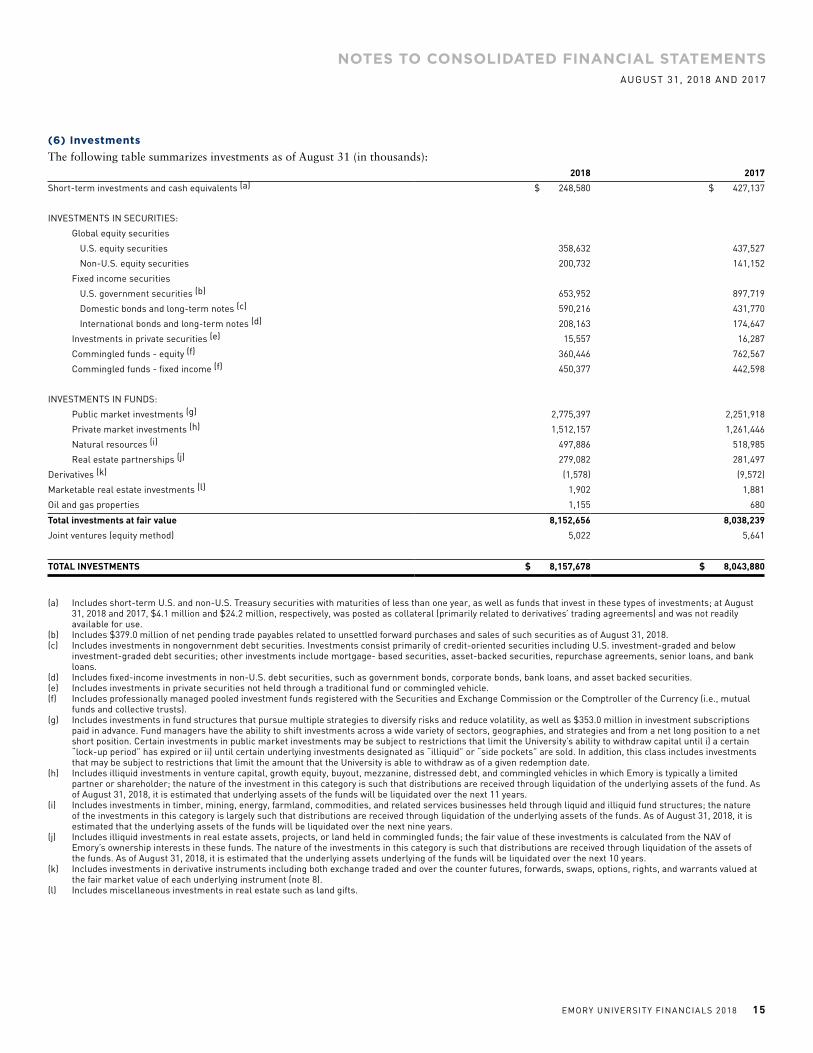
(6) InvestmentsThe following table summarizes investments as of August 31 (in thousands):
2018 2017
Short-term investments and cash equivalents (a) $ 248,580 $ 427,137
INVESTMENTS IN SECURITIES:
Global equity securities
U.S. equity securities 358,632 437,527
Non-U.S. equity securities 200,732 141,152
Fixed income securities
U.S. government securities (b) 653,952 897,719
Domestic bonds and long-term notes (c) 590,216 431,770
International bonds and long-term notes (d) 208,163 174,647
Investments in private securities (e) 15,557 16,287
Commingled funds - equity (f) 360,446 762,567
Commingled funds - fixed income (f) 450,377 442,598
INVESTMENTS IN FUNDS:
Public market investments (g) 2,775,397 2,251,918
Private market investments (h) 1,512,157 1,261,446
Natural resources (i) 497,886 518,985
Real estate partnerships (j) 279,082 281,497
Derivatives (k) (1,578) (9,572)
Marketable real estate investments (l) 1,902 1,881
Oil and gas properties 1,155 680
Total investments at fair value 8,152,656 8,038,239
Joint ventures (equity method) 5,022 5,641
TOTAL INVESTMENTS $ 8,157,678 $ 8,043,880
(a) Includes short-term U.S. and non-U.S. Treasury securities with maturities of less than one year, as well as funds that invest in these types of investments; at August 31, 2018 and 2017, $4.1 million and $24.2 million, respectively, was posted as collateral (primarily related to derivatives’ trading agreements) and was not readily available for use.
(b) Includes $379.0 million of net pending trade payables related to unsettled forward purchases and sales of such securities as of August 31, 2018.(c) Includes investments in nongovernment debt securities. Investments consist primarily of credit-oriented securities including U.S. investment-graded and below
investment-graded debt securities; other investments include mortgage- based securities, asset-backed securities, repurchase agreements, senior loans, and bank loans.
(d) Includes fixed-income investments in non-U.S. debt securities, such as government bonds, corporate bonds, bank loans, and asset backed securities.(e) Includes investments in private securities not held through a traditional fund or commingled vehicle.(f) Includes professionally managed pooled investment funds registered with the Securities and Exchange Commission or the Comptroller of the Currency (i.e., mutual
funds and collective trusts).(g) Includes investments in fund structures that pursue multiple strategies to diversify risks and reduce volatility, as well as $353.0 million in investment subscriptions
paid in advance. Fund managers have the ability to shift investments across a wide variety of sectors, geographies, and strategies and from a net long position to a net short position. Certain investments in public market investments may be subject to restrictions that limit the University’s ability to withdraw capital until i) a certain “lock-up period” has expired or ii) until certain underlying investments designated as “illiquid” or “side pockets” are sold. In addition, this class includes investments that may be subject to restrictions that limit the amount that the University is able to withdraw as of a given redemption date.
(h) Includes illiquid investments in venture capital, growth equity, buyout, mezzanine, distressed debt, and commingled vehicles in which Emory is typically a limited partner or shareholder; the nature of the investment in this category is such that distributions are received through liquidation of the underlying assets of the fund. As of August 31, 2018, it is estimated that underlying assets of the funds will be liquidated over the next 11 years.
(i) Includes investments in timber, mining, energy, farmland, commodities, and related services businesses held through liquid and illiquid fund structures; the nature of the investments in this category is largely such that distributions are received through liquidation of the underlying assets of the funds. As of August 31, 2018, it is estimated that the underlying assets of the funds will be liquidated over the next nine years.
(j) Includes illiquid investments in real estate assets, projects, or land held in commingled funds; the fair value of these investments is calculated from the NAV of Emory’s ownership interests in these funds. The nature of the investments in this category is such that distributions are received through liquidation of the assets of the funds. As of August 31, 2018, it is estimated that the underlying assets underlying of the funds will be liquidated over the next 10 years.
(k) Includes investments in derivative instruments including both exchange traded and over the counter futures, forwards, swaps, options, rights, and warrants valued at the fair market value of each underlying instrument (note 8).
(l) Includes miscellaneous investments in real estate such as land gifts.
NOTES TO CONSOLIDATED FINANCIAL STATEMENTSAUGUST 31, 2018 AND 2017
16 EMORY UNIVERSITY FINANCIALS 2018
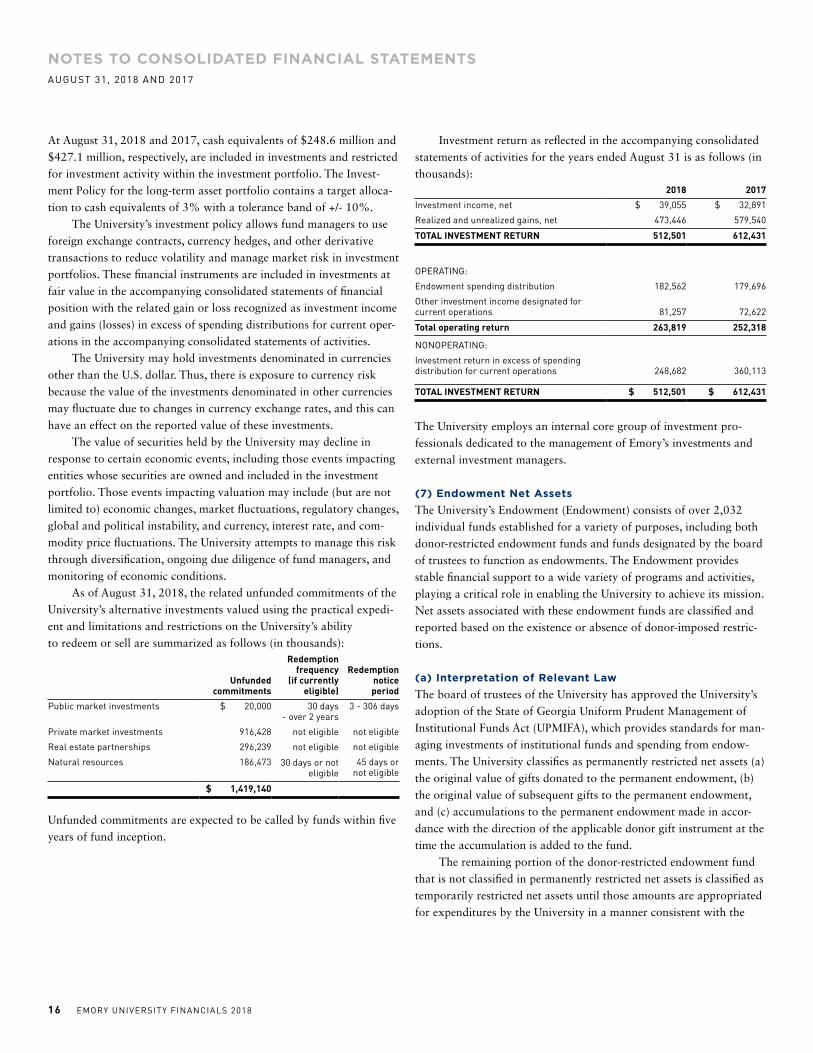
At August 31, 2018 and 2017, cash equivalents of $248.6 million and $427.1 million, respectively, are included in investments and restricted for investment activity within the investment portfolio. The Invest-
ment Policy for the long-term asset portfolio contains a target alloca-
tion to cash equivalents of 3% with a tolerance band of +/- 10%. The University’s investment policy allows fund managers to use foreign exchange contracts, currency hedges, and other derivative transactions to reduce volatility and manage market risk in investment portfolios. These financial instruments are included in investments at fair value in the accompanying consolidated statements of financial position with the related gain or loss recognized as investment income and gains (losses) in excess of spending distributions for current oper-
ations in the accompanying consolidated statements of activities. The University may hold investments denominated in currencies other than the U.S. dollar. Thus, there is exposure to currency risk because the value of the investments denominated in other currencies may fluctuate due to changes in currency exchange rates, and this can have an effect on the reported value of these investments. The value of securities held by the University may decline in response to certain economic events, including those events impacting entities whose securities are owned and included in the investment portfolio. Those events impacting valuation may include (but are not limited to) economic changes, market fluctuations, regulatory changes, global and political instability, and currency, interest rate, and com-
modity price fluctuations. The University attempts to manage this risk through diversification, ongoing due diligence of fund managers, and monitoring of economic conditions. As of August 31, 2018, the related unfunded commitments of the University’s alternative investments valued using the practical expedi-
ent and limitations and restrictions on the University’s ability
to redeem or sell are summarized as follows (in thousands):
Unfunded commitments
Redemption frequency
(if currently eligible)
Redemption notice period
Public market investments $ 20,000 30 days - over 2 years
3 - 306 days
Private market investments 916,428 not eligible not eligible
Real estate partnerships 296,239 not eligible not eligible
Natural resources 186,473 30 days or not eligible
45 days or not eligible
$ 1,419,140
Unfunded commitments are expected to be called by funds within five years of fund inception.
Investment return as reflected in the accompanying consolidated statements of activities for the years ended August 31 is as follows (in thousands):
2018 2017
Investment income, net $ 39,055 $ 32,891
Realized and unrealized gains, net 473,446 579,540
TOTAL INVESTMENT RETURN 512,501 612,431
OPERATING:
Endowment spending distribution 182,562 179,696
Other investment income designated for current operations 81,257 72,622
Total operating return 263,819 252,318
NONOPERATING:
Investment return in excess of spending distribution for current operations 248,682 360,113
TOTAL INVESTMENT RETURN $ 512,501 $ 612,431
The University employs an internal core group of investment pro-
fessionals dedicated to the management of Emory’s investments and external investment managers.
(7) Endowment Net AssetsThe University’s Endowment (Endowment) consists of over 2,032 individual funds established for a variety of purposes, including both donor-restricted endowment funds and funds designated by the board of trustees to function as endowments. The Endowment provides stable financial support to a wide variety of programs and activities, playing a critical role in enabling the University to achieve its mission. Net assets associated with these endowment funds are classified and reported based on the existence or absence of donor-imposed restric-
tions.
(a) Interpretation of Relevant LawThe board of trustees of the University has approved the University’s adoption of the State of Georgia Uniform Prudent Management of Institutional Funds Act (UPMIFA), which provides standards for man-
aging investments of institutional funds and spending from endow-
ments. The University classifies as permanently restricted net assets (a) the original value of gifts donated to the permanent endowment, (b) the original value of subsequent gifts to the permanent endowment, and (c) accumulations to the permanent endowment made in accor-
dance with the direction of the applicable donor gift instrument at the time the accumulation is added to the fund. The remaining portion of the donor-restricted endowment fund that is not classified in permanently restricted net assets is classified as temporarily restricted net assets until those amounts are appropriated for expenditures by the University in a manner consistent with the
NOTES TO CONSOLIDATED FINANCIAL STATEMENTSAUGUST 31, 2018 AND 2017
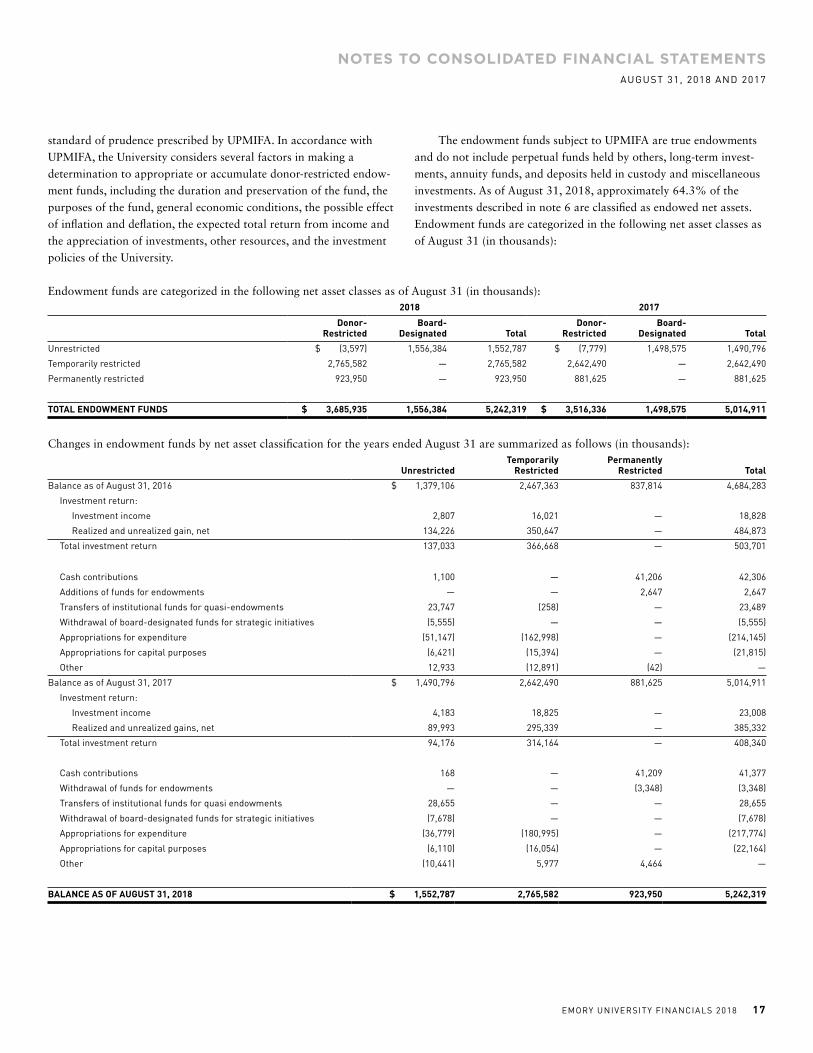
EMORY UNIVERSITY FINANCIALS 2018 17
standard of prudence prescribed by UPMIFA. In accordance with
UPMIFA, the University considers several factors in making a determination to appropriate or accumulate donor-restricted endow-
ment funds, including the duration and preservation of the fund, the purposes of the fund, general economic conditions, the possible effect of inflation and deflation, the expected total return from income and the appreciation of investments, other resources, and the investment policies of the University.
The endowment funds subject to UPMIFA are true endowments and do not include perpetual funds held by others, long-term invest-
ments, annuity funds, and deposits held in custody and miscellaneous investments. As of August 31, 2018, approximately 64.3% of the investments described in note 6 are classified as endowed net assets. Endowment funds are categorized in the following net asset classes as of August 31 (in thousands):
Endowment funds are categorized in the following net asset classes as of August 31 (in thousands):2018 2017
Donor-Restricted
Board-Designated Total
Donor-Restricted
Board-Designated Total
Unrestricted $ (3,597) 1,556,384 1,552,787 $ (7,779) 1,498,575 1,490,796
Temporarily restricted 2,765,582 — 2,765,582 2,642,490 — 2,642,490
Permanently restricted 923,950 — 923,950 881,625 — 881,625
TOTAL ENDOWMENT FUNDS $ 3,685,935 1,556,384 5,242,319 $ 3,516,336 1,498,575 5,014,911
Changes in endowment funds by net asset classification for the years ended August 31 are summarized as follows (in thousands):
UnrestrictedTemporarily
RestrictedPermanently
Restricted Total
Balance as of August 31, 2016 $ 1,379,106 2,467,363 837,814 4,684,283
Investment return:
Investment income 2,807 16,021 — 18,828
Realized and unrealized gain, net 134,226 350,647 — 484,873
Total investment return 137,033 366,668 — 503,701
Cash contributions 1,100 — 41,206 42,306
Additions of funds for endowments — — 2,647 2,647
Transfers of institutional funds for quasi-endowments 23,747 (258) — 23,489
Withdrawal of board-designated funds for strategic initiatives (5,555) — — (5,555)
Appropriations for expenditure (51,147) (162,998) — (214,145)
Appropriations for capital purposes (6,421) (15,394) — (21,815)
Other 12,933 (12,891) (42) —
Balance as of August 31, 2017 $ 1,490,796 2,642,490 881,625 5,014,911
Investment return:
Investment income 4,183 18,825 — 23,008
Realized and unrealized gains, net 89,993 295,339 — 385,332
Total investment return 94,176 314,164 — 408,340
Cash contributions 168 — 41,209 41,377
Withdrawal of funds for endowments — — (3,348) (3,348)
Transfers of institutional funds for quasi endowments 28,655 — — 28,655
Withdrawal of board-designated funds for strategic initiatives (7,678) — — (7,678)
Appropriations for expenditure (36,779) (180,995) — (217,774)
Appropriations for capital purposes (6,110) (16,054) — (22,164)
Other (10,441) 5,977 4,464 —
BALANCE AS OF AUGUST 31, 2018 $ 1,552,787 2,765,582 923,950 5,242,319
NOTES TO CONSOLIDATED FINANCIAL STATEMENTSAUGUST 31, 2018 AND 2017

18 EMORY UNIVERSITY FINANCIALS 2018
(b) Funds with DeficienciesFrom time to time, the fair value of assets associated with individual donor-restricted endowment funds may fall below the level of the
donor’s original contribution. Deficiencies of this nature that are reported in unrestricted net assets were $3.6 million and $7.8 million as of August 31, 2018 and 2017, respectively. Subsequent gains that restore the fair value of the assets of the endowment fund to book value will be classified as an increase in unrestricted net assets.
(c) Return Objectives and Risk ParametersThe University has adopted investment and spending policies for endowment assets that attempt to provide a predictable stream of funding to programs supported by its endowment while seeking to maintain the purchasing power of the endowment assets. Under this policy, as approved by the board of trustees, the endowment assets are invested within risk tolerances of the University to provide an expect-
ed total return in excess of spending and inflation over the long-term.
(d) Strategies Employed for Achieving ObjectivesTo satisfy its long-term, rate-of-return objectives, the University relies on a total return strategy in which investment returns are achieved through both capital appreciation (realized and unrealized) and cur-
rent yield (interest and dividends). The University employs a diver-
sified asset allocation strategy across global equities, fixed income, marketable alternatives, and private investments to achieve its long-term return objectives within prudent risk constraints. The Endow-
ment’s long-term target asset allocation is approved by the investment committee of the board of trustees. The portfolio is periodically rebalanced to the target weightings for each asset class.
(e) Relationship between Investment Objectives and Spending Policy The University’s board of trustees has established a spending policy that determines how endowment distributions are made. The distribu-
tion of endowment income in 2018 and 2017 was based on a hybrid spending policy formula, which is approved by the board of trust-
ees and has both a constant budget growth component and market value based component. The target payout rate was 4.75% for FY 2018 and FY 2017. The University considers the expected return on its endowment, including the effect of inflation in setting the annual appropriation amount. Accordingly, the University expects the current spending policy to allow its endowment to maintain its purchasing power if projected growth rates are achieved. Additional real growth will be provided through new gifts and any excess investment return. The payout rate is approved annually by the board of trustees as part of the budget process.
(8) Derivative Instruments and Hedging Activities
Investments
The University has executed derivative financial instruments in the normal course of its business. Investment strategies employed by Emory and investment managers retained by Emory may incorporate futures, options, swaps, and other derivative instruments to adjust elements of investment exposures to various securities, markets, and currencies without actually taking a position in the underlying asset. These instruments expose Emory to risk of an unexpected move-
ment in the fair value of the underlying security, a counterparty failing to meet its obligations and, in certain circumstances, not being able to unwind a position at current fair value due to market illiquidity. Emory has established procedures to monitor and manage these risks. The purchase and sale of exchange-traded derivatives require collater-
al deposits with a Futures Commission Merchant (FCM). In the event of an FCM’s insolvency, recovery may be limited to Emory’s pro rata share of segregated customer funds available. It is possible that the recovery amount could be less than the total of cash and other equity deposited. Management does not consider the underlying counter-
party risk will have a material impact on the financial position of the University.
NOTES TO CONSOLIDATED FINANCIAL STATEMENTSAUGUST 31, 2018 AND 2017
EMORY UNIVERSITY FINANCIALS 2018 19
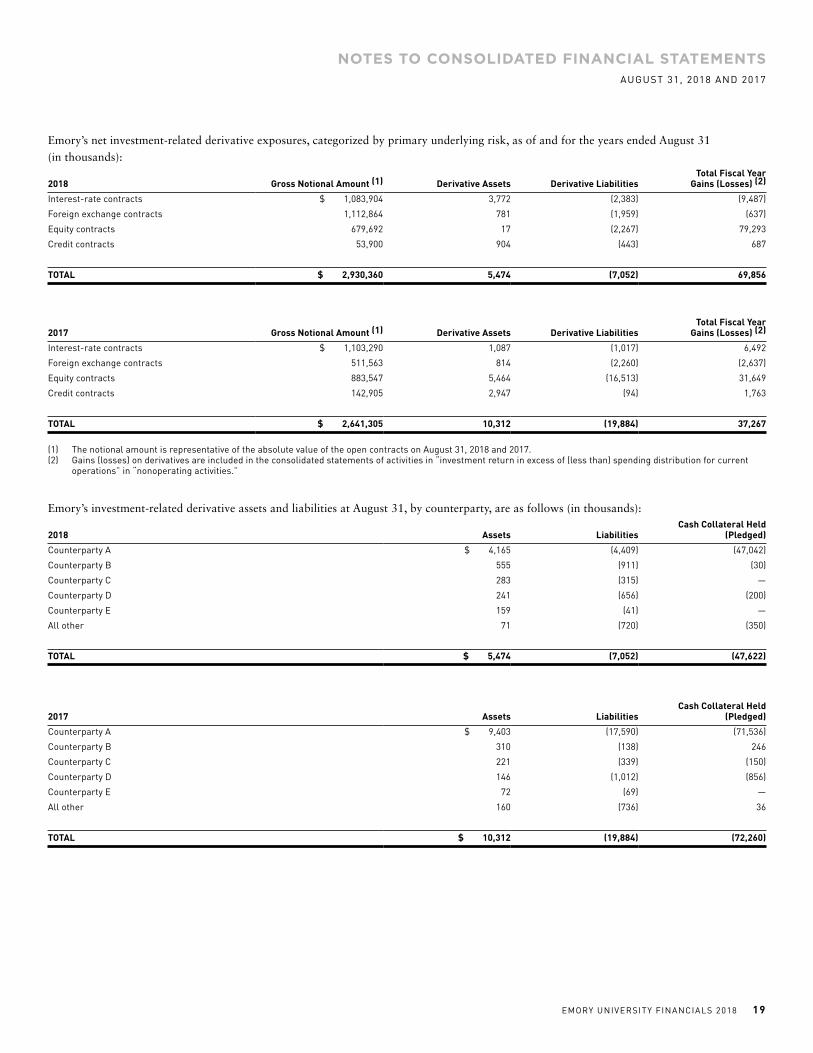
Emory’s net investment-related derivative exposures, categorized by primary underlying risk, as of and for the years ended August 31
(in thousands):
2018 Gross Notional Amount (1) Derivative Assets Derivative LiabilitiesTotal Fiscal Year
Gains (Losses) (2)
Interest-rate contracts $ 1,083,904 3,772 (2,383) (9,487)
Foreign exchange contracts 1,112,864 781 (1,959) (637)
Equity contracts 679,692 17 (2,267) 79,293
Credit contracts 53,900 904 (443) 687
TOTAL $ 2,930,360 5,474 (7,052) 69,856
2017 Gross Notional Amount (1) Derivative Assets Derivative LiabilitiesTotal Fiscal Year
Gains (Losses) (2)
Interest-rate contracts $ 1,103,290 1,087 (1,017) 6,492
Foreign exchange contracts 511,563 814 (2,260) (2,637)
Equity contracts 883,547 5,464 (16,513) 31,649
Credit contracts 142,905 2,947 (94) 1,763
TOTAL $ 2,641,305 10,312 (19,884) 37,267
(1) The notional amount is representative of the absolute value of the open contracts on August 31, 2018 and 2017.(2) Gains (losses) on derivatives are included in the consolidated statements of activities in “investment return in excess of (less than) spending distribution for current
operations” in “nonoperating activities.”
Emory’s investment-related derivative assets and liabilities at August 31, by counterparty, are as follows (in thousands):
2018 Assets LiabilitiesCash Collateral Held
(Pledged)
Counterparty A $ 4,165 (4,409) (47,042)
Counterparty B 555 (911) (30)
Counterparty C 283 (315) —
Counterparty D 241 (656) (200)
Counterparty E 159 (41) —
All other 71 (720) (350)
TOTAL $ 5,474 (7,052) (47,622)
2017 Assets LiabilitiesCash Collateral Held
(Pledged)
Counterparty A $ 9,403 (17,590) (71,536)
Counterparty B 310 (138) 246
Counterparty C 221 (339) (150)
Counterparty D 146 (1,012) (856)
Counterparty E 72 (69) —
All other 160 (736) 36
TOTAL $ 10,312 (19,884) (72,260)
NOTES TO CONSOLIDATED FINANCIAL STATEMENTSAUGUST 31, 2018 AND 2017
20 EMORY UNIVERSITY FINANCIALS 2018
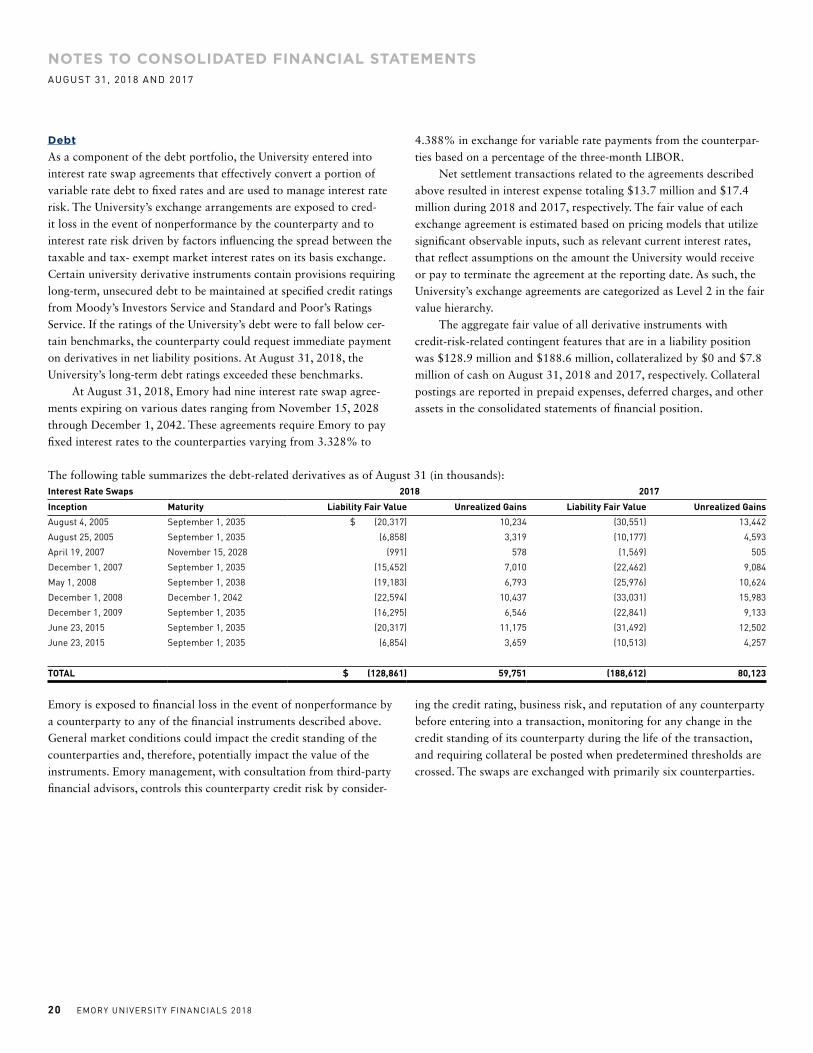
DebtAs a component of the debt portfolio, the University entered into interest rate swap agreements that effectively convert a portion of variable rate debt to fixed rates and are used to manage interest rate risk. The University’s exchange arrangements are exposed to cred-
it loss in the event of nonperformance by the counterparty and to interest rate risk driven by factors influencing the spread between the taxable and tax- exempt market interest rates on its basis exchange. Certain university derivative instruments contain provisions requiring long-term, unsecured debt to be maintained at specified credit ratings from Moody’s Investors Service and Standard and Poor’s Ratings
Service. If the ratings of the University’s debt were to fall below cer-
tain benchmarks, the counterparty could request immediate payment
on derivatives in net liability positions. At August 31, 2018, the
University’s long-term debt ratings exceeded these benchmarks. At August 31, 2018, Emory had nine interest rate swap agree-
ments expiring on various dates ranging from November 15, 2028 through December 1, 2042. These agreements require Emory to pay fixed interest rates to the counterparties varying from 3.328% to
4.388% in exchange for variable rate payments from the counterpar-
ties based on a percentage of the three-month LIBOR. Net settlement transactions related to the agreements described above resulted in interest expense totaling $13.7 million and $17.4 million during 2018 and 2017, respectively. The fair value of each exchange agreement is estimated based on pricing models that utilize significant observable inputs, such as relevant current interest rates, that reflect assumptions on the amount the University would receive or pay to terminate the agreement at the reporting date. As such, the University’s exchange agreements are categorized as Level 2 in the fair value hierarchy. The aggregate fair value of all derivative instruments with credit-risk-related contingent features that are in a liability position was $128.9 million and $188.6 million, collateralized by $0 and $7.8 million of cash on August 31, 2018 and 2017, respectively. Collateral postings are reported in prepaid expenses, deferred charges, and other assets in the consolidated statements of financial position.
The following table summarizes the debt-related derivatives as of August 31 (in thousands):Interest Rate Swaps 2018 2017
Inception Maturity Liability Fair Value Unrealized Gains Liability Fair Value Unrealized Gains
August 4, 2005 September 1, 2035 $ (20,317) 10,234 (30,551) 13,442
August 25, 2005 September 1, 2035 (6,858) 3,319 (10,177) 4,593
April 19, 2007 November 15, 2028 (991) 578 (1,569) 505
December 1, 2007 September 1, 2035 (15,452) 7,010 (22,462) 9,084
May 1, 2008 September 1, 2038 (19,183) 6,793 (25,976) 10,624
December 1, 2008 December 1, 2042 (22,594) 10,437 (33,031) 15,983
December 1, 2009 September 1, 2035 (16,295) 6,546 (22,841) 9,133
June 23, 2015 September 1, 2035 (20,317) 11,175 (31,492) 12,502
June 23, 2015 September 1, 2035 (6,854) 3,659 (10,513) 4,257
TOTAL $ (128,861) 59,751 (188,612) 80,123
Emory is exposed to financial loss in the event of nonperformance by a counterparty to any of the financial instruments described above. General market conditions could impact the credit standing of the counterparties and, therefore, potentially impact the value of the instruments. Emory management, with consultation from third-party financial advisors, controls this counterparty credit risk by consider-
ing the credit rating, business risk, and reputation of any counterparty before entering into a transaction, monitoring for any change in the credit standing of its counterparty during the life of the transaction, and requiring collateral be posted when predetermined thresholds are crossed. The swaps are exchanged with primarily six counterparties.
NOTES TO CONSOLIDATED FINANCIAL STATEMENTSAUGUST 31, 2018 AND 2017

EMORY UNIVERSITY FINANCIALS 2018 21
(9) Fair Values of Assets and LiabilitiesThe following table summarizes the valuation of the University’s assets and liabilities according to the fair value hierarchy levels as of August 31, 2018 (in thousands):
Total fair valueInvestments
measured at NAV (3) Level 1 Level 2 Level 3
FINANCIAL ASSETS:
Short-term investments and cash equivalents $ 248,580 — 247,493 1,087 —
Investments in securities:
Global equity securities
U.S. equity securities 358,632 — 358,420 203 9
Non-U.S. equity securities 200,732 — 199,813 222 697
Fixed-income securities:
U.S. government securities 653,952 — 217 653,735 —
Domestic bonds and long-term notes 590,216 — 1,550 587,940 726
International bonds and long-term notes 208,163 — 14 208,149 —
Investments in private securities 15,557 — — — 15,557
Commingled funds - equity 360,446 63,747 22,859 273,840 —
Commingled funds - fixed-income 450,377 — 228,631 221,746 —
Investments in funds:
Public market investments 2,775,397 2,775,397 — — —
Private market investments 1,512,157 1,507,082 — — 5,075
Natural resources 497,886 493,382 — — 4,504
Real estate partnerships 279,082 279,082 — — —
Derivatives (1,578) — (2,980) 1,402 —
Marketable real estate investments 1,902 — 228 1,674 —
Oil and gas properties 1,155 — — — 1,155
Total investments (1) 8,152,656 5,118,690 1,056,245 1,949,998 27,723
Interest in perpetual funds held by others (2) 1,311,406 — — — 1,311,406
Total assets at fair value $ 9,464,062 5,118,690 1,056,245 1,949,998 1,339,129
FINANCIAL LIABILITIES:
Derivative instruments - interest rate swaps (128,861) — — (128,861) —
Funds held in trust for others (791,841) — — (791,841) —
TOTAL LIABILITIES AT FAIR VALUE $ (920,702) — — (920,702) —
(1) Certain investments in joint ventures carried under the equity method of accounting are not reported at fair value and thus not included in the table above (note 6).(2) Primarily invested in The Coca-Cola Company.(3) Certain investments that are measured at fair value using the NAV per share (or its equivalent) practical expedient have not been categorized in the fair value
hierarchy. The fair value amounts presented in this table are intended to permit reconciliation of the fair value hierarchy to the amounts presented in the consolidated statements of financial position.
NOTES TO CONSOLIDATED FINANCIAL STATEMENTSAUGUST 31, 2018 AND 2017
22 EMORY UNIVERSITY FINANCIALS 2018
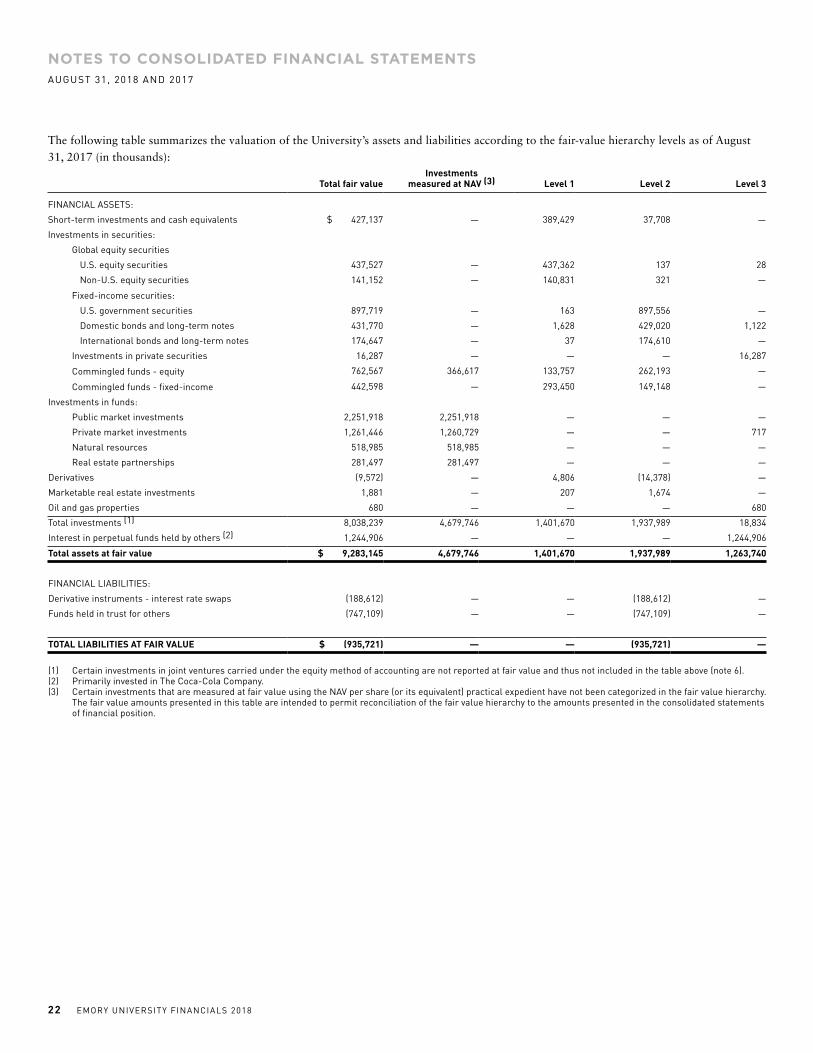
The following table summarizes the valuation of the University’s assets and liabilities according to the fair-value hierarchy levels as of August 31, 2017 (in thousands):
Total fair valueInvestments
measured at NAV (3) Level 1 Level 2 Level 3
FINANCIAL ASSETS:
Short-term investments and cash equivalents $ 427,137 — 389,429 37,708 —
Investments in securities:
Global equity securities
U.S. equity securities 437,527 — 437,362 137 28
Non-U.S. equity securities 141,152 — 140,831 321 —
Fixed-income securities:
U.S. government securities 897,719 — 163 897,556 —
Domestic bonds and long-term notes 431,770 — 1,628 429,020 1,122
International bonds and long-term notes 174,647 — 37 174,610 —
Investments in private securities 16,287 — — — 16,287
Commingled funds - equity 762,567 366,617 133,757 262,193 —
Commingled funds - fixed-income 442,598 — 293,450 149,148 —
Investments in funds:
Public market investments 2,251,918 2,251,918 — — —
Private market investments 1,261,446 1,260,729 — — 717
Natural resources 518,985 518,985 — — —
Real estate partnerships 281,497 281,497 — — —
Derivatives (9,572) — 4,806 (14,378) —
Marketable real estate investments 1,881 — 207 1,674 —
Oil and gas properties 680 — — — 680
Total investments (1) 8,038,239 4,679,746 1,401,670 1,937,989 18,834
Interest in perpetual funds held by others (2) 1,244,906 — — — 1,244,906
Total assets at fair value $ 9,283,145 4,679,746 1,401,670 1,937,989 1,263,740
FINANCIAL LIABILITIES:
Derivative instruments - interest rate swaps (188,612) — — (188,612) —
Funds held in trust for others (747,109) — — (747,109) —
TOTAL LIABILITIES AT FAIR VALUE $ (935,721) — — (935,721) —
(1) Certain investments in joint ventures carried under the equity method of accounting are not reported at fair value and thus not included in the table above (note 6).(2) Primarily invested in The Coca-Cola Company.(3) Certain investments that are measured at fair value using the NAV per share (or its equivalent) practical expedient have not been categorized in the fair value hierarchy.
The fair value amounts presented in this table are intended to permit reconciliation of the fair value hierarchy to the amounts presented in the consolidated statements of financial position.
NOTES TO CONSOLIDATED FINANCIAL STATEMENTSAUGUST 31, 2018 AND 2017
EMORY UNIVERSITY FINANCIALS 2018 23
Investments made directly by the University whose values are based on quoted market prices in active markets, and are therefore classified within Level 1, include actively traded common and preferred stock,U.S. government fixed-income instruments, and non-U.S. govern-ment fixed-income instruments. Level 1 investments may also include commingled funds, such as listed mutual funds, futures contracts, and exchange traded funds. Investments that trade in markets that are considered to be active but are based on dealer quotations or alternative pricing sources supported by observable inputs or investments that trade in markets that are not considered to be active, but are valued based on quo-ted market prices, dealer quotations, or alternative pricing sources supported by observable inputs, are classified within Level 2. Alter-native pricing sources include quotations from market participants and pricing models, which are based on accepted industry modeling techniques. These investments include U.S. investment grade and below investment grade debt securities, international corporate bonds, mortgage-backed securities, asset-backed securities, money market funds, senior loans and bank loans, most derivative contracts other than futures, and commingled structures with quoted market prices.
Investments that do not trade in active markets and for which values are instead derived from significant unobservable inputs are classified within Level 3. When observable prices are not available, these invest-ments are valued using one or more valuation techniques described below.
• Market approach: This approach uses prices and other relevant information generated by market transactions involving identical or comparable assets or liabilities.
• Income approach: This approach determines a valuation by dis-counting future cash flows.
• Cost approach: This approach is based on the principle of substitution and the concept that a market participant would not pay more than the amount that would currently be required to replace the asset.
NOTES TO CONSOLIDATED FINANCIAL STATEMENTSAUGUST 31, 2018 AND 2017

24 EMORY UNIVERSITY FINANCIALS 2018
The following tables summarize the University’s Level 3 reconciliation for the years ended August 31, 2018 and 2017 (in thousands): Balance as of
August 31, 2017Net gains
(losses) Purchases SalesTransfer in (out)
of Level 3Balance as of
August 31, 2018
Investments in U.S. equity securities $ 28 (5) 42 (56) — 9
Non-U.S. equity securities — — — — 697 697
Domestic bonds and long-term notes 1,122 (8) — (388) — 726
Investments in private securities 16,287 (497) — (233) — 15,557
Investment in funds:
Private market investments 717 (345) 85 — 4,618 5,075
Natural resources — — — — 4,504 4,504
Oil and gas properties 680 475 — — — 1,155
Total investments 18,834 (380) 127 (677) 9,819 27,723
Interest in perpetual funds held by others 1,244,906 66,500 — — — 1,311,406
TOTAL ASSETS $ 1,263,740 66,120 127 (677) 9,819 1,339,129
Balance as of August 31, 2016
Net gains (losses) Purchases Sales
Transfer in (out) of Level 3
Balance as of August 31, 2017
Investments in U.S. equity securities $ 3 (46) 72 (1) — 28
Non-U.S. equity securities 507 113 — (620) — —
Domestic bonds and long-term notes 1,112 17 — (7) — 1,122
Investments in private securities 14,765 18,574 — (17,052) — 16,287
Investment in funds:
Private market investments 658 15 31 (92) 105 717
Oil and gas properties 680 — — — — 680
Total investments 17,725 18,673 103 (17,772) 105 18,834
Interest in perpetual funds held by others 1,170,348 74,558 — — — 1,244,906
TOTAL ASSETS $ 1,188,073 93,231 103 (17,772) 105 1,263,740
(10) Property and EquipmentProperty and equipment at August 31 are summarized as follows (in thousands):
2018 2017
Land and land improvements $ 201,887 $ 201,696
Buildings and improvements 3,668,327 3,376,910
Equipment 2,435,931 2,308,381
Library and museum assets 438,429 414,132
Construction in progress 142,101 214,071
6,886,675 6,515,190
Less accumulated depreciation (3,667,670) (3,412,342)
$ 3,219,005 $ 3,102,848
Property and equipment is reviewed for recoverability whenever events or changes in circumstances indicate that the carrying amount may not be recoverable. An impairment loss shall be recognized only if the carrying amount of a long-lived asset is not recoverable and exceeds its fair value. The carrying amount of a long- lived asset is not recoverable if it exceeds the sum of the undiscounted cash flows expected to result from the use and eventual disposition of the asset. There were no asset impairments for fiscal year 2018 or 2017. The University has identified asset retirement obligations primar-
ily from commitments to remove asbestos and lead paint in university facilities at the time of major renovation or demolition. The liability was estimated using an inflation rate of 5.00% and discount rate of 4.74%. The liability for asset retirement obligations at August 31, 2018 and 2017 is $66.0 million and $63.0 million, respectively.
NOTES TO CONSOLIDATED FINANCIAL STATEMENTSAUGUST 31, 2018 AND 2017
EMORY UNIVERSITY FINANCIALS 2018 25
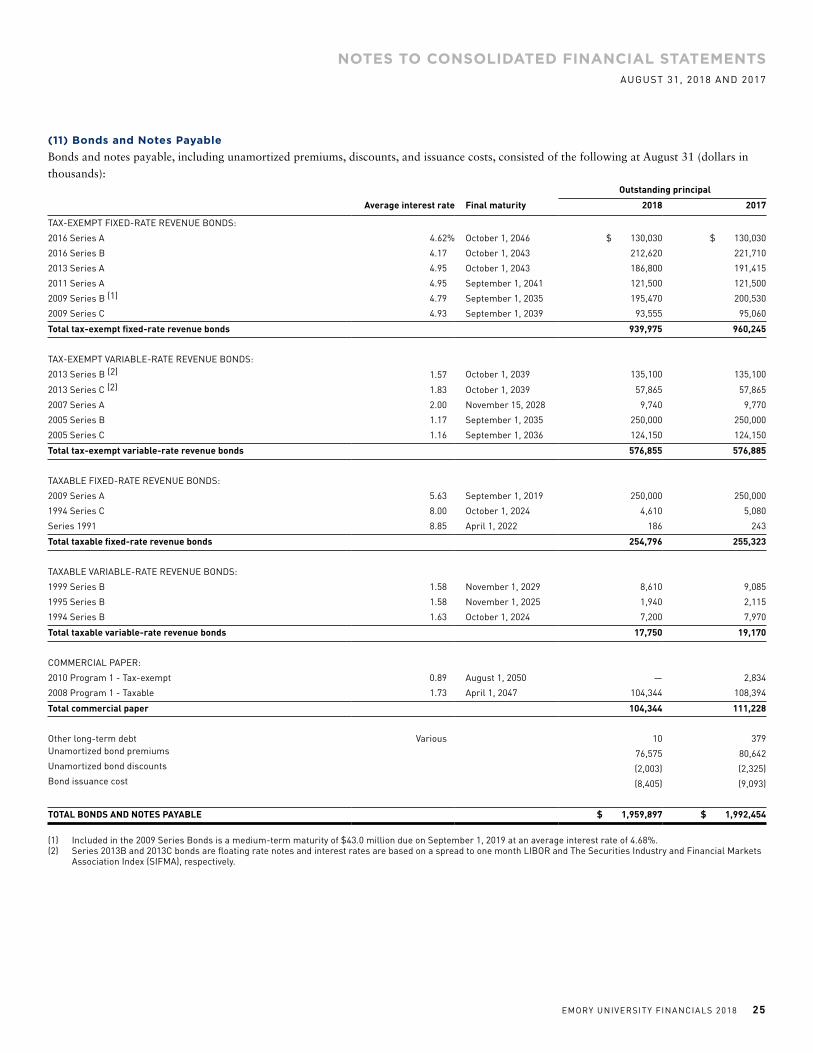
(11) Bonds and Notes PayableBonds and notes payable, including unamortized premiums, discounts, and issuance costs, consisted of the following at August 31 (dollars in thousands):
Outstanding principal
Average interest rate Final maturity 2018 2017
TAX-EXEMPT FIXED-RATE REVENUE BONDS:
2016 Series A 4.62% October 1, 2046 $ 130,030 $ 130,030
2016 Series B 4.17 October 1, 2043 212,620 221,710
2013 Series A 4.95 October 1, 2043 186,800 191,415
2011 Series A 4.95 September 1, 2041 121,500 121,500
2009 Series B (1) 4.79 September 1, 2035 195,470 200,530
2009 Series C 4.93 September 1, 2039 93,555 95,060
Total tax-exempt fixed-rate revenue bonds 939,975 960,245
TAX-EXEMPT VARIABLE-RATE REVENUE BONDS:
2013 Series B (2) 1.57 October 1, 2039 135,100 135,100
2013 Series C (2) 1.83 October 1, 2039 57,865 57,865
2007 Series A 2.00 November 15, 2028 9,740 9,770
2005 Series B 1.17 September 1, 2035 250,000 250,000
2005 Series C 1.16 September 1, 2036 124,150 124,150
Total tax-exempt variable-rate revenue bonds 576,855 576,885
TAXABLE FIXED-RATE REVENUE BONDS:
2009 Series A 5.63 September 1, 2019 250,000 250,000
1994 Series C 8.00 October 1, 2024 4,610 5,080
Series 1991 8.85 April 1, 2022 186 243
Total taxable fixed-rate revenue bonds 254,796 255,323
TAXABLE VARIABLE-RATE REVENUE BONDS:
1999 Series B 1.58 November 1, 2029 8,610 9,085
1995 Series B 1.58 November 1, 2025 1,940 2,115
1994 Series B 1.63 October 1, 2024 7,200 7,970
Total taxable variable-rate revenue bonds 17,750 19,170
COMMERCIAL PAPER:
2010 Program 1 - Tax-exempt 0.89 August 1, 2050 — 2,834
2008 Program 1 - Taxable 1.73 April 1, 2047 104,344 108,394
Total commercial paper 104,344 111,228
Other long-term debt Various 10 379 Unamortized bond premiums 76,575 80,642Unamortized bond discounts (2,003) (2,325)Bond issuance cost (8,405) (9,093)
TOTAL BONDS AND NOTES PAYABLE $ 1,959,897 $ 1,992,454
(1) Included in the 2009 Series Bonds is a medium-term maturity of $43.0 million due on September 1, 2019 at an average interest rate of 4.68%.(2) Series 2013B and 2013C bonds are floating rate notes and interest rates are based on a spread to one month LIBOR and The Securities Industry and Financial Markets
Association Index (SIFMA), respectively.
NOTES TO CONSOLIDATED FINANCIAL STATEMENTSAUGUST 31, 2018 AND 2017
26 EMORY UNIVERSITY FINANCIALS 2018
The University incurred interest expense of $77.1 million and $81.5 million in 2018 and 2017, respectively, net of capitalized interest of $4.1 million and $0.8 million in 2018 and 2017, respectively. During 2018 and 2017, the average interest rate on University tax-exempt and taxable variable rate demand bonds was 1.16% and 1.58%,
respectively. Related indices for this period were 1.21% for tax-
exempt debt (SIFMA) and 1.69% for taxable debt (LIBOR). During 2017, the University refunded its 2008C and 2005A Se-
ries Bonds totaling $147.2 million with proceeds from the University’s issuance of 2016B Series Bonds. The University incurred an account-
ing loss of $8.7 million on the refunding of the extinguishment of the 2008C and 2005A Series Bonds, which is included in the nonoper-
ating activities in the accompanying 2017 consolidated statement of activities. At August 31, 2018, the aggregate annual maturities of bonds and notes payable for the next five years and thereafter are as follows (in thousands):
PAYABLE IN FISCAL YEAR:
2019 21,873
2020 302,418
2021 18,614
2022 13,461
2023 13,365
Thereafter 1,523,999
1,893,730
Unamortized net premium 74,572
Unamortized net bond issuance cost (8,405)
$ 1,959,897
In 2010, the University established a $400.0 million tax-exempt Commercial Paper program. The primary purpose of the program is to meet interim financing needs related to capital projects. As of
August 31, 2018 or 2017, the University had no outstanding balances under this program. The University has a standby credit facility to enable the Uni-
versity to purchase tendered variable rate debt in the event of a failed remarketing. Currently, it has one diversified facility totaling $150.0 million that is committed for this sole purpose and cannot be used for operating needs of the University. There were no draws against this line of credit in 2018 or 2017. Emory University’s healthcare system, Emory Healthcare, entered into an affiliation agreement with one of its payors effective June 11, 2018. This affiliation agreement includes, among other provisions, a $100.0 million line of credit to Emory University, which can be uti-
lized for any purpose that advances the charitable mission of Emory Healthcare. There is no outstanding balance on this line of credit as
of August 31, 2018. Emory University has an additional $75.0 million line of credit unrelated to this Emory Healthcare affiliation agreement for which
there is also no outstanding balance as of August 31, 2018. The University has two letters of credit with a commercial bank totaling $1.4 million. There were no outstanding balances as of Au-
gust 31, 2018 or 2017. The terms of the University’s long-term debt provide for certain financial and nonfinancial covenants, including provisions as to the use of the proceeds, limits as to arbitrage and bond issuance costs, and various other administrative requirements.
(12) Temporarily and Permanently Restricted Net AssetsTemporarily restricted net assets consist of the following as of August 31 (in thousands):
2018 2017
Appreciation on endowments restricted until appropriated $ 2,640,672 $ 2,517,580
Term endowments 124,910 124,910
Contributions receivable, time and purpose restricted 372,500 48,447
Restricted for capital projects and other donor purposes 70,013 24,518
Annuity and life income agreements 8,576 7,141
$ 3,216,671 $ 2,722,596
Permanently restricted net assets include endowment funds subject to UPMIFA (note 7) as well as perpetual trusts and endowments held by others. Permanently restricted net assets consist of the following as of August 31 (in thousands):
2018 2017
Donor-restricted endowments $ 923,950 $ 881,625
Interests in perpetual funds held by others 1,271,786 1,244,906
Contributions receivable, restricted for endowment 23,627 31,961
Annuity and life income agreements 2,071 2,081
Split-interest trusts 3,245 3,268
$ 2,224,679 $ 2,163,841
Generally, the donors of these restricted gifts permit the Univer-
sity to use all or part of the income earned and net appreciation on related investments for general or specific purposes, such as schol-
arships, faculty salaries, or other operational and administrative support.
(13) Retirement and Deferred Compensation PlansThe University has a defined-contribution plan under Internal Reve-
nue Code (IRC) Section 403(b) covering certain employees and teach-
ing staff. The University contributes an amount equal to 6% of each eligible employee’s compensation to the plan as well as a supplemental contribution of 3% based on a 1.5 to 1 match of employee contri-
butions of up to 2% of compensation. Emory Healthcare sponsors a retirement plan, covering most full time employees, under which annuities are purchased with contributions by Emory Healthcare
NOTES TO CONSOLIDATED FINANCIAL STATEMENTSAUGUST 31, 2018 AND 2017
EMORY UNIVERSITY FINANCIALS 2018 27
and its employees. The benefits are vested only to the extent of the annuities purchased. TEC sponsors The Emory Clinic, Inc. Retirement Savings Plan (the Plan), covering all its employees, except those con-
sidered leased employees or those covered under collective bargaining agreements, as defined. The Plan provides for employees to make salary reduction contributions and for TEC to make discretionary contributions for employees who have attained the age of 21 and are employees at the date the contribution is made. The Plan provides for contributions at an annual determined percentage of compensation and employees cliff vest in employer contributions after three years of service. Retirement expense totaled $142.7 million and $131.6 mil-
lion during 2018 and 2017, respectively, and is included in operating expense in the accompanying consolidated statements of activities. The University sponsors an IRC Section 457(b) Deferred Com-
pensation Plan primarily for the purpose of providing deferred com-
pensation for a select group of management or highly compensated employees who are eligible for participation and elect to make salary deferrals under the Deferred Compensation Plan. These assets are fully vested and available to the participating employees at the point of termination of employment from the University. As of August 31, 2018 and 2017, respectively, the University held other assets
of $134.7 million and $115.7 million under the plan. These
assets are included in other assets, which are designated by the University to pay future salary deferral plan payments. The assets are held in separate investment funds for which the majority are classified as Level 1 in the fair value hierarchy. Associated liabilities for the ob-
ligations of $134.7 million and $115.7 million as of August 31, 2018 and 2017, respectively, are included in accrued liabilities for benefit obligations and professional liabilities and considered Level 2 in the fair value hierarchy.
(14) Pension Plans—Emory HealthcareEmory Healthcare sponsors a defined-benefit pension plan (the Plan). The Plan was curtailed effective December 31, 2011. The terms of the curtailment generally provide that no further benefit accrual under the Plan is provided for service after the effective date nor will new entrants into the Plan be permitted after the effective date. The Joint Operating Company (JOC) assumed certain de-
fined-benefit pension liabilities covering certain employees of the en-
tities contributed to the JOC by SJHS (SJHS Pension Plan). The Plan was curtailed, effective December 31, 2011, and the JOC has agreed to provide for funding of the plan, generally over 10 years, beginning in fiscal year 2015, subject to certain terms and conditions.
The changes in the projected benefit obligations as of August 31 follow (in thousands):2018 2017
Emory Healthcare SJHS Pension Plan Emory Healthcare SJHS Pension Plan
Projected benefit obligation, beginning of year $ 326,875 154,690 $ 324,577 160,393
Interest cost 11,614 6,180 10,605 6,042
Actuarial gains (10,651) (6,178) (1,131) (6,498)
Benefits paid (7,804) (5,574) (7,176) (5,247)
PROJECTED BENEFIT OBLIGATION, END OF YEAR $ 320,034 149,118 $ 326,875 154,690
Given the curtailment of the plans, the accumulated benefit obligations at August 31, 2018 and 2017 are the same as the projected benefit obligations.
The changes in the fair value of plan assets, funded status of the plans, and the status of amounts recognized in the accompanying consolidated statements of financial position as of August 31 follow (in thousands):
2018 2017
Emory Healthcare SJHS Pension Plan Emory Healthcare SJHS Pension Plan
Fair value of plan assets, beginning of year $ 235,118 110,316 $ 213,181 99,096
Actual return on plan assets 12,969 9,406 19,666 10,197
Employer contributions 11,089 7,240 9,447 6,270
Benefits paid (7,804) (5,574) (7,176) (5,247)
Fair value of plan assets, end of year 251,372 121,388 235,118 110,316
FUNDED STATUS—accrued pension cost recognized in the consolidated statements of financial position $ (68,662) (27,730) $ (91,757) (44,374)
NOTES TO CONSOLIDATED FINANCIAL STATEMENTSAUGUST 31, 2018 AND 2017
28 EMORY UNIVERSITY FINANCIALS 2018
The components of net periodic pension cost for the years ended August 31 follow (in thousands):2018 2017
Emory Healthcare SJHS Pension Plan Emory Healthcare SJHS Pension Plan
Interest cost $ 11,614 6,180 $ 10,605 6,042
Expected return on plan assets (18,827) (7,777) (17,156) (6,971)
Amortization of prior service cost 3,552 (438) 3,061 (438)
Recognized actuarial loss 2,295 1,866 2,576 2,196
NET PERIODIC PENSION COST $ (1,366) (169) $ (914) 829
Net periodic costs are recognized as employees render the services necessary to earn the pension and postretirement benefits.
Weighted average assumptions used to determine benefit obligations in the accompanying consolidated statements of financial position for 2018 and 2017 follow:
2018 2017
Emory Healthcare SJHS Pension Plan Emory Healthcare SJHS Pension Plan
Discount rate 4.31% 4.28% 4.07% 4.07%
Expected long-term rate of return on plan assets 8.00 6.75 8.00 7.00
Weighted average assumptions used to determine net periodic pension cost for 2018 and 2017 follow:2018 2017
Emory Healthcare SJHS Pension Plan Emory Healthcare SJHS Pension Plan
Discount rate 4.07% 4.07% 3.83% 3.83%
Expected return on plan assets 8.00 7.00 8.00 7.00
Emory Healthcare Plan AssetsThe Plan’s investment objectives are to protect long-term asset value by applying prudent, low-risk, high-quality investment disciplines and to enhance the values by maximizing investment returns through active security management within the framework of the Plan’s invest-
ment policy. Asset allocation strategies and investment management structure are designed to meet the Plan’s investment objectives. The Plan’s expected long-term rate of return on assets is de-
termined by reviewing the historical return of each asset category comprising the Plan’s target asset allocation.
NOTES TO CONSOLIDATED FINANCIAL STATEMENTSAUGUST 31, 2018 AND 2017
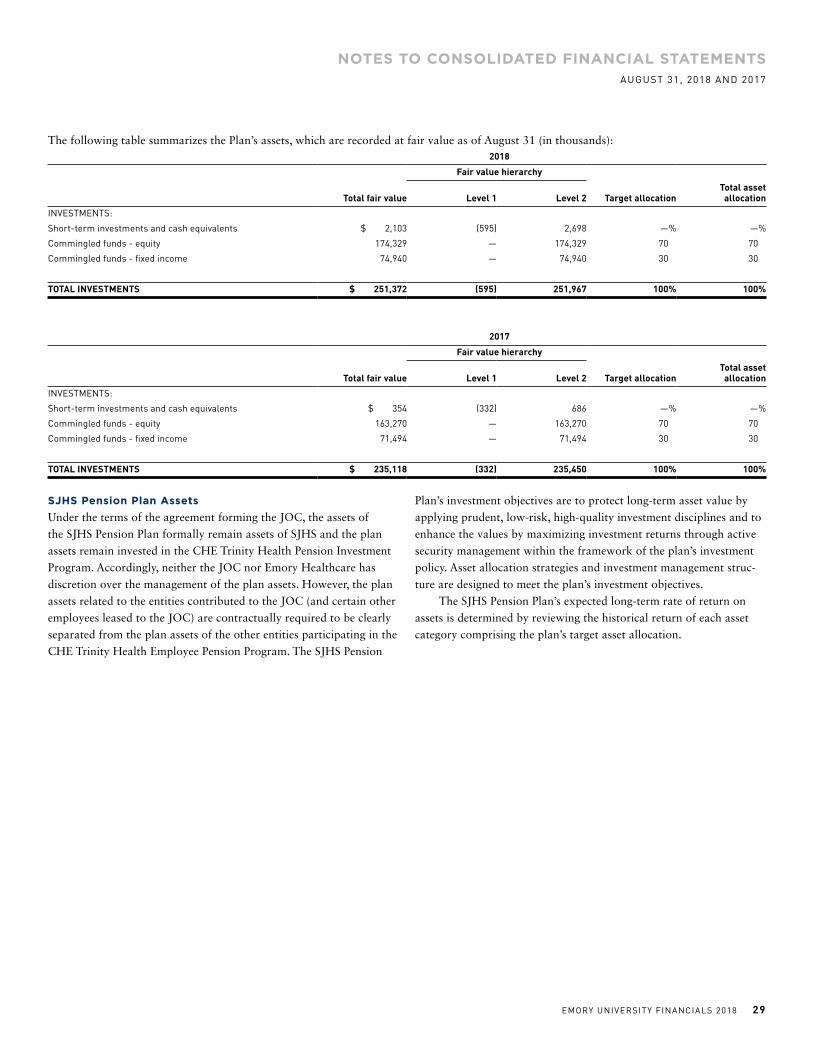
EMORY UNIVERSITY FINANCIALS 2018 29
The following table summarizes the Plan’s assets, which are recorded at fair value as of August 31 (in thousands): 2018
Fair value hierarchy
Total fair value Level 1 Level 2 Target allocationTotal asset allocation
INVESTMENTS:
Short-term investments and cash equivalents $ 2,103 (595) 2,698 —% —%
Commingled funds - equity 174,329 — 174,329 70 70
Commingled funds - fixed income 74,940 — 74,940 30 30
TOTAL INVESTMENTS $ 251,372 (595) 251,967 100% 100%
2017
Fair value hierarchy
Total fair value Level 1 Level 2 Target allocationTotal asset allocation
INVESTMENTS:
Short-term investments and cash equivalents $ 354 (332) 686 —% —%
Commingled funds - equity 163,270 — 163,270 70 70
Commingled funds - fixed income 71,494 — 71,494 30 30
TOTAL INVESTMENTS $ 235,118 (332) 235,450 100% 100%
SJHS Pension Plan AssetsUnder the terms of the agreement forming the JOC, the assets of the SJHS Pension Plan formally remain assets of SJHS and the plan assets remain invested in the CHE Trinity Health Pension Investment Program. Accordingly, neither the JOC nor Emory Healthcare has discretion over the management of the plan assets. However, the plan assets related to the entities contributed to the JOC (and certain other employees leased to the JOC) are contractually required to be clearly separated from the plan assets of the other entities participating in the CHE Trinity Health Employee Pension Program. The SJHS Pension
Plan’s investment objectives are to protect long-term asset value by applying prudent, low-risk, high-quality investment disciplines and to enhance the values by maximizing investment returns through active security management within the framework of the plan’s investment policy. Asset allocation strategies and investment management struc-
ture are designed to meet the plan’s investment objectives. The SJHS Pension Plan’s expected long-term rate of return on assets is determined by reviewing the historical return of each asset category comprising the plan’s target asset allocation.
NOTES TO CONSOLIDATED FINANCIAL STATEMENTSAUGUST 31, 2018 AND 2017
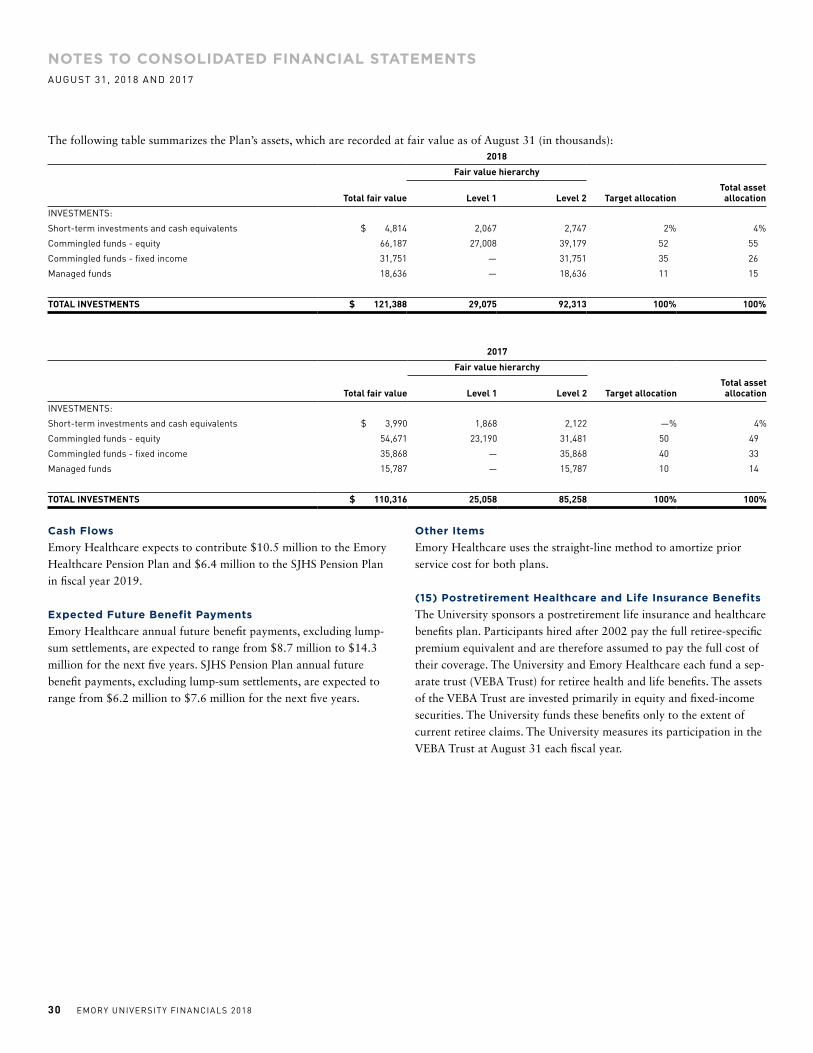
30 EMORY UNIVERSITY FINANCIALS 2018
The following table summarizes the Plan’s assets, which are recorded at fair value as of August 31 (in thousands): 2018
Fair value hierarchy
Total fair value Level 1 Level 2 Target allocationTotal asset allocation
INVESTMENTS:
Short-term investments and cash equivalents $ 4,814 2,067 2,747 2% 4%
Commingled funds - equity 66,187 27,008 39,179 52 55
Commingled funds - fixed income 31,751 — 31,751 35 26
Managed funds 18,636 — 18,636 11 15
TOTAL INVESTMENTS $ 121,388 29,075 92,313 100% 100%
2017
Fair value hierarchy
Total fair value Level 1 Level 2 Target allocationTotal asset allocation
INVESTMENTS:
Short-term investments and cash equivalents $ 3,990 1,868 2,122 —% 4%
Commingled funds - equity 54,671 23,190 31,481 50 49
Commingled funds - fixed income 35,868 — 35,868 40 33
Managed funds 15,787 — 15,787 10 14
TOTAL INVESTMENTS $ 110,316 25,058 85,258 100% 100%
Cash FlowsEmory Healthcare expects to contribute $10.5 million to the Emory Healthcare Pension Plan and $6.4 million to the SJHS Pension Plan
in fiscal year 2019.
Expected Future Benefit PaymentsEmory Healthcare annual future benefit payments, excluding lump-sum settlements, are expected to range from $8.7 million to $14.3 million for the next five years. SJHS Pension Plan annual future benefit payments, excluding lump-sum settlements, are expected to range from $6.2 million to $7.6 million for the next five years.
Other ItemsEmory Healthcare uses the straight-line method to amortize prior service cost for both plans.
(15) Postretirement Healthcare and Life Insurance BenefitsThe University sponsors a postretirement life insurance and healthcare benefits plan. Participants hired after 2002 pay the full retiree-specific premium equivalent and are therefore assumed to pay the full cost of their coverage. The University and Emory Healthcare each fund a sep-
arate trust (VEBA Trust) for retiree health and life benefits. The assets of the VEBA Trust are invested primarily in equity and fixed-income securities. The University funds these benefits only to the extent of current retiree claims. The University measures its participation in the VEBA Trust at August 31 each fiscal year.
NOTES TO CONSOLIDATED FINANCIAL STATEMENTSAUGUST 31, 2018 AND 2017

EMORY UNIVERSITY FINANCIALS 2018 31
The changes in the accumulated postretirement benefit obligation (APBO) as of August 31 are as follows (in thousands):2018 2017
Emory University Emory Healthcare Total Total
APBO, beginning of year $ 102,631 58,601 161,232 161,116
Service cost 1,680 713 2,393 2,308
Interest cost 3,634 2,039 5,673 5,181
Actuarial gains (2,201) (1,121) (3,322) (2,602)
Benefits paid (3,072) (2,256) (5,328) (4,771)
APBO, END OF YEAR $ 102,672 57,976 160,648 161,232
The changes in the fair value of plan assets, funded status of the plan, and the status of the accrued postretirement benefit obligation recognized in the accompanying consolidated statements of financial position as of August 31 are as follows (in thousands):
2018 2017
Emory University Emory Healthcare Total Total
Fair value of plan assets, beginning of year $ 68,209 20,452 88,661 80,416
Actual return on plan assets 5,234 1,401 6,635 9,623
Benefits paid by Emory — (2,256) (2,256) (1,378)
Fair value of plan assets, end of year 73,443 19,597 93,040 88,661
FUNDED STATUS - accrued postretirement benefit cost recognized in the consolidated statements of financial position $ (29,229) (38,379) (67,608) (72,571)
Actuarial assumptions used to determine the values of the APBO and the benefit costs for years ended August 31, 2018 and 2017 included a dis-
count rate of 4.31% and 4.11%, respectively. Since the plan was amended on April 11, 2002 to limit the University’s liability for future medical care cost increases to 4.00%, the per capita cost increase of healthcare benefits is capped at 4.00%. The estimated long-term rate of return on plan assets was 8.00% for the University and Emory Healthcare for both years ended August 31, 2018 and 2017.The components of net periodic postretirement benefit cost for years ended August 31 were as follows (in thousands):
2018 2017
Emory University Emory Healthcare Total Total
Service cost of benefits earned $ 1,680 713 2,393 2,308
Interest cost on APBO 3,634 2,039 5,673 5,181
Expected return on plan assets (5,334) (1,559) (6,893) (6,218)
Recognized net actuarial loss 2,216 2,350 4,566 6,126
NET PERIODIC POSTRETIREMENT BENEFIT COST $ 2,196 3,543 5,739 7,397
The amounts accumulated in unrestricted net assets follow (in thousands):2018 2017
Emory University Emory Healthcare Total Total
Net unrecognized actuarial loss $ 39,610 20,749 60,359 68,254
Prior service cost (146) 120 (26) 46
TOTAL $ 39,464 20,869 60,333 68,300
In fiscal year 2019, net unrecognized actuarial losses of $2.0 million for Emory University and $1.9 million for Emory Healthcare are expected to be amortized from unrestricted net assets into net periodic postretirement benefit cost.
Plan AssetsThe investment committee of the Emory University board of trustees approves the investment guidelines and asset allocation targets for the
pension benefits and postretirement benefits plans. The primary objec-
tive of the investments is to ensure the solvency of the plans over time to meet plan obligations. The secondary objective is to meet or exceed the plans’ actuarial assumed rate of return over time without taking excess risk. The funds are diversified by asset class in accordance with established allocation targets and rebalanced as needed. Specific investments are apportioned to a combination of institutional pooled funds and mutual funds.
NOTES TO CONSOLIDATED FINANCIAL STATEMENTSAUGUST 31, 2018 AND 2017

32 EMORY UNIVERSITY FINANCIALS 2018
The following table summarizes the University’s VEBA Trust assets as of August 31 (in thousands): 2018
Fair value hierarchy
Total fair value NAV Level 1 Level 2 Target allocationTotal asset allocation
INVESTMENTS:
Commingled funds - equity $ 55,891 14,807 13,702 27,382 75% 76%
Commingled funds - fixed income 17,552 — 8,893 8,659 25 24
TOTAL INVESTMENTS $ 73,443 14,807 22,595 36,041 100% 100%
2017
Fair value hierarchy
Total fair value NAV Level 1 Level 2 Target allocationTotal asset allocation
INVESTMENTS:
Commingled funds - equity $ 52,714 15,026 13,656 24,032 75% 77%
Commingled funds - fixed income 15,495 — 8,968 6,527 25 23
TOTAL INVESTMENTS $ 68,209 15,026 22,624 30,559 100% 100%
The following table summarizes Emory Healthcare’s VEBA Trust assets as of August 31 (in thousands): 2018
Fair value hierarchy
Total fair value NAV Level 1 Level 2 Target allocationTotal asset allocation
INVESTMENTS:
Commingled funds - equity $ 14,597 — 4,837 9,760 75% 74%
Commingled funds - fixed income 5,021 — 3,045 1,976 25 26
Short term investment and cash equivalents (21) — (21) — — —
TOTAL INVESTMENTS $ 19,597 — 7,861 11,736 100% 100%
2017
Fair value hierarchy
Total fair value NAV Level 1 Level 2 Target allocationTotal asset allocation
INVESTMENTS:
Commingled funds - equity $ 15,377 — 4,563 10,814 75% 75%
Commingled funds - fixed income 5,075 — 3,067 2,008 25 25
TOTAL INVESTMENTS $ 20,452 — 7,630 12,822 100% 100%
Cash FlowsEmory Healthcare does not expect to contribute to the postretirement benefit plan during fiscal year 2019.
Expected Future Benefit PaymentsAnnual future benefit payments are expected to range from $3.5
million to $4.7 million for Emory University and from $2.0 million
to $2.8 million for Emory Healthcare for the next five years.
(16) Charity Care and Community BenefitsEmory Healthcare provides care to patients who meet certain crite-
ria under their charity care policies without charge or at amounts less than their established rates. Because such operating compa-
nies do not pursue collection of amounts determined to qualify as charity care, such amounts are not included in net patient service revenue. Emory Healthcare applies the measurement and disclosure provisions of FASB ASU No. 2010-23, Health Care Entities (Topic
954): Measuring Charity Care for Disclosure. ASU No. 2010-23
NOTES TO CONSOLIDATED FINANCIAL STATEMENTSAUGUST 31, 2018 AND 2017

EMORY UNIVERSITY FINANCIALS 2018 33
amends ASC Subtopic 954-605, Health Care Entities – Revenue
Recognition, and requires that cost be used as the measurement basis for charity care disclosure purposes. Records are maintained to identify and monitor the level of charity care provided. These records include the amount of charges foregone and actual costs for services furnished under its charity and indigent care policies. The cost of charity care provided totaled approximately $99.7 million and $74.7 million for the years ended August 31, 2018 and 2017, respectively. Emory Healthcare estimat-
ed these costs by applying a ratio of cost to gross charges to the gross uncompensated charges associated with providing care to the charity patients.
(17) Functional ExpensesThe Consolidated Statements of Activities include the following func-
tional expenses for the years ended August 31 (in thousands):2018 2017
Instruction $ 458,270 $ 454,276
Research 516,489 490,306
Public service 120,233 102,796
Academic support 174,975 162,308
Student services 102,684 95,017
Institutional support 205,043 199,057
Scholarships and fellowships 23,949 17,668
Medical services 306,932 263,842
Healthcare services 3,398,654 3,145,643
Auxiliary enterprises 46,533 46,554
Independent operations 22,652 22,062
TOTAL OPERATING EXPENSES $ 5,376,414 $ 4,999,529
Costs related to the University’s operation and maintenance of prop-
erty, including depreciation of property and equipment and interest on related debt, are allocated to program and supporting activities based upon information reported in the space study and debt financing re-
cords. Total amounts allocated in 2018 and 2017 were $188.7 million and $192.0 million, respectively. Fundraising costs were approximate-
ly $38.9 million and $34.1 million in 2018 and 2017, respectively.
(18) Medical Professional and General Liability Insurance CoverageCCIC, Emory Healthcare’s wholly owned offshore captive insurer, provides claims-made primary medical professional and general lia-
bility coverage for the University, the Hospitals, Emory Clinic, Emory Specialty Associates, and Wesley Woods Center. As of August 31, 2018 and 2017, the University has recorded an accrual for estimated losses associated with all retained CCIC risks of approximately $144.6 million (discounted at 2%) and $121.5 million (discounted at 2%), respectively. Emory has purchased layered excess and umbrella insurance and reinsurance coverage beyond the amounts retained by CCIC, through
various carriers, for a total of $129.0 million per claim and in the aggregate. The estimated liability for professional and general liability claims will be significantly affected if current and future claims differ from historical trends. While the University monitors reported claims closely and considers potential outcomes as estimated by its actuar-
ies when determining its professional and general liability accruals, the complexity of the claims, the extended period of time to settle the claims, and the wide range of potential outcomes complicate the estimation. The University’s management believes adequate provision has been made for the related risk.
(19) Related-Party TransactionsThe Carter Center, Inc. (CCI) is a nonprofit organization founded by former U.S. President Jimmy Carter and Rosalynn Carter, which sponsors various domestic and international programs. The board of trustees of CCI comprises 16 to 28 members, including its founders, and others as elected half by the University, including the University’s president, and half by the Carter Center class trustees. The Univer-
sity’s board of trustees has the authority to approve amendments to CCI’s articles of incorporation and bylaws. Funds held in trust for others include $758.2 million and $708.4 million representing CCI’s investment in the University’s long-term investment portfolio of August 31, 2018 and 2017, respectively.
(20) Commitments and ContingenciesThe University is in the process of constructing, renovating, and equipping certain facilities for which the outstanding commitments
at August 31, 2018 totaled $68.2 million. Expenditures and indirect costs related to federal and state grants and contracts are subject to adjustment based upon review by the granting agencies. The amounts, if any, of expenditures, which may be disallowed by the granting agencies cannot be determined at this time, although management expects they will not have a material effect on the University’s consolidated financial statements. Lawsuits and claims have been filed against the University in the ordinary course of business. As one of the nation’s largest research universities and academic medical centers, the University has active litigation that takes several forms. The University’s policy is to accrue for litigation and claims when such amounts are probable and can be reasonably estimated based on consultation with external legal counsel and Emory General Counsel review. In addition, the University is sub-
ject to many federal and state regulations, and as a result, there may be one or more pending government investigations ongoing at any time. While the outcome of many of these actions is not presently determin-
able, it is the opinion of management that any resulting liability from these actions will not have a material adverse effect on the consol-
idated financial position or operating results of the University. The University also has a comprehensive program of primary and excess insurance. Management of the University believes any current pending
NOTES TO CONSOLIDATED FINANCIAL STATEMENTSAUGUST 31, 2018 AND 2017

34 EMORY UNIVERSITY FINANCIALS 2018
lawsuit subjecting the University to liability would not have a material-
ly adverse effect on the University’s consolidated financial position.
(21) Subsequent EventsEmory has evaluated subsequent events after the consolidated statement of financial position date of August 31, 2018 through January 30, 2019, the date the consolidated financial statements were available to be issued and noted that there are no other items to disclose except as follow: On September 1, 2018, Emory Healthcare entered into a Defin-
itive Agreement with DeKalb Regional Health System (DRHS) and became the sole and controlling member of DRHS upon acquisition of DRHS’s assets and liabilities with the goal of DRHS being integrat-
ed operationally, financially, and clinically into Emory Healthcare. DRHS operates a 451-bed general acute care hospital with a free-
standing surgery center in Decatur, Georgia; a 100-bed general acute care hospital in Hillandale, Georgia; a 76-bed long-term acute care hospital in Decatur, Georgia; and a physician network of primary care, occupational, and specialty physician practices. The terms of Definitive Agreement addressed, among other matters, the positioning of currently outstanding DRHS indebtedness, commitments of future
capital funding, and amendments to the current long-term and trans-
fer agreement between DRHS and the Hospital Authority of DeKalb County, Georgia. Effective September 1, 2018, Emory University and Children’s Healthcare of Atlanta, Inc. (Children’s), a Georgia nonprofit corpora-
tion, have entered into a Master Affiliation Agreement (the affiliation agreement) to establish the Emory and Children’s Pediatric Institute (the Institute). The affiliation agreement restructures previous arrange-
ments between the parties for pediatric teaching, research, and related clinical services. Under the terms of the affiliation, approximately 350 Emory University School of Medicine Department of Pediatrics fac-
ulty physicians and PhD researchers have transferred to the Institute and became employees thereof. The ownership of the Institute will be 50% Emory University and 50% Children’s with equal representation on the governing board. On September 13, 2018, Emory issued $164.4 million of its tax-exempt Commercial Paper program to defease DRHS’s outstand-
ing debt, DeKalb County Hospital Authority Revenue Anticipation Certificates (DeKalb Medical Center Inc. Project), Series 2010 issued in the original aggregate principal amount of $183.1 million.
NOTES TO CONSOLIDATED FINANCIAL STATEMENTSAUGUST 31, 2018 AND 2017

EMORY UNIVERSITY FINANCIALS 2018 35
SUPPLEMENTARY INFORMATION
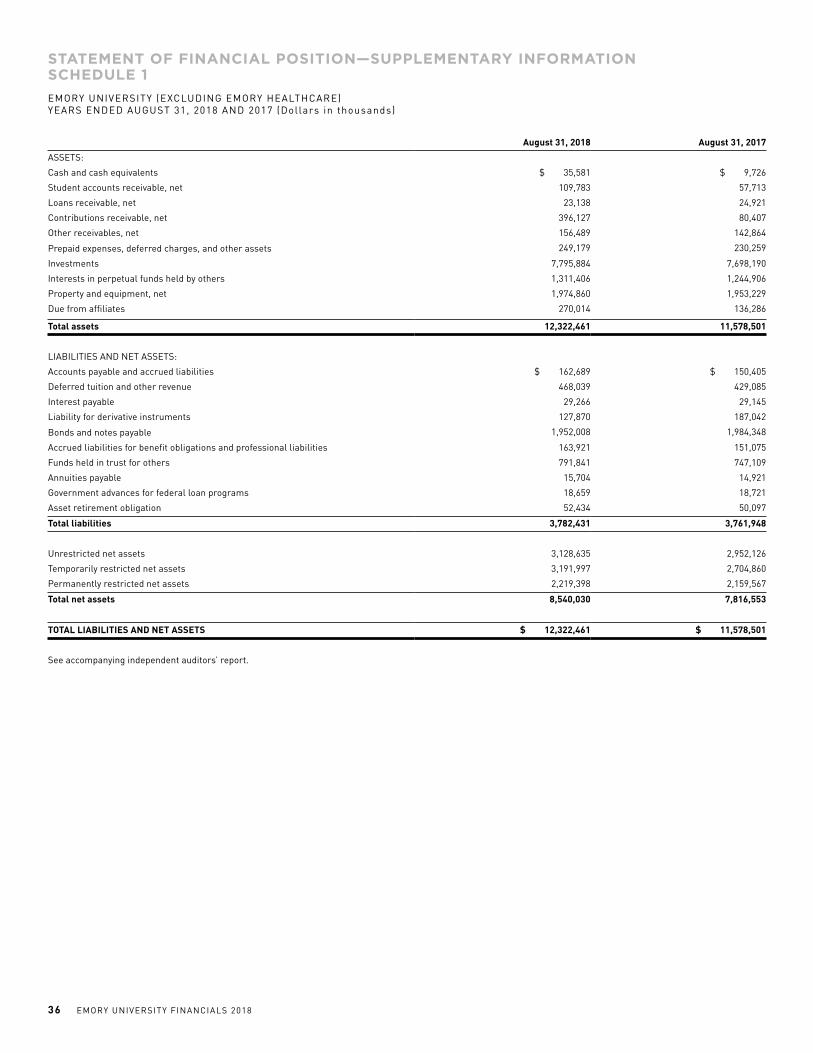
36 EMORY UNIVERSITY FINANCIALS 2018
August 31, 2018 August 31, 2017
ASSETS:
Cash and cash equivalents $ 35,581 $ 9,726
Student accounts receivable, net 109,783 57,713
Loans receivable, net 23,138 24,921
Contributions receivable, net 396,127 80,407
Other receivables, net 156,489 142,864
Prepaid expenses, deferred charges, and other assets 249,179 230,259
Investments 7,795,884 7,698,190
Interests in perpetual funds held by others 1,311,406 1,244,906
Property and equipment, net 1,974,860 1,953,229
Due from affiliates 270,014 136,286
Total assets 12,322,461 11,578,501
LIABILITIES AND NET ASSETS:
Accounts payable and accrued liabilities $ 162,689 $ 150,405
Deferred tuition and other revenue 468,039 429,085
Interest payable 29,266 29,145
Liability for derivative instruments 127,870 187,042
Bonds and notes payable 1,952,008 1,984,348
Accrued liabilities for benefit obligations and professional liabilities 163,921 151,075
Funds held in trust for others 791,841 747,109
Annuities payable 15,704 14,921
Government advances for federal loan programs 18,659 18,721
Asset retirement obligation 52,434 50,097
Total liabilities 3,782,431 3,761,948
Unrestricted net assets 3,128,635 2,952,126
Temporarily restricted net assets 3,191,997 2,704,860
Permanently restricted net assets 2,219,398 2,159,567
Total net assets 8,540,030 7,816,553
TOTAL LIABILITIES AND NET ASSETS $ 12,322,461 $ 11,578,501
See accompanying independent auditors’ report.
STATEMENT OF FINANCIAL POSITION—SUPPLEMENTARY INFORMATION SCHEDULE 1 EMORY UNIVERSITY (EXCLUDING EMORY HEALTHCARE) YEARS ENDED AUGUST 31, 2018 AND 2017 (Dollars in thousands)

EMORY UNIVERSITY FINANCIALS 2018 37
Unrestricted Temporarily
Restricted Permanently
Restricted Total August 31, 2018 Total August 31, 2017
OPERATING REVENUES AND OTHER SUPPORT:
Tuition and fees $ 710,471 — — $ 710,471 $ 675,179
Less: scholarship allowances (276,305) — — (276,305) (253,897)
Net tuition and fees 434,166 — — 434,166 421,282
Endowment spending distribution 182,562 — — 182,562 179,696
Distributions from perpetual funds 35,377 — — 35,377 34,873
Other investment income designated for current operations 72,934 — — 72,934 65,138
Gifts and contributions 43,350 12,404 — 55,754 44,285
Grants and contracts 470,924 — — 470,924 470,375
Indirect cost recoveries 144,026 — — 144,026 131,012
Medical services 336,141 — — 336,141 301,404
Sales and services of auxiliary enterprises 74,481 — — 74,481 74,464
Independent operations 24,348 — — 24,348 23,097
Other revenue 54,945 — — 54,945 56,620
Net assets released from restrictions 29,726 (13,149) — 16,577 29,384
Total operating revenues 1,902,980 (745) — 1,902,235 1,831,630
Operating support from Emory Healthcare 109,957 — — 109,957 106,545
Total operating revenues and other support 2,012,937 (745) — 2,012,192 1,938,175
OPERATING EXPENSES:
Salaries 1,123,502 — — 1,123,502 1,059,083
Fringe benefits 273,774 — — 273,774 253,270
Student financial aid 19,133 — — 19,133 13,159
Professional fees and purchased services 201,648 — — 201,648 181,096
Supplies and pharmaceuticals 72,028 — — 72,028 70,000
Other operating expenses 130,701 — — 130,701 112,924
Interest on indebtedness 51,431 — — 51,431 59,887
Depreciation 138,345 — — 138,345 133,516
Total operating expenses 2,010,562 — — 2,010,562 1,882,935
NET OPERATING ACTIVITIES: 2,375 (745) — 1,630 55,240
NONOPERATING ACTIVITIES, NET:
Investment return in excess of spending distribution for current operations 116,439 124,188 (3,319) 237,308 345,223
Change in undistributed income from perpetual funds held by others — — 26,880 26,880 74,558
Gifts and contributions (4,311) 386,157 36,427 418,273 69,912
Loss on disposal of property and equipment (1,494) — — (1,494) (11,510)
Loss on defeasance of debt — — — — (8,659)
Change in fair value of derivative instruments 59,172 — — 59,172 79,619
Pension and postretirement plans 5,273 — — 5,273 5,523
Other nonoperating items, net (6,077) (754) (157) (6,988) 5,818
Net assets released from restrictions 5,132 (21,709) — (16,577) (29,384)
Total nonoperating activities, net 174,134 487,882 59,831 721,847 531,100
CHANGE IN NET ASSETS 176,509 487,137 59,831 723,477 586,340
BEGINNING NET ASSETS 2,952,126 2,704,860 2,159,567 7,816,553 7,230,213
ENDING NET ASSETS $ 3,128,635 $ 3,191,997 $ 2,219,398 $ 8,540,030 $ 7,816,553
See accompanying independent auditors’ report.
STATEMENT OF ACTIVITIES—SUPPLEMENTARY INFORMATION SCHEDULE 2
EMORY UNIVERSITY (EXCLUDING EMORY HEALTHCARE) YEARS ENDED AUGUST 31, 2018 AND 2017 (Dollars in thousands)
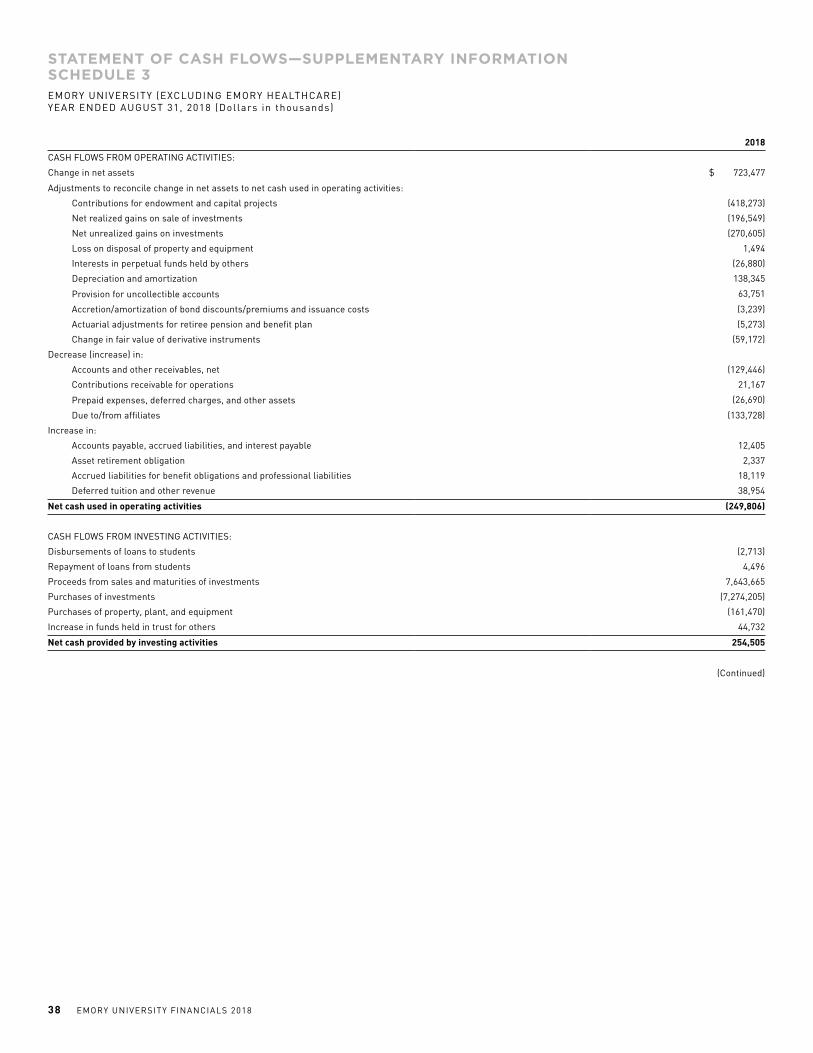
38 EMORY UNIVERSITY FINANCIALS 2018
STATEMENT OF CASH FLOWS—SUPPLEMENTARY INFORMATION SCHEDULE 3EMORY UNIVERSITY (EXCLUDING EMORY HEALTHCARE) YEAR ENDED AUGUST 31, 2018 (Dollars in thousands)
2018
CASH FLOWS FROM OPERATING ACTIVITIES:
Change in net assets $ 723,477
Adjustments to reconcile change in net assets to net cash used in operating activities:
Contributions for endowment and capital projects (418,273)
Net realized gains on sale of investments (196,549)
Net unrealized gains on investments (270,605)
Loss on disposal of property and equipment 1,494
Interests in perpetual funds held by others (26,880)
Depreciation and amortization 138,345
Provision for uncollectible accounts 63,751
Accretion/amortization of bond discounts/premiums and issuance costs (3,239)
Actuarial adjustments for retiree pension and benefit plan (5,273)
Change in fair value of derivative instruments (59,172)
Decrease (increase) in:
Accounts and other receivables, net (129,446)
Contributions receivable for operations 21,167
Prepaid expenses, deferred charges, and other assets (26,690)
Due to/from affiliates (133,728)
Increase in:
Accounts payable, accrued liabilities, and interest payable 12,405
Asset retirement obligation 2,337
Accrued liabilities for benefit obligations and professional liabilities 18,119
Deferred tuition and other revenue 38,954
Net cash used in operating activities (249,806)
CASH FLOWS FROM INVESTING ACTIVITIES:
Disbursements of loans to students (2,713)
Repayment of loans from students 4,496
Proceeds from sales and maturities of investments 7,643,665
Purchases of investments (7,274,205)
Purchases of property, plant, and equipment (161,470)
Increase in funds held in trust for others 44,732
Net cash provided by investing activities 254,505
(Continued)
EMORY UNIVERSITY FINANCIALS 2018 39
STATEMENT OF CASH FLOWS—SUPPLEMENTARY INFORMATION SCHEDULE 3
EMORY UNIVERSITY (EXCLUDING EMORY HEALTHCARE) YEAR ENDED AUGUST 31, 2018 (Dollars in thousands)
(Continued from previous page)
2018
CASH FLOWS FROM FINANCING ACTIVITIES:
Proceeds from contributions for endowment and capital projects $ 41,766
Principal repayments of bonds payable (29,101)
Recovery of posted collateral for debt-related derivatives 7,770
Increase in annuities payable 783
Decrease in government advances for federal loan programs (62)
Net cash provided by financing activities 21,156
Net increase in cash and cash equivalents 25,855
Cash and cash equivalents at beginning of year 9,726
Cash and cash equivalents at end of year $ 35,581
See accompanying independent auditors’ report.
40 EMORY UNIVERSITY FINANCIALS 2018


