79%
21%
June 30, 2021
Tokyo Metropolitan Government
Bureau of Environment
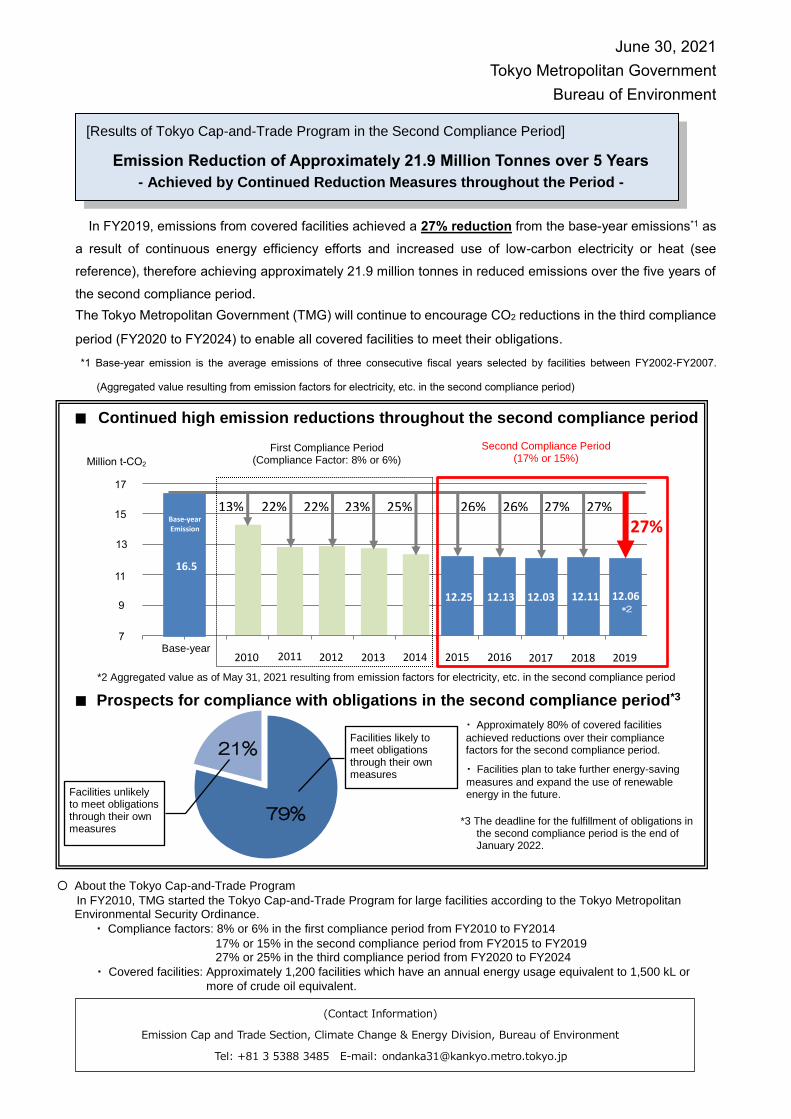
In FY2019, emissions from covered facilities achieved a 27% reduction from the base-year emissions*1 as
a result of continuous energy efficiency efforts and increased use of low-carbon electricity or heat (see
reference), therefore achieving approximately 21.9 million tonnes in reduced emissions over the five years of
the second compliance period.
The Tokyo Metropolitan Government (TMG) will continue to encourage CO2 reductions in the third compliance
period (FY2020 to FY2024) to enable all covered facilities to meet their obligations.
*1 Base-year emission is the average emissions of three consecutive fiscal years selected by facilities between FY2002-FY2007.
(Aggregated value resulting from emission factors for electricity, etc. in the second compliance period)
(Contact Information)
Emission Cap and Trade Section, Climate Change & Energy Division, Bureau of Environment
Tel: +81 3 5388 3485 E-mail: [email protected]
[Results of Tokyo Cap-and-Trade Program in the Second Compliance Period]
Emission Reduction of Approximately 21.9 Million Tonnes over 5 Years
- Achieved by Continued Reduction Measures throughout the Period -
Million t-CO2
H222010
H232011
H242012
H252013
H262014
Second Compliance Period (17% or 15%)
First Compliance Period (Compliance Factor: 8% or 6%)
27% 13% 22% 22% 23% 25% 26% 26% 27% 27%
Base-year Emission
Base-year
2010
2011
2012
2013
2014
2015
2016
2017
2018
2019
16.5
12.25 12.13 12.03 12.11 12.06 *2
Facilities likely to meet obligations through their own measures
・ Approximately 80% of covered facilities
achieved reductions over their compliance factors for the second compliance period. ・ Facilities plan to take further energy-saving
measures and expand the use of renewable energy in the future.
〇 About the Tokyo Cap-and-Trade Program
In FY2010, TMG started the Tokyo Cap-and-Trade Program for large facilities according to the Tokyo Metropolitan Environmental Security Ordinance.
・ Compliance factors: 8% or 6% in the first compliance period from FY2010 to FY2014
17% or 15% in the second compliance period from FY2015 to FY2019 27% or 25% in the third compliance period from FY2020 to FY2024
・ Covered facilities: Approximately 1,200 facilities which have an annual energy usage equivalent to 1,500 kL or
more of crude oil equivalent.
*2 Aggregated value as of May 31, 2021 resulting from emission factors for electricity, etc. in the second compliance period
■ Continued high emission reductions throughout the second compliance period
■ Prospects for compliance with obligations in the second compliance period*3
Facilities unlikely to meet obligations through their own measures
*3 The deadline for the fulfillment of obligations in the second compliance period is the end of January 2022.
17
15
13
11
9
7
Reference
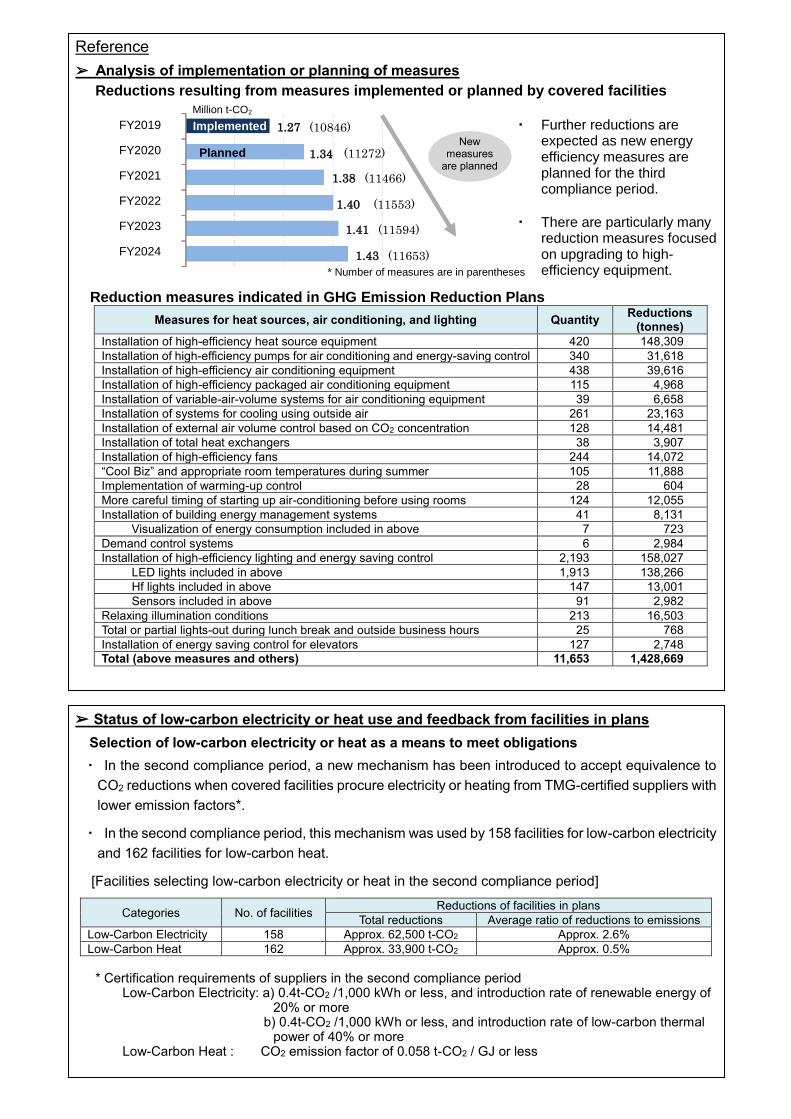
➢ Analysis of implementation or planning of measures
Reductions resulting from measures implemented or planned by covered facilities
Reduction measures indicated in GHG Emission Reduction Plans
Measures for heat sources, air conditioning, and lighting Quantity Reductions
(tonnes)
Installation of high-efficiency heat source equipment 420 148,309
Installation of high-efficiency pumps for air conditioning and energy-saving control 340 31,618
Installation of high-efficiency air conditioning equipment 438 39,616
Installation of high-efficiency packaged air conditioning equipment 115 4,968
Installation of variable-air-volume systems for air conditioning equipment 39 6,658
Installation of systems for cooling using outside air 261 23,163
Installation of external air volume control based on CO2 concentration 128 14,481
Installation of total heat exchangers 38 3,907
Installation of high-efficiency fans 244 14,072
“Cool Biz” and appropriate room temperatures during summer 105 11,888
Implementation of warming-up control 28 604
More careful timing of starting up air-conditioning before using rooms 124 12,055
Installation of building energy management systems 41 8,131
Visualization of energy consumption included in above 7 723
Demand control systems 6 2,984
Installation of high-efficiency lighting and energy saving control 2,193 158,027
LED lights included in above 1,913 138,266
Hf lights included in above 147 13,001
Sensors included in above 91 2,982
Relaxing illumination conditions 213 16,503
Total or partial lights-out during lunch break and outside business hours 25 768
Installation of energy saving control for elevators 127 2,748
Total (above measures and others) 11,653 1,428,669
➢ Status of low-carbon electricity or heat use and feedback from facilities in plans
Selection of low-carbon electricity or heat as a means to meet obligations
・ In the second compliance period, a new mechanism has been introduced to accept equivalence to
CO2 reductions when covered facilities procure electricity or heating from TMG-certified suppliers with
lower emission factors*.
・ In the second compliance period, this mechanism was used by 158 facilities for low-carbon electricity
and 162 facilities for low-carbon heat.
[Facilities selecting low-carbon electricity or heat in the second compliance period]
Categories No. of facilities Reductions of facilities in plans
Total reductions Average ratio of reductions to emissions
Low-Carbon Electricity 158 Approx. 62,500 t-CO2 Approx. 2.6%
Low-Carbon Heat 162 Approx. 33,900 t-CO2 Approx. 0.5%
* Certification requirements of suppliers in the second compliance period
Low-Carbon Electricity: a) 0.4t-CO2 /1,000 kWh or less, and introduction rate of renewable energy of 20% or more
b) 0.4t-CO2 /1,000 kWh or less, and introduction rate of low-carbon thermal power of 40% or more
Low-Carbon Heat : CO2 emission factor of 0.058 t-CO2 / GJ or less
FY2019
FY2020
FY2021
FY2022
FY2023
FY2024
1.27 (10846)
1.34 (11272)
1.38 (11466)
1.40 (11553)
1.41 (11594)
1.43 (11653)
Implemented
Planned
・ Further reductions are expected as new energy efficiency measures are planned for the third compliance period.
・ There are particularly many reduction measures focused on upgrading to high-efficiency equipment.
Million t-CO2
* Number of measures are in parentheses
New measures
are planned

Feedback from facilities in plans (regarding introduction of renewable energy, etc.)
✔ Considering measures for effective use of renewable energy (procurement of electricity sourced from more renewable energy, corporate PPAs, certificate acquisition, etc.) to achieve the 2030 and 2050 targets for GHG emission reduction
✔ Planning to install renewable energy equipment during facility renovations
✔ Anticipating implementation of policies for technological innovations, stable supply of renewable energy (such as enhancement mechanism for selecting low-carbon electricity or heat)
➢ Comparison with national levels
・ Trend of CO2 emissions from facilities under the program* shows that the facilities have achieved
continued significant reductions more than national levels compared to those in energy consumption
in the business sector across Japan and the industrial and commercial sectors of Tokyo.
[Comparison of reductions in CO2, etc. in the business sector across Japan, in the industrial and
commercial sectors of Tokyo, and at facilities covered by Tokyo Cap-and-Trade Program]
* The changes in CO2 emissions from facilities covered by the Tokyo Cap-and-Trade Program almost correspond to those in energy consumption at the facilities as the emissions are calculated by fixing CO2 emission factors.
Data sources: ・ Final energy consumption across Japan announced by the Agency for Natural Resources and Energy:
(https://www.enecho.meti.go.jp/statistics/total_energy/pdf/gaiyou2019fyr.pdf)
・ Final energy consumption in Tokyo announced by TMG:
(https://www.kankyo.metro.tokyo.lg.jp/climate/zenpan/emissions_tokyo.files/2019sokuhou.pdf)
・ CO2 emissions from large facilities in Tokyo (FY2005-FY2009) announced by TMG:
(https://www.kankyo.metro.tokyo.lg.jp/climate/large_scale/overview/current_program/index.files/zenseidomatome.pdf)
70
75
80
85
90
95
100
105
H17
2005
H18
2006
H19
2007
H20
2008
H21
2009
H22
2010
H23
2011
H24
2012
H25
2013
H26
2014
H27
2015
H28
2016
H29
2017
H30
2018
R1
2019
80
74
Final energy
consumption in the
business sector across
Japan
Final energy
consumption in the
industrial and
commercial sectors of
Tokyo
CO2 emissions from
facilities covered by
Tokyo Cap-and-Trade
Program (emission
factor fixed)
2005 2006 2007 2008 2009 2010 2011 2012 2013 2014 2015 2016 2017 2018 2019
Based on FY2005 results as 100


