© 1991-2015 UCAR; All Rights Reserved
EMERALD:
Radar/Lidar Visualization and Manipulation
Tool for MATLAB™
User’s Guide
For version 20150326
March 31, 2015
Author: Dr. Gregory Meymaris
Affiliation: University Corporation for Atmospheric Research (UCAR)
© 1991-2015 UCAR; All Rights Reserved
Contents Introduction .................................................................................................................................................. 1
Installation .................................................................................................................................................... 2
New ........................................................................................................................................................... 2
Upgrades ................................................................................................................................................... 2
Running EMERALD ........................................................................................................................................ 4
Launching .................................................................................................................................................. 4
Managing Datasets ................................................................................................................................... 5
Selecting Plots ........................................................................................................................................... 8
Plot window controls .............................................................................................................................. 11
Scrolling ................................................................................................................................................... 13
Polygons .................................................................................................................................................. 13
User Configuration ...................................................................................................................................... 15
User Configuration Files .......................................................................................................................... 17
Passing options at launch........................................................................................................................ 17
Modifying the emerald object ................................................................................................................ 17
API ............................................................................................................................................................... 17
Modify a dataset (sweep) ....................................................................................................................... 18
Clear the databuffer ................................................................................................................................ 18
Load a dataset directly ............................................................................................................................ 18
Troubleshooting .......................................................................................................................................... 20
Ver: 20150326 Emerald User’s Guide 2015-03-31
© 1991-2015 UCAR; All Rights Reserved 1
Introduction This document describes installation of EMERALD and describes how to use it.
EMERALD (thE Matlab™ Environment for Radar And Lidar Data) is made up of two pieces, a graphical
user interface (GUI) to load and display (and in the future manipulate) radar and lidar data, and a more
powerful advanced programming interface (API) to be allow automation. EMERALD is written in
MATLAB1 code and is, thus far, intended to not require any additional toolboxes.
Current EMERALD capabilities:
Load CF/Radial NetCDF data into MATLAB (GUI & API)
o Can load all or specific data fields
o Can load all or specific sweeps within a file
o Ability to load multiple files at once (requires config file change)
GUI
o Display 1-4 plots simultaneously
o 4 different plot types (3 flavors of PPI, plus RHI and BSCAN)
o Plots are linked so that zooming/panning applies to all of the same plot type
o Draw a polygon to obtain a histogram of the data containeNavigate through loaded
sweeps quickly
o Data cursor to obtain the values of user selected fields at a specific point in the plot.
o Create a modified sweep in which data is masked out.
o Save data to a variable in the workspace.
o Run multiple EMERALD GUIs at the same time using the same databuffer.
Data manipulation
o Extract a sweep from the data buffer
o Add a sweep back into the data buffer.
In the future, we would like to make the following enhancements:
add ability to control colorscales independently
improved ability to manipulate the data through the GUI, including only data contained within
the polygon
write out manipulated data
improve navigation
add additional plot types
add map layers
movie loops
1 MATLAB is a registered trademark of The Mathworks, Inc.
Ver: 20150326 Emerald User’s Guide 2015-03-31
© 1991-2015 UCAR; All Rights Reserved 2
Installation
New The file is provided as a gzip’ed tar file. To install, simply unpack the file in the desired location. For
example, in *NIX:
Step 1) Create the emerald directory
> mkdir emerald; cd emerald
Step 2) Copy the tar file into that directory
Step 3) unpack the archive:
> tar –xvzf emerald-20150326.tgz
This will create a directory under emerald called emerald-20150326.
Step 4) add the path
You probably should add the MATLAB path to EMERALD. This can be done at the MATLAB
command line (this change only lasts in that Matlab session), in the startup.m file, or globally. If the
EMERALD directory is not added to the path, then MATLAB will need to be run from the EMERALD
directory. In MATLAB command window:
>> addpath /THE/FULL/PATH/TO/emerald/emerald-20150326
This will add the path for the current session only. To make it more permanent, either add the
above line (without “>>”) to the startup.m file (in *NIX, if that file exists, it is located in ~/matlab), or
use the matlab GUI. To do the latter, select “File”->”Set Path” from the menu, click on “Add Folder”,
then use the dialog box to select the emerald-20150326 directory.
See the MATLAB documentation for more information on setting up paths. Once this is done, the
MATLAB working directory can be anywhere but EMERALD will still be available.
NOTE: It is recommended that you do not mix EMERALD and your other files together. In other words,
do not put your personal scripts, data, or configuration files in the EMERALD directory as it will make
upgrading much more difficult.
NOTE: If you set up the path correctly, you will be able to call EMERALD from any directory.
Upgrades Assuming that you followed the steps listed above for the installation:
Step 1) Go into the top emerald directory
> cd /THE/FULL/PATH/TO/emerald
Step 2) Copy the tar file into that directory
Ver: 20150326 Emerald User’s Guide 2015-03-31
© 1991-2015 UCAR; All Rights Reserved 3
Step 3) unpack the archive:
> tar –xvzf emerald-20150326.tgz
This will create a directory under emerald called emerald-20150326.
Step 4) modify the path
If you modified your path, to include EMERALD (which you probably should have) then you will want
to modify the MATLAB path to the new version. If you just add the path during each session using
the addpath command, then simply start using the new path1 (emerald-20150326). If you modified
your startup.m to include the addpath command, then change that command to point to the new
path. If you went through the GUI, then you add the new path and remove the old one in the same
dialog described above in the Install New section.
1 Any Matlab sessions that has or had EMERALD running during the upgrade, should be restarted.

Ver: 20150326 Emerald User’s Guide 2015-03-31
© 1991-2015 UCAR; All Rights Reserved 4
Running the EMERALD GUI
Launching To start emerald, launch MATLAB, and run:
>> em = emerald;
NOTE: you should be able to launch EMERALD from any directory if you set up the path. It is
recommended that personal scripts are not added into the emerald-20150326 directory since this will
complicate upgrades. Instead put your personal scripts in a different directory, launch Matlab and call
EMERALD from there.
Optionally, EMERALD can be launched with various arguments. See the section on User Configuration.
The plot window should pop up.
NOTE: If the plot window is closed by accident, you can start it again by typing:
>> em.plot_window_create;
>> em.render_plots;
A few settings will be lost, but mostly everything should be recovered, as long at the emerald object (em
in the above example call) is still in memory.
NOTE: If the plot window is closed and the emerald object (em in the above examples) has been cleared,
it is not necessarily true that the data is gone from memory. The data is stored in a global variable,

Ver: 20150326 Emerald User’s Guide 2015-03-31
© 1991-2015 UCAR; All Rights Reserved 5
currently, and thus may still be available. Re-launch EMERALD, and select ‘Data’->’Select Dataset’ or -
>’Print Databuffer’ to see what is resident in memory.
NOTE: More than one EMERALD plot window can run at the same time. Simply launch another one but
name it differently:
>> em2 = emerald;
Since the databuffer is stored in global memory, this allows both GUIs to access the data without having
it loaded more than once. Having more than one open will allow the user to compare two different
datasets concurrently.
Managing Datasets EMERALD stores the data in a data buffer which is stored in global memory. In EMERALD, a dataset is
typically a sweep. The data buffer is a collection of sweeps, possibly from many volumes.
NOTE: ‘clear all’, ‘clear global’, and ‘clear classes’ can delete the contents of the data buffer. These
commands should be avoided while running EMERALD. Also, the data is not stored within the emerald
object (em in the above examples). So clearing that object will kill the GUI, but not the data.
Loading Datasets
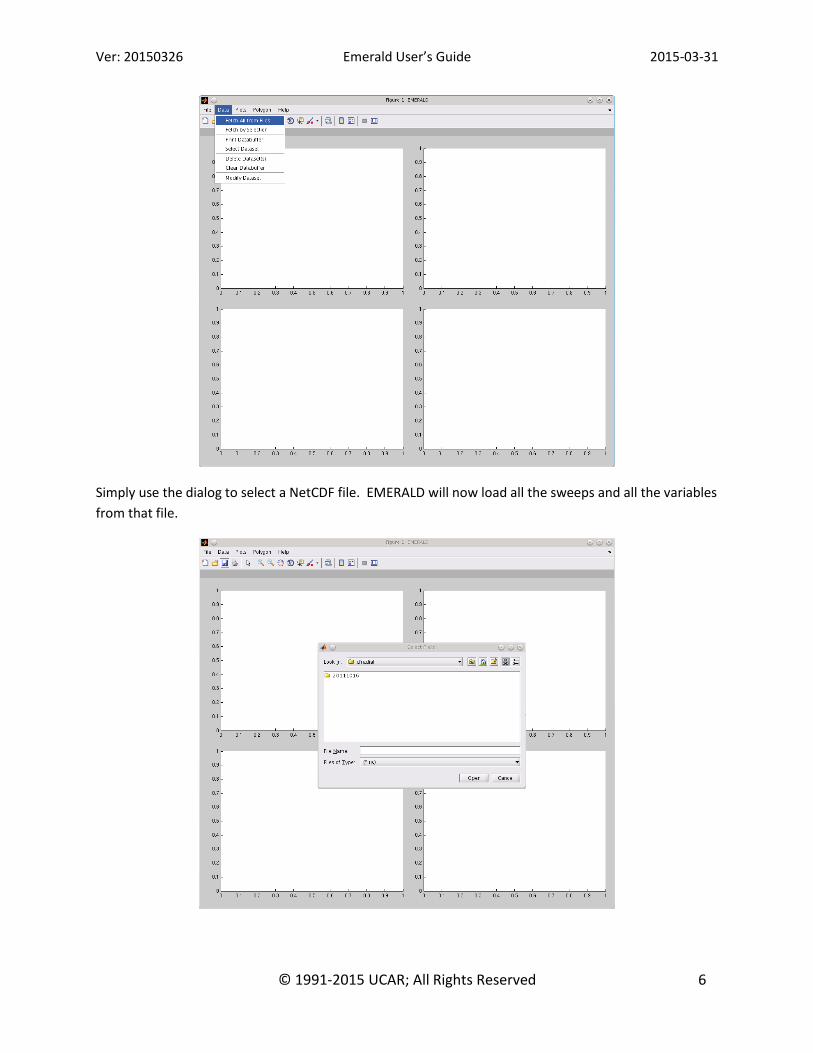
There are two main ways of loading datasets from the GUI. First, under the ‘Data’ window, select ‘Fetch
All from File’, which will bring up the file selector dialog. This will load all sweeps and all variables from
a CfRadial NetCDF file. Note that if the parameter load_data.MultiSelect is ‘on’, then multiple files
containing the same moment fields can be selected using the ‘SHIFT’ (selects all files between the file
you just clicked on and the last one you had just clicked on) and ‘CTRL’ (selects/de-selects the file you
just clicked on) keys, from the same directory.
Ver: 20150326 Emerald User’s Guide 2015-03-31
© 1991-2015 UCAR; All Rights Reserved 6
Simply use the dialog to select a NetCDF file. EMERALD will now load all the sweeps and all the variables
from that file.
Ver: 20150326 Emerald User’s Guide 2015-03-31
© 1991-2015 UCAR; All Rights Reserved 7
Alternatively, from the ‘Data’ menu, you can the ‘Fetch by Selection’. This will take you through 3 dialog
boxes. The first is the file selector dialog box as above. Note that if the parameter
load_data.MultiSelect is ‘on’, then multiple files containing the same moment fields can be selected
using the ‘SHIFT’ (selects all files between the file you just clicked on and the last one you had just
clicked on) and ‘CTRL’ (selects/de-selects the file you just clicked on) keys, from the same directory. The
next dialog allows you to pick which sweeps to load, allowing for multiple sweeps by using SHIFT/CTRL.
The last dialog allows you to select one or more fields to load.
Showing the contents of the data buffer
Select ‘Data’->’Print Databuffer’.
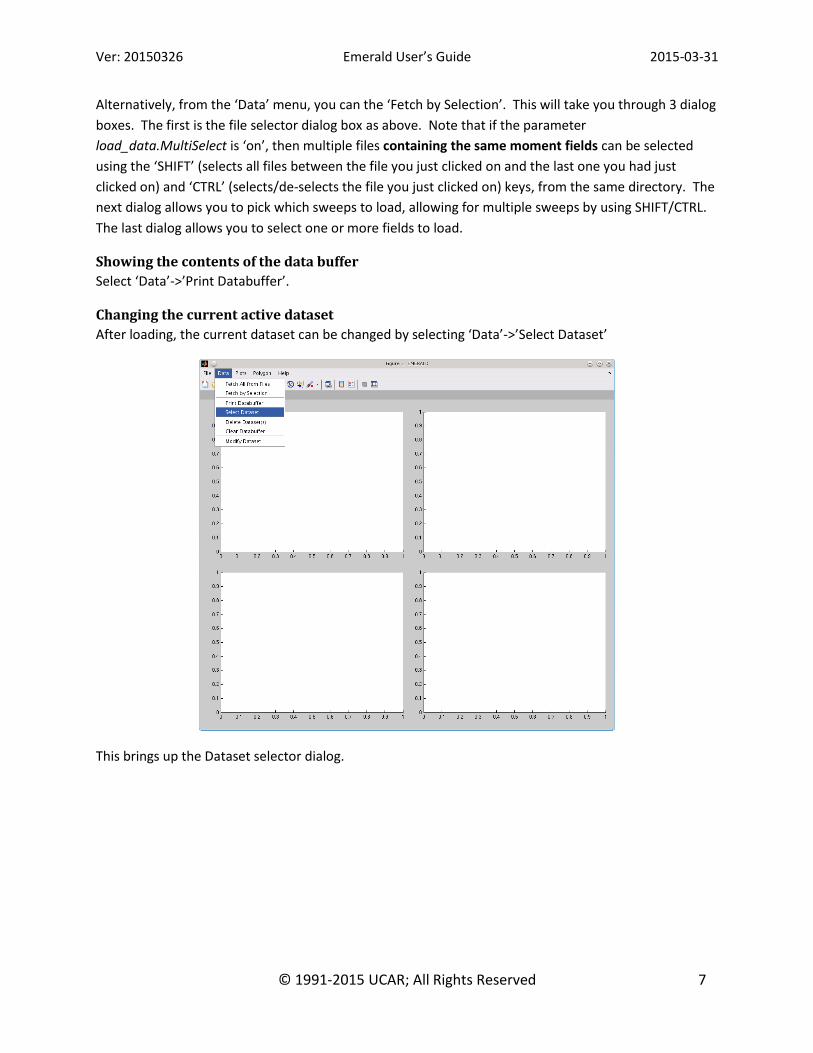
Changing the current active dataset
After loading, the current dataset can be changed by selecting ‘Data’->’Select Dataset’
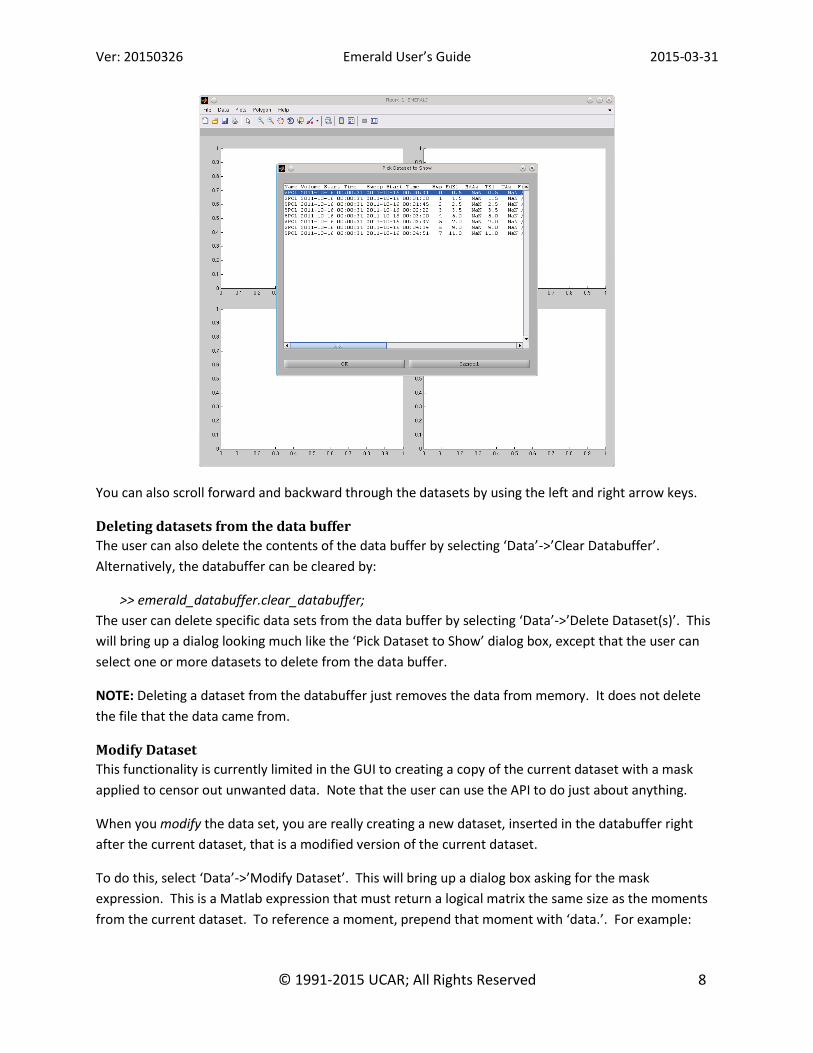
This brings up the Dataset selector dialog.
Ver: 20150326 Emerald User’s Guide 2015-03-31
© 1991-2015 UCAR; All Rights Reserved 8
You can also scroll forward and backward through the datasets by using the left and right arrow keys.
Deleting datasets from the data buffer
The user can also delete the contents of the data buffer by selecting ‘Data’->’Clear Databuffer’.
Alternatively, the databuffer can be cleared by:
>> emerald_databuffer.clear_databuffer;
The user can delete specific data sets from the data buffer by selecting ‘Data’->’Delete Dataset(s)’. This
will bring up a dialog looking much like the ‘Pick Dataset to Show’ dialog box, except that the user can
select one or more datasets to delete from the data buffer.
NOTE: Deleting a dataset from the databuffer just removes the data from memory. It does not delete
the file that the data came from.
Modify Dataset
This functionality is currently limited in the GUI to creating a copy of the current dataset with a mask
applied to censor out unwanted data. Note that the user can use the API to do just about anything.
When you modify the data set, you are really creating a new dataset, inserted in the databuffer right
after the current dataset, that is a modified version of the current dataset.
To do this, select ‘Data’->’Modify Dataset’. This will bring up a dialog box asking for the mask
expression. This is a Matlab expression that must return a logical matrix the same size as the moments
from the current dataset. To reference a moment, prepend that moment with ‘data.’. For example:

Ver: 20150326 Emerald User’s Guide 2015-03-31
© 1991-2015 UCAR; All Rights Reserved 9
abs(data.ZDR)<3 & data.SNR>2
This condition represents the data that you want to KEEP. To specify the data that you want to through
away instead, just use Matlab’s logical negation (~):
~(abs(data.ZDR)<3 & data.SNR>2)
Once you hit OK, EMERALD will try to execute the command. If it fails, it will report the error at the
command line, and then give you another chance to fix it. If the mask executes successfully, then a
dialog will pop up allowing you to select one or more fields to apply the mask to.
NOTE: Modifying a dataset does not modify any data files. It does not even really modify the current
dataset. Instead it inserts a modified version of the current dataset right after the current dataset in the
databuffer.
Managing Plots
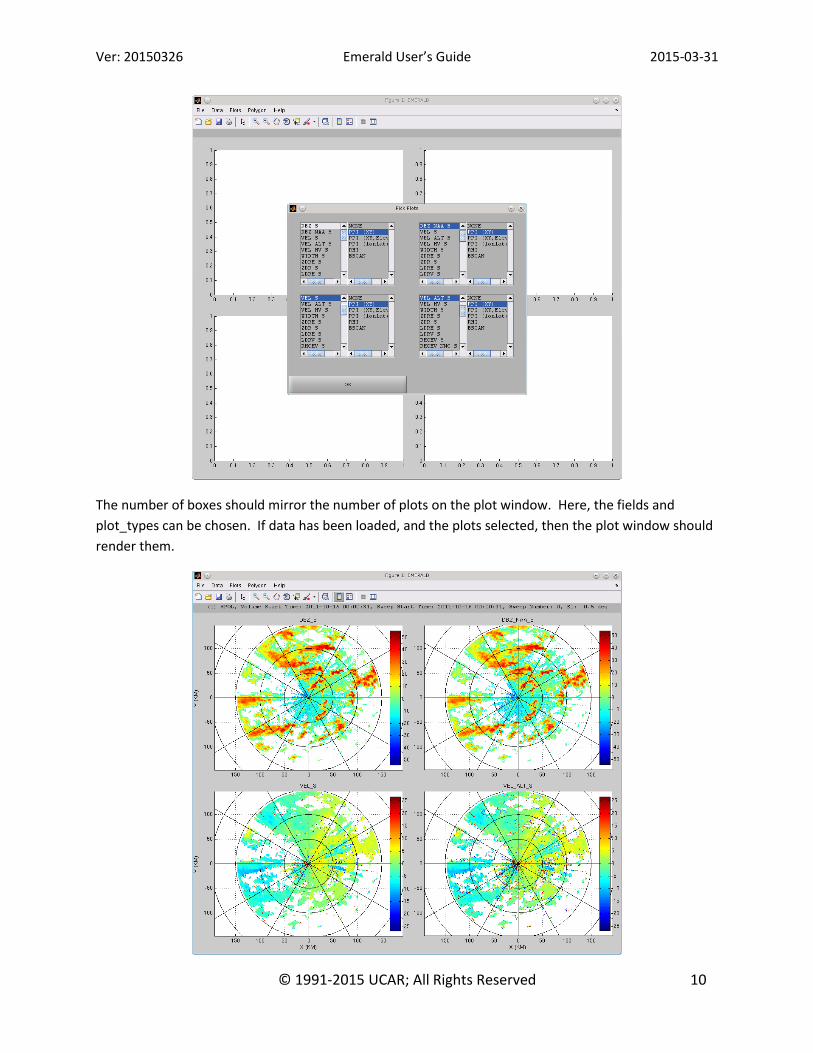
Selecting Plots
To actually get a plot, the user must specify which fields and what type of plot is desired. Select ‘Plots’-
>’Select Plots’.
This will bring up the plot selector dialog.
Ver: 20150326 Emerald User’s Guide 2015-03-31
© 1991-2015 UCAR; All Rights Reserved 10
The number of boxes should mirror the number of plots on the plot window. Here, the fields and
plot_types can be chosen. If data has been loaded, and the plots selected, then the plot window should
render them.

Ver: 20150326 Emerald User’s Guide 2015-03-31
© 1991-2015 UCAR; All Rights Reserved 11
NOTE: The different plot panels do not have to be the same plot type. They can all be the same, but
they can also all be different.
Available plots:
NONE Do not show any plot within the axes.
PPI (XY) Standard PPI plot. The distance corresponds to distance along the beam.
PPI (XY,Elev Corr) Similar to ‘PPI (XY)’ except that the distance is corrected according to the
elevation angle. Technically, the distance is the Earth distance from the radar to
the radar/lidar volume projected down onto the Earth.
PPI (lonlat) Similar to the other PPI’s except that the coordinates are longitude and latitude,
rather than displacement in KM from the radar/lidar.
RHI Standard RHI plot. The distance corresponds to Earth distance from the radar to
the illumination volume projected down onto the Earth. The height is MSL
altitude.
BSCAN The x-axis corresponds to beam number within the sweep, and the y-axis is the
range from radar/lidar.
Plot window controls
EMERALD makes as much use of the native MATLAB plot manipulation functionality as possible. By
clicking on the zoom/pan/rotate buttons, manipulating one will manipulate all plots with the same plot
type.
Ver: 20150326 Emerald User’s Guide 2015-03-31
© 1991-2015 UCAR; All Rights Reserved 12
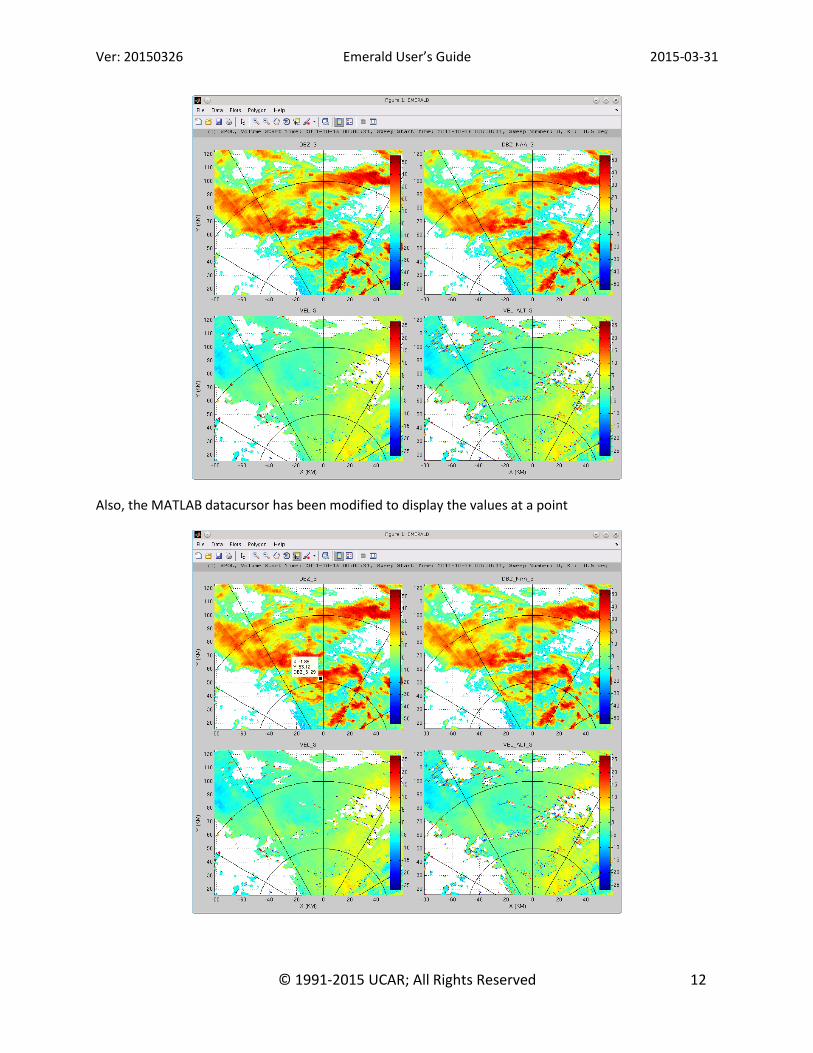
Also, the MATLAB datacursor has been modified to display the values at a point
Ver: 20150326 Emerald User’s Guide 2015-03-31
© 1991-2015 UCAR; All Rights Reserved 13
You can modify which fields (moments) are shown in the datacursor by selecting ‘Plots’->’Data Info
Fields’. This will bring up a dialog in which you can select one or more moment fields to display.
Changing the fields only affects new datatips, not any existing ones.
NOTE: It is important to turn off these features before using the polygon functionality or using the
keyboard shortcuts. Also it is not recommended that you use the colorbar button except to remove the
colorbar.
The user can also control the zoom through the use of the xlim, ylim, and axis commands at the
command line. Simply click on a plot, and use one of these functions. All plots with the same type
should automatically adjust along with it. The user can also control the color axis through the use of the
caxis command in the same way. Type ‘help xlim’, etc., for more information on how to use these.
>> caxis([-5 5])
>> axis([-40 40 -40 40])
Scrolling
In addition to going to a different dataset by selecting ‘Data’->’Select Dataset’, The next and previous
datasets can be navigated to by using the right- and left- (resp.) arrows on the keyboard.
NOTE: It is important to turn off the MATLAB zoom/pan/rotate/datacursor features before using this
feature.
When scrolling, the out-of-the-box behavior is to lock the zoom and color axis. This means that the
zoom and color axis is preserved when switching to a different plotted data set. To turn these features
off, select them in the ‘Plots’ window. You can force EMERALD to redraw the current plots by selecting
‘Plots’->’Render Plots’.
Polygons The user can also define polygons. Currently, EMERALD can plot the same polygon on all plots of the
same type. You can plot a histogram of the data located within the polygon on the current axes or you
can save specific data (fields specified via ‘Plots’->’Data Info Fields’) from within the polygon to a
workspace variable.
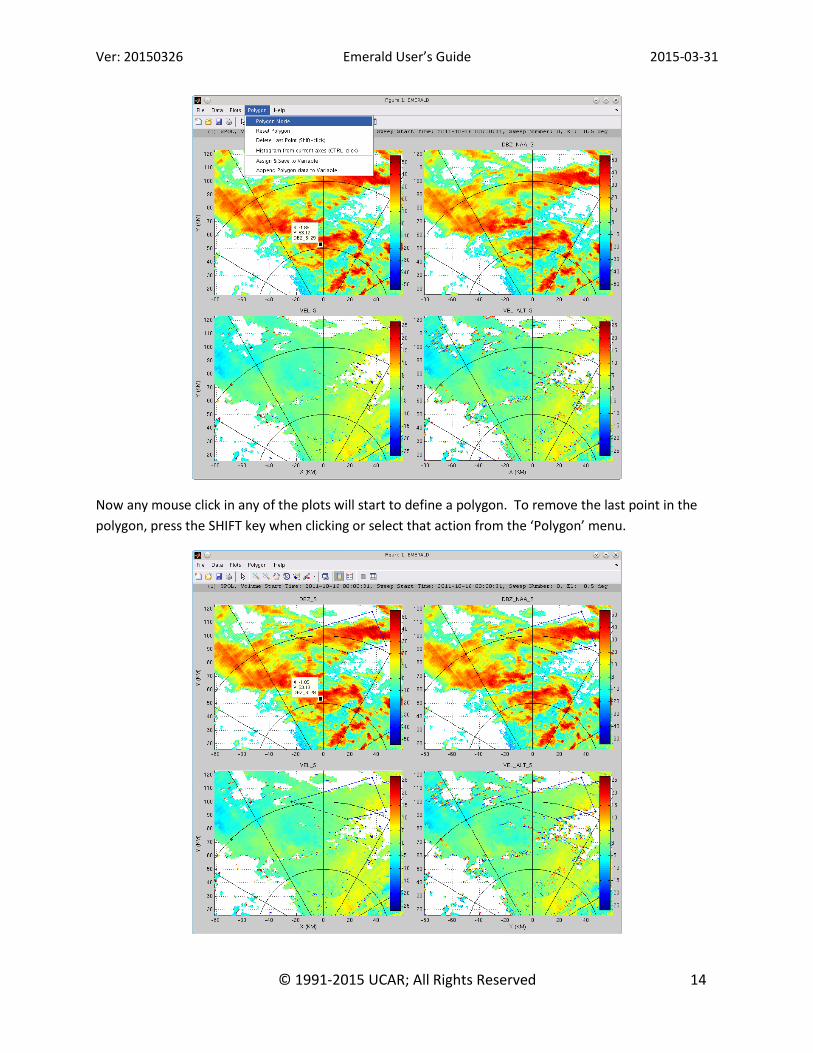
Defining a polygon
To start defining the polygon, select ‘Polygon’->’Polygon Mode’.
Ver: 20150326 Emerald User’s Guide 2015-03-31
© 1991-2015 UCAR; All Rights Reserved 14
Now any mouse click in any of the plots will start to define a polygon. To remove the last point in the
polygon, press the SHIFT key when clicking or select that action from the ‘Polygon’ menu.
Ver: 20150326 Emerald User’s Guide 2015-03-31
© 1991-2015 UCAR; All Rights Reserved 15
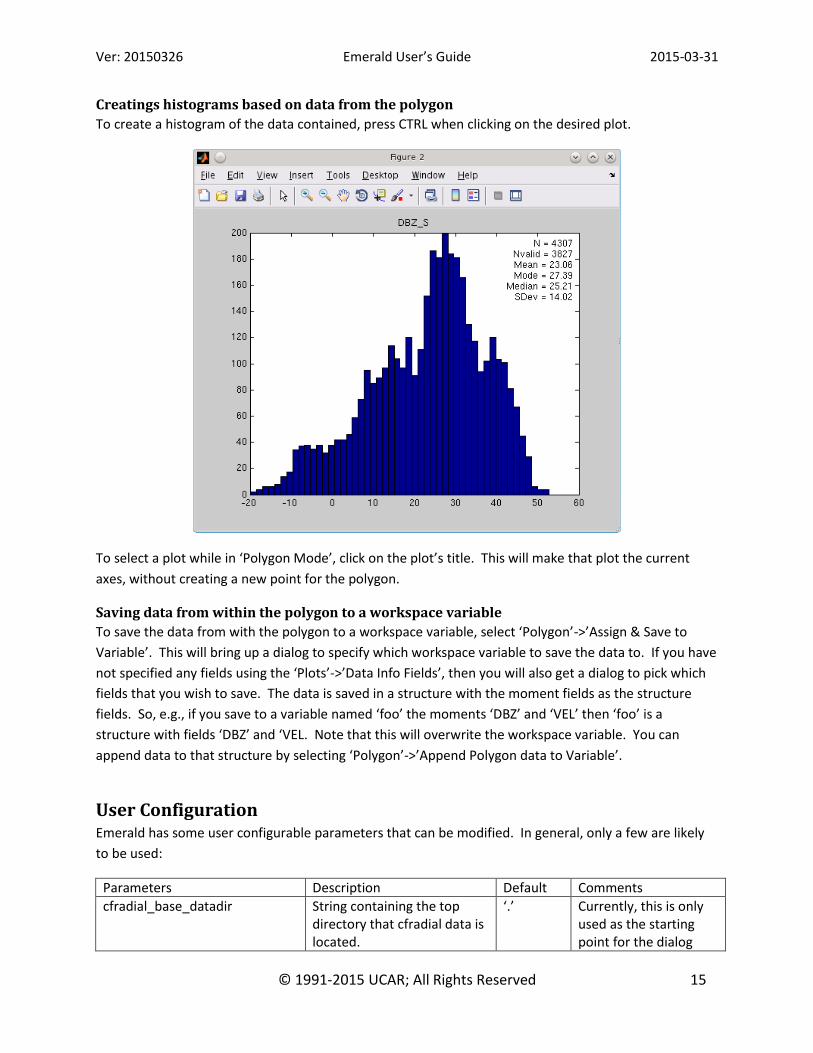
Creatings histograms based on data from the polygon
To create a histogram of the data contained, press CTRL when clicking on the desired plot.
To select a plot while in ‘Polygon Mode’, click on the plot’s title. This will make that plot the current
axes, without creating a new point for the polygon.
Saving data from within the polygon to a workspace variable
To save the data from with the polygon to a workspace variable, select ‘Polygon’->’Assign & Save to
Variable’. This will bring up a dialog to specify which workspace variable to save the data to. If you have
not specified any fields using the ‘Plots’->’Data Info Fields’, then you will also get a dialog to pick which
fields that you wish to save. The data is saved in a structure with the moment fields as the structure
fields. So, e.g., if you save to a variable named ‘foo’ the moments ‘DBZ’ and ‘VEL’ then ‘foo’ is a
structure with fields ‘DBZ’ and ‘VEL. Note that this will overwrite the workspace variable. You can
append data to that structure by selecting ‘Polygon’->’Append Polygon data to Variable’.
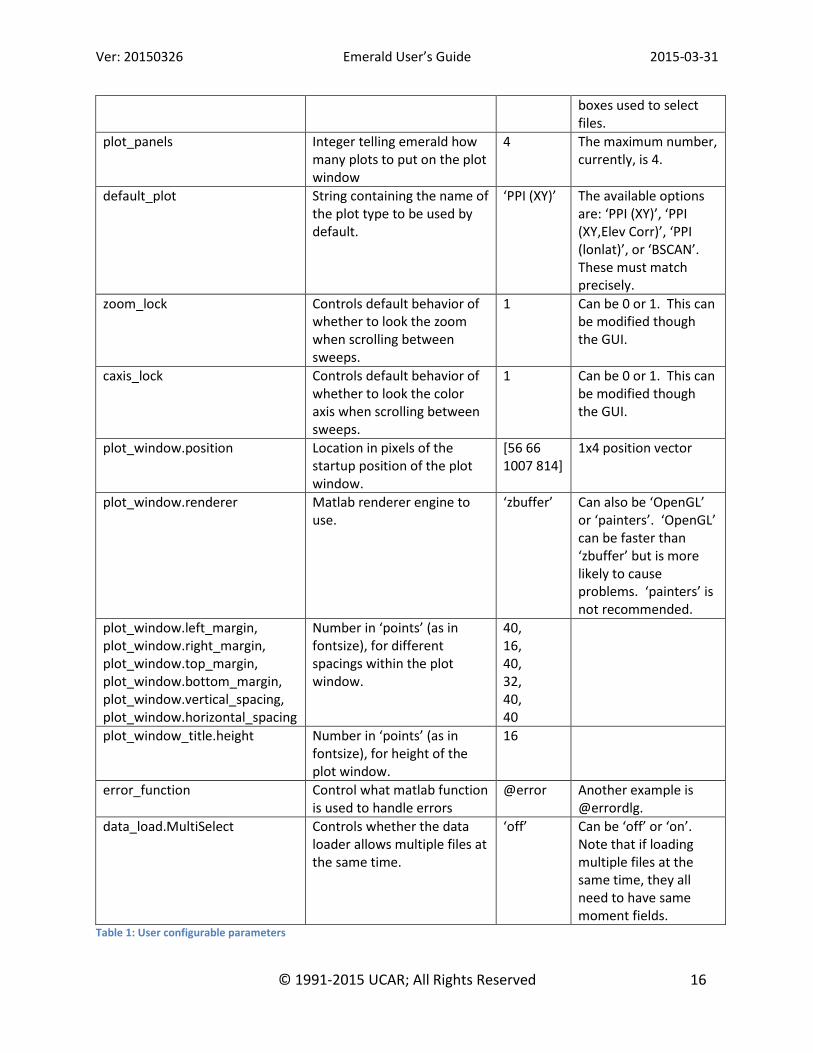
User Configuration Emerald has some user configurable parameters that can be modified. In general, only a few are likely
to be used:
Parameters Description Default Comments
cfradial_base_datadir String containing the top directory that cfradial data is located.
‘.’ Currently, this is only used as the starting point for the dialog
Ver: 20150326 Emerald User’s Guide 2015-03-31
© 1991-2015 UCAR; All Rights Reserved 16
boxes used to select files.
plot_panels Integer telling emerald how many plots to put on the plot window
4 The maximum number, currently, is 4.
default_plot String containing the name of the plot type to be used by default.
‘PPI (XY)’ The available options are: ‘PPI (XY)’, ‘PPI (XY,Elev Corr)’, ‘PPI (lonlat)’, or ‘BSCAN’. These must match precisely.
zoom_lock Controls default behavior of whether to look the zoom when scrolling between sweeps.
1 Can be 0 or 1. This can be modified though the GUI.
caxis_lock Controls default behavior of whether to look the color axis when scrolling between sweeps.
1 Can be 0 or 1. This can be modified though the GUI.
plot_window.position Location in pixels of the startup position of the plot window.
[56 66 1007 814]
1x4 position vector
plot_window.renderer Matlab renderer engine to use.
‘zbuffer’ Can also be ‘OpenGL’ or ‘painters’. ‘OpenGL’ can be faster than ‘zbuffer’ but is more likely to cause problems. ‘painters’ is not recommended.
plot_window.left_margin, plot_window.right_margin, plot_window.top_margin, plot_window.bottom_margin, plot_window.vertical_spacing, plot_window.horizontal_spacing
Number in ‘points’ (as in fontsize), for different spacings within the plot window.
40, 16, 40, 32, 40, 40
plot_window_title.height Number in ‘points’ (as in fontsize), for height of the plot window.
16
error_function Control what matlab function is used to handle errors
@error Another example is @errordlg.
data_load.MultiSelect Controls whether the data loader allows multiple files at the same time.
‘off’ Can be ‘off’ or ‘on’. Note that if loading multiple files at the same time, they all need to have same moment fields.
Table 1: User configurable parameters
Ver: 20150326 Emerald User’s Guide 2015-03-31
© 1991-2015 UCAR; All Rights Reserved 17
There are 3 different ways of modifying the parameters.
User Configuration Files A user configuration file is simply a matlab script (not function) that sets variables. See the file
emerald_default_config.m for the default configuration file. A user configuration file should look like
this, except that you only need put in the variables that you need to change. Do not modify
emerald_default_config.m. Instead, create your own and launch emerald with the following:
>> em = emerald(‘myconfig’);
NOTE: Do not need to include the ‘.m’ in the filename.
NOTE: Your config file can contain path information and does not need to be in the Matlab path.
You can create many different configuration files, though you may only load one at a time.
Passing options at launch Some options can also be given at launch:
>> em = emerald(‘’,’param1’,value1,…)
The first argument can be ‘’ or, e.g., ‘myconfig’. In processing, EMERALD first loads
emerald_default_config.m, then the user configuration file, and finally, command line options.
NOTE: It is not recommended to override any parameters other than plot_panels,
cfradial_base_datadir, zoom_lock, caxis_lock, and default_plot using this interface. If there are other
options that need to be modified, then use the user configuration file approach and re-launch or else re-
launch with those parameter options (note that data will not need to be reloaded unless the global data
buffer is cleared).
Modifying the emerald object It is also possible to modify the emerald object (em in this document) directly:
>> em.override_params.cfradial_base_datadir = ‘/my/new/datapath’;
NOTE: The only parameter which can be modified this way is cfradial_base_datadir. If there are other
options that need to be modified, then use the user configuration file approach or passing options at
launch approach, and re-launch (note that data will not need to be reloaded unless the global data
buffer is cleared).
API It is also possible to load datasets either standalone, or in the context of a data buffer. See the help for
emerald_dataset, and emerald_databuffer for more information. With emerald_dataset, you can load a
dataset from a CFradial file directly, or just get an inventory of its contents. This skips the databuffer
completely. With emerald_databuffer, you can load many datasets from the databuffer, as well as
access, modify, and delete them. In the future, we will add the ability to save data back out to CFradial.
Ver: 20150326 Emerald User’s Guide 2015-03-31
© 1991-2015 UCAR; All Rights Reserved 18
A few useful examples are shown here but for more information, please see the help for these in
Matlab:
>> help emerald_dataset
and
>> help emerald_databuffer
NOTE: While the databuffer is currently stored as a global variable, please DO NOT access this variable
directly. Instead, please use the interface provided by the functions within emerald_databuffer. We
may change the format of the databuffer or possibly move away from using a global variable.
Modify a dataset (sweep) Retrieve a dataset from the databuffer by:
>> emerald_databuffer.print_databuffer_inventory;
This will print out the inventory. Then to retrieve the 3rd dataset:
>> data = emerald_databuffer.get_dataset(3);
This returns a structure that can be modified. Then, it can be put back in by:
>> emerald_databuffer.add_to_databuffer(data);
Note that this will add the one on the end of the databuffer.
Clear the databuffer
>> emerald.databuffer.clear_databuffer;
Load a dataset directly
>> data = emerald_dataset.load_cfradial(‘FILENAME’,’all_fields’);
This will load all sweeps all variables from the file. For more options, see
>> help emerald_dataset.load_cfradial
Dataset structure Datasets are simply structures with the following fields:
file_info A structure with information pertaining to the file including the NetCDF file
attributes, dimensions, parameters used for loading the file and the originating
filename.
inds_info If the NetCDF CFradial file used the gate-packing technique, information
regarding this gate-packing is stored here.
meta_data A structure containing the meta data. Meta-data is defined as all data from the
CFradial file that did not have the dimensions of the moments data.
Ver: 20150326 Emerald User’s Guide 2015-03-31
© 1991-2015 UCAR; All Rights Reserved 19
meta_data_info A structure containing all of the NetCDF information (attributes, dimensions,
etc.) of the meta-data.
moments A structure containing the moments. Moments are defined as all data from the
CFradial file that has dimensions equal to either {‘time’,’range’} or {‘n_points’},
depending on whether the range gates are packed or not (n_gates_vary exists
and is true, or else contains the dimension ‘n_points’). Once loaded, however,
all moment data is stored as time x range.
moments_info A structure containing all of the NetCDF information (attributes, dimensions,
etc.) of the moments data.
Ver: 20150326 Emerald User’s Guide 2015-03-31
© 1991-2015 UCAR; All Rights Reserved 20
Troubleshooting Matlab cannot find emerald (getting “undefined function or variable” error)
o Make sure that the path to emerald-20150326 is set correctly.
o Matlab is case-sensitive so make sure that you are calling emerald correctly.
EMERALD is not plotting anything.
In order to produce plots, EMERALD needs to have data loaded and know which plots you want. Make
sure you ‘Fetch’ data (see Managing Datasets), and then ‘Select Plots’ (see The user can delete specific
data sets from the data buffer by selecting ‘Data’->’Delete Dataset(s)’. This will bring up a dialog looking
much like the ‘Pick Dataset to Show’ dialog box, except that the user can select one or more datasets to
delete from the data buffer.
NOTE: Deleting a dataset from the databuffer just removes the data from memory. It does not delete
the file that the data came from.
Modify Dataset
This functionality is currently limited in the GUI to creating a copy of the current dataset with a mask
applied to censor out unwanted data. Note that the user can use the API to do just about anything.
When you modify the data set, you are really creating a new dataset, inserted in the databuffer right
after the current dataset, that is a modified version of the current dataset.
To do this, select ‘Data’->’Modify Dataset’. This will bring up a dialog box asking for the mask
expression. This is a Matlab expression that must return a logical matrix the same size as the moments
from the current dataset. To reference a moment, prepend that moment with ‘data.’. For example:
abs(data.ZDR)<3 & data.SNR>2
This condition represents the data that you want to KEEP. To specify the data that you want to through
away instead, just use Matlab’s logical negation (~):
~(abs(data.ZDR)<3 & data.SNR>2)
Once you hit OK, EMERALD will try to execute the command. If it fails, it will report the error at the
command line, and then give you another chance to fix it. If the mask executes successfully, then a
dialog will pop up allowing you to select one or more fields to apply the mask to.
NOTE: Modifying a dataset does not modify any data files. It does not even really modify the current
dataset. Instead it inserts a modified version of the current dataset right after the current dataset in the
databuffer.
o Managing Plots).
All (or most) of the data is the same color.
o Try turning off the ‘Color Axis Lock’, click ‘Render Plots’, and turn back on ‘Color Axis
Lock’ (all within the ‘Plots’ menu.
The data is all blank even though I know there really are data values.

Ver: 20150326 Emerald User’s Guide 2015-03-31
© 1991-2015 UCAR; All Rights Reserved 21
o Try turning off the ‘Zoom Lock’, click ‘Render Plots’, and turn back on ‘Zoom Lock’ (all
within the ‘Plots’ menu.
I just upgraded EMERALD but when I look at the "About" it still lists the older version.
o The path probably needs to be updated and Matlab needs to be restarted.
I just upgraded EMERALD and now I am getting a "The class file for 'emerald_api' has been
changed; but the change cannot be applied..." warning.
o You can try doing a clear all. Otherwise, try restarting Matlab.


