
AQUACULTURE ENVIRONMENT INTERACTIONSAquacult Environ Interact
Vol. 6: 191–203, 2015doi: 10.3354/aei00124
Published online February 26
INTRODUCTION
Nanoflagellates (NF) are a key component of themicrobial loop. Phagotrophic NF, which include heterotrophic nanoflagellates (HNF) and mixotrophicNF, are predators of heterotrophic bacteria andphoto synthetic picoplankton, and therefore play apivotal role in transferring prokaryotic and eukaryoticpicoplankton production to the classic food web(Sanders et al. 2000, Calbet et al. 2001, Chan et al.2009, Tsai et al. 2011). From the early formalisation ofthe microbial loop concept to present-day research,
the seasonal and spatial variation of NF and the envi-ronmental factors have been widely studied in bothfreshwater and marine systems because of the signifi-cant eco logical role of NF in aquatic food webs. Gen-erally, temperature, chlorophyll a (chl a), nutrient con-centrations and prey (bacteria and picophytoplankton)biomass are the major controlling factors in the spatialdistribution of NF (Kuuppo 1994, Safi & Hall 1997,Granda & Anadón 2008, Huang et al. 2008). However,there have been few studies on NF in aquaculture ar-eas, which are more readily affected by human activi-ties and more closely associated with our daily lives.
© The authors 2015. Open Access under Creative Commons byAttribution Licence. Use, distribution and reproduction are un -restricted. Authors and original publication must be credited.
Publisher: Inter-Research · www.int-res.com
*Corresponding author: [email protected]
Effects of freshwater input and mariculture(bivalves and macroalgae) on spatial distribution of
nanoflagellates in Sungo Bay, China
Jiachang Lu1, Lingfeng Huang2,*, Yuanrong Luo2, Tian Xiao3, Zengjie Jiang4, Linnan Wu1
1College of Ocean and Earth Sciences, Xiamen University, Xiamen 361102, PR China2Key Laboratory of the Ministry of Education for Coastal and Wetland Ecosystem, Xiamen University, Xiamen 361102, PR China
3Key Laboratory of Marine Ecology and Environmental Sciences, Institute of Oceanology, Chinese Academy of Sciences, Qingdao 266071, PR China
4Key Laboratory of Sustainable Development of Marine Fisheries, Ministry of Agriculture, Yellow Sea Fisheries Research Institute, Chinese Academy of Fishery Sciences, Qingdao 266071, PR China
ABSTRACT: Sungo Bay in northern China has been used for rearing bivalves and macroalgae forseveral decades. The bivalve culture areas (B-area) are located in the bay head, and the macro-algae culture areas (M-area) are located outside of the B-area. In field investigations, we com-pared the nanoflagellates (NF) in the B-area and the M-area during 4 seasons. After the fieldinvestigations, enclosure experiments were conducted during summer to study the effects of mar-iculture (bivalves and macroalgae) on NF. In the warm seasons (summer and autumn), duringwhich there was an obvious freshwater input to the bay (especially during summer), NF abun-dance was negatively related to salinity and was higher in the B-area than in the M-area. In theenclosure experiments, an increase in NF abundance was observed after Day 4 in the bivalveenclosure, but not in the macroalgae enclosure. Considering that the B-area was the area of lowersalinity, and the season of largest freshwater input was also the optimal growth season forbivalves, we suggest that the spatial distribution of NF in the warm seasons in Sungo Bay may beinfluenced by both freshwater input and mariculture.
KEY WORDS: Nanoflagellates · Mariculture · Freshwater input · Sungo Bay
OPENPEN ACCESSCCESS

Aquacult Environ Interact 6: 191–203, 2015
NF can be captured by bivalves (Dupuy et al.1999). In contrast, picoplankton are too small to beefficiently retained by most bivalves (Kreeger &Newell 1996). Therefore, NF may represent a trophiclink between picoplankton and filter-feeding bi -valves (Le Gall et al. 1997, Dupuy et al. 1999). Theingestion and assimilation of bacterial carbon via NFhas been demonstrated in mussels (Kreeger & Ne -well 1996). In some bivalve culture ponds, NF wereshown to be an important food source for oysters(Dupuy et al. 2000a,b, 2007). Meanwhile, somebivalves may significantly increase dissolved organiccarbon (DOC) concentrations in the surroundingwater (McKee et al. 2005).
Carbon fixed by macroalgae during photosynthesisis mainly used to produce structure and storage prod-ucts. However, excess carbon, accounting for up to40% of the carbon produced daily during photosyn-thesis, is released as DOC into the surrounding water(Sieburth 1969, Lucas et al. 1981). Some protists canutilise seaweed-derived polysaccharides and othertypes of high-molecular-weight polysaccharides (Sherr1988, Armstrong et al. 2000), whereas bacteria areconsidered the main consumers of DOC, which isthen transferred to higher trophic levels when bac -teria are consumed as prey (i.e. by NF). Therefore,seaweeds influence NF through direct or indirectpathways (Armstrong et al. 2000).
Sungo Bay has been used for mariculture since thefirst successful aquaculture attempts using the sea-weed Laminaria japonica in 1970. Over the past several decades, mariculture has expanded in thisarea, and the aquaculture species have changed fromthe original monoculture of macroalgae to the presentpolyculture of macroalgae and bivalves (Fang etal. 1996). The bivalves cultivated mainly includeChlamys farreri and Crassostrea gigas, the retentionefficiency of which is reported to drop with decreasingprey size (Dupuy et al. 1999, Zhang et al. 2010). To attain higher production rates and improve aquaticenvironments, several studies have been conductedin Sungo Bay (Fang et al. 1996, Zhao et al. 1996,Bacher et al. 2003, Mao et al. 2006), and mathematical models have been developed for use in aqua cultureassessment and management. However, the microbialloop was not taken into account in these models, de-spite the microbial loop being important in aquaticsystems (Bacher et al. 2003, Nunes et al. 2003, Zhanget al. 2009). The microbial loop may have been ig-nored in previous studies in Sungo Bay due to a lackof knowledge regarding the in situ components of themicrobial loop. Moreover, picophytoplankton bloomshave frequently appeared in recent years (Kong et al.
2012). NF are regarded as a significant consumer ofpicoplankton (Christaki et al. 2005, Brek-Laitinen &Ojala 2011); NF most likely play an important role inthe Sungo Bay mariculture ecosystem.
This report presents the first study of the NF inSungo Bay. The major objective of this study was toevaluate the effects of environmental factors andmariculture on the spatial distribution of NF in thefield. The spatial distributions of NF and the relation-ships between environmental factors and NF distri-bution were obtained by field surveys. Enclosure ex -periments in situ were conducted to study the effectsof mariculture on NF.
MATERIALS AND METHODS
Sampling
Sungo Bay, located on the northwest coast of theYellow Sea, China, is used for raft mariculture ofbivalves (Chlamys farreri and Crassostrea gigas) andmacroalgae (Laminaria japonica and Gracilaria le -maneiformis). Based on our investigation, the culturedensity of Chlamys farreri was about 390 g m−3 (wetweight) and G. lemaneiformis was about 200 g m−3
(wet weight). The cultivation method is longline cul-ture. The organisms are hung into the water columnfrom 0.5 to 7 m. The bivalve culture areas (B-area)are located in the bay head, and the macroalgae cul-ture areas (M-area) are located outside of the B-area(Fig. 1). Samples were collected during 4 trips toSungo Bay in spring (April 2011), summer (August2011), autumn (October 2011) and winter (January2012). Seawater samples were collected using Rutt -ner bottles (Hydro-Bios). For sites with a water depthof <10 m, water samples were taken at a depth of0.5 m below the surface. For sites with a depth >10 m,samples were taken at a depth of 10 m. We did notfind a significant (p > 0.05, paired t-test) difference inNF assemblages between 0.5 m and 10 m depths;therefore, average values were used in our results.Water temperature and salinity were measured insitu using a YSI Professional Plus meter at the timeof sample collection.
Epifluorescence microscopy analysis of NF
Samples (100 ml) used to estimate the abundanceof NF were pre-filtered through a nylon mesh (20 µmpore size), then fixed immediately by adding glu-taraldehyde (0.5%, final concentration). Subsamples
192

Lu et al.: Freshwater and mariculture effects on nanoflagellates 193
(20 ml each) were filtered onto polycarbonate blackmembrane filters (0.22 µm pore size) (Millipore) atlow vacuum pressure (<100 mm Hg). After filtration,NF were stained with DAPI for 15 min at a final con-centration of 10 µg ml−1. NF were enumerated at1000× magnification using an epifluorescence micro-scope (Leica DM 4500B). HNF were identified bytheir blue fluorescence under UV illumination, andpigmented nanoflagellates (PNF) were distinguishedby their orange and red autofluorescence under bluelight excitation (Tsai et al. 2010). Length and widthwere measured using Leica DM 4500 software. Toobtain a reliable estimation of abundance, at least100 NF were counted per sample. In this study, NFwere in the size range of 2−10 µm; NF of size range10−20 µm were not found in any samples.
Flow cytometry analysis of bacteria
Bacteria were enumerated by flow cytometry usinga FACS Vantage SE system (Becton Dickinson)equipped with a water-cooled argon laser (488 nm,1 W, Coherent). Heterotrophic bacteria were stainedwith SYBR Green I (Molecular Probes) (final dilution:10−4, v/v) and identified by their green fluorescence(Marie et al. 1997).
Nutrients and chl a biomass
The concentrations of dissolved inorganic nitrogen(DIN; sum of NO3
−, NO2− and NH4
+) and phosphate(PO4
3−) were measured using a Skalar SANplus auto-analyser, following the methods of Hansen & Koro leff
(1999). Seawater used for chl a analysis was filteredthrough GF/F filters (Whatman). Chl a was then mea -sured using a Turner Design fluorometer (10-AU-005-CE) after extraction with 90% acetone at −20°Cfor 24 h in the dark (Parsons et al. 1984). The resultswere calibrated using a pure chl a standard (Sigma).
Enclosure experiments
Three transparent polyethylene bags, each filledwith approximately 1000 l of surface seawater, wereused to establish enclosures at Stn S13 (Fig. 1) inJune 2012. Bags were placed on rafts (with buoys),which provided buoyancy. The bags were sus-pended, and the seawater in the bags was naturallymixed by the wave and flow, thus the seawater inthe bags could be considered to be as homogeneousas the surrounding water. The bags were washed 5times with natural seawater to eliminate externalcontamination prior to the experiment. One bagcontaining merely natural seawater was used as thecontrol. The second bag, into which 13 scallopsChlamys farreri (mean wet weight of 28.2 ± 2.4 gind.−1) with their original attaching plates wereintroduced, was set as the bivalve treatment. Thethird bag served as the macroalgae treatment,where 200 g (wet weight) of G. lema neiformis wasintroduced. The biomass of bivalves and macroalgaeused in the enclosure ex periments was similar to thedensities of local aquaculture practices. The bi -valves and macroalgae were hung using nylonropes to prevent them from touching the bottom andwalls of the bags. During the experiments, bivalvesand macroalgae were cultured in natural seawater
Fig. 1. Sampling stations (d) in Sungo Bay (rightpanel), on the NW coast of the Yellow Sea (left panel).Light grey area marks the macroalgae culture areas(M-area), while the stations outside the light grey areaare the bivalve culture areas (B-area). Enclosure
experiments were conducted at Stn S13 (M)

Aquacult Environ Interact 6: 191–203, 2015
without the artificial food input or nutrient addition.To prevent outside sea water from entering the bags,we set the upper edges of the mouth ~20 cm abovethe sea surface level. The experiment lasted for 7 d,and sampling was performed at approximately10:00 h every day. During the experiment, meantemperature and salinity was 20.38 ± 2.15°C and31.20 ± 0.16 psu, respectively. The NF, bacteria, chla and nutrient measurements were conducted asdescribed in the previous 3 subsections.
Statistical analysis
Differences in physical (temperature), chemical(DIN and PO4
3−) and biological values (chl a, bacte-ria, and NF) between the B-area and M-area wereassessed using a t-test. One-way ANOVA and leastsignificant difference (LSD) test for multiple compari -sons were performed to evaluate the differences inNF or bacterial abundance among different seasons.Pearson correlation analysis was employed to ana-lyse the relationships between all variables in thefield survey. To reveal differences among differentenclosures, all data from the en closure experimentswere analysed with repeated-measures ANOVA. Allanalyses were carried out using the statistical pro-gram SPSS 16.0, with a sig nificance level of 5%.
RESULTS
Spatial variation of environmental factors and NFabundance over 4 seasons
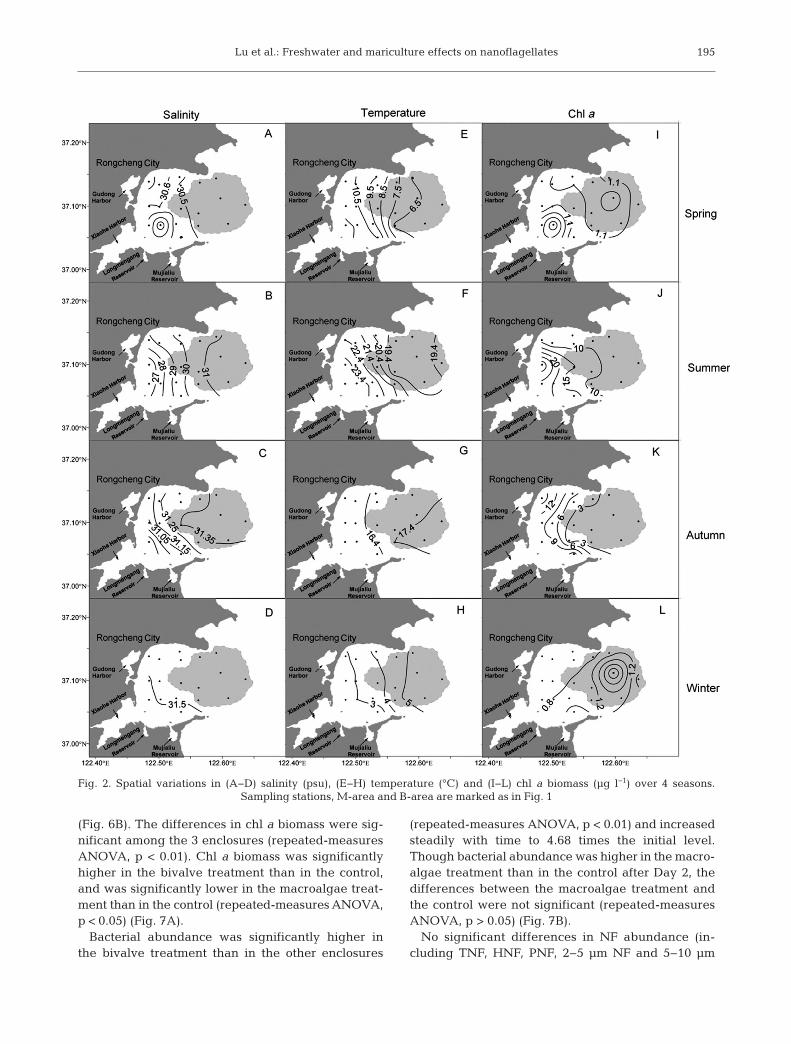
The distribution of salinity was relatively homoge-neous in winter and spring in Sungo Bay, and salinitywas <31 psu in spring. The salinity gradient waslarge in summer but small in autumn (Fig. 2A−D).However, a temperature gradient existed throughoutthe year. In spring and summer, temperature de -creased from the inner bay to outer bay, while inautumn and winter, it increased from the inner tothe outer bay (Fig. 2E−H). The gradient distributionof the chl a biomass appeared in the warm seasonsand increased from the bay mouth to the bay head(Fig. 2J,K). In winter, chl a biomass was high in thebay mouth (Fig. 2L), while in spring high chl a bio-mass was observed in both the bay mouth and thebay head (Fig. 2I).
Total nanoflagellate (TNF) abundance ranged from0.32 × 103 to 171.62 × 10³ cells ml−1 during the studyperiod. A gradient distribution of TNF appeared in
the warm seasons but was relatively homogeneousin the cold seasons (winter and spring) (Fig. 3A−D).PNF contributed 41.50, 65.18, 65.96 and 43.02% ofTNF abundance in spring, summer, autumn and win-ter, respectively. PNF and HNF distributions weresimilar to the distribution of TNF (Fig. 3E−L).
Differences between B-area and M-area
Water temperature was significantly differentbetween the B-area and the M-area over the 4 sea-sons (p < 0.05, t-test) (Table 1). No significant differ-ences were observed regarding the other measuredenvironmental factors (i.e. salinity, chl a, DIN andPO4
3−) between the 2 areas in the cold seasons (p >0.05, t-test) (Table 1). However, in the warm seasons,salinity was significantly lower in the B-area than inthe M-area; the concentrations of nutrients (exceptfor DIN in autumn) and chl a biomass were signifi-cantly higher in the B-area than in the M-area (p <0.05, t-test) (Table 1). Bacterial abundance remainedhigher in the B-area than in the M-area throughoutthe year (p < 0.05, t-test) (Table 1).
According to the presence or absence of pigments,NF were divided into HNF and PNF. The NF commu-nity was dominated by PNF in the warm seasons andHNF in the cold seasons (Fig. 4). The abundances ofTNF, PNF and HNF were significantly higher in theB-area than in the M-area (p < 0.05, t-test) in thewarm seasons, but were similar between the 2 areasduring the cold seasons (p > 0.05, t-test) (Fig. 4). Sizeranges of NF of 2−5 µm and 5−10 µm were distin-guished. NF of both size classes were more abundantin the B-area than in the M-area during the warmseasons (Fig. 5). Both the abundance of NF (TNF,HNF, PNF, 2−5 µm NF and 5−10 µm NF; Figs. 4 & 5)and bacteria (Table 1) showed a significant (p < 0.05)seasonal variation, with the lowest value in winterand highest value in summer.
Variations in NF, nutrients, chl a and bacteria inexperimental enclosures
DIN concentrations were not significantly differentamong the 3 enclosures (repeated-measures ANOVA,p > 0.05) (Fig. 6A). Compared with other enclosures,the concentration of PO4
3− was significant higherin the bivalve treatment (repeated-measures ANOVA,p < 0.01). However, no significant differences (re -peated-measures ANOVA, p > 0.05) were detectedbetween the macroalgae treatment and the control
194
Lu et al.: Freshwater and mariculture effects on nanoflagellates
(Fig. 6B). The differences in chl a biomass were sig-nificant among the 3 enclosures (repeated-measuresANOVA, p < 0.01). Chl a biomass was significantlyhigher in the bivalve treatment than in the control,and was significantly lower in the macroalgae treat-ment than in the control (repeated-measures ANOVA,p < 0.05) (Fig. 7A).
Bacterial abundance was significantly higher inthe bivalve treatment than in the other enclosures
(re peated-measures ANOVA, p < 0.01) and increasedsteadily with time to 4.68 times the initial level.Though bacterial abundance was higher in the macro -algae treatment than in the control after Day 2, thedifferences between the macroalgae treatment andthe control were not significant (repeated-measuresANOVA, p > 0.05) (Fig. 7B).
No significant differences in NF abundance (in -cluding TNF, HNF, PNF, 2−5 µm NF and 5−10 µm
195
Fig. 2. Spatial variations in (A−D) salinity (psu), (E−H) temperature (°C) and (I−L) chl a biomass (µg l−1) over 4 seasons. Sampling stations, M-area and B-area are marked as in Fig. 1

Aquacult Environ Interact 6: 191–203, 2015
NF) were detected among the 3 enclosures (re -peated-measures ANOVA, p > 0.05). However, theeffect of time on NF abundances was significant(Day × Treatment, p > 0.05). The abundance ofTNF, HNF, PNF and 2−5 µm NF were clearlyhigher in the bivalve treatment than in the other 2enclosures during the last 3 d. However, no obviousdifferences in the 5−10 µm NF were found among
the 3 enclosures even during the last 3 d, indicatingthat the increased abundance of NF in the bivalvetreatment was the result of an increased abundanceof 2−5 µm NF. No obvious differences were foundwith respect to the NF (TNF, HNF, PNF, 5−10 µmNF and 2−5 µm NF) abundance between thecontrol and the macroalgae treatment in the last3 d (Figs. 8 & 9).
196
Fig. 3. Spatial variations in (A−D) total nanoflagellate (TNF) abundance, (E−H) heterotrophic nanoflagellate (HNF) abundanceand (I−L) pigmented nanoflagellate (PNF) abundance (all: ×103 cells ml−1) over 4 seasons. Sampling stations, M-area and
B-area are marked as in Fig. 1

Lu et al.: Freshwater and mariculture effects on nanoflagellates 197
Fig. 4. Mean (+SD) abundance of (A) total nanoflagellate(TNF), (B) heterotrophic nanoflagellate (HNF) and (C) pig-mented nanoflagellate (PNF) in the B-area and M-area (seeFig. 1). *Significant difference (p < 0.05, t-test) between the2 areas in the same season. Different uppercase and lower-case letters indicate significant (p < 0.05) differences among
4 seasons for B-area and M-area, respectively
Fig. 5. Mean (+SD) abundance of (A) 2−5 µm nanoflagel-lates (NF) and (B) 5−10 µm NF in the B-area and M-area (seeFig. 1). *Significant difference (p < 0.05, t-test) between the2 areas in the same season. Different uppercase and lower-case letters indicate significant (p < 0.05) differences among
4 seasons for B-area and M-area, respectively
Sp
rin
gS
um
mer
Au
tum
nW
inte
rM
-are
aB
-are
aD
iff.
M-a
rea
B-a
rea
Dif
f.M
-are
aB
-are
aD
iff.
M-a
rea
B-a
rea
Dif
f.
Tem
per
atu
re (
°C)
7.40
± 1
.56
10.5
8 ±
1.0
2*
19.4
9 ±
1.0
622
.73
± 1
.30
*17
.25
± 0
.26
15.9
1 ±
0.4
9*
4.89
± 0
.66
2.95
± 0
.79
*S
alin
ity
(psu
)30
.46
± 0
.06
30.5
6 ±
0.1
530
.87
± 0
.63
28.3
1 ±
1.5
5*
31.3
6 ±
0.0
231
.06
± 0
.23
*31
.55
± 0
.01
31.5
0 ±
0.0
8C
hl
a(µ
g l
−1 )
1.24
± 0
.31
1.30
± 0
.73
9.23
± 3
.31
18.1
7 ±
11.
23*
1.38
± 1
.21
10.2
0 ±
5.2
9*
1.17
± 0
.72
0.71
± 0
.30
DIN
(µ
M)
19.2
9 ±
7.9
513
.4 ±
6.2
110
.05
± 4
.84
20.9
8 ±
12.
29*
50.8
4 ±
41.
9626
.48
± 3
1.35
ns
22.9
2 ±
7.7
318
.40
± 6
.95
PO
43−(µ
M)
0.26
± 0
.19
0.36
± 0
.21
0.10
± 0
.04
0.14
± 0
.06
*0.
03 ±
0.0
20.
08 ±
0.0
5*
0.05
± 0
.06
0.05
± 0
.01
Bac
teri
a (×
106
cell
s m
l−1 )
1.28
± 0
.37
1.83
± 0
.15
*2.
45 ±
0.9
05.
17 ±
1.2
8*
0.82
± 0
.32
3.30
± 1
.47
*0.
27 ±
0.0
50.
33 ±
0.0
6*
Tab
le 1
. C
omp
aris
on o
f en
viro
nm
enta
l fa
ctor
s an
d b
acte
rial
ab
un
dan
ce (
mea
n ±
SD
) in
th
e b
ival
ve (
B-a
rea)
an
d m
acro
alg
ae c
ult
ure
are
as (
M-a
rea)
. *S
ign
ific
ant
dif
fere
nce
(D
iff.
; p
< 0
.05,
t-t
est)
bet
wee
n t
he
2 ar
eas.
DIN
: dis
solv
ed in
org
anic
nit
rog
en; n
s: n
ot s
ign
ific
ant

Aquacult Environ Interact 6: 191–203, 2015
DISCUSSION
In this study, a field survey was carried out to revealrelationships between NF and environmental factors;enclosure experiments in situ were conducted to studythe effects of mariculture on NF. The aim was toassess the possible effects of environmental factorsand mariculture on the spatial distribution of NF inSungo Bay.
Comparison with other bays in East Asia
During the study period, NF abundance in SungoBay varied from 0.32 × 10³ to 171.62 × 10³ cells ml−1
(Fig. 3A−D), which was within the typical range forNF in planktonic ecosystems (102−105 cells ml−1) (Lee& Patterson 2002, Huang et al. 2008). However, NFwere more abundant in Sungo Bay than in the openwaters of the Yellow Sea, except in winter, when thewater temperature was lower in Sungo Bay than inthe open water (Lin 2012). Interestingly, althoughSungo Bay is a phosphorus (P)-deficient system(Sun et al. 2007), NF abundance levels in Sungo Bayappeared to be higher than in other eutrophic bays inEast Asia, except for Funka Bay, which was sampledduring a spring pre-bloom period for phytoplankton(Table 2) (Lee et al. 2001, Choi et al. 2003, Kamiyama2004, Yang et al. 2008). The higher abundance of NFin Sungo Bay may relate to both the specific environ-mental conditions and mariculture in the bay.
198
Fig. 6. Variations in concentrations of (A) dissolved inor-ganic nitrogen (DIN) and (B) PO4
3− in the enclosure experi-ments over time
Fig. 7. Variations in (A) chl a biomass and (B) bacterial abun-dance in the enclosure experiments over time
Fig. 8. Variations in abundance of (A) heterotrophic nano-flagellates (HNF), (B) pigmented nanoflagellates (PNF) and(C) total nanoflagellates (TNF) in the enclosure experiments
over time

Lu et al.: Freshwater and mariculture effects on nanoflagellates
Temperature limitation in winter
Water temperature characterised the seasonal pat-tern of NF by affecting physiological processes aswell as food density (Weisse 1991, 1997, Hansen &Christoffersen 1995, Zhao et al. 2003). When theabundance of bacteria approaches a threshold of 3 ×10⁵ cells ml−1, the effective grazing of NF is limited(Berninger et al. 1991). In winter, both in the B-area(3.28 × 10⁵ ± 0.63 × 10⁵ cells ml−1) and M-area (2.67 ×10⁵ ± 0.46 × 10⁵ cells ml−1), bacterial abundance wasnear the threshold density of effective grazing for NF,and thus, NF in both areas likely faced a shortage offood. Therefore, we speculate that the lack of a sig-nificant difference in NF abundance between the
B-area and M-area in winter is probably due to thelow temperature (<5°C average), which limits thegrowth of bacteria (Tsai et al. 2005).
Effects of freshwater input on distribution of NF
Together with water temperature, salinity is alsoused as an indicator of different water masses (withdifferent nutrient levels) when analysing the spatialdistribution of NF (Sherr et al. 1988, Andersson et al.1994, Vázquez-Domínguez et al. 2012, Lin et al.2014). However, Sungo Bay is a shallow bay with anaverage depth of 7.5 m (Zhang et al. 2009). Surfacewater temperature in the shallow system is mainlycontrolled by air temperature and solar heat gainrather than water mass interactions. Therefore, weused salinity as the only indicator of freshwater dis-charge in this study. Freshwater influenced SungoBay mainly in the warm seasons (Fig. 2A−D). Salinityin the spring was <31 psu (Fig. 2A), most likely dueto several rain events prior to sampling.
Sungo Bay is a P-deficient and nitrogen-eutrophicsystem (Sun et al. 2007), where the growth of osmo -trophic organisms (bacteria and autotrophic PNF)may depend on P concentration rather than DIN.Both in summer and autumn, Sungo Bay experienceda freshwater influx (Fig. 2B,C), and the abundance ofboth NF and bacteria were negatively related tosalinity (Table 3). Freshwater may bring a certainamount of terrestrial nutrients, which likely re -sulted in higher PO4
3− concentrations in the B-area(Table 1). It has been reported that higher nutrientsupplies might result in a higher abundance of NF(Safi & Hall 1997, Huang et al. 2008, Tsai et al. 2010).Therefore, freshwater input in the warm seasons mayhave caused higher TNF abundance in the B-areathan in the M-area (Fig. 4).
However, the correlation between salinity andnutrients was not significant (Table 3), which waslikely due to the patchy distribution of bivalves in the
199
Study area Location Study period Nanofla- Abundance Referencegellates (×103 cells ml−1)
Gyeonggi Bay Middle northern region of Yellow Sea, Korea Jan 1997−Dec 1999 HNF 1.94 Yang et al. (2008)Masan Bay Southern coast of Korea Aug 1999 HNF 1.04 ± 0.72 Choi et al. (2003)Funka Bay SW of Hokkaido, Japan Mar 1999 HNF 2.86 Lee et al. (2001)Hiroshima Bay Seto Inland Sea, Japan Jun−Jul 1995 HNF 0.52−11.06 Kamiyama (2004)Sungo Bay NW coast of Yellow Sea, China Apr 2011−Jan 2012 HNF 3.77 ± 6.00 This study
PNF 8.73 ± 19.46 This study
Table 2. Comparison of nanoflagellate abundances in Sungo Bay with those reported in other bays. HNF: heterotrophic nanoflagellates, PNF: pigmented nanoflagellates
Fig. 9. Variations in abundance of (A) 5−10 µm nanoflagel-lates (NF) and (B) 2−5 µm NF in the enclosure experiments
over time

Aquacult Environ Interact 6: 191–203, 2015
bay. Nutrients released by the bivalves might lowerthe correlation between salinity and nutrient concen-trations. The correlations between bacteria and NFabundances and nutrient concentrations were alsonot significant (Table 3), likely because the bivalves’grazing may have had effects on the abundance ofbacteria and NF. In sum, the spatial variations ofthe NF in Sungo Bay could not be only attributed tothe influence of freshwater discharge.
Effects of nutrient release and grazing of bivalveson NF
In fact, the nutrient release by bivalves plays animportant role in aquaculture areas (Carlsson etal. 2012, Cranford et al. 2012) and has been usedto explain the predominance of bacteria, autotrophicflagellates and picoeukaryotes in areas of intensebivalve farming (Dupuy et al. 2000a). Bacterialgrowth is known to be stimulated by phosphate addi-tion when ambient phosphate concentration drops<0.1 µM (Morris & Lewis 1992, Carlsson & Caron2001). With bacterivores and autotrophic PNF beingthe predominant assemblages in the 2–5 µm NF(Unrein et al. 2007, Jürgens et al. 2008, Tsai et al.2011), nutrient excretion (mainly P) by bivalves mayincrease the abundance of 2–5 µm NF either directlyby increasing the abundance of autotrophic NF orindirectly by increasing the prey of bacterivorous NF.The abundance of 2–5 µm NF contributed ~90% ofthe TNF abundance (data not shown) in our studyand bivalve cultivation substantially increased theconcentration of PO4
3– (Fig. 6B). Thus, we suggest thatthe release of P by bivalves may have caused the ele-
vated abundance of TNF observedduring the last 3 d of our enclosureexperiment.
Based on microscopic observations,~7 µm NF dominated in 5−10 µm NF,and >3 µm NF dominated in 2−5 µmNF in this study. The size ratio be -tween protist predators and their optimal prey is suggested to be 3:1(Hansen et al. 1994). Therefore, themain predator of 2−5 µm NF may be aprotist >10 µm in size, and the mainpredator of 5−10 µm NF may be a pro-tist >20 µm.
Bivalves cannot efficiently filterpico plankton (Kach & Ward 2008),and their re tention efficiency de -creases with de creasing particle size
(Charles et al. 1999). Further, small flagellates(<5 µm) are poorly retained compared to protistswith a size >5 µm (Dupuy et al. 2000b). In SungoBay, the retention rate of scallops Chlamys farreriwas 8% on 2 µm particles and 45% on 8 µm parti-cles, and the retention rate dropped with de creasingparticle size (Zhang et al. 2010). Therefore, thefeeding selectivity of the bivalves probably re lievedthe grazing pressure of <5 µm NF. This may explainwhy the abundance of 2−5 µm NF increased in thebivalve enclosure experiment, while 5−10 µm NFremained relatively stable over time in the sameenclosure (Fig. 9).
Though no significant differences in NF abun-dance were found among the 3 enclosures (repeated-measures ANOVA, p > 0.05), NF abundance in thebivalve treatment increased during the last 3 d. Theenclosure experiments were maintained for only 7 d,but our results are similar to a 1 yr long experimentconducted by Dupuy et al. (2000a) in an oyster farming pond, where <5 µm NF developed at a moreintense rate than in the control pond (without oys-ters). Therefore, it would be reasonable to expectthat NF abundance might remain higher in the bi -valve enclosure than other enclosures for a longerperiod of time.
The optimal temperature for C. farreri is between19 and 22°C, and the scallop stops growing ataround 4°C (Yang et al. 1999, Zhang et al. 2004).Though the enclosure experiments were con-ducted only in summer, it would be reasonable toexpect that the feeding and P-release of the bivalveswould be significantly greater in summer and au -tumn (15.5−23.8°C) than in spring and winter (2.2−10.6°C).
200
Bacteria Chl a PO43– DIN Salinity
Spring TNF 0.405 0.611** 0.224 −0.169 0.125Bacteria – 0.186 −0.057 −0.153 0.483*Salinity 0.483* 0.086 −0.013 −0.295 –
Summer TNF 0.645** 0.681** −0.061 0.382 −0.784**Bacteria – 0.729** 0.032 0.445 −0.829**Salinity −0.829** −0.859** −0.005 −0.424 –
Autumn TNF 0.967** 0.929** 0.351 −0.270 −0.893**Bacteria – 0.940** 0.371 −0.228 −0.944**Salinity −0.944** −0.805** −0.290 0.169 –
Winter TNF −0.106 0.110 −0.073 −0.142 0.038Bacteria – −0.148 −0.216 −0.234 −0.216Salinity −0.216 −0.001 0.038 0.300 –
Table 3. Correlations between total nanoflagellate (TNF) abundance, bacterialabundance and salinity and other factors in Sungo Bay in the 4 seasons. DIN:dissolved inorganic nitrogen. Correlation is significant (in bold) at *the 0.05
level (2-tailed) or **the 0.01 level (2-tailed)

Lu et al.: Freshwater and mariculture effects on nanoflagellates
Effects of macroalgae on NF
Bacteria and macroalgae competed with phyto-plankton for nutrients (Sfriso & Pavoni 1994, Peder-sen & Borum 1996, Passow et al. 2007, Thingstad etal. 2007, Thingstad & Cuevas 2010). The introductionof macroalgae enhanced the competition for P, andthis was confirmed by the decrease in chl a biomassin the macroalgae enclosure (Fig. 7A). The competi-tion for limited P among different taxonomic groupsmay limit the use of DIN. Though the DOC releasedby macroalgae is available for bacterial growth(Hatcher et al. 1977, Pregnall 1983), the P deficiencymay limit the increase in bacterial abundance evenin the presence of excess DOC. The P deficiency andthe insignificant increase of bacteria may explain thelack of a significant difference in NF abundancebetween the macroalgae treatment and the control.Overall, at least in summer, NF abundance should behigher in the B-area than in the M-area if the impactsof mariculture are considered individually.
In conclusion, both freshwater input and maricul-ture of bivalves and magroalgae are likely importantfactors influencing the spatial distribution of NF inwarm seasons in Sungo Bay.
Acknowledgements. This study was supported by theNational Key Programme for Developing Basic Sciences ofChina (No. 2011CB409804) and National Natural ScienceFoundation of China (No. 41376131). We thank Kuo-PingChiang (National Taiwan Ocean University) for his use -ful suggestions and comments. We also express our deepgratitude to Xiao Ma for her hard work in data input.
LITERATURE CITED
Andersson A, Haecky P, Hagström Å (1994) Effect of tem-perature and light on the growth of micro-, nano- andpico-plankton: impact on algal succession. Mar Biol 120: 511−520
Armstrong E, Rogerson A, Leftley JW (2000) Utilisation ofseaweed carbon by three surface-associated hetero -trophic protists, Stereomyxa ramosa, Nitzschia alba andLabyrinthula sp. Aquat Microb Ecol 21: 49−57
Bacher C, Grant J, Hawkins AJS, Fang J, Zhu M, Besnard M(2003) Modelling the effect of food depletion on scallopgrowth in Sungo Bay (China). Aquat Living Resour 16: 10−24
Berninger UG, Finlay BJ, Kuuppo-Leinikki P (1991) Proto-zoan control of bacterial abundances in freshwater. Limnol Oceanogr 36: 139−147
Brek-Laitinen G, Ojala A (2011) Grazing of heterotrophicnanoflagellates on the eukaryotic picoautotroph Chori-cystis sp. Aquat Microb Ecol 62: 49−59
Calbet A, Landry MR, Nunnery S (2001) Bacteria-flagellateinteractions in the microbial food web of the oligotrophicsubtropical North Pacific. Aquat Microb Ecol 23: 283−292
Carlsson P, Caron DA (2001) Seasonal variation of phospho-rus limitation of bacterial growth in a small lake. LimnolOceanogr 46: 108−120
Carlsson MS, Engström P, Lindahl O, Ljungqvist L, PetersenJK, Svanberg L, Holmer M (2012) Effects of mussel farmson the benthic nitrogen cycle on the Swedish west coast.Aquacult Environ Interact 2: 177−191
Chan YF, Tsai AY, Chiang KP, Hsieh C (2009) Pigmentednanoflagellates grazing on Synechococcus: seasonal varia -tions and effect of flagellate size in the coastal ecosystemof subtropical western Pacific. Microb Ecol 58: 548−557
Charles F, Amouroux JM, Gremare A (1999) Comparativestudy of the utilization of bacteria and microalgae by thesuspension-feeding bivalve: Callista chione. J Mar BiolAssoc UK 79: 577−584
Choi DH, Hwang CY, Cho BC (2003) Comparison of virus-and bacterivory-induced bacterial mortality in the eu -trophic Masan Bay, Korea. Aquat Microb Ecol 30: 117–125
Christaki U, Vázquez-Domínguez E, Courties C, Lebaron P(2005) Grazing impact of different heterotrophic nano-flagellates on eukaryotic (Ostreococcus tauri) and pro -karyotic picoautotrophs (Prochlorococcus and Synecho -coccus). Environ Microbiol 7: 1200−1210
Cranford PJ, Kamermans P, Krause G, Mazurié J and others(2012) An ecosystem-based approach and managementframework for the integrated evaluation of bivalve aquaculture impacts. Aquacult Environ Interact 2: 193−213
Dupuy C, Le Gall S, Hartmann HJ, Bréret M (1999) Re -tention of ciliates and flagellates by the oyster Crass-ostrea gigas in French Atlantic coastal ponds: protistsas a trophic link between bacterioplankton and benthicsuspension-feeders. Mar Ecol Prog Ser 177: 165−175
Dupuy C, Pastoureaud A, Ryckaert M, Sauriau PG, Mon-tanié H (2000a) Impact of the oyster Crassostrea gigason a microbial community in Atlantic coastal ponds nearLa Rochelle. Aquat Microb Ecol 22: 227−242
Dupuy C, Vaquer A, Lam-Höai T, Rougier C and others(2000b) Feeding rate of the oyster Crassostrea gigas ina natural planktonic community of the MediterraneanThau Lagoon. Mar Ecol Prog Ser 205: 171−184
Dupuy C, Ryckaert M, Le Gall S, Hartmann H (2007) Sea-sonal variations in planktonic community structure andproduction in an Atlantic coastal pond: the importance ofnanoflagellates. Microb Ecol 53: 537−548
Fang J, Sun H, Yan J, Kuang S, Li F, Newkirk GF, Grant J(1996) Polyculture of scallop Chlamys farreri and kelpLaminaria japonica in Sungo Bay. Chin J Oceanol Limnol14: 322−329
Granda AP, Anadón RA (2008) The annual cycle of nano-flagellates in the Central Cantabrian Sea (Bay of Biscay).J Mar Syst 72: 298−308
Hansen B, Christoffersen K (1995) Specific growth rates ofheterotrophic plankton organisms in a eutrophic lakeduring a spring bloom. J Plankton Res 17: 413−430
Hansen HP, Koroleff F (1999) Determination of nutrients.In: Grasshoff K, Kremling K, Ehrhardt M (eds) Methodsof seawater analysis, 3rd edn. Wiley-VCH, Weinheim,p 162−226
Hansen B, Bjørnsen PK, Hansen PJ (1994) The size ratiobetween planktonic predators and their prey. LimnolOceanogr 39: 395−403
Hatcher B, Chapman AO, Mann K (1977) An annual carbonbudget for the kelp Laminaria longicruris. Mar Biol 44: 85−96
201

Aquacult Environ Interact 6: 191–203, 2015
Huang B, Lan W, Cao Z, Dai M, Huang L, Jiao N, Hong H(2008) Spatial and temporal distribution of nanoflagel-lates in the northern South China Sea. Hydrobiologia605: 143−157
Jürgens K, Massana R, Kirchman D (2008) Protist grazing onmarine bacterioplankon. In: Kirchman DL (eds) Micro-bial ecology of the oceans, 2nd edn. Wiley-Liss, NewYork, NY, p 383−442
Kach DJ, Ward JE (2008) The role of marine aggregates inthe ingestion of picoplankton-size particles by suspen-sion-feeding molluscs. Mar Biol 153: 797−805
Kamiyama T (2004) The microbial loop in a eutrophic bayand its contribution to bivalve aquaculture. Bull Fish ResAgency (Jpn) (Suppl 1): 41−50
Kong F, Yu R, Zhang Q, Wang Y, Yan T, Zhou M (2012) Pri-mary analyses on the causative species of a bloom in theSanggou Bay. Mar Environ Sci 31: 824−829 (in Chinesewith English abstract)
Kreeger DA, Newell RIE (1996) Ingestion and assimilationof carbon from cellulolytic bacteria and heterotrophic flagellates by the mussels Geukensia demissa and Mytilusedulis (Bivalvia, Mollusca). Aquat Microb Ecol 11: 205−214
Kuuppo P (1994) Annual variation in the abundance andsize of heterotrophic nanoflagellates on the SW coast ofFinland, the Baltic Sea. J Plankton Res 16: 1525−1542
Lee W, Patterson D (2002) Abundance and biomass of het-erotrophic flagellates, and factors controlling their abun-dance and distribution in sediments of Botany Bay.Microb Ecol 43: 467−481
Lee CW, Kudo I, Morishita H, Yanada M, Maita Y (2001)Examining the relationship between bacteria and het-erotrophic nanoflagellates in Funka Bay (Japan) usingthe size-fractionation method. Aquat Ecol 35: 1−8
Le Gall S, Hassen MB, Le Gall P (1997) Ingestion of a bac-terivorous ciliate by the oyster Crassostrea gigas: proto-zoa as a trophic link between picoplankton and benthicsuspension-feeders. Mar Ecol Prog Ser 152: 301−306
Lin S (2012) Ecological studies on the nanoflagellates inthe Yellow Sea and East China Sea. PhD dissertation,Xiamen University (in Chinese with English abstract)
Lin S, Huang L, Lu J (2014) Weak coupling between hetero-trophic nanoflagellates and bacteria in the Yellow SeaCold Water Mass area. Acta Oceanol Sin 33: 125−132
Lucas MI, Newell RC, Velimirov B (1981) Heterotrophic util-isation of mucilage released during fragmentation ofkelp (Ecklonia maxima and Laminaria pallida). II. Differ-ential utilisation of dissolved organic components fromkelp mucilage. Mar Ecol Prog Ser 4: 43−55
Mao Y, Zhou Y, Yang H, Wang R (2006) Seasonal variationin metabolism of cultured pacific oyster Crassostrea gigasin Sanggou Bay, China. Aquaculture 253: 322−333
Marie D, Partensky F, Jacquet S, Vaulot D (1997) Enumera-tion and cell cycle analysis of natural populations of marine picoplankton by flow cytometry using the nucleicacid stain SYBR Green I. Appl Environ Microbiol 63: 186−193
McKee MP, Ward JE, MacDonald BA, Holohan BA (2005)Production of transparent exopolymer particles (TEP) bythe eastern oyster Crassostrea virginica. Mar Ecol ProgSer 288: 141−149
Morris DP, Lewis WM (1992) Nutrient limitation of bac -terioplankton growth in Lake Dillon, Colorado. LimnolOceanogr 37: 1179−1192
Nunes J, Ferreira J, Gazeau F, Lencart-Silva J, Zhang X,Zhu M, Fang J (2003) A model for sustainable manage-
ment of shellfish polyculture in coastal bays. Aqua culture219: 257−277
Parsons TR, Maita Y, Lalli CM (1984) A manual of chemicaland biological methods for seawater analysis. PergamonPress, Oxford
Passow U, De La Rocha CL, Arnosti C, Grossart HP, MurrayAE, Engel A (2007) Microbial dynamics in autotrophicand heterotrophic seawater mesocosms. I. Effect ofphytoplankton on the microbial loop. Aquat Microb Ecol49: 109−121
Pedersen MF, Borum J (1996) Nutrient control of algalgrowth in estuarine waters. Nutrient limitation and theimportance of nitrogen requirements and nitrogen stor-age among phytoplankton and species of macroalgae.Mar Ecol Prog Ser 142: 261−272
Pregnall A (1983) Release of dissolved organic carbon fromthe estuarine intertidal macroalga Enteromorpha pro -lifera. Mar Biol 73: 37−42
Safi KA, Hall JA (1997) Factors influencing autotrophic andheterotrophic nanoflagellate abundance in five watermasses surrounding New Zealand. N Z J Mar FreshwRes 31: 51−60
Sanders RW, Berninger UG, Lim EL, Kemp PF, Caron DA(2000) Heterotrophic and mixotrophic nanoplankton pre-dation on picoplankton in the Sargasso Sea and onGeorges Bank. Mar Ecol Prog Ser 192: 103−118
Sfriso A, Pavoni B (1994) Macroalgae and phytoplanktoncompetition in the central Venice lagoon. Environ Technol15: 1−14
Sherr EB (1988) Direct use of high molecular weight poly-saccharide by heterotrophic flagellates. Nature 335: 348−351
Sherr BF, Sherr EB, Rassoulzadegan F (1988) Rates of di -gestion of bacteria by marine phagotrophic protozoa: temperature dependence. Appl Environ Microbiol 54: 1091−1095
Sieburth JMN (1969) Studies on algal substances in the sea.III. The production of extracellular organic matter by littoral marine algae. J Exp Mar Biol Ecol 3: 290−309
Sun P, Zhang Z, Hao L, Wang B, Wang Z (2007) Analysis ofnutrient distributions and potential eutrophication inseawater of the Sangou Bay. Adv Mar Sci 25: 436−455(in Chinese with English abstract)
Thingstad TF, Cuevas LA (2010) Nutrient pathways throughthe microbial food web: principles and predictability discussed, based on five different experiments. AquatMicrob Ecol 61: 249−260
Thingstad TF, Havskum H, Zweifel UL, Berdalet E and others (2007) Ability of a ‘minimum’ microbial food webmodel to reproduce response patterns observed in enclo-sures manipulated with N and P, glucose, and Si. J MarSyst 64: 15−34
Tsai AY, Chiang KP, Chang J, Gong GC (2005) Seasonaldiel variations of picoplankton and nanoplankton in asubtropical western Pacific coastal ecosystem. LimnolOceanogr 50: 1221−1231
Tsai AY, Gong GC, Sanders RW, Wang CJ, Chiang KP (2010)The impact of the Changjiang River plume extension onthe nanoflagellate community in the East China Sea.Estuar Coast Shelf Sci 89: 21−30
Tsai AY, Gong GC, Sanders RW, Chen WH, Chao CF, Chi-ang KP (2011) Importance of bacterivory by pigmentedand heterotrophic nanoflagellates during the warm sea-son in a subtropical western Pacific coastal ecosystem.Aquat Microb Ecol 63: 9−18
202

Lu et al.: Freshwater and mariculture effects on nanoflagellates
Unrein F, Massana R, Alonso-Sáez L, Gasol JM (2007) Significant year-round effect of small mixotrophic flagellates on bacterioplankton in an oligotrophic coastalsystem. Limnol Oceanogr 52: 456−469
Vázquez-Domínguez E, Vaqué D, Gasol JM (2012) Temper-ature effects on the heterotrophic bacteria, heterotrophicnanoflagellates, and microbial top predators of the NWMediterranean. Aquat Microb Ecol 67: 107−121
Weisse T (1991) The annual cycle of heterotrophic fresh-water nanoflagellates: role of bottom-up versus top-down control. J Plankton Res 13: 167−185
Weisse T (1997) Growth and production of heterotrophicnanoflagellates in a meso-eutrophic lake. J Plankton Res19: 703−722
Yang HS, Zhang T, Wang J, Wang P, He YC, Zhang FS (1999)Growth characteristics of Chlamys farreri and its relationwith environmental factors in intensive raft-culture areasof Sishiliwan bay, Yantai. J Shellfish Res 18: 71−76
Yang EJ, Choi JK, Hyun JH (2008) Seasonal variation in thecommunity and size structure of nano- and microzoo-plankton in Gyeonggi Bay, Yellow Sea. Estuar Coast
Shelf Sci 77: 320−330Zhang ZH, Fang JG, Hawkins AJS, Pascoe PL (2004) The
effect of temperature on clearance rate and oxygen con-sumption of scallops, Chlamys farreri. J Shellfish Res 23: 715−721
Zhang J, Hansen PK, Fang J, Wang W, Jiang Z (2009)Assessment of the local environmental impact of inten-sive marine shellfish and seaweed farming—applicationof the MOM system in the Sungo Bay, China. Aquacul-ture 287: 304−310
Zhang J, Fang J, Liang X (2010) Variations in retention effi-ciency of bivalves to different concentrations and organiccontent of suspended particles. Chin J Oceanol Limnol28: 10−17
Zhao J, Zhou SL, Sun Y, Fang JG (1996) Research on Sang-gou Bay aquaculture hydro-environment. Mar Fish Res17: 68−79 (in Chinese with English abstract)
Zhao Y, Yu Y, Feng W, Shen Y (2003) Growth and produc-tion of free-living heterotrophic nanoflagellates in aeutrophic lake—Lake Donghu, Wuhan, China. Hydro -biologia 498: 85−95
203
Editorial responsibility: Gianluca Sara, Palermo, Italy
Submitted: January 27, 2014; Accepted: December 19, 2014Proofs received from author(s): February 22, 2015


