
Earnings Release 4Q / 12M 2016
Strong top line growth and improved EBITDA margin drive higher
dividend payout ratio in 2016
AIRO, March 13, 2017 ― Oriental Weavers Carpet Company [ORWE EY;
ORWE.CA], one of the world’s largest machine-made rug and carpet manufacturers,
reported today its financial results for FY 2016 ended December 31, 2016.
A message from our founder, Mr Mohamed Farid Khamis, to shareholders:
“Congratulations to OW members and shareholders for the success achieved in 4Q 2016 and
throughout the year. I am delighted to report that EBITDA margin achieved in FY 2016 is the
strongest seen over the last 9 years and wish to thank our teams across all departments for
their ongoing efforts in achieving this. Locally, net sales were 14% higher y-o-y in 2016 with
Q4 local revenues up 30%. With our export performance in dollar terms continuing to recover
and our successful response to the floating of the EGP locally, further growth in 2017 looks
assured. Orders are in hand from top customers, new clients are lined up and opportunities to
expand online sales continue: the results should be reflected in our numbers in the second half
of 2017. Meanwhile, our new collection received overwhelmingly positive feedback during
the Domotex fair in Germany, nine new weaving looms were acquired in 2016 and we plan to
add a further eleven looms in Egypt in 2017 to meet local and international demand. In light
of 2016 earnings figures and the estimated growth in 2017, our BoD proposes a per share
dividend of EGP1.4, implying a yield of 8%. We face 2017 with confidence and a vision of
continued growth, innovation and commitment to quality produce and service.”
4Q 2016 vs 4Q 2015 (reported)
C
Sales (EGP mn)
2,233 ▲63%
EBITDA (EGP mn)
351 ▲110%
Net Income
(EGP mn)
89
▲42%
Export Contribution
64%
EBITDA Margin
15.7% ▲356 bps
Proposed Annual DPS
EGP 1.4 ▲180%

4Q 2016 Earnings Release | Page 2
Egypt45%
US31%
Europe
17%
Others7%
Our strategy towards the flexible exchange rate policy
Following the floatation of the Egyptian pound in November 2016, we
formulated a new pricing policy where we passed on the higher dollar cost of
our USD raw materials to consumers in the local market, thereby maintaining
our profitability levels. On the export front, we have slightly adjusted our selling
prices. We are, in addition, looking at raising our export exposure (55% as of
December 31, 2016) to secure foreign currency, increasing our receipts from
export subsidies and ensuring full utilization of our machinery. As regards debt
levels, we managed to settle a portion of our EGP debt facilities to avoid high
finance costs resulting from increased interest rates.
For purposes of comparison, we have adjusted in this earnings release Oriental
Weavers’ income statements for 9M 2015 and FY 2015 to account for the
merger of Oriental Weavers Textiles (OWT) with Rosetex for Spinning and
Weaving (an almost 100%-owned subsidiary of Oriental Weavers Carpets) that
took place in 3Q 2016.
Revenue performance overview
The Group recorded a net sales figure of EGP 2,233 million in 4Q 2016,
representing growth of 63% over EGP 1,374 million in the comparable quarter of
2015. The primary driving factors were a 30% y-o-y growth in local sales, and
90% growth in exports compared to the adjusted figures of 4Q 2015.
Revenues in FY 2016 came to EGP 6,779 million, with a growth of 17% vs FY
2015 adjusted figures. Local sales were up by 14% while exports grew 20% in FY
2016.
2016 Revenue Performance by Region
▲4% ▲31%
▲14% ▲19%
Asia
▲39% Russia & China
▼13%
Arab Countries ▲81% Africa
Revenue Contribution by Market in 2016
* The three key markets are Egypt, the US & Canada, and Europe. ** We adjusted 2015 figures by including Oriental Weavers Textiles’ exports by
region

4Q 2016 Earnings Release | Page 3
622 810
2,6
55 3,0
34
4Q15 4Q16 FY15 FY16
Local Sales(EGP mn)
Segment Reporting
Local sales As a result of the implemented price increase and volume growth, our local net
sales reported significant growth of 30% in 4Q 2016 compared to the same quarter
of 2015, to EGP 810 million. This followed a 3% growth in sales volumes coupled
with the higher average selling prices resulting from our passing on of the
increased dollar cost after the floatation of the Egyptian pound. On a full year
basis, local revenues were up 14% with volumes growing by 5%.
On a segment basis, our woven, tufted and non-woven products showed 45%,
68% and 64% y-o-y growth in local sales value respectively in 4Q 2016.
Sales in our showrooms demonstrated growth of 60% y-o-y this quarter, and
wholesale figures grew by 3%. Approximately 44% of local revenue during 4Q
2016 came from our network of over 230 stores across Egypt. Our showroom
network continues to grow: three new facilities were added in 2016 and so far in
1Q 2017 we have opened two showrooms in Luxor and a town in Dakahlia. We
plan to open four further showrooms in heavily populated areas in the Nile Delta
governorates and Upper Egypt this year.
As in previous quarters, the hospitality segment continues to display strong
growth of 203% y-o-y in 4Q 2016, arising from 13 projects spread across Cairo,
Alexandria and the Red Sea. OW Hospitality has now brought to completion
renovation projects at the Cairo Marriott Hotel, Kempinski Nile Hotel and
Kempinski Hotel Soma Bay, Sheraton Montaza (Alexandria), and Hilton
Pyramids Golf Hotel. This is in addition to renovating Al Azhar Mosque, Al Arabi
group mosques, and the church of St. Peter in Cairo.
Current local conditions, in which regulations imposed by the Central Bank of
Egypt (CBE) in late March 2016 have seen limited import penetration, together
with the shortage of local currency necessary for importation, have also given
Oriental Weavers room to grow and we have witnessed 5% volume growth
throughout 2016.
In light of the floatation of the Egyptian pound, we revised our selling prices to
the local market to maintain profitability levels, as noted above. Despite current
setbacks in demand, we are confident that the huge developments in the real-estate
sector, and local population demographics, create favorable conditions for future
growth in product demand.
4Q 2016 Earnings Release | Page 4
748
1,4
24
3,1
30
3,7
46
4Q15 adj
4Q16 2015 adj
2016
ExportSales(EGP mn)
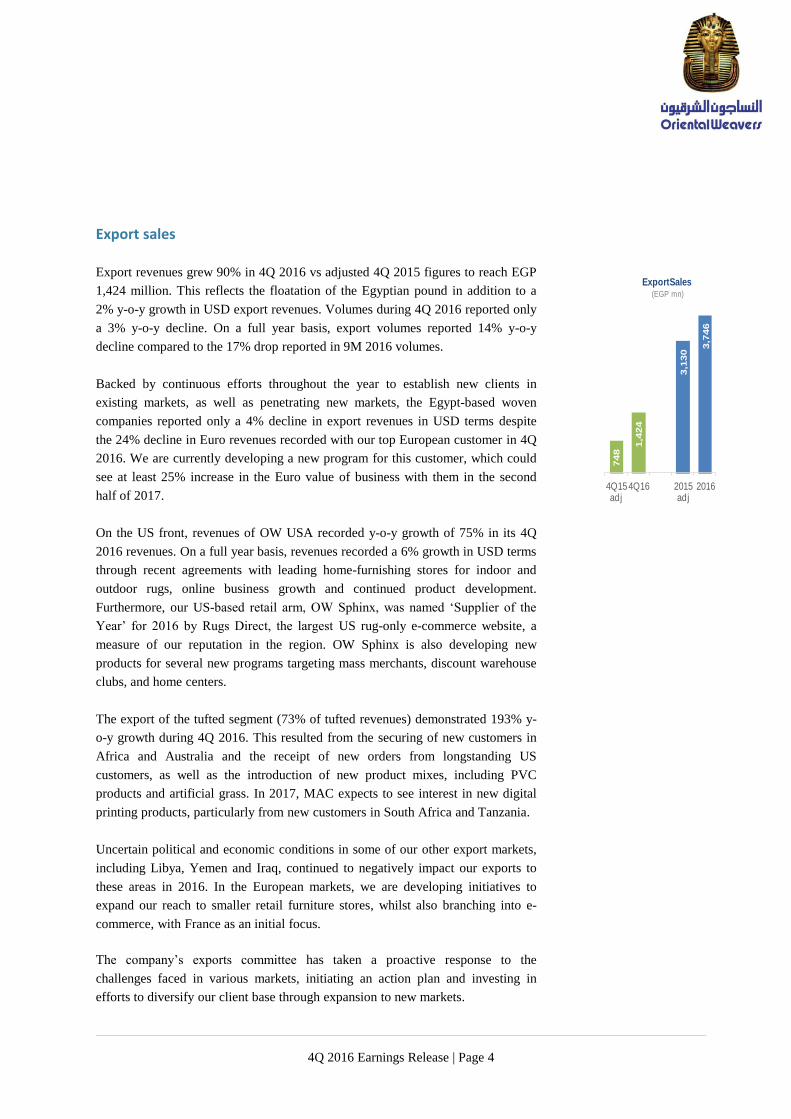
Export sales
Export revenues grew 90% in 4Q 2016 vs adjusted 4Q 2015 figures to reach EGP
1,424 million. This reflects the floatation of the Egyptian pound in addition to a
2% y-o-y growth in USD export revenues. Volumes during 4Q 2016 reported only
a 3% y-o-y decline. On a full year basis, export volumes reported 14% y-o-y
decline compared to the 17% drop reported in 9M 2016 volumes.
Backed by continuous efforts throughout the year to establish new clients in
existing markets, as well as penetrating new markets, the Egypt-based woven
companies reported only a 4% decline in export revenues in USD terms despite
the 24% decline in Euro revenues recorded with our top European customer in 4Q
2016. We are currently developing a new program for this customer, which could
see at least 25% increase in the Euro value of business with them in the second
half of 2017.
On the US front, revenues of OW USA recorded y-o-y growth of 75% in its 4Q
2016 revenues. On a full year basis, revenues recorded a 6% growth in USD terms
through recent agreements with leading home-furnishing stores for indoor and
outdoor rugs, online business growth and continued product development.
Furthermore, our US-based retail arm, OW Sphinx, was named ‘Supplier of the
Year’ for 2016 by Rugs Direct, the largest US rug-only e-commerce website, a
measure of our reputation in the region. OW Sphinx is also developing new
products for several new programs targeting mass merchants, discount warehouse
clubs, and home centers.
The export of the tufted segment (73% of tufted revenues) demonstrated 193% y-
o-y growth during 4Q 2016. This resulted from the securing of new customers in
Africa and Australia and the receipt of new orders from longstanding US
customers, as well as the introduction of new product mixes, including PVC
products and artificial grass. In 2017, MAC expects to see interest in new digital
printing products, particularly from new customers in South Africa and Tanzania.
Uncertain political and economic conditions in some of our other export markets,
including Libya, Yemen and Iraq, continued to negatively impact our exports to
these areas in 2016. In the European markets, we are developing initiatives to
expand our reach to smaller retail furniture stores, whilst also branching into e-
commerce, with France as an initial focus.
The company’s exports committee has taken a proactive response to the
challenges faced in various markets, initiating an action plan and investing in
efforts to diversify our client base through expansion to new markets.

4Q 2016 Earnings Release | Page 5
At the same time, we are committed to solidifying and expanding our existing
client bases through marketing campaigns, the development of fresh niche-
products and our ongoing dedication to high quality design and product. Given our
strong and reputable brand, and diverse, high-quality product range, we feel
confident of increased growth in the period ahead.
Performance by segment
Segment Contribution to Sales Volumes in 4Q 2016
Segment Contribution to Sales revenues in 4Q 2016
Woven59%
Tufted28%
Non-woven
13%
Woven
78%Tufted18%
Non-
woven3%
Other1%
Table 1: Product Mix in Terms of Volume (SQM ‘mn)
4Q2016 4Q2015
Adjusted
4Q2015
Reported
Change vs.
Adjusted
FY2016 FY2015
Adjusted
FY2015
Reported
Change vs.
Adjusted
Woven 18.9 17.8 17.1 6% 71.6 69.2 68.5 3%
Tufted 9.1 10.7 10.7 (14%) 30.2 41.3 41.3 (27%)
Non-woven felt 4.1 3.8 3.8 8% 14.8 13.4 13.4 11%
Total 32.1 32.3 31.6 0% 116.7 123.9 123.2 (6%)
* For purposes of comparison, adjusted figures include sales volumes of Oriental Weavers Textiles
Table 2: Product Mix in Terms of Value (EGP 'mn) 4Q2016
Reported
4Q2015
Adjusted
4Q2015
Reported
Change vs.
Adjusted
FY2016
Reported
FY2015
Adjusted
FY2015
Reported
Change vs.
Adjusted
Woven- Egypt based 1,286 823 802 56% 3,788 3,155 3,075 20%
OW USA 417 238 238 75% 1,142 817 817 40%
OW China 35 13 13 169% 91 66 66 38%
Total Woven 1,738 1,074 1,052 62% 5,021 4,038 3,958 24%
Tufted 407 167 167 143% 1,042 1,010 1,010 3%
Non-woven felt 78 46 46 70% 228 165 165 38%
Other 11 83 109 -87% 488 572 742 -15%
Total 2,233 1,370 1,374 63% 6,779 5,786 5,875 17%
* Adjusted 4Q 2015 and FY 2015 values include net sales of Oriental Weavers Textiles sold to external customers
for purposes of comparison.

4Q 2016 Earnings Release | Page 6
1. Woven segment
The woven segment saw a 62% y-o-y increase in revenues, reaching EGP 1,738
million at the close of 4Q 2016 with 6% higher volumes sold.
In the local market, woven revenues grew 45% y-o-y in 4Q 2016 driven by an
almost 40% average selling price increase and 3% higher volumes. On the export
front (63% of woven revenues), the woven segment during the quarter grew 74% y-o-
y driven by 8% higher volumes and the translation impact from the floatation of the
EGP. In dollar terms, exports of the woven segment came in 6% lower as a result of
discounts offered at the beginning of 2016 to international customers, along with the
lower exposure to our top export customer.
Grade A Woven, a product for high-end customers, recorded 9% growth in volumes
in 4Q 2016. The 27% growth in export volumes of this grade outweighed the 12%
decline seen in the local market. Grade C products also witnessed an overall growth
in volumes by 9% from 4Q 2015, driven by an 18% increase in export volumes and
4% growth in local volumes over the quarter. Grade B remained flat y-o-y in terms of
volume sold, following 3% lower export volumes, which outweighed the 4%
growth in volume sold locally. Our US and China-based factories reported 9%
total growth in sales volumes during this quarter.
2. Tufted segment
MAC recovered its performance in 4Q 2016, ending the full year revenues of
the tufted division up 3% y-o-y compared to the 25% decline reported in its 9M
2016 revenues.
Current orders for the tufted division exceed 8 million sqm up to the end of June
2017. We expect to continue seeing growth in the tufted segment based on the
orders we have on hand from our longstanding US and international customers.
3. Non-woven segment
The non-woven segment has seen strong growth since the beginning of 2016,
and this continued in 4Q 2016, in which net sales of the segment grew 70%,
with volumes up 8%. The strong revenue growth was driven mostly by the
implemented local price increase and the translation impact of the USD export
sales to EGP following floatation of the latter, similar to the woven and tufted
segments. The local sales value of the non-woven segment (47% of total
segment sales) was up 64%, with volumes increasing 17% vs 4Q 2015 levels.
Export value was also up 76%, although volumes slowed 10% y-o-y in 4Q
2016.
4Q 2016 woven volumes breakdown
Grade A
5%
Grade
B32%
Grade C
63%

4Q 2016 Earnings Release | Page 7
Strengthening operating margin on EGP floatation
Gross profit margin (including depreciation expense) recorded substantial growth
of 438 bps y-o-y in 4Q 2016 reaching 14.8% vs the adjusted figure of 10.4% in 4Q
2015. This arose mainly through the sale of our stock of finished goods at the new
higher prices, their associated costs were based on the pre-floatation USD:EGP
exchange rate. Furthermore, the margin enhancement resulted from the lower raw
materials costs, which contributed 44% of total COGS in 4Q 2016 vs 46% in 4Q
2015. Prices of polypropylene, 23% of total costs, dropped 17% y-o-y in FY 2016.
This comes in addition to new high-margin mixes and more efficient utilization of
raw materials. EFCO (the non-woven segment) recorded further margin
improvement, on development of new product that uses regenerated polyester
fibers, which are 20% cheaper.
In FY 2016, gross profit margin improved across our divisions, with the woven
segment and yarn (81% of revenues) recording 200 bps margin improvement and
the non-woven segment (4% of revenues) strengthening 680 bps. The tufted
segment (15% of revenues) recorded a 1100 bps margin improvement on the back
of a combination of: i) low depreciation rates encountered on full depreciation of
several items of equipment, ii) an increase in revenue from sales of high-margin
artificial turf, and iii) EGP floatation impact.
Adjusted EBITDA for the quarter came in at EGP 351 million, marking 94%
growth compared to the 4Q 2015 adjusted figure of EGP 181 million, whilst
EBITDA margin grew 253 bps to 15.7%. Selling, general and administrative
expenses as a percentage of sales grew 100bps y-o-y to 4.75% in light of the
inflationary environment in Egypt and tax settlement related to previous periods.
The efforts of the treasury team saw interest and treasury income grow 176% y-o-
y on an adjusted basis via more efficient utilization of our cash balance through
investments in high yield treasury bills. Financing expenses grew by 64% y-o-y in
4Q 2016 on 500 bps average increase in corridor rates, and EGP devaluation.
Overall, net interest expenses, on an adjusted basis, declined by 1% during the
quarter compared to last year’s 4Q.
In 4Q 2016, collected export rebates doubled to reach EGP 67 million on an
adjusted basis due to the regular disbursement by the export subsidy fund of
delayed subsidies from the period before December 2015. We recorded EGP 30
million provisions for tax settlements. In 2016, OW booked goodwill impairment
of EGP 40 million and EGP 60 million provisions for tax settlement.
We recorded FX losses of EGP 54 million during 4Q 2016 resulting mostly from
the EGP receivables of Oriental Weavers International, located in a private free
zone area with USD denominated financials. Based on the new accounting
standards, we recorded FX loss of 12.7 million in other comprehensive income
related to MAC USD debt facilities.
4Q 2016 COGS Breakdown
Grade A4%
Grade B34%
Grade C62%
Raw materials,
44%
Wages, 7%Depreciation,
3%
Selling exp, 27%
Others, 19%
4Q 2016 Earnings Release | Page 8
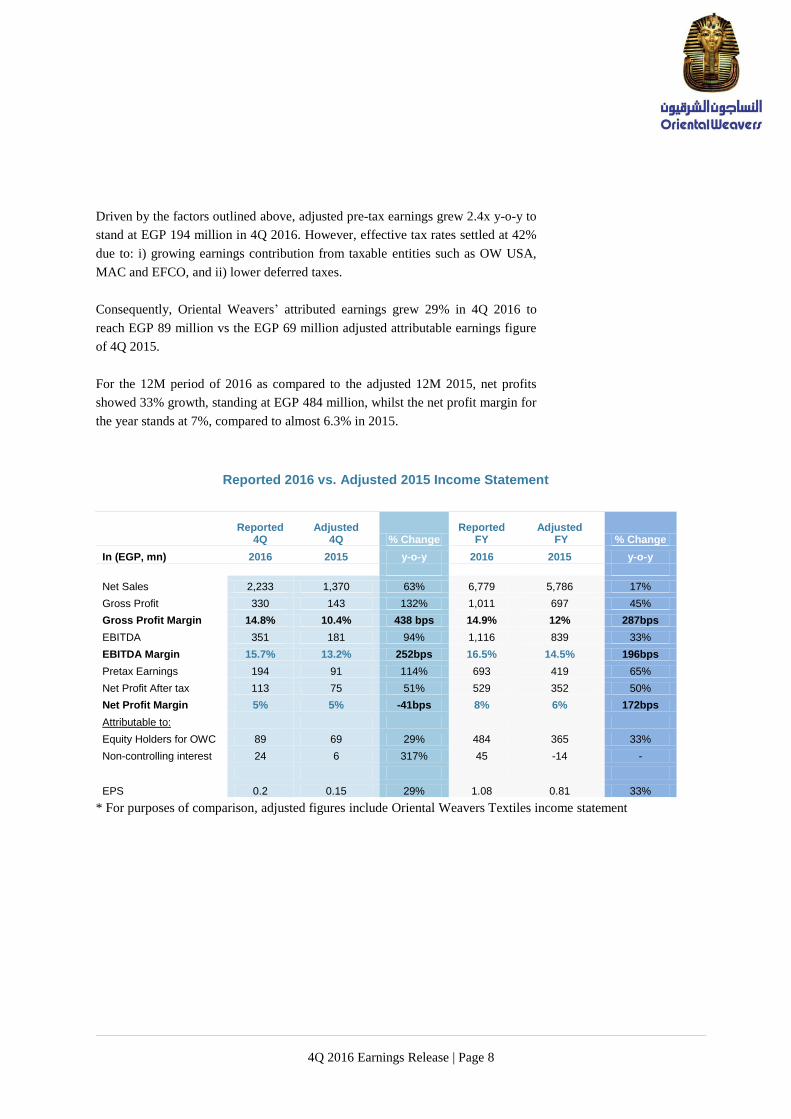
Driven by the factors outlined above, adjusted pre-tax earnings grew 2.4x y-o-y to
stand at EGP 194 million in 4Q 2016. However, effective tax rates settled at 42%
due to: i) growing earnings contribution from taxable entities such as OW USA,
MAC and EFCO, and ii) lower deferred taxes.
Consequently, Oriental Weavers’ attributed earnings grew 29% in 4Q 2016 to
reach EGP 89 million vs the EGP 69 million adjusted attributable earnings figure
of 4Q 2015.
For the 12M period of 2016 as compared to the adjusted 12M 2015, net profits
showed 33% growth, standing at EGP 484 million, whilst the net profit margin for
the year stands at 7%, compared to almost 6.3% in 2015.
Reported 2016 vs. Adjusted 2015 Income Statement
Reported
4Q Adjusted
4Q % Change Reported
FY Adjusted
FY % Change
In (EGP, mn) 2016 2015 y-o-y 2016 2015 y-o-y
Net Sales 2,233 1,370 63% 6,779 5,786 17%
Gross Profit 330 143 132% 1,011 697 45%
Gross Profit Margin 14.8% 10.4% 438 bps 14.9% 12% 287bps
EBITDA 351 181 94% 1,116 839 33%
EBITDA Margin 15.7% 13.2% 252bps 16.5% 14.5% 196bps
Pretax Earnings 194 91 114% 693 419 65%
Net Profit After tax 113 75 51% 529 352 50%
Net Profit Margin 5% 5% -41bps 8% 6% 172bps
Attributable to:
Equity Holders for OWC 89 69 29% 484 365 33%
Non-controlling interest 24 6 317% 45 -14 -
EPS 0.2 0.15 29% 1.08 0.81 33%
* For purposes of comparison, adjusted figures include Oriental Weavers Textiles income statement

4Q 2016 Earnings Release | Page 9
Latest corporate developments
1. BoD proposes a per share dividend of EGP 1.4, implying an almost 8% yield.
2. 2016 Expansions
In 2016, the newly merged Oriental Weavers Textiles (OWT) added a total of
seven looms, with final expenditures up to December 31, 2016 of USD 12.4
million.
We also received one weaving loom in our Egypt-based Oriental Weavers
International factory, and another in the US factory, each with a capacity of
around 500,000 sqm. The growth in demand for our Gobelin products saw four
Gobelin looms added as well, each with 67,500 sqm of capacity.
On the group level, two new yarn production lines were added in Egypt and the
US, with an average Capex each of EUR 600,000, whilst our US division started
operations at its new one million sqm warehouse, with a Capex of USD 2.8
million spent. The warehouse will meet the growth in online business, now at 20%
of US revenues, and accompanying requirements for increased storage space.
EFCO also added two new machines this year with Capex of EGP 18 million,
intended to enable the introduction of new product mixes to meet market demand.
3. Plans for expansion are still on track in 2017
Management is optimistic about the company’s prospects and potential. The
increasing reliance on new, more advanced manufacturing technology is
expected to help increase productivity, enhance quality and reduce waste, in
turn contributing to profitability and margin improvement.
a. Expansions in Egypt-based facilities:
OW plans to add 11 new looms in addition to one digital printer in its Egypt
based facilities throughout 2017 with planned Capex of almost EUR 9-10
million. This is estimated to add 2-3% to our total production capacity. Three of
these looms will enable the company to penetrate the prayer mats segment and
to target the strong demand from Muslim communities in Africa, GCC and
Asia. The 11 new looms will be added in both OW’s free zone and non free
zone production areas.

4Q 2016 Earnings Release | Page 10
Given the limited production space available in the latter, OW’s BoD approved
in its meeting held on March 12, 2017 the acquisition of 34,125 sqm land owned
by MAC, OW’s 57% owned subsidiary. This piece of land, has two buildings
constructed on it, was used previously as a warehouse. MAC’s sale of this
warehouse will not have any impact on its production process as the company
has got excess warehousing capacities.
b. OW USA expansions to be financed mostly with a capital increase
OW’s US-based subsidiary has a USD 15.5 million expansion plan for 2017
and 2018, with new looms and a set of automation machinery to be added. The
capital expenditure will be financed through a USD 12 million capital increase
and an MTL of USD 3.5 million.
For this reason, in its meeting held on March 12, 2017, OW BoD approved
a capital increase for OW USA of USD 12 million, to which existing
shareholders of Oriental Weavers Carpets will be invited to subscribe. In the
case that the capital increase is not fully subscribed, OW USA has the right to
invite new investors to subscribe through a private placement.
The new Export Incentive Program approved The Prime Minister Sherif Ismail approved the new export incentive program.
This program should be implemented retroactively on export shipments starting
July 1, 2016.
The main criteria of the new export incentive program
1. Primary export Incentive rates
Non-free zone area
(NFZ) Weighted average
Free zone area (FZ) Weighted average
Average rate (70% of exports in FZ
and 30% in NFZ) Program Local
materials Imported materials
50%/50% Local
materials Imported materials
50%/50%
Old 10% 6% 8% 9% 5.0% 7.0% 7.3%
New* 12% 6% 9% 9% 4.5% 6.8% 7.4%
2. Additional export incentives under the following conditions:
a. Growth in USD sales revenue
i. Upon achieving sales growth of 25% or more, exporters will be granted
an additional 30% of the primary incentive rates.
ii. Upon achieving sales growth between 15-25%, exporters will be granted
an additional 20% of the primary incentive rates.
iii. Upon achieving sales growth between 10%-15%, exporters will be
granted an additional 10% of the primary incentive rates.

4Q 2016 Earnings Release | Page 11
b. Exporting to Africa
i. An additional 2% over the primary incentive rate will be granted when
exporting to African countries (except Libya).
ii. A cash refund of 50% of the freight cost to Africa will be available.
c. Penetrating new markets
Exporters will be granted an additional 50% to the primary incentive rates
upon opening new markets (such as Russia, China, Latin America and the
CIS region).
d. Cash deposits
The export subsidy fund can accept cash deposits on exports to Iraq, Syria,
Yemen, Libya, Sudan and Iran.
e. Date of implementation:
The new program will be implemented retroactively on export shipments
starting July 1, 2016.
INVESTOR RELATIONS CONTACTS
For further information, please contact:
Farida Khamis
Vice President
Oriental Weavers Carpet Company
E-mail : [email protected]
Ingy El Diwany, CFA
Investor Relations Manager
Oriental Weavers Carpet Company
E-mail : [email protected]
Tel (Direct) : +2 (02) 2268 5166
STOCK SYMBOL ORWE.CA
CAPITAL
Issued and Paid-In Capital: 450mn EGP
Number of Shares: 450 million shares
Par Value: 1 EGP per share
SHAREHOLDER STRUCTURE
57% Khamis Family & other related entities
38% Institutions
5% Retail

4Q 2016 Earnings Release | Page 12
Income Statement (EGP mn)
Three months ended Dec 31
Twelve months ended Dec 31
2016 2015 Change 2016 2015 Change
Net Sales 2,233 1,374 63% 6,779 5,875 15%
Less:
COGS 1,903 1,240 53% 5,768 5,209 11%
Gross Profit 330 134 147% 1,011 666 52%
Gross Profit Margin* 14.8% 9.7% 505bps 14.9% 11.3% 358bps
Less:
Selling & Distribution Expenses 16 14 10.5% 56 50 12%
General & Administrative Expenses 91 35 161% 214 147 46%
Provisions & impairment 30 15 0% 100 95 5%
Sum 136 64 113% 370 292 27%
Net Income from Operation Activities 194 70 179% 641 374 71%
Operation Activities Margin 8.7% 5.1% 362bps 9.5% 6.4% 309bps
Add / Less:
Investment Income 0 0 -36% 0.2 0.2 -29%
Interest Income 4 6 -35% 19 25 -24%
Treasury Income 18 2 1,008% 32 2 1,835%
Other Revenues 67 28 141% 214 123 74%
Capital Gain 1 1 -16% 4.81 8 -39%
Financing Expenses -37 -22 70% -111 -83 34%
Foreign Exchange Differences -54 -3 1522% -107 -42 153%
Sum 0 12 -98% 52 33 60%
Net Profit for the Period before Income Tax 194 82 138% 693 407 70%
EBT Margin 9% 6% 274bps 10% 7% 330bps
Add / Less:
Current Income Tax 82 35 133% 168 94 79%
Deferred Tax 0 -19 -98% -4 -26 -85%
Income Tax for the Period 81 15.7 415% 164 67 144%
Net Profit for the Period 113 66 71% 529 339 56%
Net Profit Margin 5% 5% 26bps 8% 6% 203bps
Attributable to:
Equity Holders of the Parent 89 63 41% 484 356 36%
Non-Controlling interest 24 3 677% 45 -17 -360%
Earnings Per Share (EPS) 0.2 0.14 41% 1.08 0.79 36%
*Reported figures include depreciation expenses
Depreciation expense used in calculating EBITDA 127 82 55% 375 333 13%

4Q 2016 Earnings Release | Page 13
Balance Sheet (EGP mn)
FY 2016 FY 2015
Long Term Assets
Fixed Assets (Net) 5 052 2 577
Projects in Progress 256 110
Investments - Available for Sale 131 105
Goodwill 286 326
Total Long Term Assets 5,725 3 118
Current Assets Inventory 3 042 1 588
Trades & Notes Receivable 2 167 977
Debtors and Other Debit Accounts 320 228
Treasury Bills 653 177
Cash on Hand & at Banks 336 370
Total Current Assets 6,518 3,340
Current Liabilities Provisions 49 16
Banks - Credit Accounts 1 998 1 153
Long Term Liabilities - Current Portion 105 116
Suppliers & Notes Payable 872 453
Dividends Payable 11 8
Creditors & Other Credit Accounts 252 141
Deferred Tax Liability 146 79
Total Current Liabilities 3,433 1,965
Working Capital 3,085 1,375
Total Investment 8,811 4,493
Financed as Follows: Shareholder's Equity Issued and Paid Capital 450 450
Reserves 1,610 1,525
Retained Earnings 907 823
Net Profit for the Period 484 356
Exchange Differences Arising on Translation of Foreign Currency 4,359 717
Treasury Stocks -15 -15
Total Equity Attributable to Equity Holders of the Parent 7,796 3,858
Non-controlling interest 700 381
Total Equity 8,496 4,238
Long - Term Liabilities Long Term loans 197 120
Housing and Development Bank Loan 0 0
Deferred Taxes Liabilities 117 134
Total Long Term Liabilities 314 254
Total Shareholder's Equity & Long Term Liabilities 8,811 4,492

4Q 2016 Earnings Release | Page 14
Statement of Cash Flows (EGP mn) FY Ended
Dec 31
2016 2015
Cash flows from Operating Activities:
Net Profit for the Period before Income Tax 693 407
Adjustments to Reconcile Net Profit to
Net Cash Provided by Operating Activities
Fixed Assets Depreciation 620 333
Provisions other than Deprecations 100 95
Interest Income (19) (25)
Financing Expenses 111 83
Investment Income (0) (0)
Capital Gain (5) (8)
Fx Translation 34 38
Operating Profits before Changes in Working Capital 1,535 923
Change in Working Capital
(Increase) in Inventory (163) 4
Decrease (Increase) in Trades & Notes Receivable and other Debit Accounts 355 (135)
Decrease (Increase) in Suppliers & Notes Payable and other Credit Accounts (98) (160)
Cash Flows Provided by Operating Activities 1,628 632
Interest Incomes 21 25
Paid Financing Expenses (110) (83)
Tax Payment (116) (89)
Net Cash Flows Provided by Operating Activities 1,422 484
Cash Flows from Investing Activities
Payments for Purchase of Fixed Assets and Projects in Progress (529) (163)
Payment for acquisition of Available for Sale Investment (115) -
Proceeds from Sale of Fixed Assets 19 14
Proceeds from Sale of Treasury Bills 18 (116)
Net Cash Flows (used in) Investing Activities (607) (266)
Cash Flows from Financing Activities:
Proceeds (Payment) from Banks-Credit Accounts (57) (170)
Dividends Paid (308) (239)
(Payment) Proceeds in Long Term Liabilities (230) 11
Net Cash Flows (used in) Provided by Financing Activities (595) (398)
Net Change in Cash and Cash Equivalents During the Period
221
(179)
Cash and cash equivalents at beginning of the period
431
591
Cash and cash equivalents transferred from the merged co at beginning of
the period
12 -
Differences related to Cash & Cash equivalents
226
19
Cash and Cash Equivalents at End of the Period
890
431

4Q 2016 Earnings Release | Page 15
ABOUT ORIENTAL WEAVERS CARPET COMPANY
Oriental Weavers is a global player in machine-woven rugs and carpets; the
company is renowned for superior product design and quality, as well as
technological innovation. Today, the company is one of the largest producers of
machine-made woven rugs in the world. It is management’s vision to build a state-
of-the-art, internationally competitive carpet and home textile company
characterized by a sharp focus on its customers, and driven by marketing- and
export-oriented strategies. (www.orientalweavers.com)
FORWARD-LOOKING STATEMENTS
Certain information contained in this document consists of forward-looking
statements reflecting the current view of the Company with respect to future
events and is subject to certain risks, uncertainties and assumptions. Many factors
could cause the actual results, performance or achievements of the Company to be
materially different from any future results, performance, or achievements that
may be expressed or implied by such forward-looking statements, including
worldwide economic trends, the economic and political climate of Egypt and the
Middle East and changes in business strategy and various other factors. Should
one or more of these risks or uncertainties materialize, or should underlying
assumptions prove incorrect, actual results may vary materially from those
described in such forward-looking statements. Recipients of this document are
cautioned not to place any reliance on these forward-looking statements. The
Company undertakes no obligation to republish revised forward-looking
statements to reflect changed events or circumstances.
# # #


