E145 Accounting Workshop
Financials:Models and Statements
Ann Miura-Ko
Maples Investments
Copyright © 2009 by the Board of Trustees of the Leland Stanford Junior University and Stanford Technology Ventures Program (STVP). This document may be
reproduced for educational purposes only.
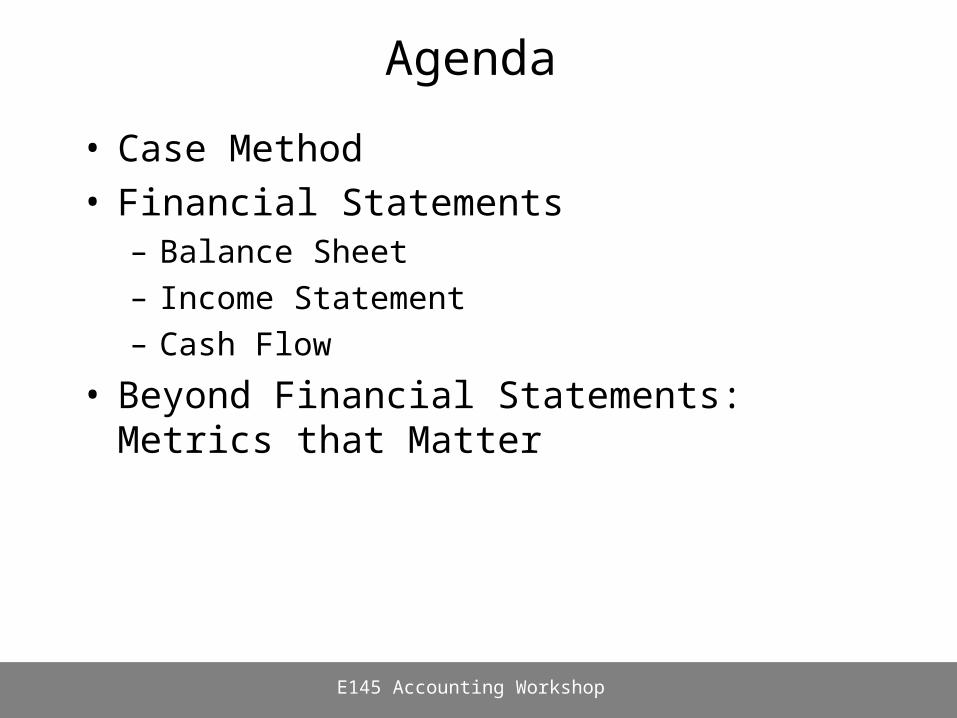
Agenda
• Case Method• Financial Statements
– Balance Sheet– Income Statement– Cash Flow
• Beyond Financial Statements: Metrics that Matter
E145 Accounting Workshop

E145 Accounting Workshop
Seven Tips for Case Analysis1- Gain a Basic Understanding of the Company
– What does the company sell, to whom, how, and why do people buy it?– Size of revenues - How big is the business?– Growth of revenue and assets – How quickly is the company growing?– Profitability of the business (several measures)– Who are the key players in the situation described and what are their motivations?
2- Understand the Financial Situation of the Company– Is operational cash flow positive or negative?– How is the short term cash position?– How much debt does the company have?
3- Benchmark the company against competitors and the industry average– Measures of profitability– Measures of operational efficiency– How are the company’s products differentiated from competition?
4- Analyze the historical evolution of the company’s financial situation

E145 Accounting Workshop
Seven Tips for Case Analysis5- Analyze the sustainability of growth and the cash burn rate
– How long will the company be able to maintain operations with the current cash position?
6- Don’t confuse symptoms with problems. Often the numbers reflect symptoms that help in diagnosing business problems. One of the most important tasks of case analysis is to identify the problems addressed by the case.
7- You should reach a clear decision on the case, which is well supported and logically consistent with the analysis. Write the assignments in concise language, using a bullet point format.

E145 Accounting Workshop
Case Write-Up Tips1- Skip the intro. We know what question you’re answering; we have to
read at least 16 answers to the same question. You’ve only one page in which to make your case, make effective use of it.
2- Build an argument. Don’t just answer the “what” question, back it up with the “why”. If you make assertions or assumptions outside of the case, justify them. We ought to be able to read your answer and create a representative outline of the form:– “I think _________ should do/choose _______ option because
– Reason A– Reason B– Reason C
despite Fact D because of Reason E”
In fact, maybe make the outline first. If the outline is good enough, you can just turn it in. Content over style.
E145 Accounting Workshop
Case Write Up Tips
3- Read the case carefully and learn to filter. These cases have a lot of info, not all of it is relevant. Many of these cases were written with different case questions in mind. Some of them deal with technologies you may not be familiar with. If there’s terminology or anything in the text that you don’t quite understand, feel free to ask. The teaching team is here to help.
4- Use the study questions. At least read them. Preferably, discuss and answer them. The study questions have been carefully designed to help you narrow down the scope of the actual homework question or, at very least, to point you in the right direction. Again, if you’re not sure, ask.

E145 Accounting Workshop
Case Write Up Tips
5- Feel free to use outside knowledge. Make full use of your own and your team’s knowledge. What do you know about this particular technology or market? Between you and all of your team members, you probably know a lot more than you think you know. What would you do in this situation? From what you know of the personalities in the case, which of the decision options do you think they would prefer?
6- But, don’t just look up an answer. With point 5 in mind, don’t just look up what really happened and let historical determinism answer your question. Answer the case from the time and perspective of the personalities in the case. We don’t look for right or wrong answers, we look for well-constructed arguments.

E145 Accounting Workshop
Case Write Up Tips
7- Think through the alternatives. They won’t always be laid out in the case or the question.
8- Think about limitations as well as advantages. Argue for your choice, but recognize the risks. Every choice has tradeoffs, else these decisions wouldn’t be so interesting or so difficult. What are the big risks for each alternative and why, despite these risks, do you think your choice is the best path of action?
9- Know when to use the numbers. Hint: if we teach you financing in class and then you get a case with financing numbers in it, we probably want you to run the numbers. You’ll note that you won’t have all the values you need – you can solve for some values, others you’ll just have to guess (and justify why those numbers are reasonable).

Agenda
• Case Method• Financial Statements
– Balance Sheet– Income Statement– Cash Flow
• Beyond Financial Statements: Metrics that Matter
E145 Accounting Workshop

E145 Accounting Workshop
Why should I care?• Key Business Drivers
– Identifies the critical assumptions you are making about your business (for revenues and for costs)
– Identifies what drives the growth of your business
• Timeline analysis– Enables you to know how much resources are
required to scale the business and when those resources are required
• Does this business even make sense?– Can’t make a $1 widget with a $3B fab– Sure, selling dollar bills at a discount gets you great
market share fast but also makes you broke

E145 Accounting Workshop
Balance Sheet: Basic Principles
Assets = Liabilities + Equity
What the company owns (used to generate income)
• How the ownership of assets was financed (By third parties or by the owners)
• Equity = book value of company
• Note: Market and book value of company are not the same. Market value takes into account
the potential growth of the company
Market Value = Share price x # shares issued

E145 Accounting Workshop
Balance Sheet• A snapshot of the investing and financing
activities of a firm
Current Assets (liquid in less than a year)
Fixed Assets
Other Assets
Current Liabilities(payable in less than a year)
Long-Term Liabilities(bonds issued, bank loans)
Shareholders’ Equity
Cash
Accounts Receivable
Inventories
Property, plant and equipment(less depreciation)
Intangibles (less depreciation)
Investment Securities
Total Assets =
Accounts Payable
Salaries Payable
Accrued Expenses
Income Taxes Payable
Short Term debt
Common Stock
Additional Paid-in Capital
Retained Earnings
Total Liabilities + Shareholder’s Equity
Balance Sheet of XYZ Corp. - 31 December of 2008 (in thousand $)
Assets are economic resources
• An asset has the ability to provide future benefits to the company
• Liabilities are creditors’ claims on the assets of a firm. The claims result from benefits the firm has previously received from the creditors
Shareholder’s equity is the owners’ claim
• Contributed capital (Paid-in capital): the amount invested
• Retained earnings: Increase in equity due to operations

E145 Accounting Workshop
Balance Sheets ComparisonAssets
Cash . . . . . . . . . . . . . . . . . . . . . . . . . .
Accounts Receivable . . . . . . . . . . . . . .
Inventories . . . . . . . . . . . . . . . . . . . . . .
Other Current Assets . . . . . . . . . . . . . .
Total Current Assets: . . . . . . . . . . . . . . . . . .
Property, Plant and Equipment . . . . . .
Intangible Assets . . . . . . . . . . . . . . . . .
Other Long Term Assets . . . . . . . . . . .
Total Assets: . . . . . . . . . . . . . . . . . . . . . . . .
Liabilities and Shareholders’ EquityAccounts Payable . . . . . . . . . . . . . . . . .
Notes Payable . . . . . . . . . . . . . . . . . . .
Other Current Liabilities . . . . . . . . . . . . .
Total Current Liabilities . . . . . . . . . . . . . . . .
Long Term Debt . . . . . . . . . . . . . . . . . . .
Other Noncurrent Liabilities . . . . . . . . . .
Total Liabilities . . . . . . . . . . . . . . . . . . . . . . .
Shareholders’ Equity . . . . . . . . . . . . . . . . . .
Total Liabilities and Shareholders’ Equity . .
Wal-Mart($B)
Cisco($B)
Google($B)
7.3
3.9
34.5
3.3
48.9
95.7
15.3
3.6
163.4
47.6
7.7
-
55.4
34.5
8.2
98.1
65.3
163.4
26.2
5.9
1.2
2.3
35.7
4.2
15.0
3.8
58.7
3.4
0.5
10.0
13.9
6.4
4.0
24.3
34.4
58.7
8.7
2.9
-
8.6
20.2
5.2
5.8
0.5
31.8
2.1
-
0.2
2.3
0.9
0.3
3.5
28.2
31.8

Evolution of a Balance Sheet
Ann’s Mini MartSeptember 1, 2009
Singularity University
AssetsCash……………………… $10,000
Total…………………… $10,000
Liabilities and EquityPaid-in Capital…..……… $10,000
Total…………………… $10,000

Evolution of a Balance Sheet
Ann’s Mini MartSeptember 2, 2009
Singularity University
AssetsCash……………………… $15,000
Total…………………… $15,000
Liabilities and EquityNote Payable ……...………$5,000
Paid-in Capital…..……… $10,000
Total…………………… $15,000
Evolution of a Balance Sheet
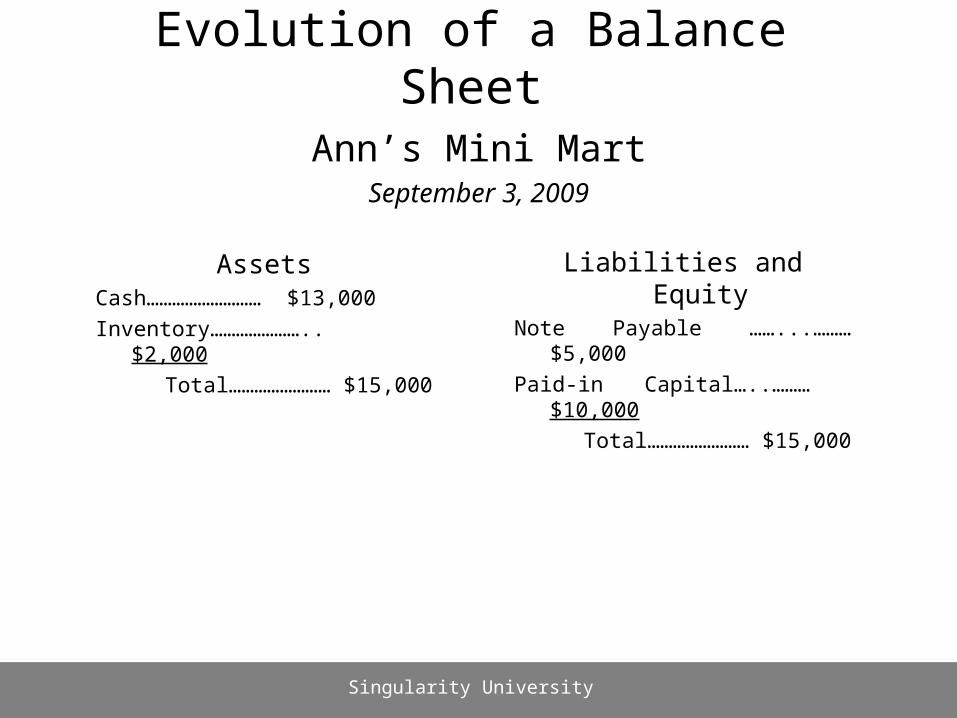
Ann’s Mini MartSeptember 3, 2009
Singularity University
AssetsCash……………………… $13,000
Inventory………………….. $2,000
Total…………………… $15,000
Liabilities and EquityNote Payable ……...………$5,000
Paid-in Capital…..……… $10,000
Total…………………… $15,000

Evolution of a Balance Sheet
Ann’s Mini MartSeptember 4, 2009
Singularity University
AssetsCash……………………… $14,100
Inventory………………….. $1,300
Total…………………… $15,400
Liabilities and EquityNote Payable ……...………$5,000
Paid-in Capital…..……… $10,000
Retained Earnings…………. $400
Total…………………… $15,400

Evolution of a Balance Sheet
Ann’s Mini MartSeptember 5, 2009
Singularity University
AssetsCash……………………… $14,100
Inventory………………….. $3,300
Total…………………… $17,400
Liabilities and EquityAccounts Payable…………$2,000
Note Payable ……...………$5,000
Paid-in Capital…..……… $10,000
Retained Earnings…………. $400
Total…………………… $17,400
Evolution of a Balance Sheet
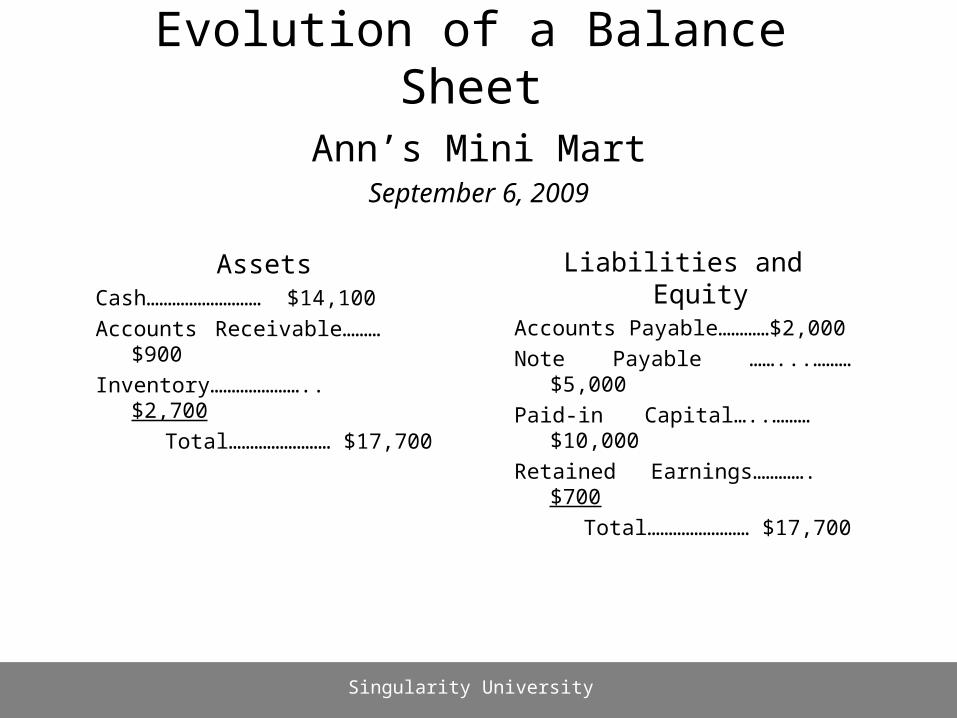
Ann’s Mini MartSeptember 6, 2009
Singularity University
AssetsCash……………………… $14,100
Accounts Receivable……… $900
Inventory………………….. $2,700
Total…………………… $17,700
Liabilities and EquityAccounts Payable…………$2,000
Note Payable ……...………$5,000
Paid-in Capital…..……… $10,000
Retained Earnings…………. $700
Total…………………… $17,700

Evolution of a Balance Sheet
Ann’s Mini MartSeptember 7, 2009
Singularity University
AssetsCash……………………… $13,900
Accounts Receivable……… $900
Inventory………………….. $2,700
Pre-paid insurance………. $200
Total…………………… $17,700
Liabilities and EquityAccounts Payable…………$2,000
Note Payable ……...………$5,000
Paid-in Capital…..……… $10,000
Retained Earnings…………. $700
Total…………………… $17,700

Evolution of a Balance Sheet
Ann’s Mini MartSeptember 8, 2009
Singularity University
AssetsCash……………………… $11,900
Accounts Receivable……… $900
Inventory………………….. $2,700
Pre-paid insurance………. $200
Land………………………. $10,000
Total…………………… $25,700
Liabilities and EquityAccounts Payable…………$2,000
Note Payable ……...………$5,000
Mortgage Payable………..$8,000
Paid-in Capital…..……… $10,000
Retained Earnings…………. $700
Total…………………… $25,700

Evolution of a Balance Sheet
Ann’s Mini MartSeptember 9, 2009
Singularity University
AssetsCash……………………… $12,900
Accounts Receivable……… $900
Inventory………………….. $2,700
Pre-paid insurance………. $200
Land………………………. $5,000
Total…………………… $21,700
Liabilities and EquityAccounts Payable………… $2,000
Note Payable ……...……… $5,000
Mortgage Payable……….. $4,000
Paid-in Capital…..……… $10,000
Retained Earnings…………. $700
Total…………………… $21,700

E145 Accounting Workshop
Balance Sheet Analysis
• Working Capital: Part of current assets not financed by current liabilities. Also a measure of how much you have in quickly liquid assets
= Current Assets - Current Liabilities
• Liquidity ratios: measures of the ability to meet short term financial obligations
– Current Ratio = Current Assets / Current Liabilities
– Acid-test = (Cash + Accounts Receivable) / Current Liabilities
• Operational Efficiency Measures
– Inventory Turnover = Cost of Sales per year / Current Inventory
– Accounts Receivable Collection Period = Accounts Receivable / Sales
– Accounts Payable Collection Period = Accounts Payable / Cost of Sales

E145 Accounting Workshop
Balance Sheets ComparisonAssets
Cash . . . . . . . . . . . . . . . . . . . . . . . . . .
Accounts Receivable . . . . . . . . . . . . . .
Inventories . . . . . . . . . . . . . . . . . . . . . .
Other Current Assets . . . . . . . . . . . . . .
Total Current Assets: . . . . . . . . . . . . . . . . . .
Property, Plant and Equipment . . . . . .
Intangible Assets . . . . . . . . . . . . . . . . .
Other Long Term Assets . . . . . . . . . . .
Total Assets: . . . . . . . . . . . . . . . . . . . . . . . .
Liabilities and Shareholders’ EquityAccounts Payable . . . . . . . . . . . . . . . . .
Notes Payable . . . . . . . . . . . . . . . . . . .
Other Current Liabilities . . . . . . . . . . . . .
Total Current Liabilities . . . . . . . . . . . . . . . .
Long Term Debt . . . . . . . . . . . . . . . . . . .
Other Noncurrent Liabilities . . . . . . . . . .
Total Liabilities . . . . . . . . . . . . . . . . . . . . . . .
Shareholders’ Equity . . . . . . . . . . . . . . . . . .
Total Liabilities and Shareholders’ Equity . .
Wal-Mart($B)
Cisco($B)
7.3
3.9
34.5
3.3
48.9
95.7
15.3
3.6
163.4
47.6
7.7
-
55.4
34.5
8.2
98.1
65.3
163.4
26.2
5.9
1.2
2.3
35.7
4.2
15.0
3.8
58.7
3.4
0.5
10.0
13.9
6.4
4.0
24.3
34.4
58.7
Working Capital:Walmart: -6.5BCisco: 21.8B
Current Ratio:Walmart: 0.9
Cisco: 2.6
Inventory TurnoverWalmart: 7.8
Cisco: 9.5
Acct ReceivableCollection Period:
Walmart: 0.01Cisco: 0.11
Acct PayableCollection Period:
Walmart: 0.11Cisco: 0.06
E145 Accounting Workshop
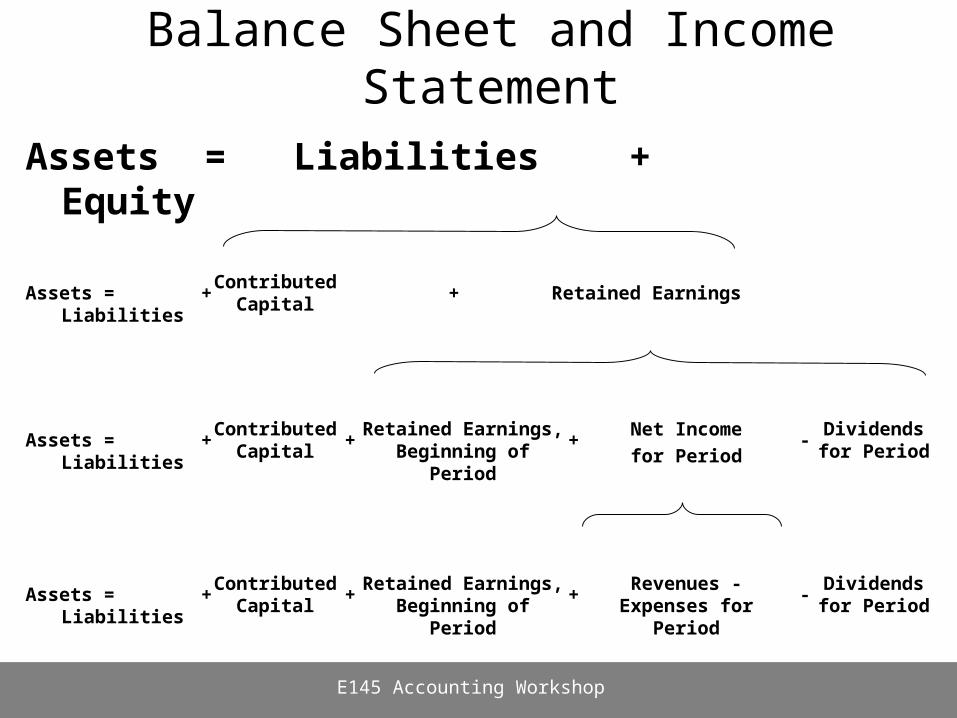
Balance Sheet and Income Statement
Assets = Liabilities + Equity
Assets = LiabilitiesContributed
CapitalRetained Earnings, Beginning of Period
Revenues - Expenses for Period
Dividends for Period
+ -+ +
Assets = LiabilitiesContributed
CapitalRetained Earnings, Beginning of Period
Net Income
for Period
Dividends for Period
+ -+ +
Assets = LiabilitiesContributed
CapitalRetained Earnings+ +

E145 Accounting Workshop
Income StatementReports the economic results of a company over a time
period. It shows the derivation of earnings or losses.
+ Revenues- Cost of Revenue (product cost or COGS)= Gross Margin
- Sales and Marketing- General and Administrative- Research & Development- Depreciation and Amortization
= Operating Income (EBIT) + Interest Income(expense) net= Net Income before Taxes - Income Tax Provision - Extraordinary Items= Net Income
Income Statement of XYZ Corp. – year 2008 $ % Rev.
Net Income = Revenues - Expenses

E145 Accounting Workshop
Income Statement Analysis
• Some Profitability Measures:– Gross Margin (%) = Gross Profit / Sales– Operating Margin = Operating Income / Sales– Return on Sales = Net Income / Sales– Return on Equity = Net Income / Shareholders’ Equity
• Other Important Measures– Earnings Per Common Share (EPS) = Net Income /
Common Shares
– Price Earnings Ratio (P/E) = Market Price / Earnings Per Share
E145 Accounting Workshop
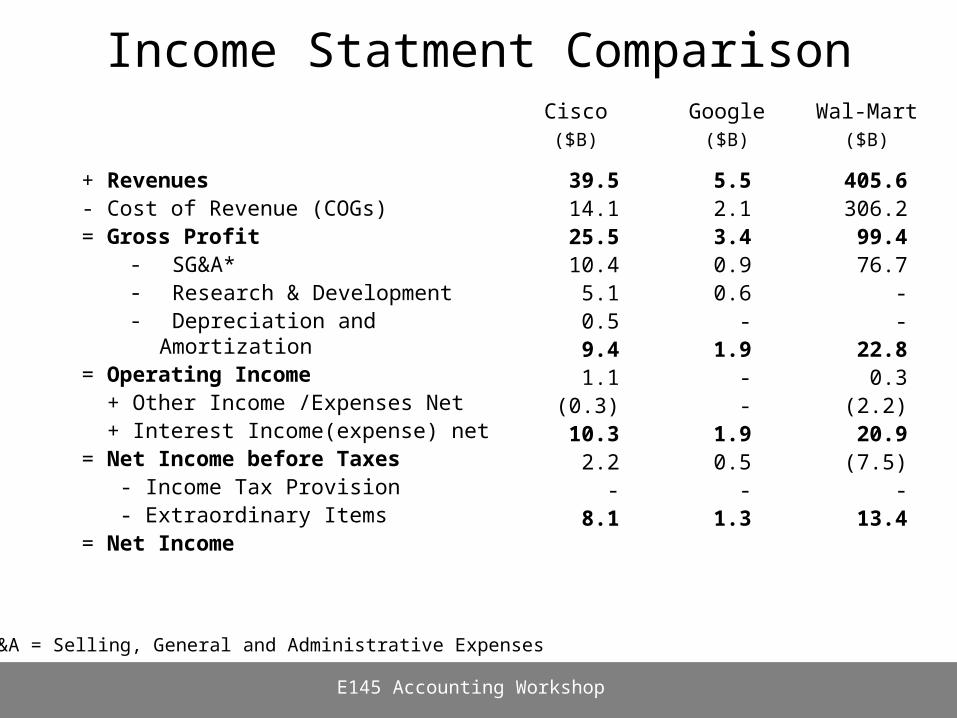
Income Statment Comparison
+ Revenues- Cost of Revenue (COGs)= Gross Profit
- SG&A*- Research & Development- Depreciation and Amortization
= Operating Income + Other Income /Expenses Net + Interest Income(expense) net= Net Income before Taxes - Income Tax Provision - Extraordinary Items= Net Income
Wal-Mart($B)
Cisco($B)
Google($B)
405.6306.299.476.7
--
22.80.3
(2.2)20.9(7.5)
-13.4
39.514.125.510.4
5.10.59.41.1
(0.3)10.3
2.2-
8.1
SG&A = Selling, General and Administrative Expenses
5.52.13.40.90.6
-1.9
--
1.90.5
-1.3

E145 Accounting Workshop
Income Statment Comparison
+ Revenues- Cost of Revenue (COGs)= Gross Profit
- SG&A*- Research & Development- Depreciation and Amortization
= Operating Income + Other Income /Expenses Net + Interest Income(expense) net= Net Income before Taxes - Income Tax Provision - Extraordinary Items= Net Income
Wal-Mart($B)
Google($B)
405.6306.299.476.7
--
22.80.3
(2.2)20.9(7.5)
-13.4
SG&A = Selling, General and Administrative Expenses
5.52.13.40.90.6
-1.9
--
1.90.5
-1.3
Gross Margin:Google: 62%Walmart: 25%
Operating Margin:Google: 34%Walmart: 6%

E145 Accounting Workshop
Cash Flow Statement
CFIMITYM !!!(Cash Flow is More Important Than Your Mother!! )
Especially for an entrepreneurial firm...
How is cash flow different from income?
– Timing: Revenues and costs are not necessarily recognized when cash is transacted (e.g. accounts payable and receivable, salaries payable, depreciation vs. capital equipment purchase)
– Investment Activities: Firm also receives cash from sources not related operations (e.g. issuance of stocks and bonds)
It is possible for a profitable firm to go bankruptbecause they lack the cash to keep things afloat

E145 Accounting Workshop
Cash Flow Components
Operations
Investing
Financing
Source: Stickney and Weil, Financial Accounting
Cash Received from Sales of Goods and
Services
Cash Paid for Operating Goods and
Services
Cash Flow from Operations
Cash Received from Sales of Investments and Property, Plant
and Equipment
Cash Paid for Acquisition of
Investments and Property, Plant and
Equipment
Cash Flow from Investing
Cash Received from Issue of Debt or
Capital Stock
Cash Paid for Dividends and
Reacquisition of Debt or Capital Stock
Cash Flow from Financing
Net Change in Cash for the Period
_
_
_
=
=
=
=
+
+

E145 Accounting Workshop
Statement of Cash Flows - Example
GoogleStatement of Cash Flows
For Year Ending Dec 31, 2008($000)

Agenda
• Case Method• Financial Statements
– Balance Sheet– Income Statement– Cash Flow
• Beyond Financial Statements: Metrics that Matter
E145 Accounting Workshop

But…
E145 Accounting Workshop

What’s missing?
• Who are your users? Are they your customers? How many are there?
• How do they find out about your product?• How do they get access to your product?• How do you produce your product?• How much do you charge for it?
E145 Accounting Workshop

Example Business Model
ODM Hardware
Software (in-house)
E145 Accounting Workshop
$150
yourcompany.com
$399
$399
$399$200
$399
$350
Customer Acquisition Cost:($41)
Demand Creation• SEO/SEM• Blogs• Forums• Bookstore promotion• Sales force • Viral marketing• Website

EU
Dis
coun
ts
E145 Accounting Workshop
Value Chain
Cost of Goods Profit + SG&A + r&D
End
Con
usm
er
Revenue
List PriceSource: Mark Leslie
Direct to End User
Reseller
EU
Dis
coun
ts
Res
elle
r
Cost of Goods
Profit + SG&A + r&D
EU
Dis
coun
ts
Res
elle
r
Cost of Goods
Profit + SG&A + r&DOEM
Res
elle
r
Cost of Goods
Profit + SG&A + r&D
You are now your
customer’s COG!

What do I track?
E145 Accounting Workshop
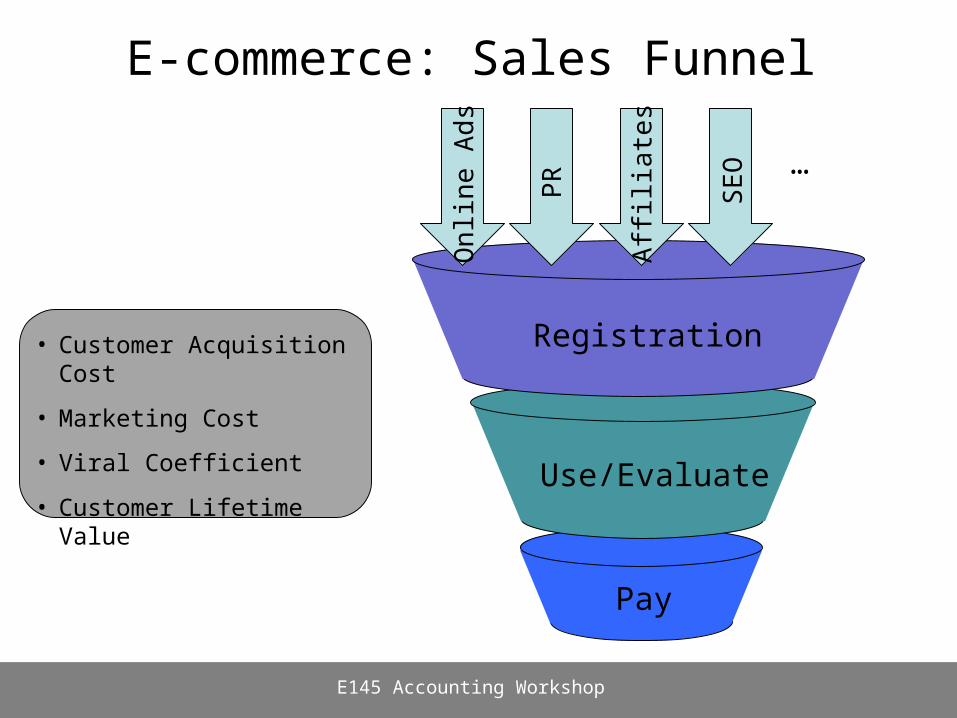
E-commerce: Sales Funnel
E145 Accounting Workshop
…
Pay
Use/Evaluate
Registration
On
line
Ad
s
PR
Affi
liate
s
SE
O
• Customer Acquisition Cost
• Marketing Cost
• Viral Coefficient
• Customer Lifetime Value

E145 Accounting Workshop
Source: Josh Koppelman Blog

Cohort Analysis: Retention
E145 Accounting Workshop
Source: Josh Koppelman Blog

Tools of the trade: Waterfall
E145 Accounting Workshop