Copyright ©2012 eMarketer, Inc. All rights reserved.
Video Ad Metrics 2
Types of Video Ads 8
Video Ad Spending 10
The Digital Video Audience 12
Conclusions 18
Related Links 18
November 2012
Executive Summary: The valuable digital video audience is growing in both number and time spent viewing content. Much of that content is increasingly ad-supported, which puts an ever-greater focus on the metrics used to measure results. 137376
The data gathered from a variety of advertising campaigns during different time periods by several video-ad firms should best be viewed as basic indicators of larger trends. That’s because a plethora of factors will color the results of any single metric, such as completion rate, for a specific campaign. Those factors include everything from the time of day an ad runs to the nature of the creative.
But to orient marketers, this benchmarks report offers an overview of the latest data about several core, interrelated categories:
■ Digital video ad metrics, including completion rate, engagement and brand health
■ Video ad types, such as pre-roll and in-banner
■ Ad spending forecasts, for both computers and mobile
■ Video audience, including size, time spent, favorite destinations and usage of video content and associated advertising
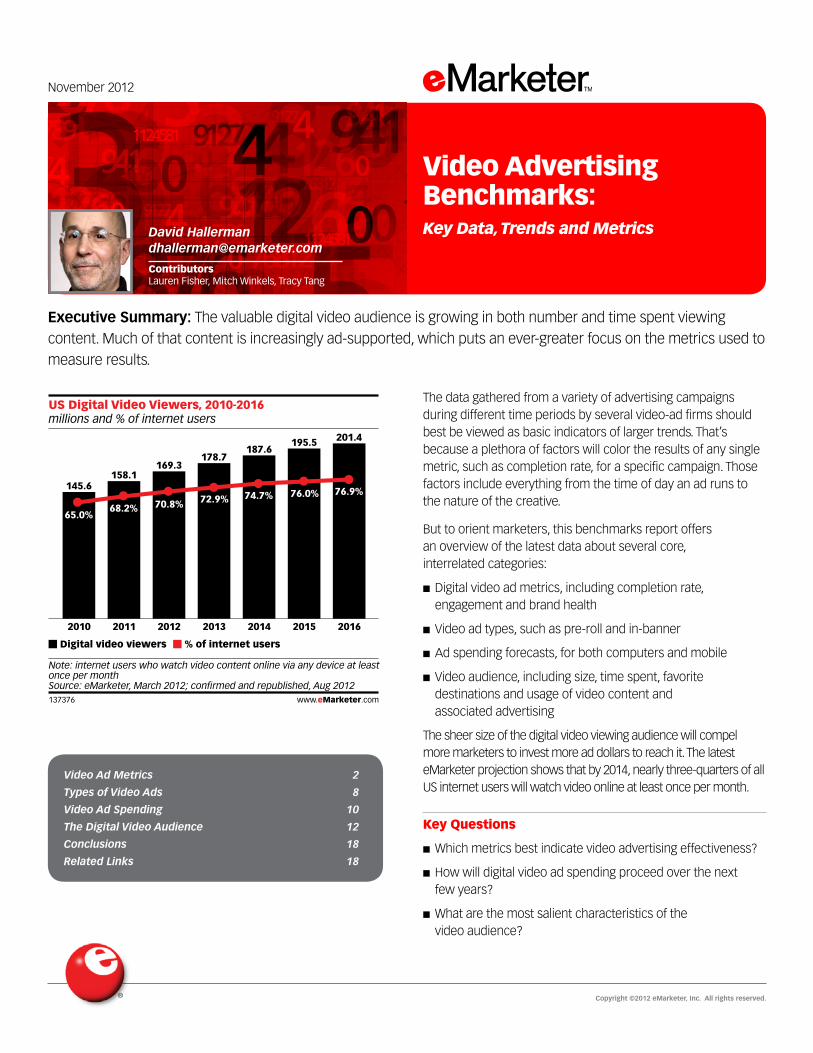
The sheer size of the digital video viewing audience will compel more marketers to invest more ad dollars to reach it. The latest eMarketer projection shows that by 2014, nearly three-quarters of all US internet users will watch video online at least once per month.
Key Questions
■ Which metrics best indicate video advertising effectiveness?
■ How will digital video ad spending proceed over the next few years?
■ What are the most salient characteristics of the video audience?
millions and % of internet usersUS Digital Video Viewers, 2010-2016
2010
145.6
65.0%
2011
158.1
68.2%
2012
169.3
70.8%
2013
178.7
72.9%
2014
187.6
74.7%
2015
195.5
76.0%
2016
201.4
76.9%
Digital video viewers % of internet users
Note: internet users who watch video content online via any device at leastonce per monthSource: eMarketer, March 2012; confirmed and republished, Aug 2012137376 www.eMarketer.com
David Hallerman [email protected]
Contributors Lauren Fisher, Mitch Winkels, Tracy Tang
Video Advertising Benchmarks: Key Data, Trends and Metrics

Video Advertising Benchmarks: Key Data, Trends and Metrics Copyright ©2012 eMarketer, Inc. All rights reserved. 2
Video Ad Metrics
The metrics used to measure video advertising’s results are influenced by a host of factors. That’s why the examples given in this benchmarks report are best used as guidelines, not absolute rules, for any campaign.
The elements that color nearly all online video ad metrics include:
■ The length and nature of the content an ad runs against
■ The type of site where an ad is viewed
■ The device used to view the video
■ The time of day or day of the week when an ad runs
■ The degree to which the audience is habituated to digital video advertising
■ The advertising creative itself
For digital video advertising—on computers, mobile devices and connected TVs—the core metrics include:
■ Clickthrough rate
■ Completion rate
■ Engagement, including views, interactivity and the degree of attention paid to the advertising
■ Brand health, such as awareness or favorability
■ Gross rating points (GRPs) and target rating points (TRPs)
Clickthrough Rates
Clickthrough rates for online video ads can vary widely due to the factors above.
For example, in one study from VINDICO, a video ad serving and tracking company, ads in short-form content (i.e., less than 10 minutes long) garnered slightly higher CTRs than in long-form content during Q2 2012. It also found that ads in video portals were clicked more often than ads in business/news sites.
Ads run against shorter videos likely get a higher CTR because the audience isn’t really invested in the content; a longer video indicates a deeper commitment to the content. Similarly, CTRs on portals (such as YouTube) likely reflect audience behavior on those sites—users have an expectation of viewing multiple smaller pieces of content and may be less averse to the idea of interrupting the experience by clicking on an ad.
Clickthrough and Completion Rate of Digital VideoAds Served to US-Based Audiences, by ContentLength and Site Type, Q2 2012
Clickthrough rate Completion rate
Content lengthLong-form 0.63% 91%
Short-form 0.85% 73%
Site typeFull episode player 0.64% 93%
Video portal 1.75% 84%
Business/news 1.04% 83%
Portal 0.66% 74%
Lifestyle 0.96% 73%
Ad network 0.73% 68%
Source: VINDICO, "Insights 2012 Q2," Oct 5, 2012146267 www.eMarketer.com
146267
It’s important to reiterate, though, how much these measures can vary. For instance, VINDICO’s data from the first quarter of 2012 showed clickthrough rates on video portals of 2.38%, a CTR more than half a percentage point higher than during the second quarter.
The variability of the data shows how metrics from diverse ad campaigns can only roughly indicate market trends. Your mileage may vary—and likely will.
Completion Rates
Completion rates are a core metric for audience engagement. When a user views a video ad for its full length, marketers can be more confident that their message got across.
One would assume that shorter ads would have higher completion rates, and data from video ad network YuMe supports that assumption. In each of the quarters in the chart below, shorter ads saw higher completion rates.
Average Completion Rate for US Online Video Pre-RollAds, by Video Ad Length, Q1 2011, Q1 & Q2 2012
Q1 2011 Q1 2012 Q2 2012
15 seconds 69% 74% 76%
30 seconds 66% 62% 65%
30+ seconds 50% 37% 40%
Total 67% 68% 69%Note: among 2,000+ publishers in the YuMe networkSource: YuMe, "Q1 2012 Video Advertising Metrics Report" & "Q2 2012Video Advertising Metrics Report," Aug 2012147041 www.eMarketer.com
147041
Besides the length of the ad, several additional factors influence completion rates—in particular, the length of the content the ad is attached to. Research from FreeWheel, a video-content management company, makes that abundantly clear. In a study of digital video ad completion rates during the first half of 2012, FreeWheel found completion rose noticeably as the length of content grew.

Video Advertising Benchmarks: Key Data, Trends and Metrics Copyright ©2012 eMarketer, Inc. All rights reserved. 3
Completion Rate for Digital Video Ads AmongUS-Based Audiences, by Content Length, Q1 2011-Q2 2011
Q1 2011
Q2 2011
Q3 2011
Q4 2011
Q1 2012
Q2 2012
Long-formcontent
(20+ minutes)
85%
81%
82%
88%
85%
91%
Mid-formcontent
(5-20 minutes)
67%
71%
70%
68%
76%
80%
Short-formcontent
(<5 minutes)
60%
59%
56%
54%
64%
69%
Source: FreeWheel, "FreeWheel Video Monetization Report Q2 2012," Aug8, 2012144243 www.eMarketer.com
144243
Time of day is an important factor as well. An analysis by VideoHub found that completion rates were highest between 9pm and 2am. While the hourly shares of videos streamed daily were not as high as earlier in the day, much of the video content watched during those times was likely long-form.
index and % of total
US Digital Video Ad Completions and Share of USDigital Video Streaming, by Daypart, Q1 2012
Completions(index*)
Share ofstreaming**
12am 28.9 3.23%
1am 25.7 2.73%
2am 14.6 2.75%
3am -11.9 3.19%
4am -19.4 3.25%
5am -40.5 2.62%
6am -54.2 2.58%
7am -54.7 2.87%
8am -47.3 3.29%
9am -34.1 4.03%
10am -27.1 4.55%
11am -17.4 5.00%
12pm -9.7 5.58%
1pm -2.7 5.72%
2pm 2.0 5.45%
3pm 3.1 5.61%
4pm 3.9 5.63%
5pm 4.8 5.24%
6pm 5.9 5.00%
7pm 10.1 4.70%
8pm 17.3 4.57%
9pm 27.4 4.40%
10pm 39.9 4.19%
11pm 44.8 3.79%
Note: includes PC and mobile; *where 0 is the baseline for averageperformance; **numbers may not add up to 100% due to roundingSource: VideoHub, "Performance Replay Report: Q1 2012," June 25, 2012147125 www.eMarketer.com
147125
But for marketers more concerned about driving actual clicks from ads, it’s important to note that the connection between completion rates and clickthrough rates is not always straightforward.
Consider the implications of the data from a February 2012 study from Videology, a video ad platform:
■ With 15-second ads, the CTR peaked during the 7.5-to-11.25 second mark, with diminishing returns among those viewers closer to completion.
■ With 30-second ads, the CTR peaked during the 7.5-to-15.0 second mark, but that peak was significantly lower than for the shorter ads.
■ Longer ads tend to run with longer content, so it’s likely people click less during 30-second ads than 15-second ones because they are more involved with viewing the video they want.
■ Perhaps click rates for 15-second ads drop off appreciably close to the end because viewers realize the ad is almost over, and therefore don’t want to click away when the content they are trying to access is so close at hand.
index*
Clickthrough Rate for 30- and 15-Second Online Video Ads Served to US-Based Audiences, by Time Spent Watching Ad, Feb 2012
0.0-3.75 seconds
3.75-7.5 seconds
7.5-11.25 seconds
11.5-15.0 seconds
15-second ad
51
167
178
109
0.0-7.5 seconds
7.5-15.0 seconds
15.0-22.5 seconds
22.5-30.0 seconds
30-second ad
96
112
104
92
Note: read chart as 12% more viewers click on a 30-second spot afterwatching it for 7.5-15.0 seconds compared to overall CTR average; *where average=100Source: Videology, "Video Wars: Click Through vs. Completion Rates," March 27, 2012138512 www.eMarketer.com
138512
Perhaps the most important takeaway is not to expect click and completion rates to grow in tandem.
Other Engagement Markers
In addition to completion rate, other key forms of engagement measured for video include:
■ Time spent viewing the ad, even if not to completion
■ Interactivity, such as starting the ad or mousing over it
■ Dwell rate, a term used by some vendors to measure the proportion of impressions that were intentionally engaged with by touch, interaction or click
■ When people share the ad or comment on it—the social, word-of-mouth or viral aspects of engagement
■ Visiting a brand’s website as a result, even if not directly, of viewing the video ad
Simply paying attention is, in many ways, the core engagement metric. A May 2012 study from YuMe and IPG Media Lab looked to measure the amount of attention people
Video Ad Metrics

Video Advertising Benchmarks: Key Data, Trends and Metrics Copyright ©2012 eMarketer, Inc. All rights reserved. 4
paid to videos based on their location and the devices used. While this research did not focus explicitly on advertising, the attention the audience pays to the screen will, in most cases, translate to all the videos, content and ads alike.
In that light, some of the best combinations for an attentive audience were:
■ Watching connected TV at home, sitting at a desk or table
■ Watching either computers or “linear” (i.e., traditional) TV in bed at home
■ Watching video on computers at home on the couch
In general, the lowest attention scores were either on mobile devices or while doing some other activity.
average rating on a 10-point scale*
Amount of Attention US Video Viewers Give to Video,by Location and Device, May 2012
Home, in bed
Home, sitting at adesk or table
Home, on the couch
Home, while doing an activity
Office
Other, neither homenor work
Mobile(n=91)
6.6
5.8
6.2
5.0
5.5
5.5
PC(n=84)
7.4
7.1
7.3
6.1
6.7
6.7
ConnectedTV
(n=57)
5.7
7.9
6.1
5.0
-
-
LinearTV
(n=78)
7.4
6.8
6.3
4.4
-
-
Total
6.8
6.8
6.4
5.1
6.0
6.0
Note: read as among people who watch video on a mobile device on thecouch, their level of attention got an average rating of 6.2 on a 10-pointscale; *where 10=max attentionSource: YuMe and IPG Media Lab, "Are All Screens Created Equal?" Sep 17,2012145655 www.eMarketer.com
145655
Research firm Prosper Mobile Insights offered another perspective by looking at how often smartphone or tablet owners, depending on activity, paid attention to ads. It found that viewers of either gender were less likely to pay attention to ads when either watching video clips or full-length TV episodes.
In contrast, smartphone or tablet viewers paid more attention to ads—not necessarily video ones—when simply surfing the web or visiting social media sites.
% of total
Frequency with Which US Smartphone/Tablet OwnersPay Attention to Ads While Using Select MobileContent, by Gender, May 2012
Surfing the web
Visiting social media sites
Playing games
Downloading apps/music/etc.
Shopping on device
Watching video clips
Watching full TV episodes
MaleRegularly
Occasionally
Never
FemaleRegularly
Occasionally
Never
TotalRegularly
Occasionally
Never
38.2%
37.6%
24.2%
32.8%
39.7%
27.6%
35.3%
38.7%
26.0%
27.4%
33.1%
39.5%
26.4%
32.2%
41.4%
26.9%
32.6%
40.5%
23.6%
25.5%
51.0%
20.1%
32.2%
47.7%
21.8%
29.0%
49.2%
22.3%
36.9%
40.8%
19.5%
32.2%
48.3%
20.8%
34.4%
44.7%
21.7%
33.8%
44.6%
16.1%
34.5%
49.4%
18.7%
34.1%
47.1%
17.8%
37.6%
44.6%
12.6%
38.5%
48.9%
15.1%
38.1%
46.8%
15.3%
22.3%
62.4%
11.5%
23.6%
64.9%
13.3%
23.0%
63.7%
Note: n=331; numbers may not add up to 100% due to roundingSource: Prosper Mobile Insights, June 6, 2012141365 www.eMarketer.com
141365
One implication of these mobile viewing results is that small devices might not (yet) be the most hospitable places for video advertising.
Sharing is another prime engagement metric. While most videos that people share are not advertising, a July 2012 study conducted by Harris Interactive for MediaBrix, a social and mobile ad company, found that of Facebook users who have shared a video ad on the social site, 59% were female and 41% were male.
The Harris Interactive study’s outcome has major implications for advertisers looking to entice the audience into a viral video campaign, pointing to better results for efforts targeting women.
Abandonment and Opt-In
Completion’s opposite is abandonment—the audience deserting an ad before it is finished. VINDICO data shows that the vast majority of people who abandon digital video ads do so before an ad’s midpoint. Interestingly, viewers may give ads more of a chance when viewing short-form rather than long-form content; that’s likely due to shorter ads running against shorter content.
Video Ad Metrics

Video Advertising Benchmarks: Key Data, Trends and Metrics Copyright ©2012 eMarketer, Inc. All rights reserved. 5
Abandonment Rate for Digital Video Ads Served toUS-Based Audiences, by Content Length and SiteType, Q1 2012
Before midpoint After midpoint
Content lengthLong-form 92% 9%
Short-form 70% 30%
Site typeFull episode player 90% 10%
Video portal 95% 5%
Business/news 87% 13%
Lifestyle 80% 20%
Ad network 75% 25%
Portal 75% 25%
Note: includes mobile video ads; read chart as saying 90% of viewers whoabandoned an ad, abandoned the ad before the midpointSource: VINDICO, "Insights 2012 Q1," May 14, 2012140752 www.eMarketer.com
140752
What does that mean for advertisers? Make sure to put key branding elements early in the ad, to capture some attention from the entire audience, including those viewers bound to click away before the midpoint.
However, in the hopes of countering ad abandonment, marketers and video sites are increasingly offering the audience some kind of viewing choice or opt-in.
For example, the abandonment rate for video ads on the AdoTube network decreased when viewers were given the ability to opt out completely (what the video technology firm calls a “polite pre-roll”) or to choose which pre-roll ad to see before the content started.
Performance Metrics for Pre-Roll Online Video AdsServed* to a US-Based Audience, Q3 2011
Pre-roll
Polite pre-roll**
Ad selector
Click-through
rate
2.0%
2.2%
4.0%
View-through
rate (25%)
75.0%
66.0%
80.0%
View-through
rate (100%)
59.0%
47.0%
65.0%
Closerate
-
18.0%
10.0%
Abandonmentrate
39.0%
32.8%
21.0%
Note: *over the AdoTube network; **gives the viewer the ability to viewthe ad anytime during the video or to opt out completelySource: AdoTube, "Q3 2011 Format Index," Dec 19, 2011135364 www.eMarketer.com
135364
Video advertising can learn from successful email marketing, in that by giving consumers the choice whether to receive those marketing messages, they become more receptive to the pitch. That’s likely why 32% of online video viewers (the largest single segment) in an April 2012 survey taken in Canada by Yahoo! said the ability to close or skip a video ad was the primary factor that affected their receptivity.
The Yahoo! survey results were echoed by a July 2012 study from MediaBrix, which found that 62% of mobile app users and 63% of Facebook app users preferred video ads that they could initiate.
As they do for all other metrics, various elements color engagement results for opt-in video ads. For example, in an August 2012 study from Jun Group, an opt-in video platform provider, engagement rates were highest for video ads that were 30 to 60 seconds long.
Engagement Rate of US Opt-In Online Video Ads fromFortune 500 Brands, by Length, Aug 2012
0-15 seconds 3.52%
16-30 seconds 2.79%
30-60 seconds 4.50%
60-120 seconds 3.51%
2+ minutes 3.72%
Source: Jun Group, "The State of Opt-In Video & Consumer Engagement,"Sep 27, 2012145877 www.eMarketer.com
145877
The potential implications here are at least threefold:
■ Ads that were short produced lesser levels of engagement because there was not enough time for the brand’s creative to fully connect with the audience.
■ Ads that were long also had lower engagement because they demanded too much from the audience.
■ Giving the audience the chance to opt in is more likely to raise engagement rates no matter the ad’s length.
Perhaps this is best viewed as the Goldilocks principle, where the greatest engagement requires that the ad length be just right.
Brand Health Metrics
Just as with TV commercials, digital video ads are often measured through panel-based brand health metrics. These metrics, arranged in a funnel pattern, top to bottom, include:
■ Awareness, both aided and unaided
■ Familiarity, or message association
■ Consideration, or favorability
■ Purchase intent
■ Loyalty, or preference
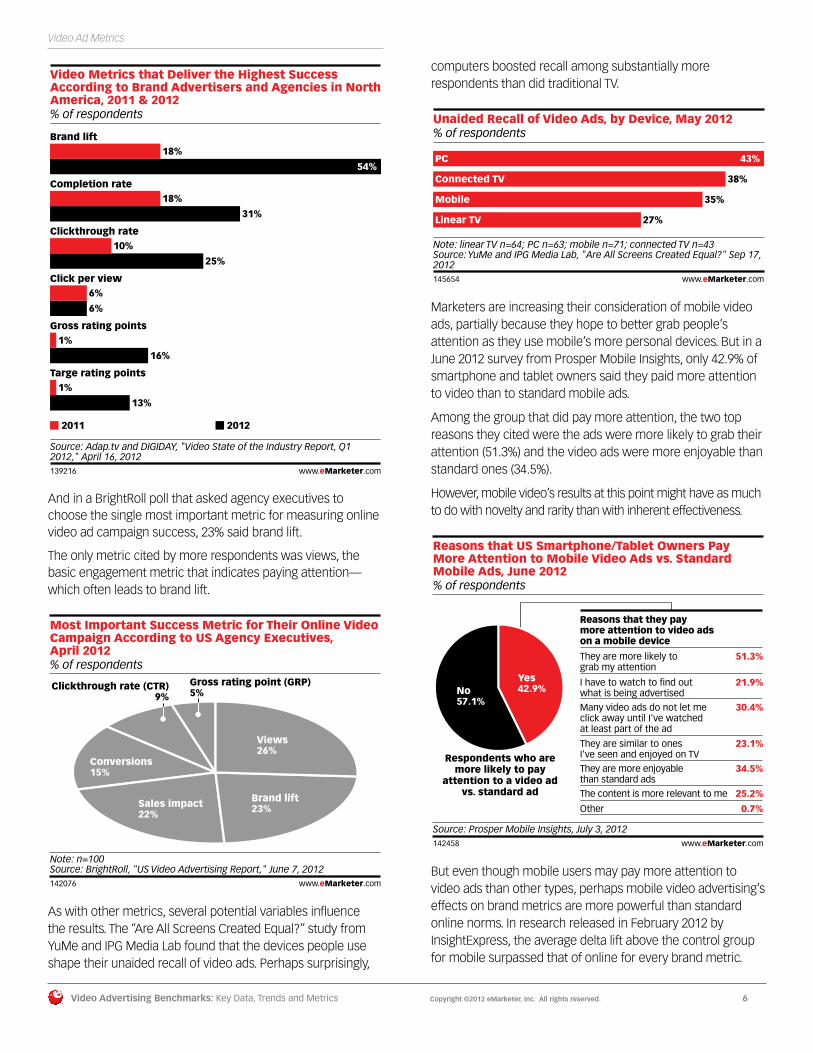
Brand lift, or the overall increase among the various brand health markers, was cited as the video metric that delivered the highest level of success by the most respondents (54%) in a 2012 survey from Digiday and Adap.tv.
Video Ad Metrics
Video Advertising Benchmarks: Key Data, Trends and Metrics Copyright ©2012 eMarketer, Inc. All rights reserved. 6
% of respondents
Video Metrics that Deliver the Highest SuccessAccording to Brand Advertisers and Agencies in NorthAmerica, 2011 & 2012
Brand lift18%
54%
Completion rate18%
31%
Clickthrough rate10%
25%
Click per view6%
6%
Gross rating points1%
16%
Targe rating points1%
13%
2011 2012
Source: Adap.tv and DIGIDAY, "Video State of the Industry Report, Q12012," April 16, 2012139216 www.eMarketer.com
139216
And in a BrightRoll poll that asked agency executives to choose the single most important metric for measuring online video ad campaign success, 23% said brand lift.
The only metric cited by more respondents was views, the basic engagement metric that indicates paying attention—which often leads to brand lift.
% of respondents
Most Important Success Metric for Their Online VideoCampaign According to US Agency Executives, April 2012
Views26%
Brand lift23%Sales impact
22%
Conversions15%
Clickthrough rate (CTR)9%
Gross rating point (GRP)5%
Note: n=100Source: BrightRoll, "US Video Advertising Report," June 7, 2012142076 www.eMarketer.com
142076
As with other metrics, several potential variables influence the results. The “Are All Screens Created Equal?” study from YuMe and IPG Media Lab found that the devices people use shape their unaided recall of video ads. Perhaps surprisingly,
computers boosted recall among substantially more respondents than did traditional TV.
% of respondentsUnaided Recall of Video Ads, by Device, May 2012
PC 43%
Connected TV 38%
Mobile 35%
Linear TV 27%
Note: linear TV n=64; PC n=63; mobile n=71; connected TV n=43Source: YuMe and IPG Media Lab, "Are All Screens Created Equal?" Sep 17,2012145654 www.eMarketer.com
145654
Marketers are increasing their consideration of mobile video ads, partially because they hope to better grab people’s attention as they use mobile’s more personal devices. But in a June 2012 survey from Prosper Mobile Insights, only 42.9% of smartphone and tablet owners said they paid more attention to video than to standard mobile ads.
Among the group that did pay more attention, the two top reasons they cited were the ads were more likely to grab their attention (51.3%) and the video ads were more enjoyable than standard ones (34.5%).
However, mobile video’s results at this point might have as much to do with novelty and rarity than with inherent effectiveness.
% of respondents
Reasons that US Smartphone/Tablet Owners PayMore Attention to Mobile Video Ads vs. StandardMobile Ads, June 2012
Source: Prosper Mobile Insights, July 3, 2012142458 www.eMarketer.com
Respondents who aremore likely to pay
attention to a video advs. standard ad
Yes42.9%No
57.1%
Reasons that they pay more attention to video ads on a mobile device
They are more likely to grab my attention
I have to watch to find out what is being advertised
Many video ads do not let me click away until I've watched at least part of the ad
They are similar to ones I've seen and enjoyed on TV
They are more enjoyable than standard ads
The content is more relevant to me
Other
51.3%
21.9%
30.4%
23.1%
34.5%
25.2%
0.7%
142458
But even though mobile users may pay more attention to video ads than other types, perhaps mobile video advertising’s effects on brand metrics are more powerful than standard online norms. In research released in February 2012 by InsightExpress, the average delta lift above the control group for mobile surpassed that of online for every brand metric.
Video Ad Metrics

Video Advertising Benchmarks: Key Data, Trends and Metrics Copyright ©2012 eMarketer, Inc. All rights reserved. 7
Later research from InsightExpress showed that for all but one brand health metric, tablets surpassed mobile averages. That’s not surprising, since tablets are clearly a better video advertising vehicle than small smartphone screens.
average delta* above control
Mobile and Tablet Advertising's Effect on BrandMetrics in the US, June 2012
Online ad awareness43%
26%
Purchase intent24%
11%
Brand favorability17%
9%
Unaided awareness14%
9%
Aided awareness14%
7%
Message association8%
16%
Tablet campaigns Mobile InsightNorms
Note: *delta defined as point difference in exposed vs. control groupsSource: InsightExpress as cited in company blog, June 13, 2012141597 www.eMarketer.com
141597
However, this research was for digital advertising in general, not video specifically.
Cross-Platform Metrics
For many brand marketers, digital video advertising and TV commercials are fused at the hip. But the metrics used to measure the two sides of video advertising—well, they’re less fused.
The value of having unified video and TV metrics was cited as very or most important by 64% of the brand advertisers and agencies surveyed in April 2012 by Adap.TV and Digiday.
% of total
Level of Importance for Unified TV and Video MetricsAccording to Brand Advertisers and Agencies in North America, April 2012
Most important13%
Very important51%
Somewhat important28%
Lessimportant
8%
Source: Adap.tv and DIGIDAY, "Video State of the Industry Report, Q12012," April 16, 2012139215 www.eMarketer.com
139215
A good number of marketers consider GRPs—a traditional TV metric—and its sibling TRPs to be useful cross-platform metrics. GRPs gauge total audience size using reach times frequency, expressed as a percentage, while TRPs measure GRPs times the ratio of the targeted audience to the total audience.
In an early 2012 poll from the Association of National Advertisers (ANA) and Forrester Research, 48% of the respondents cited either TRPs or GRPs as the future industry standard for cross-platform audience measurement.
% of respondents
Future Industry Standard for Cross-Platform AudienceMeasurement According to US Marketers, 2012
Unique visitors/watchers47%
Target rating points(TRPs)
31%
Gross rating points (GRPs)
17%
Other4%
Note: n=70; numbers may not add up to 100% due to roundingSource: Association of National Advertisers (ANA) and Forrester Research, “2012 TV & Everything Video Survey,” March 20, 2012138367 www.eMarketer.com
138367
A similar but more digital-focused metric—unique visitors or watchers—was mentioned by 47% of the ANA survey’s participants.
In another survey, this from BrightRoll in April 2012, one-third of agency executives said targeted unique viewers was the online video audience measurement that their clients valued the most. In contrast, about one-quarter of that group cited GRPs or TRPs as the best way to gauge video audience.
Video Ad Metrics

Video Advertising Benchmarks: Key Data, Trends and Metrics Copyright ©2012 eMarketer, Inc. All rights reserved. 8
% of respondents
Online Video Audience Measurement Metrics ValuedMost by the Clients of US Agency Executives, April 2012
Target uniques33.3%
Target impressions25.7%
Gross rating point (GRP) or target rating point (TRP)24.8%
Uncertain11.4%
Other4.8%
Note: n=105Source: BrightRoll, "US Video Advertising Report," June 7, 2012142074 www.eMarketer.com
142074
However, tying the effects of digital video advertising to results offline—another prime cross-channel measurement goal—is still difficult for many marketers. In the 2012 version of the BrightRoll study, 28.6% of respondents said they wanted to see additional research on how digital video advertising affects offline purchase behavior.
% of respondents
Areas of Online Video Ads for Which US AgencyExecutives Would Like to See Additional Research,2011 & 2012
Performance vs. TV advertising
Change in purchase intent or brand lift
Impact on offline purchase behavior
Brand effectiveness
Translation of gross rating point (GRP) to online video buying
Audience profiling
2011
28.6%
27.7%
16.1%
12.5%
11.6%
3.6%
2012
22.9%
17.1%
28.6%
7.6%
18.1%
5.7%Note: 2011 n=112; 2012 n=105; numbers may not add up to 100% due toroundingSource: BrightRoll, "US Video Advertising Report," June 7, 2012142075 www.eMarketer.com
142075
Types of Video Ads
The video category consists of three basic types of ads:
■ In-stream video ads, which can be pre-roll, mid-roll or post-roll. These run in the same player as the video content.
■ In-banner video ads, which are not connected with video content and therefore could appear on any webpage; they typically need to be started by the user.
■ Branded video content, which refers to longer-form ads sponsored by the marketer. Sometimes the audience does not even view this branded content as an ad, since most of the video contains potentially valuable information or entertainment.
While there are also video overlay ads, which appear over the content people are viewing, in nearly all cases those overlays are simply small banners and are not themselves in a video format.
Many brands favor in-stream video ads, since they are most akin to the TV commercials those marketers are most familiar with.
Data from the YuMe video ad network showed a prevalence of pre-roll video ads in both Q1 and Q2 2012.
% of total
Types of Online Video Ads Served to US-BasedAudiences, Q1 & Q2 2012
Note: among 2,000+ publishers in the YuMe network; numbers may notadd up to 100% due to roundingSource: YuMe, "Q2 2012 Video Advertising Metrics Report," Aug 2012146010 www.eMarketer.com
Q1 2012 Q2 2012
Connected TVs2% Banner
1%
YuMe pre-roll84%
YuMeads9%
Mobile4%
YuMe pre-roll76%
YuMeads13%
Mobile7%
Connected TVs2% Banner
1%
146010
Three things to note here:
■ The drop in pre-roll’s share from 84% to 76% is not necessarily meaningful, since it’s a short period of time.
■ In addition, part of the decreased share was taken up by an increase in proprietary YuMe ads (which the company has more incentive to sell) and the other part was taken up by an increase in mobile (which could also be in-stream ads).
■ The term “pre-roll” seems to be used here as a synonym for all in-stream ads.
Video Ad Metrics

Video Advertising Benchmarks: Key Data, Trends and Metrics Copyright ©2012 eMarketer, Inc. All rights reserved. 9
Further results from the same study indicate that more than one-half of pre-roll ads in both Q1 and Q2 2012 were 30 seconds long. That’s a major jump from Q1 2011, when the video ad network reported that only 38.7% of pre-rolls were 30-second ads.
The increase in the number of longer ads was likely due to two main factors:
■ Marketers realizing the audience will sit through longer ads
■ More long-form video content available to support longer ads
% of total
US Online Video Pre-Roll Ads Share, by Video Length,Q1 & Q2 2012
Note: numbers may not add up to 100% due to rounding; among 2,000+publishers in the YuMe networkSource: YuMe, "Q2 2012 Video Advertising Metrics Report," Aug 2012146011 www.eMarketer.com
Q1 2012 Q2 2012
30 seconds56.0%
30+ seconds0.7%
15 seconds43.0%
30 seconds55.0%
30+ seconds3.0%
15 seconds42.0%
146011
Research from the IAB of Canada and BrightRoll shows that in August 2012, pre-roll video ads were far more common on the desktop internet (96%) than on either tablets (30%) or smartphones (26%). Other types of digital video ads were even less common on tablets and mobile devices.
% of respondents
Types of Digital Video Ads that Advertisers in CanadaHave Used* in Media Plans, by Channel, Aug 2012
Pre-roll
Companion ads
In-banner video (nonexpanding)
User-initiated expand to full-screen (e.g., adframes, firefly, videobox, pimento)
Overlay video ads (pre, mid, post-roll clickable)
Mid-roll
Overlay video ads(transparent text, clickable)
Post-roll
Internet
96%
74%
61%
61%
37%
35%
25%
20%
Tablet
30%
7%
7%
5%
5%
7%
2%
3%
Mobile
26%
6%
9%
9%
4%
4%
4%
1%
Note: *in the past 12 monthsSource: BrightRoll and Interactive Advertising Bureau of Canada (IAB Canada), "Canada Video Advertising Report,” Sep 26, 2012145846 www.eMarketer.com
145846
The relative paucity of non-computer video ads could shift as mobile and tablet use rise. However, as long as users pay for data-capped 3G and 4G connections, high-bandwidth video
ads will be somewhat unwelcomed. That could be overcome by newer technologies to further compress video data, lessening consumers’ bandwidth and data-limit concerns about video advertising.
Further insights from the IAB of Canada/BrightRoll report include:
■ In-banner ads can be further divided into two types: expanding and nonexpanding.
■ In-stream ads also come in two types: clickable and not.
For online TV shows, the main types of video ads in an early-2012 study from the ANA and Forrester Research were the three flavors of in-stream (pre-roll, mid-roll and post-roll) and a mix of both unskippable ads—which is true of most in-stream ads—and ones that can be skipped. (For more on noncompulsory video advertising, see the “Abandonment and Opt-In” section above.)
% of respondents
Types of Ads Used by US Marketers Within Online TV Shows, 2012
Pre-roll ads
Banner ads around the onlineTV show video window
Post-roll ads
Mid-roll
15-second, unskippable adsin online TV shows
Ads targeted to specific viewers of online TV shows30-second, unskippable adsin online TV shows30-second spots in online TVshows that can be skippedOverlays and screen crawls
Audience-basedbuying
36%
27%
25%
24%
22%
19%
19%
9%
5%
Content-basedbuying
27%
30%
19%
17%
17%
19%
12%
15%
19%
Not currently
using
16%
23%
26%
28%
31%
32%
38%
43%
38%
Note: n=62Source: Association of National Advertisers (ANA) and Forrester Research, “2012 TV & Everything Video Survey”, March 20, 2012138369 www.eMarketer.com
138369
Types of Video Ads

Video Advertising Benchmarks: Key Data, Trends and Metrics Copyright ©2012 eMarketer, Inc. All rights reserved. 10
Video Ad Spending
Here’s what’s at stake for the most expensive form of digital advertising—and the one most attractive to brand marketers. Spending for video advertising, both desktop and mobile, will rise from $2.93 billion in 2012 to $8.04 billion in 2016.
Four years from now, eMarketer estimates, digital marketers will spend more on only search and banner ads than on video.
billionsUS Digital Ad Spending, by Format, 2010-2016
Search
Display
—Banner ads
—Video
—Rich media
—Sponsorships
Classifieds anddirectories
Leadgeneration
Mobilemessaging
Total
2010
$12.00
$9.91
$6.23
$1.42
$1.54
$0.72
$2.60
$1.34
$0.25
$0.20
$26.29
2011
$15.10
$12.33
$7.55
$2.00
$1.65
$1.12
$2.58
$1.52
$0.25
$0.21
$31.99
2012
$17.58
$14.98
$8.68
$2.93
$1.82
$1.56
$2.60
$1.71
$0.23
$0.22
$37.31
2013
$19.76
$17.67
$9.60
$4.14
$2.03
$1.90
$2.71
$1.90
$0.23
$0.23
$42.50
2014
$21.73
$20.69
$10.27
$5.75
$2.38
$2.28
$2.81
$2.09
$0.22
$0.24
$47.77
2015
$23.32
$23.13
$10.87
$6.99
$2.69
$2.59
$2.88
$2.17
$0.21
$0.24
$51.95
2016
$24.45
$25.21
$11.29
$8.04
$3.03
$2.86
$2.95
$2.20
$0.20
$0.24
$55.25Note: includes advertising that appears on desktop and laptop computersas well as mobile phones and tablets on all formats mentioned; datathrough 2011 is derived from IAB/PwC dataSource: eMarketer, Sep 2012144427 www.eMarketer.com
144427
Video’s large spending leaps translate to annual growth rates ranging as high as 46.5%, faster growth than for any other digital ad format.
Some perspective is needed here, though. Even with its rapid spending growth, video will contribute only 7.9% to the overall US digital spending universe in 2012. However, video’s share of the total will reach 14.5% in 2016.
While video’s share among all digital ad formats is relatively slim (largely because search spending is so high by comparison), video’s share of display advertising is much more significant.
■ In 2012, about one-in-five display dollars will go to video.
■ By 2016, almost one-third of display spending will be for video.
■ Basically, as video’s share grows, banners’ share will shrink.
% of total and billions
US Digital Display Ad Spending Share, by Format,2010-2016
2010 total spending $9.9162.9% 14.3% 15.5% 7.2%
2011 total spending $12.3361.3% 16.2% 13.4% 9.1%
2012 total spending $14.9857.9% 19.6% 12.1% 10.4%
2013 total spending $17.6754.3% 23.4% 11.5% 10.8%
2014 total spending $20.6949.7% 27.8% 11.5% 11.0%
2015 total spending $23.1347.0% 30.2% 11.6% 11.2%
2016 total spending $25.2144.8% 31.9% 12.0% 11.4%
Banners Video Rich media Sponsorships
Note: includes advertising that appears on desktop and laptop computersas well as mobile phones and tablets; data through 2011 is derived fromIAB/PwC data; numbers may not add up to 100% due to roundingSource: eMarketer, Sep 2012144448 www.eMarketer.com
144448
At this point, the industries spending the most for online video advertising include consumer packaged goods (CPG), health/pharma and entertainment, according to Q1 2012 data from YuMe.
% of total
Leading US Industries, Ranked by Online Video AdSpending Share, Q1 2012
Consumer packaged goods 25%
Health/pharma 23%
Entertainment 12%
Consumer electronics8%
Financial services7%
Auto 6%
Retail 6%
Telecom 5%
Travel 5%
Other* 5%
Note: among 2,000+ publishers in the YuMe network; numbers may notadd up to 100% due to rounding; *advertisers that do not belong to acommon industry verticalSource: YuMe, "2012 Q1 Video Advertising Metrics Report," July 30, 2012145027 www.eMarketer.com
145027
Videology data for the same quarter also shows CPG with the greatest share of video—in this case, measured by impressions, not dollars—with a much larger (37.1%) slice. In further contrast to the YuMe figures, the finance and telecom industries were the second and third biggest buyers of video

Video Advertising Benchmarks: Key Data, Trends and Metrics Copyright ©2012 eMarketer, Inc. All rights reserved. 11
ad impressions, at 12.5% and 10.0%, respectively.
What’s implied here, when industries have a greater share of impressions than dollars for the same quarter, is the relative lower cost for video ad inventory for those particular industries. By contrast, an industry such as healthcare—which had a substantially higher share of spending (23%) than impressions (2.5%)—is likely buying more costly video inventory.
The caveat to keep in mind here is that while the data comes from the same time period, it comes from different sources.
Mobile video ad spending growth is even greater than that for the overall digital market. That’s not surprising, for three reasons:
■ Mobile video spending is coming from a much smaller base.
■ Mobile’s usage is continuing to rise dramatically.
■ Marketers are still figuring out how best to use mobile video in their campaigns.
During every year from 2012 to 2016, the growth rates for mobile video ad spending will surpass those of other display formats and of search.
% changeUS Mobile Ad Spending Growth, by Format, 2010-2016
Display—Video
—Rich media
—Banners
SearchSMS/MMS/P2Pmessaging
Total
2010
152.4%132.3%
2,452.2%
132.0%
204.3%11.0%
85.0%
2011
108.3%132.4%
947.0%
11.8%
157.8%-1.1%
88.5%
2012
102.0%122.1%
103.0%
95.0%
96.0%-9.5%
80.0%
2013
79.4%98.1%
78.1%
74.6%
72.4%-0.9%
69.0%
2014
55.0%76.5%
55.5%
46.4%
50.9%-2.9%
50.0%
2015
44.1%56.4%
44.2%
38.5%
37.1%-3.1%
39.0%
2016
33.6%43.3%
33.7%
28.4%
26.1%-4.7%
29.0%Source: eMarketer, Sep 2012144575 www.eMarketer.com
144575
Mobile video spending will rise from more than $151 million in 2012 to almost $1.2 billion in 2016. However, even by the later year, video will represent only 10% of mobile ad outlays. In that way, mobile video will be like overall digital video spending: something more than a niche but not dominant.
millionsUS Mobile Ad Spending, by Format, 2010-2016
Search
Display
—Rich media
—Banners
—Video
SMS/MMS/P2Pmessaging
Total
$23.3
$209.9
$29.3
2010
$253.2
$262.5
$253.9
$769.6
2011
$652.8
$546.9
$244.2
$234.6
$68.2
$251.0
$1,450.7
2012
$1,279.5
$1,104.6
$495.6
$457.5
$151.5
$227.2
$2,611.3
2013
$2,206.5
$1,981.4
$882.7
$798.6
$300.1
$225.1
$4,413.0
2014
$3,329.6
$3,071.5
$1,372.6
$1,169.3
$529.6
$218.4
$6,619.5
$828.1
2015
$4,563.8
$4,425.7
$1,978.7
$1,618.9
$211.6
$9,201.1
2016
$5,756.7
$5,911.0
$2,645.5
$2,078.6
$1,186.9
$201.8
$11,869.5
Note: numbers may not add up to total due to roundingSource: eMarketer, Sep 2012144574 www.eMarketer.com
144574
Revenues for ad-supported mobile video content will more than double in 2012. And in 2013 and subsequent years, ad spending growth will be greater than for either pay-per-view downloaded or subscription-based mobile video.
% changeUS Mobile Video Revenue Growth, by Type, 2010-2016
Pay-per-viewdownload
Ad-supported
Subscription-based*Total
2010
105.4%
116.8%
21.7%
26.0%
2011
150.1%
125.7%
55.6%
62.0%
2012
149.1%
112.3%
24.2%
36.4%
2013
41.4%
95.1%
14.3%
24.9%
2014
37.9%
73.7%
14.4%
26.1%
2015
27.8%
53.9%
8.2%
20.2%
2016
17.2%
41.0%
9.9%
19.2%Note: *includes subscription services that are exclusive to mobile deviceslike SprintTV or T-Mobile TV; excludes services such as Netflix or Hulu Plusthat are accessed via multiple platformsSource: eMarketer, Oct 2012145497 www.eMarketer.com
145497
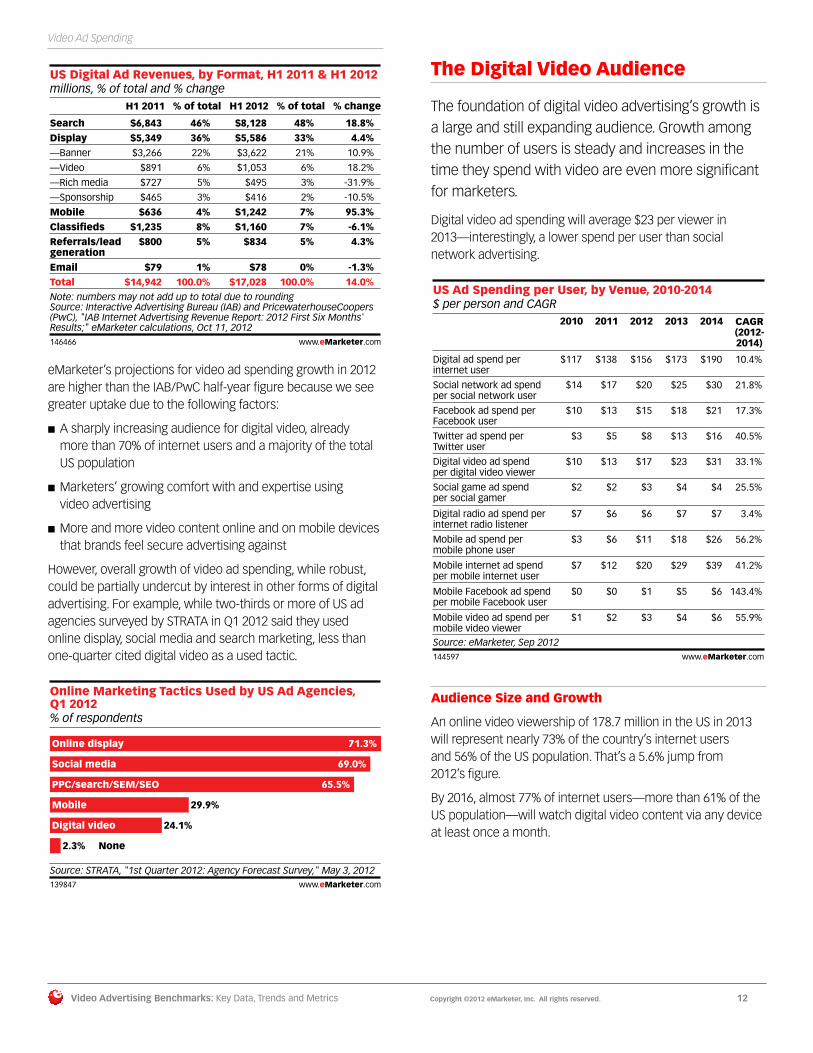
Note that more recent historic spending data from the Interactive Advertising Bureau and PricewaterhouseCoopers indicates the video ad market may be softer than in eMarketer’s September 2012 projections. In the first half of 2012, video spending grew by “only” 18.2%, according to the IAB/PwC—slightly less than the growth for paid search, a far larger advertising channel.
Video Ad Spending
Video Advertising Benchmarks: Key Data, Trends and Metrics Copyright ©2012 eMarketer, Inc. All rights reserved. 12
millions, % of total and % changeUS Digital Ad Revenues, by Format, H1 2011 & H1 2012
SearchDisplay—Banner
—Video
—Rich media
—Sponsorship
MobileClassifiedsReferrals/leadgenerationEmailTotal
H1 2011
$6,843$5,349$3,266
$891
$727
$465
$636$1,235
$800
$79$14,942
% of total
46%36%22%
6%
5%
3%
4%8%5%
1%100.0%
H1 2012
$8,128$5,586$3,622
$1,053
$495
$416
$1,242$1,160
$834
$78$17,028
% of total
48%33%21%
6%
3%
2%
7%7%5%
0%100.0%
% change
18.8%4.4%
10.9%
18.2%
-31.9%
-10.5%
95.3%-6.1%4.3%
-1.3%14.0%
Note: numbers may not add up to total due to roundingSource: Interactive Advertising Bureau (IAB) and PricewaterhouseCoopers(PwC), "IAB Internet Advertising Revenue Report: 2012 First Six Months'Results;" eMarketer calculations, Oct 11, 2012146466 www.eMarketer.com
146466
eMarketer’s projections for video ad spending growth in 2012 are higher than the IAB/PwC half-year figure because we see greater uptake due to the following factors:
■ A sharply increasing audience for digital video, already more than 70% of internet users and a majority of the total US population
■ Marketers’ growing comfort with and expertise using video advertising
■ More and more video content online and on mobile devices that brands feel secure advertising against
However, overall growth of video ad spending, while robust, could be partially undercut by interest in other forms of digital advertising. For example, while two-thirds or more of US ad agencies surveyed by STRATA in Q1 2012 said they used online display, social media and search marketing, less than one-quarter cited digital video as a used tactic.
% of respondents
Online Marketing Tactics Used by US Ad Agencies, Q1 2012
Online display 71.3%
Social media 69.0%
PPC/search/SEM/SEO 65.5%
Mobile 29.9%
Digital video 24.1%
None2.3%
Source: STRATA, "1st Quarter 2012: Agency Forecast Survey," May 3, 2012139847 www.eMarketer.com
139847
The Digital Video Audience
The foundation of digital video advertising’s growth is a large and still expanding audience. Growth among the number of users is steady and increases in the time they spend with video are even more significant for marketers.
Digital video ad spending will average $23 per viewer in 2013—interestingly, a lower spend per user than social network advertising.
$ per person and CAGRUS Ad Spending per User, by Venue, 2010-2014
Digital ad spend per internet user
Social network ad spend per social network user
Facebook ad spend perFacebook user
Twitter ad spend per Twitter user
Digital video ad spend per digital video viewer
Social game ad spend per social gamer
Digital radio ad spend per internet radio listener
Mobile ad spend per mobile phone user
Mobile internet ad spend per mobile internet user
Mobile Facebook ad spend per mobile Facebook user
Mobile video ad spend per mobile video viewer
2010
$117
$14
$10
$3
$10
$2
$7
$3
$7
$0
$1
2011
$138
$17
$13
$5
$13
$2
$6
$6
$12
$0
$2
2012
$156
$20
$15
$8
$17
$3
$6
$11
$20
$1
$3
2013
$173
$25
$18
$13
$23
$4
$7
$18
$29
$5
$4
2014
$190
$30
$21
$16
$31
$4
$7
$26
$39
$6
$6
CAGR(2012-2014)
10.4%
21.8%
17.3%
40.5%
33.1%
25.5%
3.4%
56.2%
41.2%
143.4%
55.9%
Source: eMarketer, Sep 2012144597 www.eMarketer.com
144597
Audience Size and Growth
An online video viewership of 178.7 million in the US in 2013 will represent nearly 73% of the country’s internet users and 56% of the US population. That’s a 5.6% jump from 2012’s figure.
By 2016, almost 77% of internet users—more than 61% of the US population—will watch digital video content via any device at least once a month.
Video Ad Spending

Video Advertising Benchmarks: Key Data, Trends and Metrics Copyright ©2012 eMarketer, Inc. All rights reserved. 13
US Digital Video Viewers, 2010-2016
Digital video viewers (millions)
—% change
—% of population
—% of internet users
2010
145.6
11.3%
46.9%
65.0%
2011
158.1
8.6%
50.5%
68.2%
2012
169.3
7.1%
53.5%
70.8%
2013
178.7
5.6%
56.0%
72.9%
2014
187.6
5.0%
58.2%
74.7%
2015
195.5
4.2%
60.1%
76.0%
2016
201.4
3.0%
61.3%
76.9%Note: CAGR (2010-2016)=5.6%; internet users who watch video contentonline via any device at least once per monthSource: eMarketer, March 2012; confirmed and republished, Aug 2012137375 www.eMarketer.com
137375
Of the 178.7 million digital video viewers in 2013, 110.4 million—or nearly 62%—will also be digital TV viewers. By 2016, the share of video viewers who watch TV digitally should reach 66.5%.
These TV viewer figures are extremely important, because TV is still the main content type that attracts digital video advertising.
US Digital TV Viewers, 2010-2016
Digital TV viewers(millions)
—% change
—% of online videoviewers
—% of internet users
—% of population
2010
69.6
16.6%
47.8%
31.1%
22.4%
2011
83.3
19.7%
52.7%
35.9%
26.6%
2012
97.8
17.5%
57.8%
40.9%
30.9%
2013
110.4
12.8%
61.8%
45.0%
34.6%
2014
120.8
9.4%
64.4%
48.1%
37.5%
2015
128.8
6.7%
65.9%
50.1%
39.6%
2016
133.9
3.9%
66.5%
51.1%
40.7%
Note: CAGR (2010-2016)=11.5%; internet users who watch TV shows onlinevia any device at least once per monthSource: eMarketer, March 2012; confirmed and republished, Aug 2012137385 www.eMarketer.com
137385
While the mobile video viewer population is smaller than the number of digital video viewers overall, its growth rate is substantially higher.
■ The 73.3 million mobile video viewers forecast for 2013 will be nearly 30% of all mobile phone users.
■ The same 73.3 million will represent 41% of all digital video viewers.
■ The number of mobile video viewers in 2013 will be nearly 20% higher than in 2012.
■ As might be expected, almost all mobile video viewers use smartphones—nearly 97% of the total in 2013.
millions, % of population and % of mobile phone usersUS Mobile Video Viewers, 2010-2016
2010
29.0
12.5%
9.4%2011
45.2
19.0%
14.4%
2012
61.2
25.2%
19.3%
2013
73.3
29.6%
22.9%
2014
88.0
34.9%
27.3%
2015
100.2
39.1%
30.8%
2016
110.1
42.4%
33.5%
Mobile video viewers% of mobile phone users
% of population
Note: mobile phone users of any age who watch video content on mobilephones through a mobile browser, subscriptions, downloads or applicationsat least once per monthSource: eMarketer, April 2012; confirmed and republished, Aug 2012138214 www.eMarketer.com
138214
Audience Age Data
At 18.9%, the largest share of the 178.7 million digital video viewers in 2013 will be ages 25 to 34. This age group was also the largest segment in the three years prior to 2013, and eMarketer projects it to remain the same in the three years following.
However, while some might get the impression that the digital video audience tilts extremely young, about 50% of viewers in each year of eMarketer’s forecast period will be between ages 25 and 54.
% of totalUS Digital Video Viewer Share, by Age, 2010-2016
2010 2011 2012 2013 2014 2015 2016
0-11 7.2% 7.5% 8.0% 8.4% 8.8% 9.2% 9.3%
12-17 12.7% 12.5% 12.3% 12.1% 11.9% 11.7% 11.6%
18-24 15.9% 15.7% 15.3% 14.8% 14.3% 13.9% 13.5%
25-34 19.9% 19.5% 19.2% 18.9% 18.6% 18.4% 18.5%
35-44 16.8% 16.7% 16.4% 16.3% 16.2% 16.1% 16.0%
45-54 16.1% 15.7% 15.5% 15.2% 14.9% 14.8% 14.8%
55-64 8.0% 8.7% 9.2% 9.6% 10.1% 10.2% 10.3%
65+ 3.2% 3.7% 4.1% 4.6% 5.1% 5.6% 6.0%
Note: internet users who watch video content online via any device at leastonce per month; numbers may not add up to 100% due to roundingSource: eMarketer, March 2012; confirmed and republished, Aug 2012137382 www.eMarketer.com
137382
In fact, the largest growth among video viewers in 2013—with double-digit increases—will be among the youngest and oldest viewers.
The Digital Video Audience

Video Advertising Benchmarks: Key Data, Trends and Metrics Copyright ©2012 eMarketer, Inc. All rights reserved. 14
% changeUS Digital Video Viewer Growth, by Age, 2010-2016
2010 2011 2012 2013 2014 2015 2016
0-11 12.9% 13.3% 14.3% 11.0% 9.9% 8.4% 3.9%
12-17 20.9% 6.5% 5.6% 4.3% 3.2% 2.2% 1.7%
18-24 7.4% 6.9% 4.4% 1.9% 1.5% 1.5% 0.0%
25-34 9.4% 6.6% 5.2% 4.0% 3.0% 3.4% 3.3%
35-44 7.5% 7.8% 4.9% 5.4% 4.1% 3.6% 2.5%
45-54 8.3% 5.5% 6.0% 3.0% 3.3% 3.6% 2.8%
55-64 19.4% 17.9% 13.0% 10.3% 10.5% 4.7% 4.5%
65+ 23.7% 23.4% 19.0% 18.8% 17.1% 14.6% 10.0%
Total 11.3% 8.6% 7.1% 5.6% 5.0% 4.2% 3.0%Note: internet users who watch video content online via any device at leastonce per monthSource: eMarketer, March 2012; confirmed and republished, Aug 2012137379 www.eMarketer.com
137379
Marketers would do well to realize that by sheer numbers, the online video audience does not skew particularly young. In fact, according to ongoing research from Nielsen, exactly 50% of internet video viewers in Q1 2012 were between the ages of 35 and 65, with an additional 10% over 65.
That demographic breakdown is useful when deciding which products to advertise with video online and what kind of creative might work best for online video advertising.
However, the mobile video audience does range younger, with 53% between 18 and 34, and an additional 12% ages 12 to 17.
% of totalUS Video Audience Composition, by Age, Q1 2012
12-17 18-24 25-34 35-49 50-65
On traditional TV 5% 7% 12% 21% 25%
On the internet 6% 9% 17% 27% 23%
On mobile phones
2-11
10%
7%
- 12% 23% 30% 24% 10%
65+
19%
10%
2%
Note: based on total users for each medium; numbers may not add up to100% due to rounding; *ages 13+Source: Nielsen, "State of the Media: The Cross-Platform Report Q1 2012,"Sep 11, 2012145608 www.eMarketer.com
145608
Therefore, marketers would also do well not to conflate the online and mobile portions of their digital video campaigns, since the audiences often differ.
Audience Time Data
Even though online video viewers may not be as young as common wisdom would tell you, younger viewers do spend more time with video. Ongoing research from Nielsen found that in Q1 2012, the average internet viewer spent 5 hours and 24 minutes per month watching videos on the internet.
However, only the 18-to-24 and 25-to-34 age groups watched substantially more online video than average, at 9:38 and 7:09 per month, respectively.
Mobile viewers skewed even younger, with only the 13-to-17 and 18-to-24 age groups watching more video than the 5 hours and 1 minute per month average.
hrs:mins
Monthly Time Spent Using Select TV/Video Media orthe Internet Among US Consumers, by Age, Q1 2012
2-11
12-17
18-24
25-34
35-49
50-64
65+
Total
-
7:47***
7:35
4:53
4:41
4:27
3:28
5:01Note: based on total users for each medium; *only homes with DVRs; **all TV homes; ***ages 13+Source: Nielsen, "State of the Media: The Cross-Platform Report Q1 2012,"Sep 11, 2012145598 www.eMarketer.com
Traditional TV
Using the internet on a computer
Watching timeshifted TV*
Watching timeshifted TV**
Watching video on internet
Mobile subscriberswatching video on a mobile phone
110:23
101:06
117:44
136:28
159:03
195:08
220:22
155:46
5:21
10:21
31:31
37:07
36:08
34:41
25:08
30:05
17:53
15:32
18:27
30:46
31:19
32:16
25:59
26:24
8:57
7:14
7:44
15:18
15:58
14:48
8:42
12:09
2:07
3:30
9:38
7:09
5:49
4:39
2:41
5:24
145598
It’s essential to note, though, that overall in Q1 2012, US consumers spent about 15 times as many hours per month watching traditional TV than watching video on the internet and mobile combined. In another study, in January 2012 from Horowitz Associates, the audience spent nearly 24 times as many hours watching broadcast and cable TV than they did watching video on a computer or handheld device.
Nevertheless, the year-over-year growth rate for internet video viewing jumped by 18.68%, while traditional TV viewing time dropped by 1.9% in the Nielsen study. While that doesn’t mean digital video time will outpace TV time anytime soon, it does point to a narrowing time gap between the channels.
hrs:mins and % change
Monthly Time US Consumers Used Select Media, Q1 2011, Q4 2011 & Q1 2012
On traditional TV
Using the internet ona computer
Watching timeshifted TV*
Watching timeshifted TV**
Watching video on internet
Mobile subscriberswatching video on amobile phone***
Q12011
158:47
25:33
26:14
10:46
4:33
4:50
Q42011
153:19
28:55
26:10
11:44
5:15
4:54
Q12012
155:46
30:05
26:24
12:09
5:24
5:01
% changevs. priorquarter
1.60%
4.03%
0.89%
3.55%
2.86%
2.38%
% changevs. sameperiod ofprior year
-1.90%
17.74%
0.64%
12.85%
18.68%
3.79%
Note: based on total users for each medium; ages 2+; *only homes withDVRs; **all TV homes; ***ages 13+Source: Nielsen, "State of the Media: The Cross-Platform Report Q1 2012,"Sep 11, 2012147126 www.eMarketer.com
147126
Further time-spent data for Q1 2012 from the Nielsen study found:
■ On average, males spent 5:58 watching video on the internet per month vs. females at 4:54.
The Digital Video Audience

Video Advertising Benchmarks: Key Data, Trends and Metrics Copyright ©2012 eMarketer, Inc. All rights reserved. 15
■ For any given age group, males watched more than females.
■ Mobile video was another story, with females watching 5:21 per month vs. 4:44 for males.
■ At 9:58 per month, Asians watched more online than blacks (7:05), Hispanics (6:22) or whites (4:47).
■ However, the four race/ethnicity groups all watched video for about the same amount of time on mobile phones, ranging from 4:51 per month for whites to 5:17 for Hispanics.
The reasons ad-supported online video echoes TV advertising can be seen in audience habits and what they’ll put up with over time. For online video in general, only 1.5% of the time was spent watching advertising in March 2012. But when the online video was long-form TV content, the audience spent 7.9% of their time watching ads.
% of total
Share of Time Spent Watching Online Video Contentvs. Ads by US Online Video Viewers, March 2012
Note: read chart as 98.5% of total time spent watching online video wasspent watching content and 1.5% watching adsSource: comScore Inc., "Surviving the Upfronts in a Cross-Media World: An Actionable Guide for Success," June 5, 2012141480 www.eMarketer.com
Online video Long-form video programming
Content98.5%
Ads1.5%
TV content92.1%
Ads7.9%
141480
Frequency is another way of looking at time and video. Using self-reported data only, AYTM Market Research found that 50.5% of US internet users said in October 2012 that they watched online videos a few times per week (23.3%) or more often (27.5%).
% of respondents
Frequency with Which US Internet Users WatchOnline Videos, Oct 2012
Every day27.5%
A few timesper week23.3%
Aboutonce
per week9.8%
A few timesper month9.5%
Rarely20.8%
Never9.3%
Note: n=400; numbers may not add up to 100% due to roundingSource: AYTM Market Research as cited in company blog, Oct 12, 2012146471 www.eMarketer.com
146471
Of course, many of these videos may not be generally useful for marketers, either because they’re too short or because of the nature or unknown qualities of their content.
Two others sources show different video usage patterns for mobile than the AYTM data focused on online in general.
■ In a March 2012 study from Google, 46% of smartphone owners said they watched videos either weekly or daily.
■ Among US tablet users, 28.4% of users in April 2012 viewed video at least once each week, according to comScore MobiLens.
■ Among smartphone users in the comScore study, only 9.6% reported a once-or-more-per-week frequency for video viewing.
Popular Viewing Destinations
Just as about 75% of net search ad spending flows to Google, approximately 75% of visitors to video destinations go to Google’s YouTube division. In contrast, according to September 2012 data from Experian Hitwise, other video websites had minuscule shares of visits.
Top 10 Video Multimedia Websites Among US InternetUsers, Ranked by Market Share of Visits, Sep 2012
1. YouTube76.8%
2. AOL Video3.4%
3. Bing Videos3.2%
4. Hulu1.8%
5. Yahoo! Screen1.5%
6. Yahoo! Video1.2%
7. Apple iPod and iTunes0.9%
8. Dailymotion0.8%
9. GodVine0.6%
10. Vimeo0.4%
Source: Experian Hitwise as cited by MarketingCharts, Oct 4, 2012146247 www.eMarketer.com
146247
YouTube’s dominance as a video destination is not just in number of viewers, but also in videos streamed and average time per viewer, as exemplified in this September 2012 data from comScore:
The Digital Video Audience

Video Advertising Benchmarks: Key Data, Trends and Metrics Copyright ©2012 eMarketer, Inc. All rights reserved. 16
Top 10 Online Video Properties Among US Internet Users, Ranked by Unique Viewers, Sep 2012
1. Google sites
2. Yahoo! sites
3. AOL
4. VEVO
5. Facebook
6. Grab Media, Inc.7. Viacom Digital
8. NDN
9. Microsoft sites10. Amazon sitesTotal
Uniqueviewers
(millions)
150.3
57.4
53.8
50.3
46.4
41.040.9
40.5
36.731.2
181.4
Videos*(millions)
13,123.2
498.5
741.3
569.8
233.2
267.1362.1
422.9
376.5106.8
39,355.9
Average timeper viewer(minutes)
419.1
49.1
39.4
38.7
13.6
44.244.1
75.1
42.012.8
1,399.0Note: home and work locations; content videos only; for long-form content(e.g., TV episodes with ads in the middle) each segment is counted as adistinct video stream; video views are inclusive of both user-initiated andauto-played videos that are viewed for longer than 3 seconds; *a video isdefined as any streamed segment of audiovisual content (both progressivedownloads and live streams)Source: comScore Video Metrix as cited in press release, Oct 29, 2012147152 www.eMarketer.com
147152
However, YouTube’s preeminence does not extend to advertising, where further comScore data for the same period shows Hulu at 51.0 ads per viewer, vs. only 19.6 for YouTube. Those figures point to how the majority of video advertisers—mainly major brands—still prefer TV-originated content for their campaigns.
Top 10 Online Video Properties Among US InternetUsers, Ranked by Ads Viewed, Sep 2012
1. Google sites
2. BrightRoll*
3. Hulu
4. LIVERAIL.com*
5. Adap.tv**
6. Specific Media*
7. Tremor Video*8. Auditude*
9. TubeMogul Video Ad Platform*10. SpotXchange VideoAd Marketplace**
Total
Video ads(millions)
1,760.6
1,354.4
1,170.0
1,153.9
1,036.9
787.0
758.6744.1
539.3
528.3
9,436.2
Total adminutes(millions)
142
681
456
552
530
326
360190
244
287
3,377
Ads perviewer
19.6
10.2
51.0
12.3
10.8
6.8
11.813.1
7.4
9.5
60.2
%reach
29.2%
43.2%
7.5%
30.6%
31.3%
37.7%
20.9%18.5%
23.8%
18.0%
51.0%Note: home and work locations; includes streaming video advertising only;excludes other types of monetization such as overlays, branded players,matching banner ads, etc.; *video ad network; **video ad exchangeSource: comScore Video Metrix as cited in press release, Oct 29, 2012147153 www.eMarketer.com
147153
Netflix is another key video destination. However, the video audience’s increased viewing of TV content on Netflix challenges digital ad-supported video. A Nielsen study reported that TV’s share of Netflix streaming rose from 11% to 19% between 2011 and 2012.
% of respondents
Type of Online Video US Netflix Users Stream MostOften on Netflix, 2011 & 2012
201153% 11% 36%
201247% 19% 35%
Movies TV Movies and TV equally
Note: read as saying 19% of Netflix users said they view TV shows moreoften while streaming content via Netflix; numbers may not add up to100% due to roundingSource: Nielsen as cited in company blog, July 12, 2012142880 www.eMarketer.com
142880
For more about over-the-top video and other elements of connected TV, stay tuned for an upcoming eMarketer report.
Devices Used To Watch Video
Depending on how viewing is defined, today’s video audience watches content on anywhere from three to six screens. From the three-screen perspective, that’s simply TV, computer and mobile.
However, it’s more accurate for marketers to work with clearer distinctions among six screens, since each device affects who the audience is, how they react and, therefore, which advertising might be most effective. The screens are:
■ Traditional TV, including broadcast and cable
■ Connected TV, on a big screen but internet-sourced
■ Desktop computer
■ Laptop computer
■ Smartphone
■ Tablet
Research from the Consumer Electronics Association, which combines traditional and connected TV (even though the sources for content differ), found that while the largest share of internet users (66%) in March 2012 watched video on HDTVs, nearly as many watched on laptops. As might be expected because of their small screens (smartphones) and relatively low adoption rate (tablets), mobile devices were the least used.
The Digital Video Audience

Video Advertising Benchmarks: Key Data, Trends and Metrics Copyright ©2012 eMarketer, Inc. All rights reserved. 17
% of respondents
Devices US Internet Users Use to Watch Video, March 2012
HDTV 66%
Laptop 62%
Desktop 55%
Smartphone 33%
Tablet 17%
Source: Consumer Electronics Association (CEA), "The Evolving VideoLandscape" as cited in press release, May 14, 2012140405 www.eMarketer.com
140405
Smartphones also lend themselves to shorter online video content than, say, desktop computers or connected TV. Note the following details in a Q1 2012 report from Ooyala, a cross-channel video analytics and publishing company:
■ The largest shares of short videos, 1 to 3 minutes long, were viewed on smartphones (28.6%) and tablets (24.4%).
■ Long videos, 10 or more minutes in length, were mainly viewed on connected TVs (88.5%) and, to a lesser extent, desktop computers (53.9%).
■ Each of the four screens had much lower shares for extremely short videos less than 1 minute long and mid-length videos 6 to 10 minutes long. In both cases, that’s likely because videos of that length are far less common than short (1 to 3 minutes) or long videos.
% of total
Share of Time Spent Watching Online VideosWorldwide, by Video Length and Device, Q1 2012
<1 minute1-3 minutes
3-6 minutes6-10 minutes
10+ minutes
Note: numbers may not add up to 100% due to roundingSource: Ooyala, "Global Video Index Report Q1 2012," May 30, 2012141138 www.eMarketer.com
Desktop4.4% 19.4% 53.9%15.2% 7.1%
Mobile28.6% 17.7%4.1% 8.4% 41.1%
Tablet46.0%4.1% 24.4% 16.9% 8.5%
Connected-TV devices and game consoles
0.3%
5.1% 88.5%
2.6% 3.4%
141138
Much digital video, most especially ad-supported content, still comes from the television industry. A June 2012 survey from Interpret, commissioned by Discovery Communications, found that:
■ Content coming through a cable or satellite box viewed on a television was still how 79% of internet users watched TV.
■ Slightly more internet users streamed TV content to their TVs through some kind of internet-connected device (48%) than through a network website on their computer (42%).
■ Only 29% of respondents streamed TV content through a mobile device, with 16% doing so on a tablet and 14% on a smartphone.
% of respondents
Methods Used by US Internet Users to Watch TV Content, June 2012
Through a cable/satellite box 79%
Through your cable box 72%
Through your cable provider's video on demand service 43%Streaming through a computer 56%
Through a network's website on your laptop or desktop computer 42%Through an aggregate streaming website on your laptop ordesktop computer
36%
Streaming through an internet-connected device 48%Through a streaming service app on your gaming consoleconnected to your TV
30%
Through a streaming service app on your internet-enabledset-top box or Blu-ray disc player connected to your TV
19%
Through a streaming service app on your internet-enabled TV 12%
Streaming through mobile device 29%Through a streaming service app on your tablet computer 16%
Through a streaming service app on your smartphone 14%
Note: n=1,170 TV owners ages 18-49 who own at least one other devicecapable of streaming TV content; in the past monthSource: Interpret, "The Evolution of TV Everywhere" commissioned byDiscovery Communications, Oct 3, 2012146239 www.eMarketer.com
146239
While there is still a tendency to lump together smartphones and tablets as mobile devices, people use them very differently for video consumption. In a study from the IAB released in July 2012, only 8% of mobile users said they preferred smartphones for watching TV and video, vs. 68% who expressed the same preference with tablets.
But for marketers—especially brands looking to reach large audiences with video advertising—further perspective is needed. Research from MAGNAGLOBAL found that in 2012, US consumers own 337.1 million mobile phones, while only 37.2 million own tablets. And while some of these millions of mobile phones might be basic devices, likely the vast majority when used for video consumption are smartphones.
The Digital Video Audience

Video Advertising Benchmarks: Key Data, Trends and Metrics Copyright ©2012 eMarketer, Inc. All rights reserved. 18
Conclusions
When creating digital campaigns, marketers do better when they start with a comprehensive overview of the four basic benchmarks of video advertising: ad metrics, types of ads, spending trends and audience size.
To analyze the value of the various video ad metrics, remember this: The results aggregated from a range of other campaigns are imperfect yardsticks, guidelines but not absolute rules. Too many variables influence metrics to make others’ results a clean takeaway. Take clickthrough rates, for example, where several other factors, such as the advertising creative, will also influence whether or not the audience clicks.
Of the three main types of video advertising, advertisers will use in-stream video ads the most. Brand marketers, in particular, prefer in-stream ads—pre-roll, mid-roll and post-roll—since they are analogous to TV commercials. Furthermore, most of the ad inventory available within online TV shows is in-stream. However, in-banner ads, which do not require video content to run, can be a useful supplement for a brand’s larger efforts.
Even though video ad spending growth is higher than for any other digital format, it still represents a relatively small portion of overall interactive spending. Note, though, that even as mobile video advertising becomes more important, spending on computer-based video advertising will still dominate for years to come.
The audience for video content is increasing steadily—both in number of viewers and in the amount of time they spend watching digital video. Two seemingly opposite trends to note: The age of the video audience does not skew to the young only, as first impressions might have you believe. So video advertising should also address the audience ages 35 to 65. However, when the audience is measured by time spent watching video, the younger demographic watches considerably more video than average.
Related Links
Adap.TV AdoTube Association of National Advertisers AYTM Market Research BrightRoll comScore Consumer Electronics Association Digiday Discovery Communications Experian Hitwise FreeWheel InsightExpress Interpret MAGNAGLOBAL MediaBrix Nielsen Ooyala Prosper Mobile Insights STRATA VideoHub Videology Vindico YuMe
Editorial and Production Contributors
Nicole Perrin Associate Editorial DirectorCliff Annicelli Senior Copy EditorEmily Adler Copy EditorDana Hill Director of ProductionJoanne DiCamillo Senior Production ArtistStephanie Gehrsitz Production ArtistAllie Smith Director of Charts

The world’s go-to source for information on digital marketing, media and commerce.
In the fast-paced digital world, it is neither prudent nor professional to make business decisions based solely on a single source. eMarketer helps companies minimize risk and maximize opportunity by providing…
COLLECTIVE WISDOM
COVERAGE See all aspects of what is happening today in digital marketing, media and commerce.
COLLECTION Information is gathered from thousands of research sources around the globeand hundreds of interviews with industry professionals a month.
CURATION eMarketer sifts through the clutter, vets data for accuracy and distills information to its essential intelligence – to save you time.
COMPARISON Side-by-side source comparison charts display all relevant information on a topic in one place.
CONTEXT Focused, clear and concise, eMarketer reports provide a quick, complete picture of fast-changing digital trends to make sense of complex issues.
CONVENIENCE The information you need is accessible 24/7 from your PC, laptop, tablet or smartphone—and downloadable in PDF, Excel, JPEG or PowerPoint formats.
CONFIDENCE For 15 years, eMarketer has been recognized as the standard for media coverage of the digital world—cited more than 4,000 times in the New York Times and Wall Street Journal alone—and relied on by major brands and advertising agencies around the globe.
COMPETITIVENESS No one in business wants to be surprised, so see the trends coming and make certain your organization always has the latest, most accurate and comprehensive digital information available—with an eMarketer Corporate Subscription.
To schedule a conversation or customized demonstration, go to eMarketer.com or call 212-763-6010


