
This article was downloaded by: [Ecole des Mines D'Albi]On: 20 January 2015, At: 01:25Publisher: Taylor & FrancisInforma Ltd Registered in England and Wales Registered Number: 1072954 Registered office: Mortimer House,37-41 Mortimer Street, London W1T 3JH, UK
Click for updates
Drying Technology: An International JournalPublication details, including instructions for authors and subscription information:http://www.tandfonline.com/loi/ldrt20
Modeling of Sewage Sludge Flow in a Continuous PaddleDryerM. Milhéa, C. Charloua, M. Sauceaua & P. Arlabossea
a Université de Toulouse; Mines Albi; CNRS; Centre RAPSODEE, Albi, FranceAccepted author version posted online: 01 Dec 2014.
To cite this article: M. Milhé, C. Charlou, M. Sauceau & P. Arlabosse (2014): Modeling of Sewage Sludge Flow in a ContinuousPaddle Dryer, Drying Technology: An International Journal, DOI: 10.1080/07373937.2014.982252
To link to this article: http://dx.doi.org/10.1080/07373937.2014.982252
Disclaimer: This is a version of an unedited manuscript that has been accepted for publication. As a serviceto authors and researchers we are providing this version of the accepted manuscript (AM). Copyediting,typesetting, and review of the resulting proof will be undertaken on this manuscript before final publication ofthe Version of Record (VoR). During production and pre-press, errors may be discovered which could affect thecontent, and all legal disclaimers that apply to the journal relate to this version also.
PLEASE SCROLL DOWN FOR ARTICLE
Taylor & Francis makes every effort to ensure the accuracy of all the information (the “Content”) containedin the publications on our platform. However, Taylor & Francis, our agents, and our licensors make norepresentations or warranties whatsoever as to the accuracy, completeness, or suitability for any purpose of theContent. Any opinions and views expressed in this publication are the opinions and views of the authors, andare not the views of or endorsed by Taylor & Francis. The accuracy of the Content should not be relied upon andshould be independently verified with primary sources of information. Taylor and Francis shall not be liable forany losses, actions, claims, proceedings, demands, costs, expenses, damages, and other liabilities whatsoeveror howsoever caused arising directly or indirectly in connection with, in relation to or arising out of the use ofthe Content.
This article may be used for research, teaching, and private study purposes. Any substantial or systematicreproduction, redistribution, reselling, loan, sub-licensing, systematic supply, or distribution in anyform to anyone is expressly forbidden. Terms & Conditions of access and use can be found at http://www.tandfonline.com/page/terms-and-conditions

1
MODELING OF SEWAGE SLUDGE FLOW IN A CONTINUOUS PADDLE
DRYER
M. Milhé1, C. Charlou
1, M. Sauceau
1, P. Arlabosse
1
1Université de Toulouse; Mines Albi; CNRS; Centre RAPSODEE, Albi, France
Corresponding Author to P. Arlabosse: E-mail: [email protected]
Abstract
A model based on the theory of Markov chains has been developed to represent the
residence time distribution (RTD) of municipal sewage sludge in a continuous paddle
dryer. The flow of dry solids is described by a chain of n perfectly mixed cells, n
corresponding to the number of paddles attached to the shaft. The transition probabilities
between the cells are governed by two parameters: the parameter of internal recirculation,
R, and the solids hold-up, Hu. In the absence of available correlation, both parameters are
identified by fitting the model to experimental RTD data. The model demonstrates its
ability to describe the sludge flow in a continuous lab-scale paddle dryer. A sensitivity
analysis highlights that R is critical for the treatment uniformity while Hu controls the
mean residence time and thus the final moisture content.
KEYWORDS: Stochastic approach, Markov Chains, Cells model, Residence time
distribution, Experiment
INTRODUCTION
Sewage sludge management is an important issue for large urban areas. Considering their
high organic content, municipal sewage sludge is a promising feedstock for Waste-to-
Dow
nloa
ded
by [
Eco
le d
es M
ines
D'A
lbi]
at 0
1:25
20
Janu
ary
2015

2
Energy (WtE) processes. Incineration is by far the most common process but pyrolysis
and gasification emerge [1–3]
. Unfortunately, organic sludge has a high water content [4]
: it
is usual to meet sludge with only 18 to 25% of solids after mechanical dewatering by
centrifugation or belt filters. Higher solids contents (around 30 to 35%) can be achieved
with filter presses but their discontinuous operation makes them unsuited for large
wastewater treatment plants (WWTP). These solids concentrations are too weak for an
efficient WtE conversion [4]
. Indeed, dry solids contents from 60% to 90% are expected
for co-incineration with municipal solid wastes while more than 85% are needed for
pyrolysis and gasification. As a consequence, drying is essential to increase the dry solids
content prior to thermal valorization. Even if many technologies are available [4–7]
, this
operation remains an economical bottleneck. Paddle dryers offer several advantages such
as high heat fluxes, low specific energy consumption and low exhaust volumes.
Moreover, the design of the shafts is well adapted to overcome the sticky state and
process the sludge up to complete drying without recycling dry matter upstream.
However, in two thirds of the drying plants the dry solid content often exceeds 90 % [8]
.
In addition to the lost energy, this excessive drying causes troubles for handling and
storage of the dried sludge, as well as safety problems [9]
. Adjusting the solid content of
the dried sludge to the valorization routes is essential to improve the sustainability of
WtE conversion processes.
Until now, few efforts have been dedicated to experimental and numerical investigations
on continuous paddle dryers for sludge treatment. Whereas tools to describe, and even
predict, heat and mass transfers have been available for a few years [10–12]
, sludge flow
Dow
nloa
ded
by [
Eco
le d
es M
ines
D'A
lbi]
at 0
1:25
20
Janu
ary
2015
3
has been partly characterized very recently. According to Tazaki et al.[13]
and Charlou et
al. [14]
, the flow pattern is not a simple plug flow. Back mixing of the sludge occurs [13]
,
especially near the middle of the dryer where the sludge consistency is sticky. To our
knowledge, the modeling of sludge flow has not been addressed in the literature yet.
Sludge rheological behavior is complex [15–17]
and poorly documented for high dry solids
contents [15]
. As a result, mechanistic approaches and computational fluid dynamics
(CFD) modeling are out of reach for the time being. Chemical engineers use the concept
of residence time distribution (RTD) to characterize flow patterns in a reactor [18, 19]
. The
principle of RTD measurements is to inject an inert tracer into the reactor at some time
t=0 and to measure the tracer concentration in the outlet stream as a function of time. The
residence time distribution function, which describes in a quantitative manner how much
time different fluid elements have spent in the reactor, is computed from the
concentration-time curve. Based on these experimental data, a flow model can be
proposed to predict the RTD in the reactor or the apparatus. Coupled with kinetic data,
the average outlet concentration in a real reactor or apparatus can then be predicted.
Many models are available to describe deviations from the ideal continuous stirred tank
reactor (CSTR) or plug flow reactor (PFR) [20]
. Cell models, mostly based on the theory
of Markov chains [21]
, present the advantage of describing the design of the apparatus,
since the cell size can be conditioned by sections covering the paddles for instance.
Markov chains proved to be efficient to model bulk particulate flow in a great variety of
processes [22–25]
. This approach has been widened to describe heat and mass transfers
between stochastically moving particulate and gas flows [26, 27]
. In this paper, we assume
that the agitated contact drying process is a Markov process and we propose a cell model,
Dow
nloa
ded
by [
Eco
le d
es M
ines
D'A
lbi]
at 0
1:25
20
Janu
ary
2015

4
based on a 1D homogeneous Markov chain, to describe the flow of the anhydrous solids
in a paddle dryer. Experimental RTD data are used to identify the two models parameters.
A sensibility study of the model responses – the mean residence time and the variance of
the RTD - to the variations of the model parameters is also undertaken to identify the
most influential model parameters.
MODEL DESCRIPTION
Physical Model And Modelling Assumptions
In this study, a lab-scale continuous agitated contact dryer, designed and built in our
institute (see Figure 1), is used as an example to build the physical model. A full
description of the experimental set-up is available in Charlou et al. [14]
. The main
characteristics are summarized hereafter. The dryer consists of a U-shaped heated trough
with one rotating shaft inside. Nineteen full wedge-shaped paddles are screwed onto the
rotor and heated by conduction. In the current configuration, the paddles are regularly
distributed along the shaft. Scrapers, formed to interact with the paddles and generate
intense shearing, are positioned on the trough. The sludge is fed into one end of the
trough and flows due to gravity, dryer slope and mechanical agitation to the opposite end,
where the dry material is discharged. The sludge structure evolves from a fluid to a pasty
and, then, to a particulate matter.
The principle of the Markov model is to represent the solids circulating in the dryer by a
chain containing a finite number of cells. Let us divide the total length of the process into
n perfectly mixed cells of equal length and mass of dry matter. As we want to preserve a
Dow
nloa
ded
by [
Eco
le d
es M
ines
D'A
lbi]
at 0
1:25
20
Janu
ary
2015

5
physical description of the process, n is not an adjustable parameter of the model. In the
following, we will assume that the number of active cells, n, is equal to the number of
paddles. When a granular flow exists, we can assume that, in the vicinity of the paddle,
part of granules will flow forward whereas the other part will stay in the vicinity of the
paddle or will move backward. Thus, in the presence of recirculation phenomena, the
cells must be connected by internal flows, which represent the circulation of the matter
forward (from the current cell to the following one) and the recirculation in the opposite
direction (from the current cell to the previous one). We will consider that only
transitions between neighboring cells are possible between two successive observations
of the system. At the end of the chain, a last cell (n+1) must represent the collector of
dried sludge particles located at the dryer outlet. This cell is called the absorbing cell. Of
course, backward transition from the absorbing state is forbidden. The structure of the 1D
chain is presented in Figure 2. We will investigate exclusively the steady state operation
of the dryer.
Mathematical Model
Let us observe the state of the process at discrete moments of time tm=m*∆t, where ∆t is
the transition duration between two successive observations, and m is the number of
transitions. If we examine the evolution of any additive property S (mass, for instance) of
a flow, its distribution over the process length can be presented as a state vector
1 2 3
t
nS S S SS . During ∆t, the state Si in the i-th cell can change due to the
amount of S that comes from the other cells or that leaves the cell. Thus, the evolution of
S is controlled by a matrix of transition probabilities P. ∆t has to be small enough so that
Dow
nloa
ded
by [
Eco
le d
es M
ines
D'A
lbi]
at 0
1:25
20
Janu
ary
2015

6
only transitions between neighboring cells are possible. As a result, three probabilities
can be considered: a probability of staying in the cell, Pi,i, a probability to move forward,
Pi+1,i, and a probability to move backward, Pi-1,i. The matrix P(n+1*n+1), that contains
all the possible transition probabilities corresponding to a transition time Δt, takes the
form described by Eq.(1).
1,1 1,2
2,1 2,2
3,2 i 1,i
i,i
i 1,i n 1,n
n,n
n 1,n n 1,n 1
P P 0 0 0 0
P P 0 0 0 0
0 P P 0 0 0
PP
0 0 0 P P 0
0 0 0 0 P 0
0 0 0 0 0 P P
(1)
In steady state operation, the condition of mass conservation involves that the sum of all
the elements in each column is equal to one. As the backward transition from the
absorbing state is forbidden, Pn+1,n+1=1.
According to the stochastic motion of the particles, the throughput in a cell is not equal to
the throughput in the dryer. The difference is taken into account by the recirculation
coefficient R which is defined as the ratio between the recirculated flow in each cell and
the inflow rate (see Figure 2).
The geometrical residence time, cell, and the probabilities Pi,i , Pi+1,i , Pi-1,i are defined in
Table 1. Hu is the dry solids hold-up in each cell and dsQ is the dry solids throughput in
the Markov chain. During the transition time Δt, the probability of staying in a cell is an
Dow
nloa
ded
by [
Eco
le d
es M
ines
D'A
lbi]
at 0
1:25
20
Janu
ary
2015

7
exponential function of this time [24]
. The matrix of transition probabilities P is constant
since the model describes a steady-state operation. In Markovian language, the process is
said linear and the Markov chain homogeneous. Moreover, we assume that R and Hu do
not vary along the cells in a first approach, since we cannot estimate experimentally the
variation of these parameters. The evolution of the state vector for a transition Δt is then
described by the following formulas:
t t * tS P S (2)
or
t t * t 0mS P S (3)
Numerical Model
Using the RTD concept, the experimenter gets the concentration-time curve by injecting
a tracer in a known concentration (or quantity) at the reactor inlet and analyzing this
tracer concentration (or quantity) in the product at the outlet. Then he computes the RTD
function, E(t), which describes in a quantitative manner how much time different fluid
elements have spent in the reactor. For a Dirac injection, i.e. instantaneous and not
perturbing the flow, E(t), also called the exit age distribution function, is given by Eq. (4),
while its cumulative form F(t) is given by Eq. (5):
0
C
C
tE t
t dt (4)
0
F t E t dt (5)
Dow
nloa
ded
by [
Eco
le d
es M
ines
D'A
lbi]
at 0
1:25
20
Janu
ary
2015
8
Numerically, we can simulate the Dirac injection of a tracer in the system by using the
following initial state vector, which means that at t=0, a tracer of quantity 1 is injected in
the first cell of the system:
t 0 1 0 0 0t
S (6)
E(t) is calculated as the difference, between two successive transitions, of the tracer
quantity reaching the absorbing cell as in Eq. (7), which corresponds to a discretized
version of Eq. (4). F(t) is given by the amount of tracer cumulated in the absorbing state
(Eq. (8)):
1 1n n
E t S t S t t (7)
1n
F t S t (8)
Knowing E(t), it is easy then to compute the mean residence time, ts, the variance, σ2, and
the dimensionless variance, 2
D :
0
.st t E t dt (9)
22
0
st t E t dt (10)
2
2
D
st (11)
Dow
nloa
ded
by [
Eco
le d
es M
ines
D'A
lbi]
at 0
1:25
20
Janu
ary
2015

9
The model only depends on two parameters: the recirculation coefficient, R, and the ratio
ds
HuQ
between the dry solids hold-up and the dry solids throughput. Both
parameters are a priori unknown. But, if we consider that usually the dry solids
throughput Qds is known, only the solids hold-up, Hu has to be identified. A third
parameter, the transition duration, ∆t, also appears in the mathematical model.
Previously, we assumed that the transition duration, ∆t, is small enough so that particles
in a cell could be able to transit only to the neighboring cells. But the choice of ∆t is not
straightforward. Moreover, only some scarce papers explain how the choice was made [22,
28]. Consequently, the influence of the transition duration on the mean residence time and
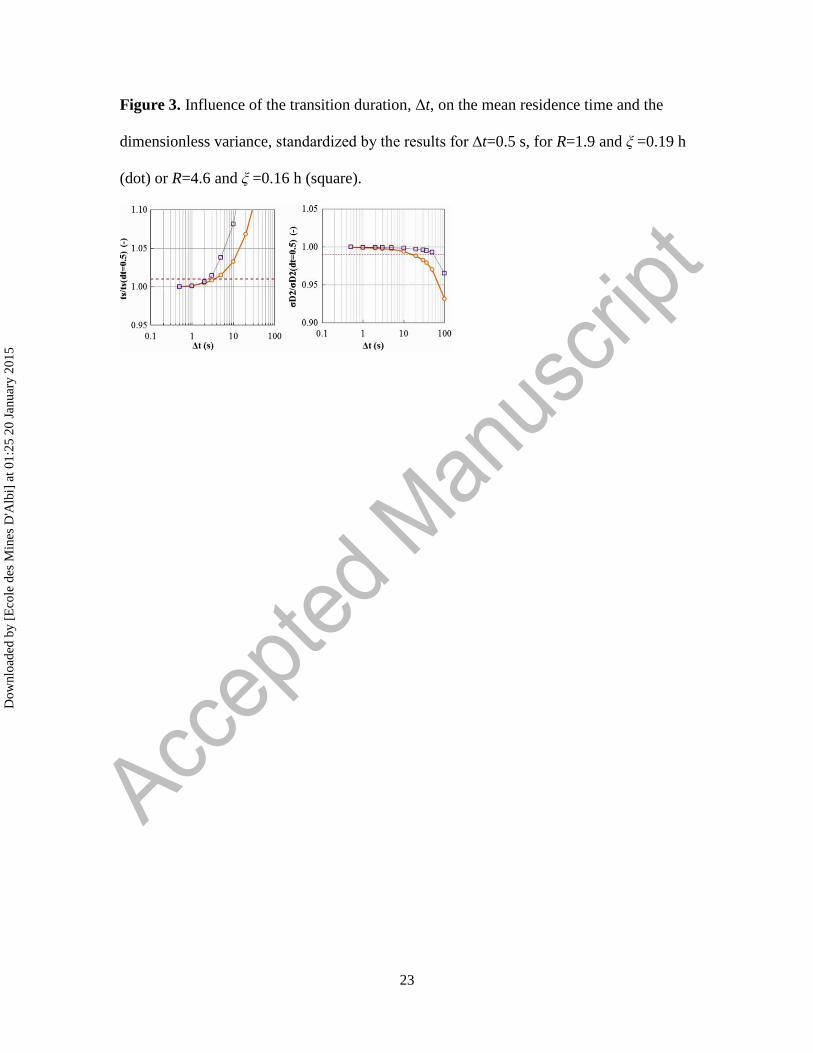
the dimensionless variance was investigated numerically. The selection of ∆t has to be
done by taking into account that the smaller ∆t the higher the model precision, but the
higher the calculation time. Figure 3 illustrates the evolution of the standardized mean
residence time and the standardized dimensionless variance according to the transition
time for R=1.9 and ξ=0.19 h or R=4.6 and ξ=0.16 h. The computed values were
standardized by the values for the lowest transition duration, i.e. ∆t=0.5 s. For ∆t>3.6s,
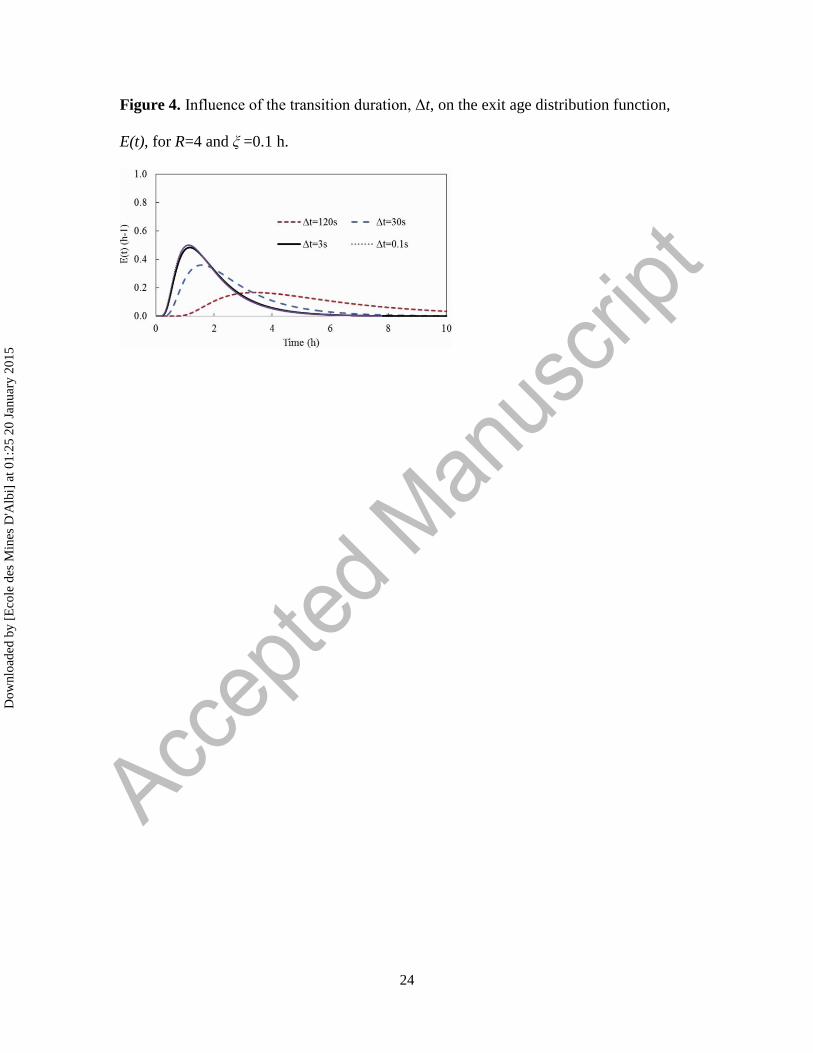
the mean residence time and the standardized dimensionless variance strongly depend on
the value of the transition duration. Below this threshold, they tend gradually towards a
constant value and the exit age distribution function, E(t), does not change anymore (see
Figure 4). For ∆t=2 s, both RTD characteristics are in the 99% confidence interval. To get
a compromise between model precision and calculation time, we selected Δt=2 s.
In the following, the recirculation coefficient R and the solids hold-up Hu are identified
by fitting the model to the experimental RTD data using MATLAB® software. The
Dow
nloa
ded
by [
Eco
le d
es M
ines
D'A
lbi]
at 0
1:25
20
Janu
ary
2015

10
fminsearch function (based on a Nelder-Mead algorithm) was used to minimize the least
sum of squares of the difference between experimental and simulated E(t). A threshold of
10-4
was set for the variation of the residue, ΔE, between two successive iterations. In Eq.
(9) the subscripts exp and cal stand for the experimental and corresponding calculated
discrete values of E(t) respectively.
2
exp calE E E (12)
RESULTS AND DISCUSSION
Ability Of The Cells Model To Describe Sludge Flow In A Lab-Scale Paddle Dryer
Experiments were performed on the lab scale paddle dryer using the sewage sludge from
the municipal WWTP of Albi (France) as feedstock. The WWTP implements a
conventional extended aeration process, a nitrification/denitrification process, a
biological phosphorus removal and a mesophilic anaerobic digestion. The sludge was
sampled after centrifugation and stored at 4 °C in tight containers during a minimum of
48 h before the experiments. Its dry basis initial moisture content was 3.7 kg/kg.
Drying experiments were performed at atmospheric pressure, with a dryer wall
temperature set at 160 °C and with 1.1 kg/h of superheated steam at 160 °C as sweeping
gas. The dryer was titled of 3° and the inlet mass flow rate was set at 2.5 kg/h on a wet
basis. When the steady state was reached, 3 successive pulse injections of tracers were
performed at 1 h interval each. Partially dried sludge was sampled at the outlet at a
frequency of 5 min, dried at 105 °C for 24 h and analyzed off-line using X-ray
Dow
nloa
ded
by [
Eco
le d
es M
ines
D'A
lbi]
at 0
1:25
20
Janu
ary
2015
11
fluorescence spectroscopy (PANanlytical, Almelo, Netherlands), which give access to
experimental E(t) curves [29]
.
As mentioned before, the dry solids throughput Qds is known indirectly, from the inlet
mass flow rate and moisture content. Thus, only the recirculation coefficient, R, and the
solids hold-up, Hu, have to be identified in our model. Figure 5 illustrates the ability of
the model to represent the experimental RTD function, E(t), and its cumulative form F(t)
after the optimization described previously, for one of the three injections realized. For
the experiments, the stirring speed was set to 28 rpm (see Figure 5 a) and 14 rpm (Figure
5b) respectively. For both experiments, the model describes experimental data with a
good accuracy.
The parameters from the experimental data and their mean values calculated after
optimization of the three modeled RTD curves are reported in Table 2 for both
experiments. Experimentally, the solids hold-up is obtained by weighing the total
remaining dry sludge in the dryer at the end of an experiment. The experimental and
optimized values of Hu are close in both cases, indicating that the optimization procedure
does not end in unrealistic values of this physical parameter. Finally, we observe a slight
difference between R values obtained for both experiments, but this difference is not
really significant with respect to the standard errors. Since both RTD curves have similar
shapes in spite of these slight parameters differences, the respective influences of R and
Hu on model results should be studied before concluding on the effect of stirring speed
on these parameters. For this reason, we proceeded to a sensitivity analysis of the model.
Dow
nloa
ded
by [
Eco
le d
es M
ines
D'A
lbi]
at 0
1:25
20
Janu
ary
2015
12
Sensitivity Analysis
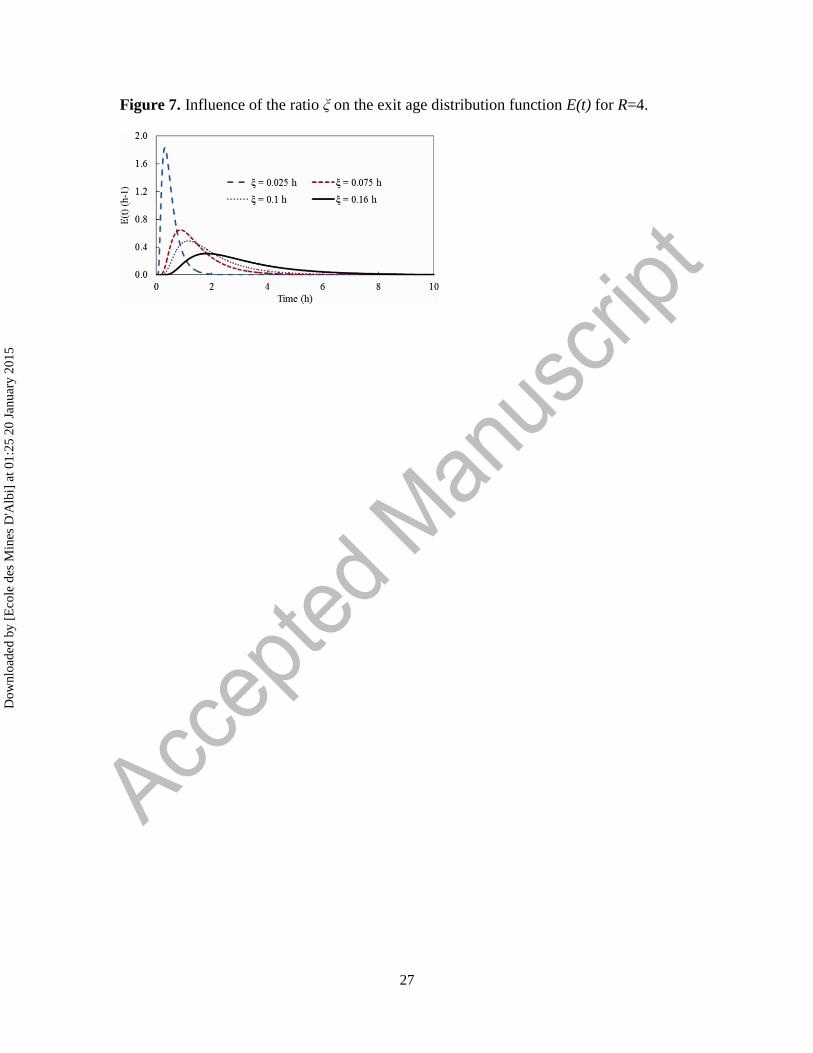
To clarify the influence of both parameters on the RTD, a numerical parametric study
was performed in the range 0 ≤ R ≤ 20 and 0.025 ≤ ξ ≤ 0.18 h. Figures 6 and 7
emphasize the influence of R and ξ on the RTD curves while Figure 8 highlights the
influence of both parameters on the mean residence time and the dimensionless variance.
R has little influence on the mean residence time. An increase of R results in a strong
enhancement of the dimensionless variance. As can be seen on Figure 6, the exit age
distribution function spreads out when R increases and the flow evolves from the ideal
plug-flow (R=0) to the one observed in an ideal continuous stirred tank reactor. From a
practical point of view, it is essential to reduce back-mixing phenomena in paddle dryers
(R→0) to achieve a uniform drying, through the shaft retrofit for instance. On the
contrary, ξ has a strong influence on the mean residence time. The evolution is almost
linear: the mean residence time increases by a factor 4.4 when ξ is multiplied by 4.5.
Thus, the solids hold-up is the most critical parameter to control the moisture content at
the dryer exit. For the time being, no correlation is available in the literature to predict the
solids hold-up from the operating conditions.
CONCLUSIONS
A cell model, based on the theory of Markov chain, has been developed to describe
sludge flow in a paddle dryer. To preserve a physical description of the process, the
number of cells corresponds to the number of paddles fixed on the dryer shaft. The model
is able to predict the residence time distribution, the mean residence time and the
variance. Only transitions between neighboring cells are allowed between two successive
Dow
nloa
ded
by [
Eco
le d
es M
ines
D'A
lbi]
at 0
1:25
20
Janu
ary
2015

13
observations of the system. The model only depends on two parameters: the recirculation
coefficient and the volume of the cells, i.e. the solids hold-up in the dryer. The
recirculation coefficient has an influence on the distribution width, and thus on the
uniformity of the drying treatment. The solids hold-up in the dryer is critical for the mean
residence time of solids in the dryer and the control of the outlet moisture content. We
demonstrate the ability of the model to describe experimental RTD curves achieved on a
lab-scale continuous paddle dryer. But, in the absence of correlation in the literature to
predict the solids hold-up in the dryer, both parameters have to be identified by adjusting
the model to the experimental data. The establishment of this correlation, for at least the
lab scale process, is in progress. The extension of this model to predict moisture profile
along the dryer, by coupling a heat and mass transfer model based on the penetration
theory, is also investigated.
ACKNOWLEDGMENT
The authors would like to acknowledge Bernard AUDUC for kind technical assistance in
the construction and development of the experimental set-up.
NOMENCLATURE
C Tracer concentration (kg.kg-1
)
E(t) Exit age distribution function (h-1
)
F(t) Cumulative function (-)
m Number of transition (-)
Qds Dry solids mass flow rate (kg.h-1
)
Dow
nloa
ded
by [
Eco
le d
es M
ines
D'A
lbi]
at 0
1:25
20
Janu
ary
2015

14
Hu Dry solids hold-up (kg)
n number of active cells (-)
P Matrix of transition probabilities (-)
Pj,i Probability to move from cell i to cell j (-)
R Recirculation coefficient (-)
S State vector (-)
t Time (h)
ts Mean residence time (h)
Greek letters
σ² Variance (-)
σ²D Dimensionless variance (-)
τcell Geometric residence time in a cell (h)
ξ Solids holdup to mass flow rate ratio (h)
ΔE Minimization function (-)
Δt Transition time (s)
Subscripts
cell Cell of the Markov chain
D Dimensionless
i Cell number
exp Experimental value
cal Calculated value
Dow
nloa
ded
by [
Eco
le d
es M
ines
D'A
lbi]
at 0
1:25
20
Janu
ary
2015

15
REFERENCES
1. Werther, J.; Ogada, T. Sewage sludge combustion. Progress in Energy 1999,
25(1), 55-116.
2. Manara, P.; Zabaniotou, A. Towards sewage sludge based biofuels via
thermochemical conversion - A review. Renewable and Sustainable Energy Reviews
2012, 16(5), 2566-2582.
3. Fonts, I.; Gea, G.; Azuara, M.; Ãbrego, J.; Arauzo, J. Sewage sludge pyrolysis for
liquid production: A review. Renewable and Sustainable Energy Reviews 2012, 16(5),
2781-2805.
4. Arlabosse, P.; Ferrasse, J.-H.; Lecomte, D.; Crine, M.; Dumont, Y.; Léonard, A.
Efficient Sludge Thermal Processing : From Drying to Thermal Valorization, Modern
Drying Technology. 2012, Wiley-VCH Verlag GmbH & Co. KGaA, 295-329.
5. Chen, G.H.; Yue, P.L.; Mujumdar, A.S. Sludge dewatering and drying. Drying
Technology 2002, 20(4-5), 883-916.
6. Tuncal, T.; Jangam, S.V.; Gunes, E. Abatement of Organic Pollutant
Concentrations in Residual Treatment Sludges: A Review of Selected Treatment
Technologies Including Drying. Drying Technology 2011, 29(14), 1601-1610.
7. Bennamoun, L.; Arlabosse, P.; Leonard, A. Review on fundamental aspect of
application of drying process to wastewater sludge. Renewable & Sustainable Energy
Reviews 2013, 28, 29-43.
8. Chabrier, J.-P. Le séchage thermique des boues : Le développement, ses
avantages et ses inconvénients. Journée technique du SIAAP (In French). 2007.
Dow
nloa
ded
by [
Eco
le d
es M
ines
D'A
lbi]
at 0
1:25
20
Janu
ary
2015

16
9. European committee for standardization. Characterization of sludges. Good
practice for sludges drying, PD CEN/TR 15473. 2007.
10. Arlabosse, P.; Chitu, T. Identification of the Limiting Mechanism in Contact
Drying of Agitated Sewage Sludge. Drying Technology 2007, 25(4), 557-567.
11. Yan, J.-H.; Deng, W.-Y.; Li, X.-D.; Wang, F.; Chi, Y.; Lu, S.-Y.; Cen, K.-F.
Experimental and theoretical study of agitated contact drying of sewage sludge under
partial vacuum conditions. Drying Technology 2009, 27(6), 787-796.
12. Deng, W.-Y.; Yan, J.-H.; Li, X.-D.; Wang, F.; Lu, S.-Y.; Chi, Y.; Cen, K.-F.
Measurement and simulation of the contact drying of sewage sludge in a Nara-type
paddle dryer. Chemical Engineering Science 2009, 64(24), 5117-5124.
13. Tazaki, M.; Tsuno, H.; Takaoka, M.; Shimizu, K. Modeling of sludge behavior in
a steam dryer. Drying Technology 2011, 29(14), 1748-1757.
14. Charlou, C.; Sauceau, M.; Arlabosse, P. Characterisation of Residence Time
Distribution in a Continuous Paddle Dryer. Journal of Residuals Science & Technology
2013, 10(3), 117-125.
15. Seyssiecq, I.; Ferrasse, J.-H.; Roche, N. State-of-the-art: rheological
characterisation of wastewater treatment sludge. Biochemical Engineering Journal 2003,
16(1), 41-56.
16. Ratkovich, N.; Horn, W.; Helmus, F.P.; Rosenberger, S.; Naessens, W.; Nopens,
I.; Bentzen, T.R. Activated sludge rheology : a critical review on data collection and
modelling. Water Research 2013, 47(2), 463-482.
Dow
nloa
ded
by [
Eco
le d
es M
ines
D'A
lbi]
at 0
1:25
20
Janu
ary
2015
17
17. Eshtiaghi, N.; Markis, F.; Yap, S.D.; Baudez, J.-C.; Slatter, P. Rheological
characterisation of municipal sludge : a review. Water Research 2013, 47(15), 5493-
5510.
18. Danckwerts, P.V. Continuous flow systems : distribution of residence times.
Chemical Engineering Science 1953, 2(1), 1-13.
19. Levenspiel, O. Chemical reaction engineering. 1999: Hardcover. 688.
20. Gao, Y.; Muzzio, F.J.; Lerapetritou, M.G. A review of the residence time
distribution (RTD) applications in solid unit operations. Powder Technology 2012,
228(0), 416-423.
21. Berthiaux, H.; Mizonov, V. Applications of Markov chains in particulate process
engineering: A review. Canadian Journal of Chemical Engineering 2004, 82(6), 1143-
1168.
22. Harris, A.T.; Thorpe, R.B.; Davidson, J.F. Stochastic modelling of the particle
residence time distribution in circulating fluidised bed risers. Chemical Engineering
Science 2002, 57(22-23), 4779-4796.
23. Berthiaux, H.; Mizonov, V.; Zhukov, V. Application of the theory of Markov
chains to model different processes in particle technology. Powder Technology 2005,
157(1-3), 128-137.
24. Marikh, K.; Berthiaux, H.; Mizonov, V.; Barantseva, E.; Ponomarev, D. Flow
analysis and markov chain modelling to quantify the agitation effect in a continuous
powder mixer. Chemical Engineering Research and Design 2006, 84(11), 1059-1074.
25. Ponomarev, D.; Rodier, E.; Sauceau, M.; Nikitine, C.m.; Mizonov, V.; Fages, J.
Modelling non-homogeneous flow and residence time distribution in a single-screw
Dow
nloa
ded
by [
Eco
le d
es M
ines
D'A
lbi]
at 0
1:25
20
Janu
ary
2015

18
extruder by means of Markov chains. Journal of Mathematical Chemistry 2012, 50(8),
2141-2154.
26. Mizonov, V.; Berthiaux, H.; Arlabosse, P.; Djerroud, D. Application of the theory
of Markov chains to model heat and mass transfer between stochastically moving
particulate and gas flows. Granular Matter 2008, 10(4), 335-340.
27. Mizonov, V.; Zaitsev, V.; Volynskii, V.; Leznov, V. Modeling the moisture
content distribution over a rotating porous cylinder using Markov chains. Chemical
Engineering & Technology 2008, 34(7), 1185-1190.
28. Tamir, A. Chapter 2 - Fundamentals of Markov chains, Applications of Markov
chains in chemical engineering. 1998, Elsevier Science B.V: Amsterdam, 11-185.
29. Charlou, C.; Milhe, M.; Sauceau, M., Arlabosse, P. A new methodology for
measurement of sludge residence time distribution in a paddle dryer using X-ray
fluorescence analysis. Water Reseach (under review).
Dow
nloa
ded
by [
Eco
le d
es M
ines
D'A
lbi]
at 0
1:25
20
Janu
ary
2015

19
Table 1. Geometric residence time and transition probabilities in each cell
Cell i=1 1<i<n i=n i=n+1
cellτ
1 ds
Hu
R Q
1 2 ds
Hu
R Q
1 ds
Hu
R Q
0
Pi,i 1
t
e i
t
e n
t
e 1
Pi-1,i 0 ,1
1 2i i
RP
R ,
11
1n nP
R
0
Pi+1,i 111 P ,
11
1 2i i
RP
R ,1
1n n
RP
R
0
Dow
nloa
ded
by [
Eco
le d
es M
ines
D'A
lbi]
at 0
1:25
20
Janu
ary
2015

20
Table 2. Experimental and calculated parameters from RTD curves in Figure 5
Parameter ts (h) σ² (h²) Hu (g) R (-) Stirrer speed
Experimental 1.3 0.9 33.2 (-) 28 rpm
Optimized 1.2±0.1 0.6±0.1 31.4±1.7 4.5±1.2
Experimental 1.3 0.6 31.6 (-) 14 rpm
Optimized 1.3±0.1 0.5±0.1 33.2±1.4 3.3±0.7
Dow
nloa
ded
by [
Eco
le d
es M
ines
D'A
lbi]
at 0
1:25
20
Janu
ary
2015

21
Figure 1. Schematic representation of the lab-scale paddle dryer and photo of the mixing
device.
Dow
nloa
ded
by [
Eco
le d
es M
ines
D'A
lbi]
at 0
1:25
20
Janu
ary
2015

22
Figure 2. 1D cells chain for the modelling of solids flow in a paddle dryer.
Dow
nloa
ded
by [
Eco
le d
es M
ines
D'A
lbi]
at 0
1:25
20
Janu
ary
2015
23
Figure 3. Influence of the transition duration, Δt, on the mean residence time and the
dimensionless variance, standardized by the results for ∆t=0.5 s, for R=1.9 and ξ =0.19 h
(dot) or R=4.6 and ξ =0.16 h (square).
Dow
nloa
ded
by [
Eco
le d
es M
ines
D'A
lbi]
at 0
1:25
20
Janu
ary
2015
24
Figure 4. Influence of the transition duration, Δt, on the exit age distribution function,
E(t), for R=4 and ξ =0.1 h.
Dow
nloa
ded
by [
Eco
le d
es M
ines
D'A
lbi]
at 0
1:25
20
Janu
ary
2015

25
Figure 5 – Comparison of experimental and computed RTD functions for a pulse
injection of tracer in steady-state operation (only one tracer is represented): (a) stirring
speed of 28 rpm; (b) stirring speed of 14 rpm.
Dow
nloa
ded
by [
Eco
le d
es M
ines
D'A
lbi]
at 0
1:25
20
Janu
ary
2015

26
Figure 6. Influence of the recirculation coefficient R on the exit age distribution function
E(t) for ξ =0.1 h.
Dow
nloa
ded
by [
Eco
le d
es M
ines
D'A
lbi]
at 0
1:25
20
Janu
ary
2015
27
Figure 7. Influence of the ratio ξ on the exit age distribution function E(t) for R=4.
Dow
nloa
ded
by [
Eco
le d
es M
ines
D'A
lbi]
at 0
1:25
20
Janu
ary
2015

28
Figure 8. Influence of the recirculation coefficient R on the mean residence time (left)
and the dimensionless variance (right) for different values of the ratio ξ.
Dow
nloa
ded
by [
Eco
le d
es M
ines
D'A
lbi]
at 0
1:25
20
Janu
ary
2015


