
Driving ElectrificationA global comparison of fiscal incentive policy for electric vehicles
Peter MockManaging Director ICCT Europe
10th meeting of the GRPE informal group on Electric Vehicles and the Environment (EVE)Geneva, June 2, 2014

2
ICCT is working with governmentsin the top vehicle markets worldwide
Number of light-duty vehicles on the road in 2010

3
Driving Electrification – A “kick-off” report
http://www.theicct.org/driving-electrification-global-comparison-fiscal-policy-electric-vehicles

4
The starting point How many EVs are sold, and where?

5
Global sales of electric vehicles doubled in each of the past three years

6
Norway and Netherlands were leading EV markets in 2013
7
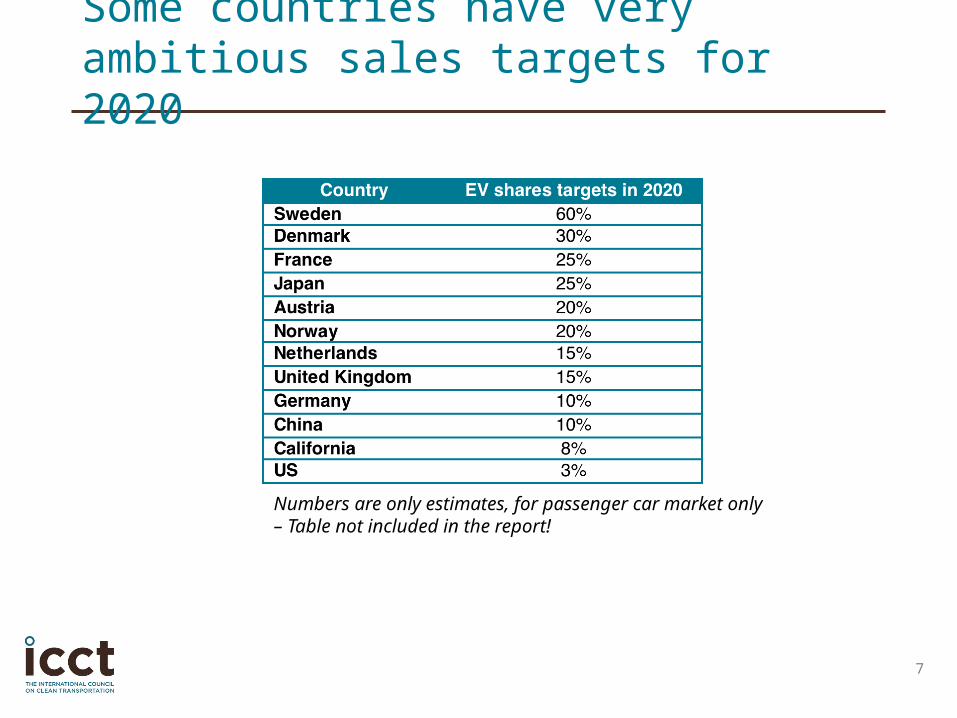
Some countries have very ambitious sales targets for 2020
Numbers are only estimates, for passenger car market only– Table not included in the report!

8
Strong increase of sales in Germany, but at a very low level
9
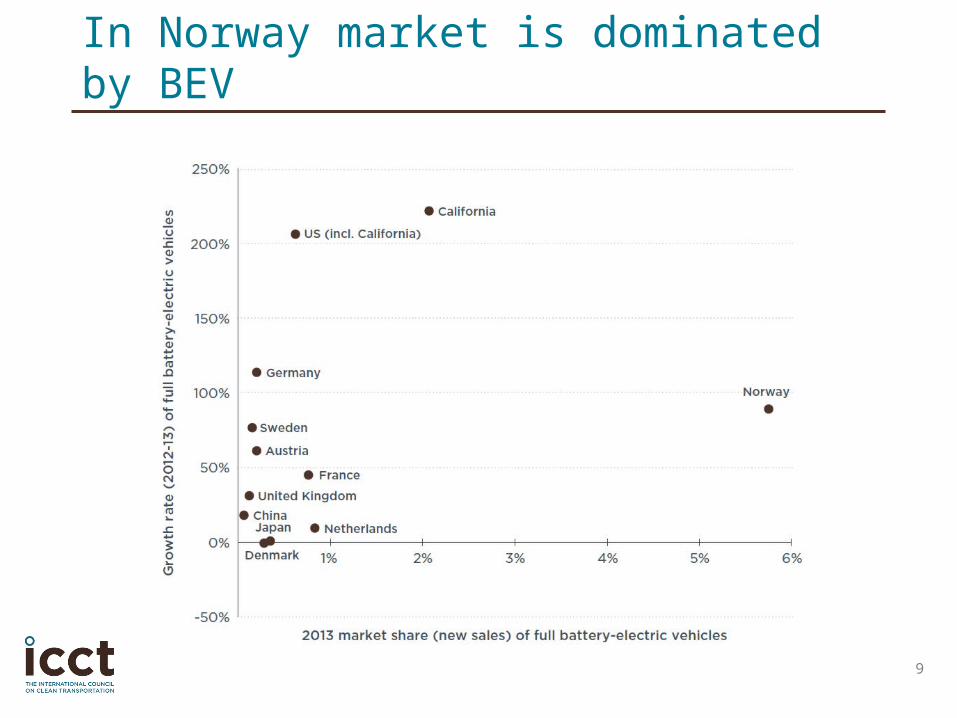
In Norway market is dominated by BEV

10
In Netherlands there are mostly PHEV

11
The methodologyHow to compare fiscal incentives for EVs in different markets?
12
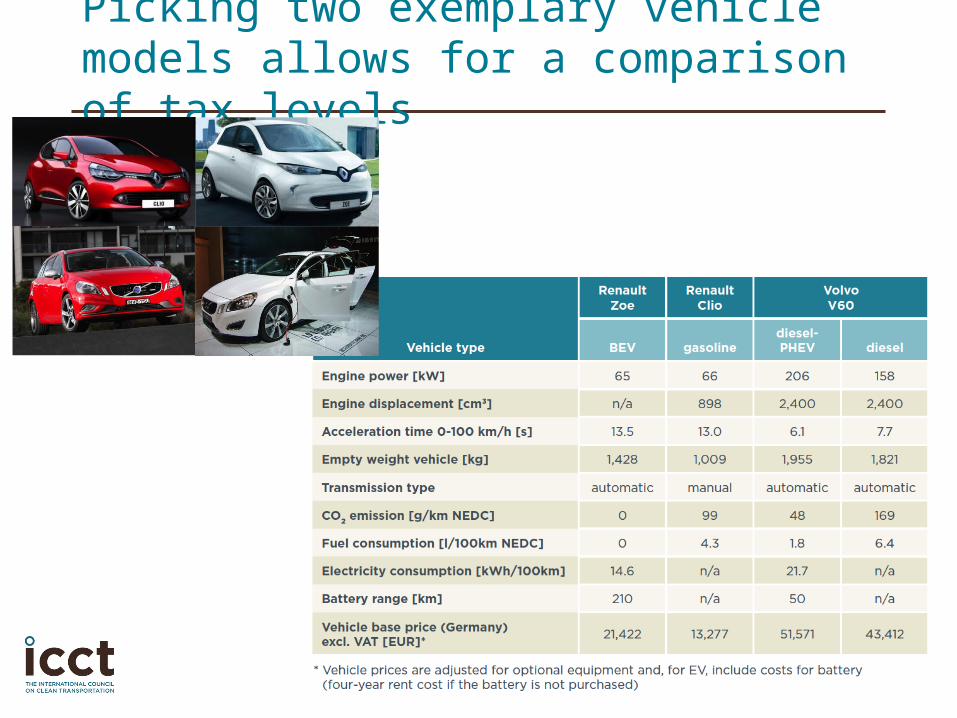
Picking two exemplary vehicle models allows for a comparison of tax levels

13
Direct (one-time) subsidies
Renault Zoe (BEV)
Volvo V60(PHEV)
France 7,000 EUR 5,000 EUR
UK 5,800 EUR 5,800 EUR
Sweden 4,500 EUR 4,500 EUR
US 5,400 EUR 3,900 EUR
California 7,200 EUR 5,000 EUR
Japan 4,600 EUR 3,400 EUR
China 6,000 EUR 4,200 EUR
all numbers are approximations only

14
Other fiscal incentives
• Value added tax (VAT) savingse.g. Norway: 4,500 EUR (BEV), 0 EUR (PHEV)
• One-time purchase / registration tax savingse.g. Denmark: 14,000 EUR (BEV), 17,000 EUR (PHEV)
• Annual circulation tax savingse.g. Netherlands: 380 EUR (BEV), 1,900 EUR (PHEV)
• Company car tax savingse.g. Netherlands: 1,100 EUR (BEV), 4,300 EUR (PHEV)

15
Fuel cost savings

16
Different markets, different incentive systems

17
The resultsWhy are EVs successful in some markets but not in others?

18
Norway and Denmark are only markets where TCO looks favorable for BEV

19
Only in Netherlands TCO looks favorable for PHEV

20
Norway and Denmark provide highest incentive levels for BEV

21
Netherlands and UK provide highest incentive levels for PHEV

22
For Denmark large difference in incentive level for private and company customers

23
For Netherlands very high incentive level in 2013 lead to very high sales numbers

24
High incentive level leads to high sales – but not always!

25
Outlook
How can we quantify “soft” incentives?
What is a sustainable way of incentivizing?

26
Norway continues to grow …

27
… but for how long?

28
Incentives 2.0 – How to get there?
indicative numbers only


