
CERTIFICATE
Certified that the undersigned have proposed the
appropriate and need based activities required in the
watershed project area with active participation of
beneficiaries along with consultation of Watershed
Committees (WCs). Approval of Watershed Project Plan
and DPR has been obtained from WC, Gram Sabah. The
plan and DPR document of RAIPUR (PALI IWMP – XXI)
Project, at P.S.–Raipur District - Pali is technically sound,
viable and appropriate for implementation during the
period 2011-12 to 2017-18.
We recommend that this plan to be sanctioned and put
to implementation.
Signature Signature Signature Signature Signature Signature
Chairman/ Secretary
WC
WDT
members
Junior
Engineer
P.S.Raipur
Assistant
Engineer&PIA
P.S.- Raipur
Project
Manager,WCDC
Distt.- Pali
1
2
3
4
TM
PDF Editor

Detail of Project
1. Name of Project : RAIPUR (PALI IWMP- XXI)2011–12
2. Sanction No. & date of Project : 4800–508 Date:- 05–08–2011
3. Macro & Micro No. : 10/1,2B,6,7,8,9,10 6/1,2,3,4
4. Deviation from Project Sanctioned :
Items As per Project Sanctioned As proposed in DPR Project Name
No. Of G.P No. Of Villages No. Of G.P No. Of Villages
IWMP XXI 5 14 7 12
Items As per Project Sanctioned As proposed in DPR Project Area 5180 Ha. 4361 Ha.
Macro/Micro No 10/1,2B,6,7,8,9,10 6/1,2,3,4 10/1,2B,6,7,8,9,10 6/1,2,3,4
Name of Gram Panchayat
Chang , Chitar , Nanana, Pratapgarh, Ratdiya, Relra
Chang , Chitar , Giri, Nanana, Pratapgarh,
Ratdiya, Relra Name of Villages Badi Pole, Sailpura, Ratdiya,
Bhavriya, Nanana, Rawatkhera, Chang, Salacot, Devnagar, Kalpura, Kanecha,
Naharpura, Pratapgarh
Chang, Kanpura, Chitar, Lakhina Panabaori, Giri,
Nanana, Naharpura, Ratdiya, Sailpura, Deoli Khurd, Kanecha Udawatan
Project Cost (Rs. in Lakes)
777.00 Lac. 654.15 Lac.
• 5180-4361 = 819 Ha. Area are due to Treatted.
TM
PDF Editor

• CHAPTER – I
INTRODUCTION
Location
The Project is located in Raipur Block, of Pali District. The project area is between
the Latitudes 25° 15’ 30” & 74° 18’ 30” Longitudes. It is at a distance of 17 km from its
Block head quarters and 46 Km. from the district head quarters. There is 14 no. of
habitations in the Project area and other details are given below.
General features of watershed
S.
No.
Name of Project (as per GOI) Raipur (PALI IWMP) 21/2011-12
(a) Name of Catchment Local Nalla
(b) Name of watershed area (Local Name) Pali IWMP–21 Nanana(10), Narpura(6)
(c) Project Area 4361 Ha
(d) Net treatable Area 4361 Ha
(e) Cost of Project 654.15 Lack
(f) Cost/hectare 15000/- Per Ha.
(g) Year of Sanction 2011-12
(h) Watershed Code 06020601,6020602,6020603,6020604, 6021001,
6021002, 6021006, 6021007, 6021008, 6021009,
6021010
(i) No. of Gram Panchayats in project area 7 No
(j) No. of villages in project area 12 No
(k) Type of Project Other
(l) Elevation (metres) 450-500 m
(m) Major streams 10.800 K.M.
(n) Slope range (%) 0-3%
TM
PDF Editor

S. No. Name of Gram Panchayat
Macro/Micro Name of Villages Covered
Census code of villages
Total Area
of Village
Area in W/S (Ha)
1 CHANG 10/2,8,9 CHANG 0820000202408500 1326 519
2 CHITAR
10/8 KANPURA 0820000202406600 1992 19
3 10/8,9 CHITAR 0820000202406500 1405 479
4 10/1 LAKHINA PANABAORI
0820000202409000 37 37
TOTAL 3434 535
5 GIRI 10/6’7’10 GIRI 0820000202405200 2563 308
6 NANANA 10/6 NANANA 0820000202405900 1555 128
7 PRATAPGARH
6/1,2,3,4 NAHARPURA 0820000202409900 987 832
8 6/2 PRATAPGARH 0820000202410000 942 436
TOTAL 1929 1268
9 RATDIYA
6/1,3,4,10/2,9,1 RATDIYA 0820000202409100 1455 1206
10 10/1,2,9 SAILPURA 0820000202408900 195 170
TOTAL 1650 1376
11 RELRA
10/6 DEOLI KHURD 0820000202406300 249 82
12 10/9 KANECHA UDAWATAN
0820000202406400 145 145
TOTAL 394 227 TOTAL 12851 4361
The watershed falls in Agro climatic Zone IV. The soil texture is Sandy Loom. The
average rainfall is 56.89 cm. The temperatures in the area are in the range between 31-47
centigrade during summer and 5-23 centigrade during winter. The major crops in the area
are 2397 Ha (Bajara, Wheat, Gram & Mastered) 54.96% land is under cultivation, 45.04%
land fallow, 45.04% land is wasteland. 21.74% land is irrigated through well, Tube well, &
Minor Irrigation Project Of G.P. Tanks.
823 No of households are BPL (16.96% households) 945 are landless households
(19.47% households) and 3156 household are small and marginal farmers
(65.04%household). Average land holding in the area is 1.11 ha. 33.22% area is single
cropped area and 21.74% is double cropped. The main source of irrigation is well & Tube
well. The average annual rainfall (10 years) in the area is 566.51 mm. The Major streams in
the Watershed are 10.800 Km. the major festivals in the village are Dashera, Deepawali &
Holi. At present those villages of Project Area having 25593 No population with
Communities like SC, ST, Jat, Gurjar, Mali & Other.
TM
PDF Editor
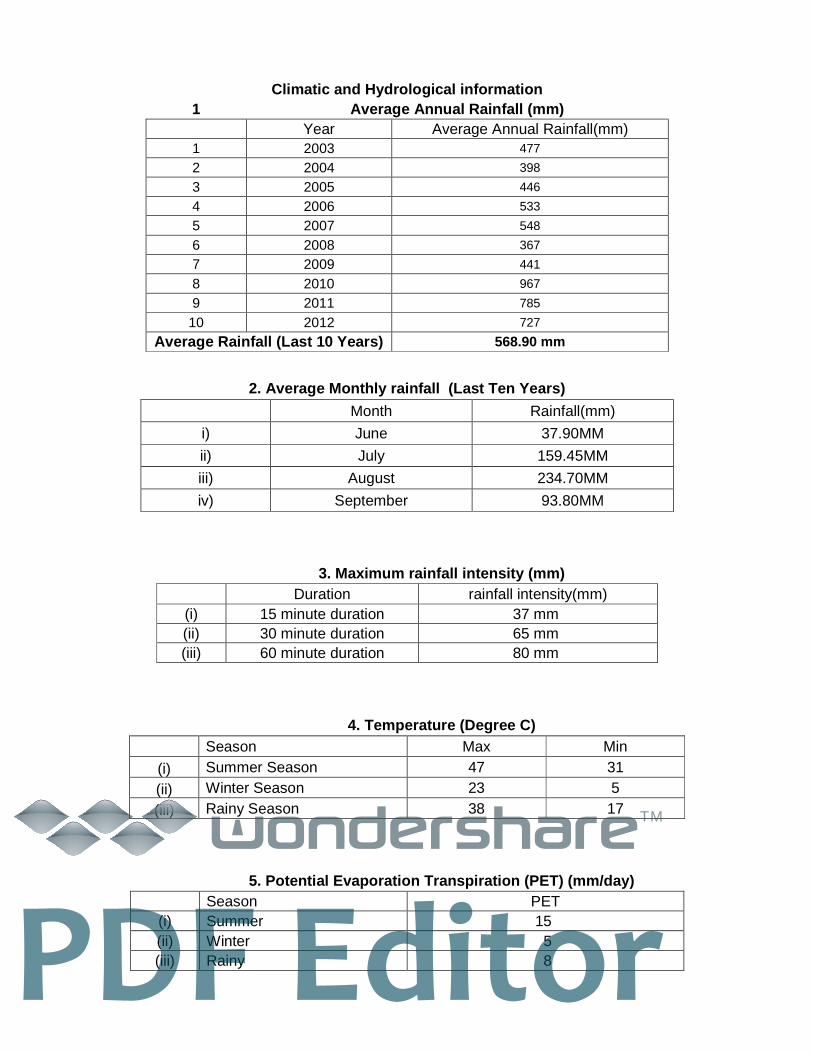
Climatic and Hydrological information 1 Average Annual Rainfall (mm) Year Average Annual Rainfall(mm) 1 2003 477
2 2004 398
3 2005 446
4 2006 533
5 2007 548
6 2008 367
7 2009 441
8 2010 967
9 2011 785
10 2012 727
Average Rainfall (Last 10 Years) 568.90 mm
2. Average Monthly rainfall (Last Ten Years)
Month Rainfall(mm)
i) June 37.90MM
ii) July 159.45MM
iii) August 234.70MM
iv) September 93.80MM
3. Maximum rainfall intensity (mm) Duration rainfall intensity(mm)
(i) 15 minute duration 37 mm (ii) 30 minute duration 65 mm (iii) 60 minute duration 80 mm
4. Temperature (Degree C) Season Max Min
(i) Summer Season 47 31
(ii) Winter Season 23 5
(iii) Rainy Season 38 17
5. Potential Evaporation Transpiration (PET) (mm/da y) Season PET
(i) Summer 15 (ii) Winter 5 (iii) Rainy 8
TM
PDF Editor

6. Runoff (i) Peak Rate (cum/hr) 1751040 (Cum./Hr.)
(ii) Total run off volume of rainy season (ha.m.) 35.825
(iii) Time of return 5 Years 10 Years In - Years
(a) maximum flood Nil Nil Nil
(iv) (b) Periodicity of Drought in village area Yes Yes No
Other Development Schemes in the project area
S. No Scheme Name of the
department Key interventions under the Scheme
Targeted Beneficiaries
Provisions under the Scheme
1. MNREGA ZILA PARISHAD PALI
KHADIN 7 35.420 FARM POND 9 15.660
OPEN CONTOUR TRENCH 200 23.400
NADI IN PD BLOCK 1 5.060 TANKA IN PD BLOCK 1 1.850
L.S.C.D. 207 13.124 GALI PLUG 9 1.260 PASTURE
DEVELOPMENT (Private Pasture)
24 2.587
HORTICULTURE PLANTATION 59 29.695
M.M.S. 10m. 2 10.960 M.M.S. 5m. 3 12.750
A.I. 400 0.600
2. Others (Bank)
Grant in aid to enterprising SHG or Federation of SHGs
individual
12 24.000
TOTAL 934 176.37
TM
PDF Editor

Details of infrastructure in the project areas:- Parameters Status
(i) No. of villages connected to the main road by an all-weather road
12 No.
(ii) No. of villages provided with electricity 12 No. (iii) No. of households without access to drinking water 0 (iv) No. of educational institutions : (P)
24
(UPS) 6
(HS) 3
(VI) Primary(P)/ Secondary(S)/ Higher Secondary(HS)/ vocational institution(VI)
(v) No. of villages with access to Primary Health Centre 5
(vi) No. of villages with access to Veterinary Dispensary 0 (vii) No. of villages with access to Post Office 3 (viii) No. of villages with access to Banks 3 (ix) No. of villages with access to Markets/ mandis 5
(x) No. of villages with access to Agro-industries 0 (xi) Total quantity of surplus milk 3 (xii) No. of milk collection centres (U)
0
(S) 3
(PA)
15
(O) 0
(e.g. Union(U)/ Society(S)/ Private agency(PA)/ others (O))
(xiii) No. of villages with access to Anganwadi Centre 22 (xiv) Any other facilities with no. of villages (please
specify) 7 No. (Rajiv Gandhi Seva
Kendra) (xv) Nearest KVK Pali (xvi) cooperative society 7 (xvii) NGOs Nil (xviii) Credit institutions
(i) Bank Nil (ii) Cooperative Society 7
(xix) Agro Service Centre's Nil
TM
PDF Editor

Institutional arrangements (SLNA, DWDU, PIA, WDT, W C, Secretary)
DWDU Details
PIA particulars
WDT Particulars: 1 2 3 4 5 6 7 8
S. No
Name of WDT member M/F Age Qualification Experience in
watershed(Yrs)
Description of professional
training
Role/ Function
1 Jh ukjk;.k flag pkSgku
M B. A. 15 Year Social Scientist
For Make of SHG
2 Vetenary Scientist
Animal Husbandry
Work
3 Jh Nhrj [kku M XII Agriculture 6 Year Agriculture
Scientist
4 Jh jktsUnz dqekj jk[kspk
M Diploma Civil 17 Year Engineer
1 2 3
S. No Particulars Details of DWDU
1. PM, DWDU Sh. Govind Singh
2. Address with contact no., website Zila Parisad Pali
3. Telephone 02932–221682
4. Fax
5. E-mail [email protected]
1 2 3
S. No Particulars Details of PIA
6. Name of PIA Sh. Ramraj Meena
7. Designation Assistant Engineer
8. Address with contact no., website Zila Parisad Pali
9. Telephone
10. Fax
11. E-mail
TM
PDF Editor

Details of Watershed Committees (WC)
S. No.
Name of WCs
Date of Gram
Sabah for WC
Date of Registration as a Society (dd/mm/yyyy
Designation Name M/F SC/ST/OBC/
General
Landless/MF/SF/
BF
Name of UG/SHG
Educational qualification
1
CHANG 20-03-2013 N. R.
President Jh dkyw [kkWa@ih: [kkWa
M OBC
Secretary Jh gjn;ky@Hkaoj yky
M UG
Member Jh feBw flag@dkyw flag
M General UG
Member Jh lktu@inek M UG
Member Jh xksfoUnjke@nsoh yky
M UG
Member Jh jes'k@ckcw yky M UG Member Jh gSnjvyh@lqcku M UG Member Jh erh rqylh@xksiky F SHG
Member Jh erh ucZnk nsoh@jkepUnz
F SHG
Member Jh erh lhrk@isek F SHG Member Jh eqjkn@eaxyk M UG Member Jh lqok@ckcw M UG Member Jh erh lk;j@rstk F SHG
TM
PDF Editor

Details of Watershed Committees (WC)
S. No.
Name of WCs
Date of Gram
Sabah for WC
Date of Registration as a Society (dd/mm/yyyy
Designation Name M/F SC/ST/OBC/
General
Landless/MF/SF/
BF
Name of UG/SHG
Educational qualification
2
CHITAR N. R.
President Jh uSuqdkBkr M
Secretary Jh nsohdkBkr@eksrh dkBkr
M OBC UG
Member Jh ukuw@ckyk M OBC UG
Member Jh erh ukFkh@eksgu
F SC SHG
Member Jh vteky@dslk M OBC MF UG Member Jh Jo.k@lejFkk M OBC MF UG Member Jh jktw@eksVk M OBC Landless UG Member Jh nhuk@lek M OBC MF UG Member Jh do:@vyh M OBC MF UG Member Jh gjth@cUuk M SC MF UG Member Jh xksiky@uthj M OBC Landless UG
Member Jh lnoj@eksgEen [kkWa
M OBC Landless UG
Member Jh jetku@bZLekbZy M OBC Landless UG
TM
PDF Editor

Details of Watershed Committees (WC)
S. No.
Name of WCs
Date of Gram
Sabah for WC
Date of Registration as a Society (dd/mm/yyyy
Designation Name M/F SC/ST/OBC/
General
Landless/MF/SF/
BF
Name of UG/SHG
Educational qualification
3
GIRI N. R.
President Secretary Member Member Member Member Member Member Member Member Member Member Member
TM
PDF Editor

Details of Watershed Committees (WC)
S. No.
Name of WCs
Date of Gram
Sabah for WC
Date of Registration as a Society (dd/mm/yyyy
Designation Name M/F SC/ST/OBC/
General
Landless/MF/SF/
BF
Name of UG/SHG
Educational qualification
4
NANANA 28-02-2012 N. R.
President Jh Nxu flag@mjt flag M General SF Secretary Jh ukjk;.k flag@xsu flag M General SF UG
Member Jh jru flag@xkso/kZu flag
M General MF UG
Member Jh cq/kk flag@dslk flag M General MF UG
Member Jh efr usuh nsoh@vej flag
F General MF SHG
Member Jh eksrh dkBkr M SC Landless UG Member Jh nsok@eaxyk es?koky M SC MF UG
Member Jh rstkjke@ukjk;.k yky dqEgkj
M OBC Landless UG
Member Jh ckcq yky@ukjn yky 'kekZ
M General Landless UG
TM
PDF Editor

Member Jh iUuk@inek HkkaM+ M OBC Landless UG Member Jh dkyw@'kdqj [kka rsyh M OBC Landless UG
Details of Watershed Committees (WC)
S. No.
Name of WCs
Date of Gram
Sabah for WC
Date of Registration as a Society (dd/mm/yyyy
Designation Name M/F SC/ST/OBC/
General
Landless/MF/SF/
BF
Name of UG/SHG
Educational qualification
5
PRATAPGARH N. R.
President Jh Qrsg flag@/kUuk flag
M General
Secretary Jh ;ksdj flag@jke flag M General UG
Member Jh erh lk;jh nsoh@ukFkk es?koky
F SC SHG
Member Jh exu flag@yknq flag M General UG Member Jh n;ky flag@ine flag M General UG Member Jh enu flag@Hkknk M General UG
TM
PDF Editor

flag
Member Jh erh yfyrk@lqjs'k iqjh
F OBC SHG
Member Jh erh ekuh nsoh@nsoh flag
F General SHG
Member Jh Hkokuh flag@lqtk flag
M General UG
Member Jh erh lq[kh@lkaoj flag
F General SHG
Member Jh feBq flag@yknq flag
M General UG
Details of Watershed Committees (WC)
S. No.
Name of WCs
Date of Gram
Sabah for WC
Date of Registration as a Society (dd/mm/yyyy
Designation Name M/F SC/ST/OBC/
General
Landless/MF/SF/
BF
Name of UG/SHG
Educational qualification
6 RATDIYA 27-02-2012 N. R. President Jh ckcq flag@gtkjh flag M
TM
PDF Editor

jkor
Secretary Jh i`Fohjkt dqekj flag@gfj flag
M General UG
Member Jh ukjk;.k flag@eaxy flag jkor
M UG
Member Jh efr 'kkUrh nsoh@ckcq flag jkor
F SHG
Member Jh uksjr ukFk@feJh ukFk M OBC UG
Member Jh xksih flag@izse flag jkor
M UG
Member Jh Qrsg eksgEen@fHk{kq [kka
M OBC UG
Member Jh ckcq flag@gtkjh flag jkor
M UG
Member Jh Hkxoku flag@Nksx flag jkor
M UG
Member Jh ukjk;.k@izrki th xqtZj M OBC UG Member Jh jetku@usuk th esjkr M OBC UG Member Jh dpd flag@vthe flag jkor M UG Member Jh [kse flag@eky flag jkor M UG
TM
PDF Editor

Details of Watershed Committees (WC)
S. No.
Name of WCs
Date of Gram
Sabah for WC
Date of Registration as a Society (dd/mm/yyyy
Designation Name M/F SC/ST/OBC/
General
Landless/MF/SF/
BF
Name of UG/SHG
Educational qualification
7
RELRA 12-08-2013 N. R.
President Jh enu flag M General
Secretary Jh izse flag M General UG
Member Jh ukjk;.k yky M UG
Member Jh guqeku yky M UG
Member Jh ukjk;.k flag iap M General UG
Member Jh efr Hkaojh nsoh iap
F SHG
Member Jh y{e.k flag M General UG
Member Jh lksgu flag M General UG
Member Jh izse flag M General UG
Member Jh dku flag M General UG
Member Jh ckcq flag M General UG
TM
PDF Editor

Problems and scope of improvement in the project ar ea
The socio economic conditions of the area can be improved through increased production which
can be achieved through expansion in cultivated area and productivity 2397 Ha. Land is Arable &
1964 Ha. Wasteland Land 612 Ha. is fallow can be brought under cultivation.
948 Ha. is only Irrigated and with efforts this can be increased to 850 Ha. The productivity gap of
major crops in the area as compared with district and with areas in the same agro climatic zones
indicate potential to increase the productivity. The demonstration of improved package of
practices, improved varieties, increased irrigation facilities and soil conservation measures under
the project can bridge this gap. Due to small land holdings in the area focus of the project would
be on diversification in agriculture (horticulture, vegetables, green houses, Agro forestry, fodder
crops)and diversification in Livelihoods(Agriculture, Animal husbandry, self employment)
37350 Quintal fodder scarcity can be met out through Pasture development .Improved animal
Husbandry practices can increase the productivity of livestock. 152 no of persons migrate due to
lack of employment at village level, this migration can be checked through creation of employment
opportunities in the project area through increase in production and diversification in agriculture
and Livelihoods as mentioned above.
1. Soil Erosion
Soil of Raipur is moderately to severely erode mainly by rivers and nallahs, mostly during the rainy
months. Besides, stagnation of water has given rise to the problem of salinity and alkalinity.
2.Socio-Demographic Profile
The project area consists of a total
population of 25593 with nearly 9.30% of
the population belonging to the
Scheduled Caste and 0.00% of the
population Scheduled Tribe communities.
The sex ratio in the area is 1041. The
area has a low level of literacy of 33.23%
as compared to 60.40% at the State
level. With the female literacy rate being
a mere 10.96%, the status of literacy in
the area is one of the indicators of the
deplorable plight of the women in the
area.
Table 3: Demographic Profile of Raipur Project A rea
POPULATION
Total population 25593
Male Population (%) 49.00
Female Population (%) 51.00
Sex ratio (female per thousand males) 1041
% Population of Scheduled Caste 9.30
% Population of Scheduled Tribe 0.00
Literacy rate Total (percent) 33.23
Literacy rate male (percent) 22.27
Literacy rate female (percent) 10.96
Source: Government of Rajasthan and Census of India
TM
PDF Editor

Figure 2: Mean Income from different sources Source: Baseline Survey (2012)
3. Livelihood Profile
Agriculture and animal husbandry have been central
to the livelihoods of the people living in this area.
Frequent occurrences of drought in the recent years
has however, increased the vulnerability of the
farming communities. Increased pressure on land,
decline in the productivity of agricultural land
combined with shrinking of forests and common
pasture land has threatened the viability of farming
as a primary livelihood option in the area.
Only 45% of the income is derived from farming and
the people have to resort to other options for sustaining their families. Low levels of literacy,
absence of programmes for developing skills particularly in the non-farm sector and limited
access to basic infrastructural facilities and services has impinged on the people’s right to
choose the best livelihood option. Migration can be seen as a prominent phenomenon with
nearly 12% of the income coming from migration. Launch of MGNERGA has helped in
generating employment in the area with about 12% of the income of the people being
derived from working on MGNREGA sites.
4. Agriculture
Land and water resources have been the key drivers of farm based production systems
which form the predominant source of livelihoods of the people in this area. The area is
characterized by land based economy. Land has also been crucial in defining the social and
political relations of the people in the area. 21.67% of the households are landless while
64.50% are small and marginal farmers. With very low landholdings and subject to vagaries
of nature agriculture remains a high risk-low input-low output activity.
The area mostly has sandy loam to clay loam soil where the percolation of water ranges
from good to medium. Most of the soil is calcareous while in some patches, saline and
alkaline soil is also found. The soil is moderately to severely eroded mainly by rivers and
nallahs. Substitution of organic fertilizer with chemical fertilizer has further worsened the soil
quality. The nature of agriculture and farming practices is also strongly conditioned by the
availability of water. Depletion in the surface as well as ground water resources has
adversely affected agriculture. Some of the villages in the area have access to canal and
tank irrigation; wells are the most common source of irrigation. The farmers mostly use
engine to draw water for irrigation from wells. Besides, flood irrigation is a common practice
that can be found in the area.
TM
PDF Editor

Kharif is the main cropping season in the area. Major cereals grown during Kharif include
maize, bajra and jowar. Crop production during Rabi remains limited to such farmlands
which have access to irrigation. Wheat is the main cereal crop grown during Rabi. Besides
cereal crops, pulses, fodder crops like Rajka and oilseeds such as groundnut and mustard
are also cultivated in the area. Over the years, the agricultural practices have undergone a
remarkable change in the area. Besides the traditional plough, tractors are also being
increasingly used. Chemical fertilizer is used intensively. The types of seeds, pesticide and
fertilizer across the different villages in the area are detailed in the tables below:
Cropping Status
S. No
Season Crop
Shown
Rainfed Irrigated Total
Varieties Area (Ha.)
Production (Tun)
Productivity
(kg/ha) Varieties
Area (Ha.)
Production (Tun)
Productivity (kg/ha)
Area (Ha.)
Production (Tun)
1 Kharif Bajra MK-30 850 824.50 970 MK-30 85 83.30 980 935 907.80 GWAR 285 119.70 420 45 19.25 425 330 138.95 JWAR 151M 650 624.00 960 151M 55 53.07 965 705 677.07 2 Rabi
WHEET 3077, Lok-1
3077 350 784.00 2240 350 784.00
CHANA DAHED YELLOW 115 98.32 855 115 98.32
SARNSO T-59/
PUSA-VON
T-
59/PUSA-VON
250 312.50 1250 250 312.50
TOTAL 1785 1568.20 900 1350.44 2685 2918.64
Productivity kg/ha Name of the
crop India Highest Average Yield in Rajasthan District Project Area Deficiency in productivity
comparison with District
Wheat 2708 3185 2440 2240 200
Gram 808 622 875 855 20
Mustered 1095 1356 1300 1250 50
Bajra 886 828 1050 970 70
Gwanr 650 509 445 420 25
Jwar 730 1634 650 610 40
TM
PDF Editor

Shown The Bar Chart As Follow
Reasons for law productivity:-
• Use local Varieties of Seed
• Allcanase soil
• Soil depth low
• Wrong Agriculture practice
• Lack of Availability of good quality seeds of desired crop and variety in adequate
quantities and time to the farmers.
• Availability of water for cultivation(18.33% is Irrigated table No. 2.6)
TM
PDF Editor

5. Livestock
Agriculture supplemented with livestock keeping forms the basis of sustenance for the
farmers in this area. Crop residue and grazing provides fodder and forage to livestock.
Livestock keeping on the other hand acts as a drought power and source of energy,
nutrition and manure. The symbiotic relation between the two systems is clearly visible and
change in one has a direct impact on the other. As per the baseline survey, livestock
rearing contributes 17% of the income of the people in the area.
The livestock composition shows that smaller ruminants are more than the larger
ruminants. However, the number of cows is much higher than other animals in the area.
Degradation of common grazing lands and frequent occurrences of drought in the recent
years has raised serious questions pertaining to fodder security in the area. Loss of
vegetative cover as a result of high degrees of soil erosion and overgrazing has adversely
affected the productivity of these common grazing lands. Changes in the cropping pattern
along with the substitution of organic fertilizer with chemical fertilizer reduced the fertility of
the soil as well as the quality of fodder available from crop residue. Further, frequent
occurrences of drought leading to crop failure also affected the fodder availability from crop
residue which has increased the pressure on the already overexploited common grazing
land. The factors mentioned above have not only led to a decline in the productivity of the
livestock but have also increased instances of distress sale of livestock.
S.
No
Name of Animal Av. milk production
(Lit. per day)
Actual milk production (Lit.
per day)
Remarks.
1 Cow Indigenous 2 - 3 4 - 5
2 Cow Hybrid 7 - 8 10 - 12
3 Buffalo 5 - 6 12 - 15
Reasons for gap in milk production
A. Deficiency of vitamin and minerals.
B. Lack of management and awareness.
C. Lack of health treatment in proper way.
TM
PDF Editor

5. Migration
In an economy which largely
demands skilled manpower, lack
of skill enhancement opportunities
is an added disadvantage for the
people in this area. Most of the
people in the area who have
resorted to non-farm employment
end up as daily wage earners in
the nearby cities. The ones who
migrate to cities have to leave
their families back in the village as
their earning in the city is not able
to substitute returns from farm but
only supplement it. As per the baseline survey, about 5% of the Population in the area
migrate. Migration to cities and towns is usually in mining and quarrying, construction and in
some small trading and manufacturing work.
Table 10: Households Migrating Total Population No of Population CHANG 4444 450 KANPURA 799 95 CHITAR 4023 425 LAKHINA PANABAORI 37 0 GIRI 4711 510 NANANA 3399 380 NAHARPURA 2258 250 PRATAPGARH 1801 205 RATDIYA 2782 310 SAILPURA 731 95 DEOLI KHURD 278 40 KANECHA UDAWATAN 330 50
Total 25593 2810
Source: Baseline Survey (2012)
TM
PDF Editor

Base Line Survey Format for IWMP MIS website
Project Name :- RAIPUR IWMP-XXI
Total Geographical Area of Project (Lakh Hectares) :- 0.04361 Lakh Hectares
Treatable Area Wasteland (Lakh Hectares) 0.01964 Rainfed Agricultural
Land (Lakh Hectares) 0.01449
Total Cropped Area (Lakh Hectares)
0.02397 Net Sown Area (Lakh Hactares)
0.02685
Total no. of Water Storage Structure
Total no. of Water Extracting Units
Total storage capacity of water storage structures (cubic meters)
cum
No. of Household SC 447 ST 6
Others 4399
Total Population of the project Area
25593 No. of Household of Landless people
945
Total no. of BPL Household 823 No. of small Farmer’s household
1377
No. of person -days of Seasonal Migration
2810-270 Day
in a Year
No. of Marginal Farmer’s Household
1779
Depth of Ground Water (meters) below Ground level Pre- monsoon 15.70 Post -monsoon 15.00
No. of person -days of Seasonal Migration
2810-270 Day
in a Year
TM
PDF Editor

CHAPTER – II Socio economic Features, Problems and Scope
Table 2.1 Population & Household Details:
Total Population
Male Female Total SC ST
12539 13054 25593 2450 50
Household Details BPL
Household L.
Less Small
Farmer M.
Farmer Total
Household SC
Household ST
Household 823 945 1377 1779 4852 447 6
Table 2.2 Development indicators
S. No. Development Indicators State Project Area 1. Per capita income (Rs.) 16200 12400 2. Poverty ratio 0.22 0.229 3. Literacy (%) 60.40% 33.23% 4. Sex Ratio 921 1041 5. infant mortality rate 60 68 6. maternal mortality ratio 331 338
The above table indicates (poor,average,good ) socio economic conditions.
Table 2.3 Land Use
Land Use Total area in Ha.
Private Panchayat Government Community Total
Agriculture Land 2397 0 0 0 2397 Temporary fallow 612 0 0 0 612 Permanent Fallow 755 0 0 0 755 Cultivated Rainfed 1449 0 0 0 1449 Cultivated irrigated 948 0 0 0 948 Net Sown Area 1785 0 0 0 1785 Net Area sown more than once 900 0 0 0 900 Forest Land 0 0 0 0 0 Waste Land 755 1209 0 0 1964 Pastures 0 0 0 0 0 Others 0 0 0 0 0
TM
PDF Editor

The project area has 755 ha of cultivable wasteland . 612 ha of fallow land (total 1367 ha)
can be brought under cultivation if some irrigation source can be provided through
Construction of WHS like MMS, MCD, Farm ponds etc. and also through demonstration of
rainfed varieties of crops. Construction of WHS can also increase in area under irrigation
which is only 21.73% 1367 ha. (45.03 % of the project area) wastelands can be brought
under vegetative cover, with reasonable effort. Activities like Masonry check dams,
Vegetative filter strip, V-ditches, staggered trenches, WHS (Johad) Afforestation of
wastelands and Pasture development will be taken up on these Lands.
Pasture development :- the land use table shows that there is 755 Ha. pasture land
(17.31%) This emphasizes the need for taking up pastureland development works through
sowing of promising species of grasses Lick Dhaman shytailo hamata etc. and plantation
lick Desi Babul Khejri etc.
Table 2.4 .a Agriculture and Horticulture status an d fuel availability.
Cropping Status
S. No
Season Crop
Shown
Rainfed Irrigated Total
Varieties
Area (Ha.)
Production
(Tun)
Productivity
(kg/ha) Varieties
Area (Ha.)
Production (Tun)
Productivity
(kg/ha)
Area (Ha.)
Production (Tun)
1 Kharif Bajra MK-30 850 824.50 970 MK-30 85 83.30 980 935 907.80 GWAR 285 119.70 420 45 19.25 425 330 138.95 JWAR 151M 650 624.00 960 151M 55 53.07 965 705 677.07 2 Rabi
WHEET 3077, Lok-1
3077 350 784.00 2240 350 784.00
CHANA DAHED YELLOW 115 98.32 855 115 98.32
SARNSO T-59/
PUSA-VON
T-
59/PUSA-VON
250 312.50 1250 250 312.50
TOTAL 1785 1568.20 900 1350.44 2685 2918.64
Table 2.4.b Abstract of cropped Area(ha) Area under Single crop 2685 Area under Double crop 900 Area under Multiple crop
TM
PDF Editor

The Farmers are using Desi Varieties of as shown be low where on Hybrid Varieties shown in table can increase the Productio n:-
Name of crop Use Varieties Recommended Varieties Remark Bajra MK-30 1 navjot , Partp sanker Use
Recommended Varieties can increase the Production
Gawar Desi / Local Durgapura Safed , Pusa navbahar Jwar Desi / Local 151M
Wheat 3077 Ral 3077 , Raj 4037, H.I.153 Gram RSG-888
Sarnso T-59/PUSA-VON
Bayo 902, Vasundra
Crop Rotation** will vary from project to project
Bajra - Wheat Bajra - Fallow Jawar - Mustered Gawar - Fallow Fallow - Gram Gawar - Fallow
The table shows that only 900 Ha. are (20.63%) is double cropped area. Also the crop
rotation shows that fallow lands are there. This indicates that there is scope for change in
crop rotation in fields where there are fallow lands through Soil and Water conservation
measures, crop demonstration and diversification in agriculture.
Soil and Water conservation measures besides putting fallow lands under cultivation can
change the area under single cropping to double and multiple cropping.
Table 2.4.c Productivity Gap Analysis
Productivity kg/ha
Name of the crop India Highest Average
Yield in Rajasthan District Project Area Deficiency in productivity comparison with District
Wheat 2708 3185 2440 2240 200
Gram 808 622 875 855 20
Mustered 1095 1356 1300 1250 50
Bajra 886 828 1050 970 70
Gwanr 650 509 445 420 25
Jwar 730 1634 650 610 40
TM
PDF Editor

Shown The Bar Chart As Follow
Analysis of the above table indicate that besides national gap there is wide gap in productivity
within state and even within same agro climatic zones.
The reasons for this variation are
• Use local Varieties of Seed
• Allcanase soil
• Soil depth low
• Wrong Agriculture practice
• Lack of Availability of good quality seeds of desired crop and variety in adequate
quantities and time to the farmers.
• Availability of water for cultivation(18.33% is Irrigated table No. 2.6)
The productivity gap and reasons of it indicate potential to increase the productivity
through crop demonstration. Crop demonstrations would be carried out on improved crops/
varieties, improved agronomic practices. INM, IPM, Mixed cropping, distribution of fodder
seed mini kit. Demonstration of improved methods and economics of fodder crops
cultivation and also distribution foundation seeds of Forage Crops for further multiplication,
introduction of fodder crops in the existing crop rotations.
TM
PDF Editor

Table 2.5 Existing area under horticulture/Vegetabl es/Floriculture (ha)
Activity Area Species Varieties Recommended
varieties Production Horticulture 4 Ha. Nimbus Desi Kagji (Beeju) 1 Qt. per plant
2 Ha. Orange Nagpuri, New Selar
, Bader
5 Ha. Awla Graphted, Karshna , Kanchan , Kalmi
Vegetables 0Ha. Tomato
Floriculture 0 0 0 0 0
Medicinal Plants 0 0 0 0 0
Table 2.6 Land holding Pattern in project area
Type of Farmer Total
Households
Land holding (ha) irrigation source wise Land holding (ha)Social group wise
Irrigated (source) Rainfed
Private Waste Land
Total General SC ST OBC Total
(i) Large farmer 751 362 553 286 1201 158 24 0 1019 1201 (ii) Marginal farmer 1779 255 390 205 850 143 79 1 627 850 (iii) Small farmer 1377 331 506 264 1101 186 99 0 816 1101 (iv) Landless person 945 0 0 0 0 0 0 0 0 0
Total 4852 948 1449 775 3152 487 202 1 2462 3152
65.04% land holdings belong to small and marginal farmers who own 54.96% of total
cultivated area. Horticulture/vegetables could be more economical to Small and marginal
farmers with irrigation source. For large farmers with no irrigation facility Horticulture/
vegetables will be promoted in a part of land with farm pond/Tankan construction.
The following activities will be more beneficial for small land holdings and for diversification
and income for large farmers.
Horticulture plantation, Medicinal and Aromatic Cro ps, floriculture: As discussed
earlier . Horticulture/vegetables could be more economical to Small and marginal farmers
with irrigation source. Also the project area has good potential for medicinal & aromatic
crops like Sonamukhi, Isabgol, Ashwagandha, Khus, Mehandi etc.
TM
PDF Editor

Agro forestry plantation: To increase the income of farmers and also for shelter belt
plantation as wind velocity is high in the project area.
Setting of Vermi Compost Units - Keeping in view the side effect of residues of chemicals
and fertilizers on human health the emphasis would be on cultivation of organic produce
through motivating farmers and providing assistance for production of organic input, vermi
compost.
Production and distribution of quality seed – There is need to ensure that good quality
seed is available for cultivators for which adequate seed production would be initiated in
watershed areas with the assistance of private sector and agriculture department
technologies
Sprinklers and pipelines for efficient water management practices emphasis on
demonstration of sprinklers with adequate financial support and convergence/private
partnership.
Establishment of Green House - For growing off season vegetables seedlings and other
horticultural crops under controlled atmospheric conditions of green house.
Establishment of nurseries: Most of the planting material is procured from other parts of
the State/ country. The procurement of planting material from distant places causes
damage to the planting material and often results in untimely supply. Hence nursery
development activity in area.
Innovative hi-tech/ export oriented activities : innovative hi-tech/ export oriented projects
like mushroom cultivation, floriculture, etc which are in negligible existence at present, can be
implemented by individual farmers / private companies.
Drip irrigation Drip irrigation will be promoted in all horticulture plantations, vegetables,
green houses and in nurseries for rational use of irrigation higher yields and quality produce.
TM
PDF Editor

Table 2.7 Livestock Status - animals/milk productio n / average yield .
S. No.
Description of Animals
Population in No.
Yield(milk/ mutton/Wool)
Equ. cow units
Dry matter requirement per year qtl
(7Kg per animal/day.)
Total requirement
in M.T.
1 Cows Indigenous 1171 4684 29919 299.19 Crossbree
d 395 3160
10092 100.92 2 Buffaloes 1413 8478 36102 361.02 3 Goat 1996 1197 988 25243 252.43 4 Sheep 2285 1371 1143 29203 292.03 5 Camel 0 0 0 0 6 Poultry 0 0 NA 0 0 7 Piggery 0 0 NA 0 0 Total 4382 18890 130559 1305.59
In spite of the large number of livestock, production is less hence increase in productivity
across all species, is a major challenge. To reduce production of unproductive cattle and
improve the productivity by improving the breeds by breeding management following
activities will be taken up
• Castration
• Artificial insemination
• Distribution of superior Breeding bulls for use in Cattle and Buffalo
• Breeding distribution crossbred rams
Besides breed improvement other animal husbandry practices like better health, hygiene and
feeding practices can increase productivity of livestock. Hence Activities like Animal health
camps ,Urea-Molasses treatment demonstration ,demonstration of improved methods of
conservation and utilization of Forage crops are proposed.
TM
PDF Editor

Table 2.8 Existing area under fodder (ha)
S. No Item Unit Area/Quantity
1 Existing Cultivable area under Fodder Ha 2397 2 Production of Green fodder quintals/year 71910 3 Production of Dry fodder quintals/year 0 4 Area under Pastures Ha 755 5 Production of fodder quintals/year 37750 6 Existing area under Fuel wood Ha 7 Supplementary feed Kgs/ day 35769 8 Silage Pits No - 9 Availability of fodder quintals 109660 10 Deficiency/excess of fodder quintals 20899
The table above shows there is fodder deficiency (Requirement is 130559 Qt. and
availability 109660 Qt.)
To minimize the large and expanding gap between feed and fodder resource availability
and demand there is need for
• Increase in area under fodder crops
• Increase in productivity of fodder crops
• Development of pastures
• And reduction in large number of livestock production through replacement by few but
productive animals.
Table 2.9 Agriculture implements
1 2 3 S. No Implements Nos.
1 Tractor 34 2 Sprayers-manual/ power 45 3 Cultivators/Harrows 3020 4 Seed drill 15 5 Any Other (Trally) 10
Farm mechanization and seed banks : As discussed earlier 65.01% land holdings belong
to small and marginal farmers who own only 34.99% of total cultivated area so owning of
big farm implements by individual farmers is not economical so SHG would be promoted to
buy farm implements and rent to farmer.
TM
PDF Editor

Table 2.10 MNREGA Status - No. of Card Holder, acti vities taken so far,
employment status.
S. No. Name of Village/G.P.
Total No of job cards In
G.P.
Employment Status Activity taken up so far
1 Chang Road , CVH , Nadi ect. 2 Chitar Road , CVH , Nadi ect. 3 Giri Road , CVH , Nadi ect. 4 Nanana Road , CVH , Nadi ect. 5 Pratapura Road , CVH , Nadi ect. 6 Ratdiya Road , CVH , Nadi ect. 7 Relra Road , CVH , Nadi ect.
Table 2.11 Migration Details
Name of village
No. of persons migrating
No. of days per year of migration
Major reason(s) for
migrating
Distance of destination of
migration from the
village (km)
Occupation during migration
Income from such
occupation (Rs. in lakh)
CHANG 450
8To 10 Month Employment 850 Km
Service At Individual
enterprineour lick Ice-cream Trolly , Tatrctor commpressure for coocking of foods etc. in the state of
Maharastra , U.P. , Punjab ,
Gujrat etc.
0.60-0.70 Lack per
year
KANPURA 95
CHITAR 425 LAKHINA PANABAORI 0
GIRI 510
NANANA 380
NAHARPURA 250
PRATAPGARH 205
RATDIYA 310
SAILPURA 95
DEOLI KHURD 40 KANECHA UDAWATAN 50
Total 2810
The migration can be check by creation of employment opportunities, enhancing farm level economy, increases the income of the people engaged in animal husbandry by dairy, poultry and marketing and value addition. (As discussed earlier) and diversification in livelihoods.
The existing livelihoods Village are given below
Table 2.12 (a) Major activities (On Farm)
Name of activity No of House holds Average annual income from the
(1.) Cultivators 3907 0.40 – 0.52 Lac (2.) Dairying 3308 0.55 - 0.50 Lac (3.) Poultry 0 0 (4.) Piggery 0 0 (5.) Landless Agri. Laborers 945 0.20 - 0.25 Lac
TM
PDF Editor

Table 2.12 (b) Major activities (Off Farm)
Name of activity Households/ individuals Average annual income from the
Artisans 10 25000-30000 Carpenter 25 35000-40000 Blacksmith 15 50000-60000 Leather Craft 5 40000-45000 Porter 20 Mason 50 60000-70000 Others specify (Cycle Repair ,STD,Craft etc)
115 50000-60000
The efforts for increase in income through off farm activities will be made under livelihood component through assistance to SHG or individuals
Table 2.13 ( a ) Status of Existing SHG
S. No
Name of Gram
Panchyat Name of SHG Members Activity
involved Monthly income
Fund available
Assistance available
Source of assistance
Training received
1. pkax 1- Lo;a lgk;rk leqg pkax
20 2000
2. fprkM+ 1- Lo;a lgk;rk leqg fprkM+
27 2700
3. uku.kk 1- efgyk Lo;a lgk;rk leqg uku.kk
32 3200
4. izrkix<+ 1- Lo;a lgk;rk leqg izrkix<+
20 2000
5. jkrfM+;k 1- efgykLo;a lgk;rk leqg jkrfM+;k
20 2000
6. jsyM+k 1- Lo;a lgk;rk leqg nsoyh [kqnZ
20 2000
2- Lo;a lgk;rk leqg dk.kspk
20 2000
3- Lo;a lgk;rk leqg jsyM+k
20 2000
TM
PDF Editor

The table indicates existence of number of groups in the area also these need to be strengthened through trainings and financial assistance
II. Technical Features Table 2.14 Ground Water
S. No Source No. Functional
depth Dry Area irrigated Water availability(days)
i) Dug wells 365 80-90 feet 42 245 6-8 month ii) Shallow tube wells 55 150-220 Feet 17 0 10-12 month
iii) Dug well with Pumping sets 150 120-200 Feet 5 455 8-10 month
iv) Deep Tube Wells 125 250-300 feet 7 122 8-10 month Total 545 71 822
Table 2.15 Availability of drinking water
S. No.
Name of the village
Drinking water requirement
Litre/day
Present availability of drinking water
Litre/day
No. of drinking water
sources available
No. functional
No. requires repairs
No. defunct
Total Village
15039x30= 767790/-day 667585/-day 90 71 19 -
Table 2.16 Water Use efficiency
Name of major crop
Area (Hectare)
through water saving devices(Drip/Sprinklers)
through water conserving agronomic practices#
Any other (pl. specify) Total
Cotton Drip Irrigation 40 PVC Pipe 50
• The tables above indicate need for judicious use of available Water. • Encouraging optimum use of water through installation of sprinklers on every operational wells
Table 2.17 Slope details.
Slope of Watershed
S. No. Slope percentage Area in hectares
1 0 to 3% 4361 Ha 2 3 to 8% 0 3 8 to 25% 0 4 > 25% 0
TM
PDF Editor

As most of the area has slope less than 3% construction of contour bunds can solve the
problem of water erosion in agriculture fields and protect washing of top soil and
manures/fertilisers.
Table 2.18 Water Budgeting
Good Catchment – Normally a funnel shaped catchment in hilly terrain with less vegetation.
Average Catchment – Catchment in the plains where there is no dense growth of vegetation.
Bad Catchment – Catchment with dense growth of vegetation & highly permeable top soil & sub soil.
Total available runoff(cum) use Strangest table Rai n fall 568.90 mm
Type of Catchment Area in ha. Yield of runoff from catchment per ha.(cum.) use Strangest table
Total Runoff in cum
Good 1209 997.30 1205735
Average 755 748.00 564740
Bad 2397 498.60 1195144
Total 4361 2965619
Runoff trapped in existing structures S. No. Name No. Storage Capacity (cum)
i) WHS(earthen) 9 8500 ii) Khadin/Talab 7 65000 iii) Farm Ponds - iv) Tanka - v) Anicuts 14 23500 Total 30 97000
Runoff to be Trapped in proposed structures:
S. No. Name No. Storage Capacity (cum) i) WHS (earthen) 29 5800 ii) Khadin/Talab 7 10500 iii) Farm Ponds 9 4500 iv) Masonry Check Dam 0 0 v) Medium Masonry Structure 14 19200 Total 59 40000
TM
PDF Editor
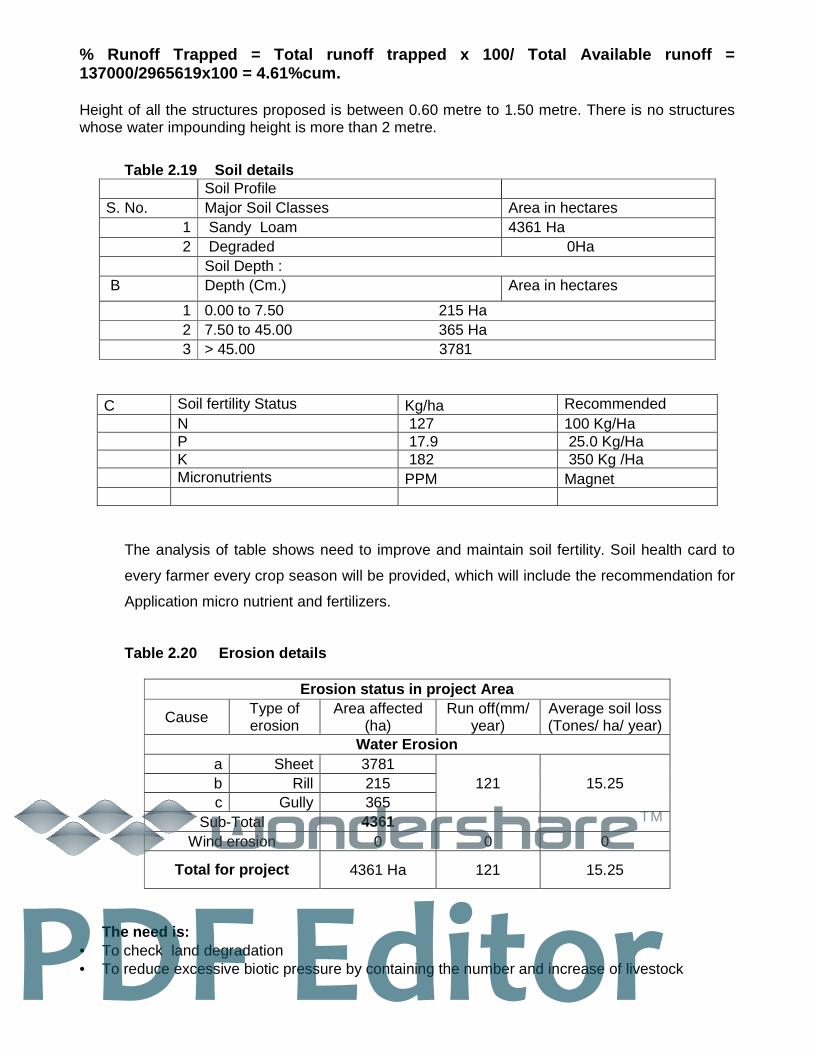
% Runoff Trapped = Total runoff trapped x 100/ Tota l Available runoff = 137000/2965619x100 = 4.61%cum. Height of all the structures proposed is between 0.60 metre to 1.50 metre. There is no structures whose water impounding height is more than 2 metre.
Table 2.19 Soil details Soil Profile S. No. Major Soil Classes Area in hectares
1 Sandy Loam 4361 Ha 2 Degraded 0Ha
Soil Depth : B Depth (Cm.) Area in hectares
1 0.00 to 7.50 215 Ha 2 7.50 to 45.00 365 Ha 3 > 45.00 3781
C Soil fertility Status Kg/ha Recommended N 127 100 Kg/Ha P 17.9 25.0 Kg/Ha K 182 350 Kg /Ha Micronutrients PPM Magnet
The analysis of table shows need to improve and maintain soil fertility. Soil health card to
every farmer every crop season will be provided, which will include the recommendation for
Application micro nutrient and fertilizers.
Table 2.20 Erosion details
Erosion status in project Area
Cause Type of erosion
Area affected (ha)
Run off(mm/ year)
Average soil loss (Tones/ ha/ year)
Water Erosion a Sheet 3781
121 15.25 b Rill 215 c Gully 365
Sub-Total 4361 Wind erosion 0 0 0
Total for project 4361 Ha 121 15.25
The need is:
• To check land degradation • To reduce excessive biotic pressure by containing the number and increase of livestock
TM
PDF Editor

• To check cultivation on sloping lands without adequate precautions of soil and water conservation measures
• To discourage cultivation along susceptible nallah beds • To check Faulty agriculture techniques • To check Uncontrolled grazing and developed cattle tracks • To check Deforestation of steep slopes
CHAPTER - III Proposed Development Plan:
The Activities are indicative addition /deletion in activities will be as per local conditions
A) Preparatory phase activities Capacity Building T rainings and EPA
The IEC activities like Kalajathas, Group meetings, door to door campaign, slogans and
wall writings etc. were carried out in all the habitations of 12/1,2,3,4&5 Micro Watershed.
A series of meetings were conducted with GP members, community and discussed
about the implementation of IWMP programme. User groups were also formed.
Gram Sabah were conducted for approval of EPA (Village), for selecting the watershed
committee and approval of DPR.
S. No Name of the Gram Panchayat Date on which Gram Sabah approved EPA
1 CHANG 20–03–2013 2 CHITAR 3 GIRI 4 NANANA 28–02–2012 5 PRATAPGARH 6 RATDIYA 27–02–2012 7 RELRA 12–08–2013
Rs. In Lac
S. No.
Names of Village/G.P.
Amount earmarked
for EPA
Entry Point Activities planned Drinking Water,
Solar Light
Estimated cost
Expenditure incurred (up
to 2013) Balance Expected
outcome
1 Chang 3.114 5 0.195 0.975 2.139 2 Chitar 3.21 6 0.195 1.17 2.04 3 Giri 1.848 0.195 0 1.848 4 Nanana 1.268 6 0.195 1.17 0.098 5 Pratapura 7.108 6 0.195 1.17 5.938 6 Ratdiya 8.256 7 0.195 2.72 5.536 7 Relra 1.362 6 0.195 1.17 0.192
Total 26.166 8.375 17.791
TM
PDF Editor

The PRA exercise was carried out in all the villages on the dates shown below:
S. No Name of the Village Date on which PRA conducted
1 CHANG 20–05–2013
2 CHITAR 20–05–2013
3 DEOLI KHURD 23–05–2013
4 GIRI 23–05–2013
5 KANECHA UDAWATAN 24–05–2013
6 KANPURA 21–05–2013
7 LAKHINA PANABAORI 22–05–2013
8 NAHARPURA 28–05–2013
9 NANANA 24–05–2013
10 PRATAPGARH 27–05–2013
11 RATDIYA 25–05–2013
12 SAILPURA 27–05–2013
Transact walk were carried out involving the community for Social mapping,
Resource mapping. Detailed discussions and deliberations with all the primary stakeholders
were carried out.
Socio-economic survey was carried out during 20–05–2013 to 28–05–2013 (dates)
period covering all the households and primary data on demography, Land holdings,
Employment status, Community activities etc. was collected as mentioned in chapter 2.
TM
PDF Editor

. CAPACITY BUILDING
Table- List of approved Training Institutes@ for Capacity Building in the project area
1 2 3 4 5 6 7 8
S. No.
Name of Stake
holders Name of the Training
Institute
Full Address
with contact no., website &
Name &
Designation of the
Head of Institute
Type of Institute
Area(s) of speciali-
zation$
Accredita-tion
details
1 PIAs IGPRS JAIPUR Director
IGPRS
GOR W/S
Management
NIRD JAIPUR hksolanki@nir
d.gov.in
Course coordinator
choupal
NIRD Jaipur
GOI GIS Base
2 WDTs PTC AJMER Training co-
ordinator PTC
GOR W/S development
works
IGPRS JAIPUR W/S development
works
State Agri. Management
Training Institute
JAIPUR Director-
SAMI Jaipur
W/S
development works
3 UGs/SHGs/WCs/
GPs/Community Pali dairy Pali M.D. Pali GOR W/S development
works
KVK pali Pali Seior Scientist
KVK
Research Institutes
W/S development
works
Research station
Pali Seior Scientist
GOR W/S development
works
Rajigandi seva Kendra
At Gram Panchayat
GOR W/S development
works
4 PM/SLNA NIRD Hydrabad GOI
5
# Central govt. Dept./ State govt. Dept./ Autonomous Body/ Research Institutes/ Universities/ Others (pl. specify)
$ Capacity Building/ Agriculture/ Horticulture/ Animal Husbandry/ Pisciculture/ Remote Sensing/ Water conservation/ Ground water/ Forestry/ livelihoods/
entrepreneurship development/ others (pl. specify)
@ The training institutes must full fill the conditions mentioned in the operations
guidelines.
TM
PDF Editor
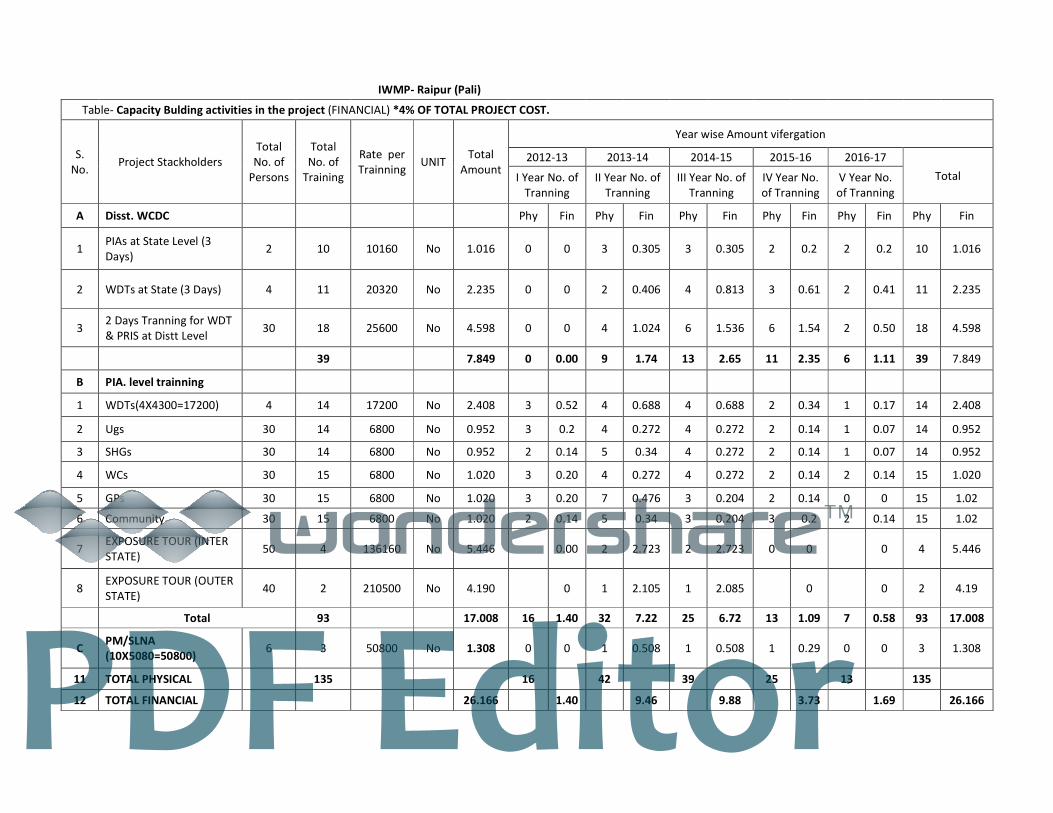
IWMP- Raipur (Pali)
Table- Capacity Bulding activities in the project (FINANCIAL) *4% OF TOTAL PROJECT COST.
S.
No. Project Stackholders
Total
No. of
Persons
Total
No. of
Training
Rate per
Trainning UNIT
Total
Amount
Year wise Amount vifergation
2012-13 2013-14 2014-15 2015-16 2016-17
Total I Year No. of
Tranning
II Year No. of
Tranning
III Year No. of
Tranning
IV Year No.
of Tranning
V Year No.
of Tranning
A Disst. WCDC Phy Fin Phy Fin Phy Fin Phy Fin Phy Fin Phy Fin
1 PIAs at State Level (3
Days) 2 10 10160 No 1.016 0 0 3 0.305 3 0.305 2 0.2 2 0.2 10 1.016
2 WDTs at State (3 Days) 4 11 20320 No 2.235 0 0 2 0.406 4 0.813 3 0.61 2 0.41 11 2.235
3 2 Days Tranning for WDT
& PRIS at Distt Level 30 18 25600 No 4.598 0 0 4 1.024 6 1.536 6 1.54 2 0.50 18 4.598
39 7.849 0 0.00 9 1.74 13 2.65 11 2.35 6 1.11 39 7.849
B PIA. level trainning
1 WDTs(4X4300=17200) 4 14 17200 No 2.408 3 0.52 4 0.688 4 0.688 2 0.34 1 0.17 14 2.408
2 Ugs 30 14 6800 No 0.952 3 0.2 4 0.272 4 0.272 2 0.14 1 0.07 14 0.952
3 SHGs 30 14 6800 No 0.952 2 0.14 5 0.34 4 0.272 2 0.14 1 0.07 14 0.952
4 WCs 30 15 6800 No 1.020 3 0.20 4 0.272 4 0.272 2 0.14 2 0.14 15 1.020
5 GPs 30 15 6800 No 1.020 3 0.20 7 0.476 3 0.204 2 0.14 0 0 15 1.02
6 Community 30 15 6800 No 1.020 2 0.14 5 0.34 3 0.204 3 0.2 2 0.14 15 1.02
7 EXPOSURE TOUR (INTER
STATE) 50 4 136160 No 5.446 0.00 2 2.723 2 2.723 0 0 0 4 5.446
8 EXPOSURE TOUR (OUTER
STATE) 40 2 210500 No 4.190 0 1 2.105 1 2.085 0 0 2 4.19
Total 93 17.008 16 1.40 32 7.22 25 6.72 13 1.09 7 0.58 93 17.008
C PM/SLNA
(10X5080=50800) 6 3 50800 No 1.308 0 0 1 0.508 1 0.508 1 0.29 0 0 3 1.308
11 TOTAL PHYSICAL 135 16 42 39 25 13 135
12 TOTAL FINANCIAL 26.166 1.40 9.46 9.88 3.73 1.69 26.166
TM
PDF Editor

Table- Capacity Bulding activities in the project (PHYSICAL) *4% OF TOTAL PROJECT COST.
1 2 3 4 5 6
S.
No. Project Stackholders
Total
No. of
Persons
Total
No. of
Training
Rate per
Trainning
No
of
Days
of
Trai.
Total
Am
No. of Person to be trained during project period No. of Training to be organized during project
period
No. of Person days to be trained during project
period
2012-
13
2013-
14
2014-
15
2015-
16
2016-
17 Total
2012-
13
2013-
14
2014-
15
2015-
16
2016-
17 Total
2012-
13
2013-
14
2014-
15
2015-
16
2016-
17 Total
I Year II
Year
III
Year
IV
Year
V
Year I Year
II
Year
III
Year
IV
Year
V
Year I Year
II
Year
III
Year
IV
Year
V
Year
A WCDC
1 PIAs at State Level (3
Days) 2 10 10160 3 1.016 0 6 6 4 4 20 0 3 3 2 2 10 0 18 18 12 12 60
2 WDTs at State (3
Days) 4 11 20320 3 2.235 0 8 16 12 8 44 0 2 4 3 2 11 0 24 48 36 24 132
3
2 Days Tranning for
WDT & PRIS at Distt
Level
30 18 25600 2 4.598 0 120 180 180 60 540 0 4 6 6 2 18 0 240 360 360 120 1080
39 7.849 0 134 202 196 72 604 0 9 13 11 6 39 0 282 426 408 156 1272
B PIA
1 WDTs(4X4300=17200) 4 14 17200 4 2.408 12 16 16 8 4 56 3 4 4 2 1 14 48 64 64 32 16 224
2 Ugs 30 14 6800 1 0.952 90 120 120 60 30 420 3 4 4 2 1 14 90 120 120 60 30 420
3 SHGs 30 14 6800 1 0.952 60 150 120 60 30 420 2 5 4 2 1 14 60 150 120 60 30 420
4 WCs 30 15 6800 1 1.020 90 120 120 60 60 450 3 4 4 2 2 15 90 120 120 60 60 450
5 GPs 30 15 6800 1 1.020 90 210 90 60 0 450 3 7 3 2 0 15 90 210 90 60 0 450
6 Community 30 15 6800 1 1.020 60 150 90 90 60 450 2 5 3 3 2 15 60 150 90 90 60 450
7 EXPOSURE TOUR
(INTER STATE) 50 4 136160 6 5.446 0 100 100 0 0 200 2 2 0 4 0 600 600 0 0 1200
8 EXPOSURE TOUR
(OUTER STATE) 40 2 210500 6 4.190 0 40 40 0 0 80 1 1 2 0 240 240 0 0 480
Total 93 17.00 402 906 696 338 184 2526 16 32 25 13 7 93 438 1654 1444 362 196 4094
C PM/SLNA
(10X5080=50800) 6 3 50800 3 1.3080 0 6 6 6 0 18 0 1 1 1 0 3 0 18 18 18 0 54
11 TOTAL PHYSICAL 135 26.166 402 1046 904 540 256 3148 16 42 39 25 13 135 438 1954 1888 788 352 5420
TM
PDF Editor

Table-, Education & Communication (IEC) activities in the project area (1% of total Project cost.)
1 2 3 4 5
S. No. Activity
Executing Agency
Allocation out of 1% of total Project
cost
Allocation in lacs 2012-
13 2013-
14 2014-
15 2015-
16 2016-
17 Total
I year II year III year IV year
V year
1 tyxzg.k {ks= xfrfof/k;kas dks n’kkZrk gqvk POP/ CLAY / WOOD /
PLASTIC ls cuk gqvk ekWMyA0-15 P.I.A. 0.981 0.490 0.491 0.981
2 MhLiys cksMZs@IysxDlh cksMZ@
3 okWyisfUVax&tyxzg.k xfrfof/k;ksa] y{;ks o izkfIr vkfn dks n’kkZrh gqbZA0-05
P.I.A. 0.327 0.327 0.327
4 tyxzg.k fodkl laca/kh eqfnzr iEiysVl@fyQ ysVl@pkVZ@iksLVj@vkfn0-05
P.I.A. 0.328 0.328 0.328
5 Ukkjk ys[ku 0-20 P.I.A. 1.308 1.209 0.099 1.308
6
lQyrk dh dgkuh;ksa dh ohfM;ksaxzkQh@ QksVksxzkQh @ y?kqfQYe ,oa d`"kdks ls lk{kjkrdkj@okrkZ A 0-20
P.I.A. 1.308 0.196 1.112 1.308
7 lkaLd`frd R;kSgkj @ esys vkfn ds volj ij iznZ’kuh@ uqDdM+ ukVd@ dViqryh izn’kZu 0-15
P.I.A. 0.981 0.490 0.491 0.981
8
jkf= xks"Bh @ Hkw laj{k.k lIrkg@ psruk jSyh (in ;k=k) @ tyxzg.k fodkl dk lans’k nsus okys lkaLd`frd dk;ZØe@ d`"kd fnol dk vk;kstu ,oa {ks= Hkze.k fnol dk
P.I.A. 1.308 0.784 0.130 0.394 1.308
TM
PDF Editor

vk;kstu bR;kfn@ 0-20
dqy 6.541 1.209 1.701 1.111 1.408 1.112 6.541
TM
PDF Editor

WAPCOS LIMITED GURGAON was assigned the work of preparing various
thematic layers using Cartosat-1 and LISS-3 imageries for Creation , development and
management of geo-spatial database depicting present conditions of land (terrain), water
and vegetation with respect to watershed under different ownerships at village level
Various thematic layers provided by WAPCOS LIMITED GURGAON are :
• Delineation of Macro/Micro watershed boundaries. • Digitised Khasra maps of the villages falling in project area. • Network of Drainage lines, existing water bodies, falling in the project area. • Base maps (transport network, village/boundaries, and settlements). • Land Use / Land cover map. • Contours at 1 meter interval, slope map
Based on GIS thematic layers, Field visits , PRA and analysis of benchmark data (as
discussed in chapter 2) final Treatment plan on revenue map for implementation has been
framed. Thus each intervention identified has been marked on revenue map (map enclosed
in DPR as annexure VIII).The GIS based intervention map, PRA based intervention map are
annexed as VIII.
B)Livelihood Action Plan (LAP):
An awareness programme has been undertaken at Gram Sabah for communication &
sensitization of the target beneficiaries. Livelihood Action Plan is a pre requisite for availing the
funds under the livelihood component. LAP has been prepared by the PIA in consultation with
WDT, WC & the members of SHG,SC/ST, women, landless/ asset less households. Details of
funds available & their utilisation is as under :
(i) Total project cost Rs.654.15Lacs.
(ii) Funds available under livelihood component is 9% of total project cost= Rs. 58.574 Lac.
(a) Seed money for SHGs as revolving fund = Rs. 42. 125 Lac.
(minimum 60% of livelihood component)
- - No. Of SHG to be formed--169-Nos.
--- No of persons (members) in SHGs—1690 Nos.
(b) Seed money for enterprising individuals = Rs. 4 .75 Lac.
(minimum 10% of livelihood component)
-- No of persons identified as enterprising individuals 19 Nos.
TM
PDF Editor

List of persons & Proposed Activities.
S.
No
Watershed Committee No. of Persons Activity Proposed
1 Chang 1 1. Carpenter
2. Mason
3. Sewing / Knitting
2 Chitar 1
3 Giri 1
4 Nanana 1
5 Pratapura 1
6 Ratdiya 1
7 Relra 1
(c) Funds for Enterprising SHG/Federations of SHG
(Maximum 30% of livelihood activities) = Rs. – 12.0 0Lac
The funding for major livelihood activities will enable the enterprising SHGs/SHG federation
to avail a composite loan for undertaking major livelihood activities or to upscale activities as
recommended by the WC & approved by WCDC in consultation with line departments.
Details of enterprising SHG/federation is given below :
S.
No.
No. of SHG/ SHG
federation
Project Name Project Cost in
Lac
Grant in aid 50% of
project cost or 2 Lac
whichever is less
Bank
Loan
1 6 Dairy 12
2
Total 12
* Details of project activities can be prepared in coming years after formation of SHG
federation or as the case may be.
TM
PDF Editor
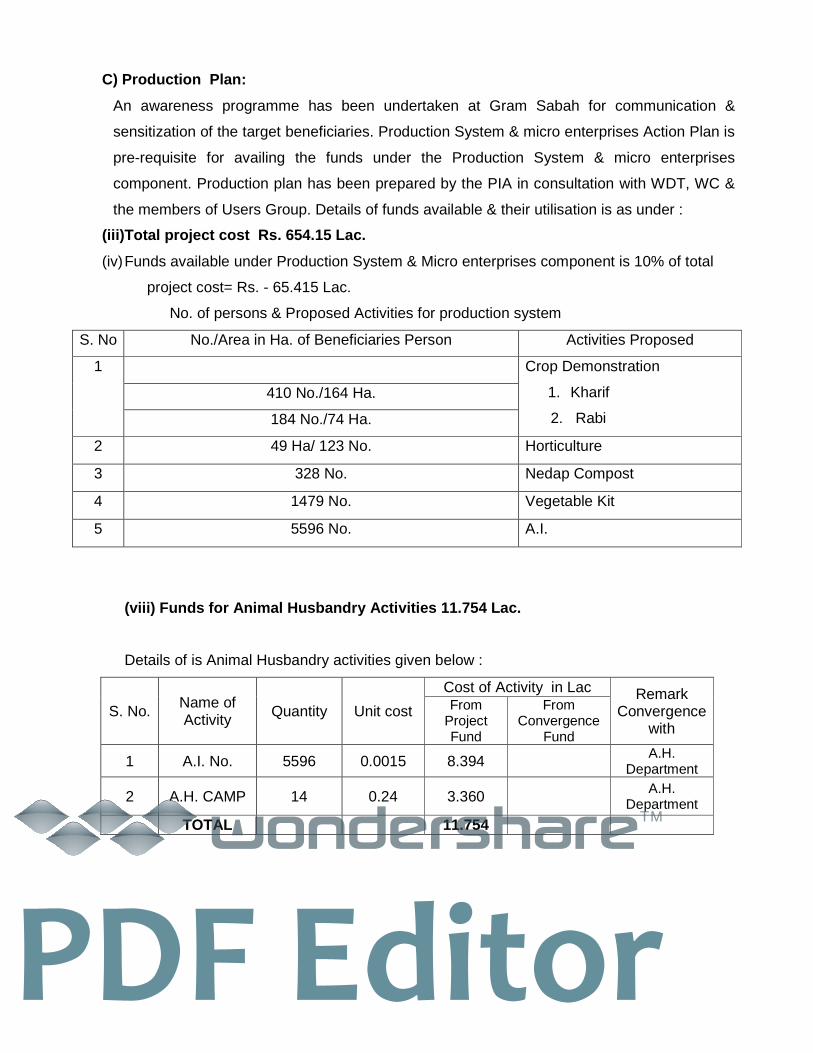
C) Production Plan:
An awareness programme has been undertaken at Gram Sabah for communication &
sensitization of the target beneficiaries. Production System & micro enterprises Action Plan is
pre-requisite for availing the funds under the Production System & micro enterprises
component. Production plan has been prepared by the PIA in consultation with WDT, WC &
the members of Users Group. Details of funds available & their utilisation is as under :
(iii)Total project cost Rs. 654.15 Lac.
(iv) Funds available under Production System & Micro enterprises component is 10% of total
project cost= Rs. - 65.415 Lac.
No. of persons & Proposed Activities for production system
S. No No./Area in Ha. of Beneficiaries Person Activities Proposed
1
Crop Demonstration
1. Kharif
2. Rabi
410 No./164 Ha.
184 No./74 Ha.
2 49 Ha/ 123 No. Horticulture
3 328 No. Nedap Compost
4 1479 No. Vegetable Kit
5 5596 No. A.I.
(viii) Funds for Animal Husbandry Activities 11.754 Lac.
Details of is Animal Husbandry activities given below :
S. No. Name of Activity Quantity Unit cost
Cost of Activity in Lac Remark Convergence
with
From Project Fund
From Convergence
Fund
1 A.I. No. 5596 0.0015 8.394 A.H. Department
2 A.H. CAMP 14 0.24 3.360 A.H. Department
TOTAL 11.754
TM
PDF Editor

Awareness Programme
-Slogan Wall Painting,
Scientific Animal Husbandry Practices ; Seminars / Debates / Pamphlet distribution/ Stickers/ Chetna Rally
Broadcasting / Telecasting Film Show
Visit- intra/ inter/ out of State/ Abroad
Fortnightly Meetings with Livestock keeper to discuss and decide all breedable females to be covered. Creation Of Disease Free Zone: Livestock’s health c overage
Establishment of Pashudhan Seva Kendra (PSK) (Convergence with peer department)
Deworming to reduce worm load and enhance disease resistance. (Convergence with peer department)
Distribution of mineral mixture. (Convergence with peer department)
Free of Cost Vaccination in IWMP area Livestock for H.S., B.Q., F.M.D., PPR, ETV and Sheep Pox.
Ensure Hygenic measures to check Zonosis.(DAH/ IWMP)
Construction of Animal Sheds with Manger and Portab le Manger With accessories
Provision of Cattle Water Troughs.
Infertility Management: To ensure Livestock’s Produ ctivity
Expansion of AI Coverage/ reduction in no.of infertile females.
PCPD+ COMBAT INFERTILITY+ CAMPS INFERTILITY RLDB+ CAMPS INFERTILITY SC COMPONENT
Breed Improvment: To ensure Livestock’s Productivity enhancement
A.I. (Convergence with peer department)
Incentive based Mass Castration at Door Step of Scrub Bulls to Check ND Recycling.
Registration of bulls (Convergence with peer department)
Bull / Buck Distribution for NS-.Gir, Murrah And Sirohi /Jamunapari Breed Bulls/ Bucks Should Be Distributed For 3yrs 6 (3 In Each Iwmp Area, Where Ever A.I. Facility Is Not Available Round’s O Clock. On 100% Subsidized Rate To WC.
Financial Incentive to the Inseminator for Calf Borns.
Convergence with peer Department/DAH/Agriculture/ATMA/ Board/ Trust/ Goseva
An Assistance to control Malnutrition: Protein Supplementation
Feed & fodder production enhancement.
TM
PDF Editor

: ANNUAL ACTION PLAN :
PIA will prepare annual action plan in the month of January indicating outgoing
liabilities as well as new projects which they wish to take during next financial years & will
submit to PM (WCDC). These plans will be placed for approval at P.S. (Standing
Committee of Production and Agriculture) & Z.P. (Standing Committee of Production) level
every year. While preparing Annual Action Plan (AAP) if rates of labour or material in DPR
increased or decreased changed rates will be applicable for preparing AAP & the effect of
same can be met by converging the remaining works with other schemes.
TM
PDF Editor

Proposed Development Plan
Signatures Project Manager, WCDC
Distt. – Pali (Raj.)
TM
PDF Editor

CHAPTER - I V Activity wise Total Abstract of cost
Activity Unit Quantity Unit cost
Total cost
Cost from Project Fund Quantity
Unit cost
Convergence Fund
Beneficiary Contribution Labour Material TOTAL
tyxzg.k fodkl dk;Z pj.k ( 56%) d`f"k Hkwfe dk;Z ¼flafpr½ Earthen Bunding Ha 1449 0.0842 122.035 118.485 3.550 122.035 0 0.1078 0.000 9.763
Pipe spilway (Weste Weir)
No 292 0.0470 13.724 3.697 10.027 13.724 0 0.0500 0.000 1.098
KHADIN No 4 4.0700 51.700 13.440 2.840 16.280 7 5.0600 35.420 1.302
Farm pond No 9 1.3500 27.810 11.703 0.447 12.150 9 1.7400 15.660 0.972
Total 215.269 147.325 16.864 164.189 51.080 13.135 ¼vd`f"k Hkwfe½ pjkxkg fodkl Ha 120 0.6966 83.587 72.316 11.272 83.587 0 0.000
NADI IN P.D BLOCK No 3 4.0700 17.270 10.080 2.130 12.210 1 5.0600 5.060
TANKA IN P.D BLOCK No 6 1.4400 10.490 3.000 5.640 8.640 1 1.8500 1.850
Open Contour Trench Ha 198 0.0907 41.359 17.382 0.576 17.959 200 0.1170 23.400 pjkxkg fodkl (Private Farmer) Ha 164 0.0842 16.400 13.410 0.402 13.812 24 0.1078 2.587 0.801
Total 169.105 116.188 20.020 136.208 32.8 97 0.80 ukyk mipkj dk;Z
M.M.S.(Anicut) No 3 4.82000 25.420 6.960 7.500 14.460 2 5.4800 10.960
M.M.S.(Anicut 5m) No 11 3.800 54.550 17.517 24.283 41.800 3 4.2500 12.750
L.S.C.D No 81 0.058 17.856 1.900 2.832 4.732 207 0.0634 13.124
Gali plug Ha 29 0.110 4.450 3.090 0.100 3.190 9 0.1400 1.260
Gabion Structure No 26 0.067 1.747 0.826 0.922 1.747 0 0.000
Total 104.023 30.293 35.637 65.929 38.094 0.00
GRAND TOTAL 488.397 293.806 72.520 366.326 122.071 13.936
Livelihood System ( 9 %)
Revolving Fund to SHG (60 % minimum) No 169 0.25000 42.125 0 42.125 42.125
Revolving Fund to enterprising individual (10 % maximum )
No 19 0.25000 4.750 0 4.750 4.750
Grant in aid to enterprising SHG or Federation of SHGs individual (30 % maximum )
No 6 2.00000 36.000 0 12.000 12.000 12 2.0000 24.000
Total 82.875 0.000 58.875 58.875 24.000 Production System (10%)
A.I. No 5596 0.0015 8.994 0 8.394 8.394 400 0.0015 0.600 1.679 A.H. CAMP No 14 0.24 3.360 0 3.360 3.360 [kjhQ No 410 8.425 0 8.425 8.425 1.685 jch No 184 4.744 0 4.744 4.744 0.949 Qynkj ikS/kkjksi.k Ha 92 0.24 51.799 13.815 8.289 22.104 59 0.5033 29.695 4.421 usMsi dEiksLV No 328 0.02 6.560 0 6.560 6.560 1.312
Kitchen garden KIT No 1479 0.008 11.832 0 11.832 11.832 2.366
Total 95.714 13.815 51.604 65.419 30.295 12.412
GRAND TOTAL 666.99 307.62 183.00 490.62 1 76.37 26.35
*Tentative and will vary during execution according to beneficiary
Signatures Signatures PIA P.S. Raipur Project Manager, WCDC
Distt. - PALI
TM
PDF Editor

CHAPTER – V Annual Action Plan : The project period can vary from 4 to 7 years and accordingly the table given below be prepared. Also the activities mentioned below are indicative and can vary from project to project. Also this if PIA feels necessary to make it GP Wise it can add pages. Through Project Fund
(A) Preparatory phase activities capacity building trai nings & EPA
Activity Unit Quantity Unit Cost
Total cost
1st year 2nd year 3rd year 4th year 5th year 6th year Total Phy Fin Phy Fin Phy Fin Phy Fin Phy Fin Phy Fin Phy Fin
Admn. 65.415 3.271 9.812 20.933 18.316 13.084 65.416
Monitoring 6.542 0.000 1.308 2.617 0.000 2.617 6.542
Evaluation 6.542 0.000 1.962 0.000 2.290 2.290 6.542
EPA 26.166 26.166 0.000 0.000 0.000 0.000 26.166
I & CB 32.708 3.271 16.354 10.793 2.290 0.000 32.708
DPR 6.542 6.542 0.000 0.000 0.000 0.000 6.542
Total (A) 22% 143.91 39.250 29.436 34.343 22.896 17.991 143.92
(B) Natural resource management(56%)
Conservation measures for arable land(private land )
Earthen Bunding Ha 1449 8422 122.035 512 43.121 646 54.406 291 24.508 1449 122.035 Pipe spilway(Weste Weir) No
No 292 4700 13.724 104 4.888 131 6.157 57 2.679 292 13.724
Khadin No 4 407000 16.280 2 8.140 2 8.140 0 0.000 4 16.280
Farm pond No 9 135000 12.150 2 2.700 3.5 4.725 3.5 4.725 9 12.150
pkjkxkg fodkl Pasture Development Ha. Ha 120 69656 83.587 43 29.952 53 36.918 24 16.717 120 83.587
NADI IN P.D BLOCK No 3 407000 12.210 1 4.070 1.5 6.105 1 2.035 3 12.210
TANKA IN P.D BLOCK 6 144000 8.640 2 2.880 2.0 2.880 2 2.880 6 8.640
Open Contour Trench Ha Ha 198 9070 17.959 66 5.986 98 8.889 34 3.084 198 17.959
Pasture Development (privete Farmer)
Ha 164 8422 13.812 48 4.043 79 6.653 37 3.116 164 13.812
TM
PDF Editor

Drainage line treatment
M.M.S.(Anicut) No 3 482000 14.460 1.5 7.230 1.5 7.230 0 0.000 3 14.460
M.M.S.(Anicut 5m) 11 380000 41.800 4.0 15.200 4.5 17.100 2.5 9.500 11 41.800 L.S.C.D No 81 5842 4.732 28 1.636 35.5 2.074 17.5 1.022 81 4.732
Gali plug Ha 29 11000 3.190 4 0.440 14 1.540 11 1.210 29 3.190
Gabion Structure No 26 6721 1.747 9 0.605 11 0.739 6 0.403 26 1.747
Total (B) 366.326 130.890 163.556 71.880 366.326
( C ) Production System (10%)
Production measures for arable land Qynkj ikS/kkjksi.k dk;Z
A.I No 5596 150 8.394 2410 3.615 1486 2.229 868 1.302 832 1.248 5596 8.394
A.H. CAMP No 14 24000 3.360 3 0.720 3.5 0.840 4 0.960 3.5 0.840 14 3.360
[kjhQ No 410 8.425 85 1.753 128 2.628 125 2.572 72 1.473 410 8.426
jch No 184 4.743 34 0.879 57 1.454 58 1.522 35 0.889 184 4.744
Qynkj ikS/kkjksi.k Ha 92 24000 22.104 9 2.255 38 9.022 41 9.924 4 0.902 92 22.104
usMsi dEiksLV No 328 2000 6.560 54 1.080 136 2.720 109 2.180 29 0.580 328 6.560
Inovative Works 0.000 0.000
Vegitable Kit No 1479 800 11.832 358 2.864 507 4.056 526 4.208 89 0.712 1480 11.840
Livelihood System 9% Lo;a lgk;rk lewg (R/F.) No 169 25000 42.125 24 6.000 47 11.750 51 12.750 47.000 11.625 169 42.125
R.F To Indidual Enterprencurs No 19 25000 4.750 3 0.750 9 2.250 4 1.000 3.000 0.750 19 4.750
Grant in aid to Federation No 6 200000 12.000 0 0.000 3 6.000 3 6.000 0.000 0.000 6 12.000
Total (C) 124.29 19.916 42.949 42.418 19.019 124.30
(D) Consolidation 19.6245 19.625 19.625
Grand Total 654.16 39.250 180.243 240.848 156.819 654.17
TM
PDF Editor

Through Convergance Fund
(A) Preparatory phase activities capacity building trai nings & EPA
Activity Unit Quantity Unit Cost
Total cost
1st year 2nd year 3rd year 4th year 5th year 6th ye ar Total Phy Fin Phy Fin Phy Fin Phy Fin Phy Fin Phy Fin Phy Fin
(B) Natural resource management(56%)
Conservation measures for arable land(private land ) Khadin No 7 506000 35.420 2 10.626 3 14.168 2 10.626 7 35.420
Farm pond No 9 174000 15.660 3 4.698 3 6.264 3 4.698 9 15.660 pkjkxkg fodkl NADI IN P.D BLOCK No 1 506000 5.060 0 1.518 1.0 2.024 0 1.518 1 5.060 TANKA IN P.D BLOCK 1 185000 1.850 0 0.555 1.0 0.740 0 0.555 1 1.850 Open Contour Trench Ha 200 11700 23.400 60 7.020 80 9.360 60 7.020 200 23.400
Pasture Development (privete Farmer) Ha 24 10780 2.587 7 0.776 10 1.035 7 0.776 24 2.587
Drainage line treatment
M.M.S.(Anicut) No 2 548000 10.960 1 3.288 1 4.384 1 3.288 2 10.960
M.M.S.(Anicut 5m) 3 425000 12.750 1 3.825 1 5.100 1 3.825 3 12.750
L.S.C.D No 207 6340 13.124 62 3.937 83 5.250 62 3.937 207 13.124
Gali plug Ha 9 14000 1.260 3 0.378 4 0.504 3 0.378 9 1.260
Total (B) 122.071 36.621 48.828 36.621 122.071
( C ) Production System (10%)
Production measures for arable land
Qynkj ikS/kkjksi.k dk;Z
A.I. No 400 150 0.600 100 0.150 100 0.150 100 0.150 100 0.150 400 0.600 Qynkj ikS/kkjksi.k Ha 59 50330 29.695 15 7.550 15 7.550 15 7.550 14 7.046 59 29.695
Livelihood System 9%
Grant in aid to Federation
No 12 200000 24.000 3 6.000 3 6.000 3 6.000 3.000 6.000 12 24.000
Total (C) 54.29 13.700 13.700 13.700 13.196 54.29
Grand Total 176.37 50.32 62.53 50.32 13.20 176.37
Signatures Signatures PIA P.S. Raipur Project Manager, WCDC Distt. - PALI
TM
PDF Editor

CHAPTER – VI EXPECTED OUT COMES 1 2 3 4 5 6
S. No. Item Unit of measurement
Pre-project Status
Expected Post -project Status Remarks
1 Status of water table (Depth to Ground water level)
Meters 15.00 13.50
2 Ground water structures repaired/ rejuvenated
No. - -
3 Quality of drinking water Description N.A N.A 4 Availability of drinking water Description 667585lit/
day 767840Lit/Day
5 Change in irrigated Area Ha 948 1070 6 Change in cropping/ land use pattern Description 7 Area under agricultural crop Ha 2397 2640 I Area under single crop Ha 1785 1910 Ii Area under double crop Ha 900 1070 Iii Area under multiple crop Ha 0 8 Change in cultivated Area Ha
9 yield of major crops of area
Yield of Bajra q/ha 16.23 17.00 Yield of Wheat q/ha 27.40 28.37 Yield of Gram q/ha 8.14 8.75
Yield of Mustard q/ha 10.15 11.00 10 production of major crops of
area
Production of Bajra ton 907.80 1050.00 Production of Wheat ton 784.00 901.00 Production of Gram ton 98.32 120.00
Production of Mustard ton 312.50 467.50 11 Area under vegetation Ha 10 50 12 Area under horticulture Ha 11 271 13 Area under fuel Ha 5 10 14 Area under Fodder Ha 2397 3750 15 Fodder production Q 109660 130850 16 Milk production Litres/day 18890 25000 17 SHGs Active No. 25 194 18 No. of enterprising individuals No. 16 35 19 Income Rs.in la 0.124 0.20 20 Migration No. 2810 2250 21 SHG Federations formed No. 15
TM
PDF Editor

TM
PDF Editor

Critical Assumption
• No severe droughts/ unexpected floods/ natural disasters
• Adequate funds are allocated for the same and released on time.
• There is no significant pest/ disease attack, and if so, then it will have been contained before
irreversible damage is done.
• Adverse market conditions do not persist long.
• Sound macro-economic and growth conditions continue and the benefits are widely distributed
particularly in the rural areas.
• Facilitating agencies and resource providers have the required competent staff so that timely
and appropriate technical advice and services are provided to farmers whenever required.
• The Capacity Building Plan is implemented, monitored and modified to address evolving needs
and feedback from participants.
Means of Verification of indicators
• Baseline surveys like household income ,expenditure, health and nutrition etc at the beginning,
mid-term and end of the project period
• Annual participatory assessment by communities during project period.
• Regular project monitoring reports prepared by project monitoring teams/ agencies.
• Membership and other Records, Minutes of Meetings maintained by the SHGs, WCs/
Individual beneficiaries/project-related village and local bodies/PRIs.
• External review missions
• Data maintained by Government department (Revenue, Agriculture, Groundwater, Irrigation,
Animal Husbandry
TM
PDF Editor

CHAPTER - VIII Enclosures -
a. Location –District, block, village, Watershed Location Map
b. Map of RAIPUR (PALI IWMP – XXI) Project (Watershed Boundary demarcation in
cadastral & Topo Sheet)
c. PRA Map (along with photos & paper drawing)
d. Treatment map (Indicate proposed works)
e. Cadastral Map on watershed boundary
f. Information on Soils, Soil fertility, Land capability, Soil chemical problems like
salinity, alkalinity
g. Land Use Land Cover map
h. Information on existing water harvesting structures & well inventory along with GPS
co-ordinates.
i. High resolution, latest Remote Sensing Satellite data
Documents of Agreements: Proceedings of gram Sabah for EPA approval
Proceedings of gram Sabah Resolution for committee constitution
Proceedings of gram Sabah for DPR approval
Proceeding of Standing Committee of P.S. for DPR approval.
Proceeding of Standing Committee of Z.P. for DPR approval.
Assistant Engineer, PIA
WD & SC P.S. RAIPUR
Project Manager, WCDC
WD & SC. Distt.- PALI
TM
PDF Editor


